Accurate Microarchitecture-Level Fault Modeling for ...
12
Accurate Microarchitecture-Level Fault Modeling for Studying Hardware Faults * Man-Lap Li, Pradeep Ramachandran, Ulya R. Karpuzcu, Siva Kumar Sastry Hari, Sarita V. Adve Department of Computer Science University of Illinois at Urbana-Champaign [email protected] Abstract Decreasing hardware reliability is expected to impede the exploitation of increasing integration projected by Moore’s Law. There is much ongoing research on efficient fault toler- ance mechanisms across all levels of the system stack, from the device level to the system level. High-level fault tolerance solutions, such as at the microarchitecture and system levels, are commonly evaluated using statistical fault injections with microarchitecture-level fault models. Since hardware faults actually manifest at a much lower level, it is unclear if such high level fault models are acceptably accurate. On the other hand, lower level models, such as at the gate level, may be more accurate, but their increased simulation times make it hard to track the system-level propagation of faults. Thus, an evaluation of high-level reliability solutions entails the clas- sical tradeoff between speed and accuracy. This paper seeks to quantify and alleviate this tradeoff. We make the following contributions: (1) We introduce SWAT-Sim, a novel fault injection infrastructure that uses hierarchical simulation to study the system-level manifes- tations of permanent (and transient) gate-level faults. For our experiments, SWAT-Sim incurs a small average perfor- mance overhead of under 3x, for the components we sim- ulate, when compared to pure microarchitectural simula- tions. (2) We study system-level manifestations of faults in- jected under different microarchitecture-level and gate-level fault models and identify the reasons for the inability of microarchitecture-level faults to model gate-level faults in general. (3) Based on our analysis, we derive two probabilis- tic microarchitecture-level fault models to mimic gate-level stuck-at and delay faults. Our results show that these models are, in general, inaccurate as they do not capture the complex manifestation of gate-level faults. The inaccuracies in exist- ing models and the lack of more accurate microarchitecture- level models motivate using infrastructures similar to SWAT- Sim to faithfully model the microarchitecture-level effects of gate-level faults. * This work is supported in part by the Gigascale Systems Research Cen- ter (funded under FCRP, an SRC program), the National Science Founda- tion under Grants CCF 05-41383, CCF 08-11693, and CNS 07-20743, an OpenSPARC Center of Excellence at the University of Illinois at Urbana- Champaign supported by Sun Microsystems, and an equipment donation from AMD. 1 Introduction While technology scaling facilitates extended system in- tegration, the scaled transistors are increasingly prone to fail- ures for reasons such as infant mortality, wear-out, varia- tion, etc., making them less reliable. The hardware reliability problem has, in the past, concerned only high-end niche sys- tems where solutions that involve heavy amounts of redun- dancy in terms of space, time, or information are acceptable. In the future, however, the reliability problem is expected to pervade even the mainstream computing market where tradi- tional solutions are too expensive to be applied. To counter this reliability threat, researchers have pro- posed solutions at all levels of design, from the system level all the way down to the circuit and the device level. Exam- ples include software-level symptom-based detection tech- niques such as SWAT that capture how hardware faults man- ifest to the system level [12, 22], end-to-end error detection and correction [23], microarchitecture-level (μarch-level) re- dundancy [27], and circuit-level BIST techniques [6]. To evaluate the efficacy of these solutions, it is essential to capture the expected behavior of the fault at the level at which the solution is implemented. For example, the manifestation of a gate-level floating-point (FP) unit fault needs to be accu- rately captured at the microarchitecture level to evaluate the efficacy of a proposed microarchitecture-level floating-point unit checker. This paper concerns accurate models of hard- ware faults at the microarchitecture level to evaluate fault- tolerant solutions at the microarchitecture and higher levels. Recently, several μarch-level solutions that tolerate hard- ware failures have been proposed [2, 8, 12, 14, 25, 30]. The primary evaluation mode for these proposals has been through statistical fault injections in simulations either at the gate level [8, 14, 25] or the microarchitectural state el- ements (e.g., output latch of an ALU) [2, 12, 30]. While gate-level fault injections can accurately capture lower level faults, the long simulation time of these schemes prevents detailed evaluation of the propagation of gate-level faults through the hardware and into the software. On the other hand, the μarch-level injections are fast and allow observ- ing faults propagated to the software level. However, while latch-level injections may be appropriate for array elements within the processor, it is unclear whether modeling faults in combinational logic at the latch level (e.g., injecting a fault 105 978-1-4244-2932-5/08/$25.00 ©2008 IEEE
Transcript of Accurate Microarchitecture-Level Fault Modeling for ...
Accurate Microarchitecture-Level Fault Modeling for Studying Hardware Faults ∗
Man-Lap Li, Pradeep Ramachandran, Ulya R. Karpuzcu, Siva Kumar Sastry Hari, Sarita V. AdveDepartment of Computer Science
University of Illinois at [email protected]
Abstract
Decreasing hardware reliability is expected to impede theexploitation of increasing integration projected by Moore’sLaw. There is much ongoing research on efficient fault toler-ance mechanisms across all levels of the system stack, fromthe device level to the system level. High-level fault tolerancesolutions, such as at the microarchitecture and system levels,are commonly evaluated using statistical fault injections withmicroarchitecture-level fault models. Since hardware faultsactually manifest at a much lower level, it is unclear if suchhigh level fault models are acceptably accurate. On the otherhand, lower level models, such as at the gate level, may bemore accurate, but their increased simulation times make ithard to track the system-level propagation of faults. Thus, anevaluation of high-level reliability solutions entails the clas-sical tradeoff between speed and accuracy. This paper seeksto quantify and alleviate this tradeoff.
We make the following contributions: (1) We introduceSWAT-Sim, a novel fault injection infrastructure that useshierarchical simulation to study the system-level manifes-tations of permanent (and transient) gate-level faults. Forour experiments, SWAT-Sim incurs a small average perfor-mance overhead of under 3x, for the components we sim-ulate, when compared to pure microarchitectural simula-tions. (2) We study system-level manifestations of faults in-jected under different microarchitecture-level and gate-levelfault models and identify the reasons for the inability ofmicroarchitecture-level faults to model gate-level faults ingeneral. (3) Based on our analysis, we derive two probabilis-tic microarchitecture-level fault models to mimic gate-levelstuck-at and delay faults. Our results show that these modelsare, in general, inaccurate as they do not capture the complexmanifestation of gate-level faults. The inaccuracies in exist-ing models and the lack of more accurate microarchitecture-level models motivate using infrastructures similar to SWAT-Sim to faithfully model the microarchitecture-level effects ofgate-level faults.
∗This work is supported in part by the Gigascale Systems Research Cen-ter (funded under FCRP, an SRC program), the National Science Founda-tion under Grants CCF 05-41383, CCF 08-11693, and CNS 07-20743, anOpenSPARC Center of Excellence at the University of Illinois at Urbana-Champaign supported by Sun Microsystems, and an equipment donationfrom AMD.
1 IntroductionWhile technology scaling facilitates extended system in-
tegration, the scaled transistors are increasingly prone to fail-ures for reasons such as infant mortality, wear-out, varia-tion, etc., making them less reliable. The hardware reliabilityproblem has, in the past, concerned only high-end niche sys-tems where solutions that involve heavy amounts of redun-dancy in terms of space, time, or information are acceptable.In the future, however, the reliability problem is expected topervade even the mainstream computing market where tradi-tional solutions are too expensive to be applied.
To counter this reliability threat, researchers have pro-posed solutions at all levels of design, from the system levelall the way down to the circuit and the device level. Exam-ples include software-level symptom-based detection tech-niques such as SWAT that capture how hardware faults man-ifest to the system level [12, 22], end-to-end error detectionand correction [23], microarchitecture-level (µarch-level) re-dundancy [27], and circuit-level BIST techniques [6].
To evaluate the efficacy of these solutions, it is essential tocapture the expected behavior of the fault at the level at whichthe solution is implemented. For example, the manifestationof a gate-level floating-point (FP) unit fault needs to be accu-rately captured at the microarchitecture level to evaluate theefficacy of a proposed microarchitecture-level floating-pointunit checker. This paper concerns accurate models of hard-ware faults at the microarchitecture level to evaluate fault-tolerant solutions at the microarchitecture and higher levels.
Recently, several µarch-level solutions that tolerate hard-ware failures have been proposed [2, 8, 12, 14, 25, 30].The primary evaluation mode for these proposals has beenthrough statistical fault injections in simulations either atthe gate level [8, 14, 25] or the microarchitectural state el-ements (e.g., output latch of an ALU) [2, 12, 30]. Whilegate-level fault injections can accurately capture lower levelfaults, the long simulation time of these schemes preventsdetailed evaluation of the propagation of gate-level faultsthrough the hardware and into the software. On the otherhand, the µarch-level injections are fast and allow observ-ing faults propagated to the software level. However, whilelatch-level injections may be appropriate for array elementswithin the processor, it is unclear whether modeling faults incombinational logic at the latch level (e.g., injecting a fault
105978-1-4244-2932-5/08/$25.00 ©2008 IEEE
at the output latch of the FP unit to represent a fault in thelogic), is accurate. While alternative FPGA-based emula-tions [11, 17, 21] offer higher speed and model gate-levelfaults with high fidelity, the limited observability and con-trollability gives less flexibility than software simulations.Hence, this paper focuses on software simulation methods.
The lack of speed in the gate-level fault simulationparadigm and the possible lack of fault modeling fidelityin µarch-level fault simulation prompt searching for a so-lution that can achieve the best of both worlds. To addressthis classic tradeoff between speed and accuracy, past workhas applied the paradigm of hierarchical simulation, wheredifferent parts of the system are simulated at different ab-straction levels so that required details are modeled only inthe parts of interest, thus incurring reasonable performanceoverheads [1, 5, 7, 10, 15, 18].
In the context of fault tolerance, hierarchical simulationshave been used to study transient faults in the processor byusing a hierarchy of RTL and lower-level simulators [7, 15].Since these simulators were used to study transients, they in-voke the lower-level simulator just once to capture the effectof the fault, following which simulation happens only in thehigher level. Other work has used hierarchical simulationsto generate fault dictionaries that capture the manifestationsfrom the lower level “off-line” and use them to propagatefault effects during high-level simulations [10]. This idea offault dictionaries has also been used to study gate-level stuck-at faults in small structures, such as an adder [5]. However,fault dictionaries are specific to the fault model for whichthey are generated and cannot be used to simulate arbitraryfault models (the dictionary will have to be generated off-linefor every such fault model); timing faults particularly presenta challenge. Further, for faults in arbitrarily large structures,the growing sizes of inputs and faults make the dictionariesintractable, making them hard to use.
Our focus here is on the increasingly important perma-nent and intermittent faults [4, 31] and solutions for model-ing them at the microarchitecture level or higher. In partic-ular, successful solutions must address the following threecritical aspects of fault simulation that prior work does notaddress in unison.
1. Simulation must be fast enough to capture how softwarewould be affected by hardware faults.
2. Unlike transients, where the fault effect can be capturedonce and propagated to the higher abstraction level, per-manent and intermittent faults have the characteristicthat one activation of a fault could corrupt the soft-ware execution, which influences future activations ofthe same fault. This feedback mechanism between thehardware fault and the software must be faithfully sim-ulated.
3. The simulator must be flexible enough to model differ-ent types of faults.
1.1 SWAT-Sim
To meet the stated criteria, we propose a novelfault injection infrastructure, SWAT-Sim, that couples amicroarchitecture-level simulator with a gate-level simulatorand has the following properties.
1. To achieve speed close to a microarchitectural simula-tor and minimize overhead, SWAT-Sim only simulatesthe component of interest (in our case, the faulty com-ponent) at gate-level accuracy and invokes a gate-levelsimulation of the component on-demand.
2. To accurately capture the interaction between the hard-ware fault and the software, SWAT-Sim invokes thegate-level simulation repeatedly during runtime (inter-spersed with µarch-level simulations); thus, if the soft-ware activates the gate-level fault, it would be corruptedand affects future activations of the same fault.
3. To allow fault modeling flexibility, SWAT-Sim employsa gate-level timing simulator where different timingfaults can be modeled by changing the delay informa-tion within the faulty module.
These design choices of SWAT-Sim allow studying of theimpact of gate-level permanent faults on software at speedscomparable to µarch-level simulators. Further, since the faultsimulation is performed while real-world software is execut-ing, the effect of the fault is studied using functional vectorsthat represent realistic scenarios. SWAT-Sim thus has an ad-vantage over other methods that use artificially generated testvectors (e.g., functional vectors collected from a fault-freeexecution) to study the fault effect, as test vectors may not berepresentative of real-world faulty behavior.
1.2 Contributions
• We present SWAT-Sim, a novel fault injection infras-tructure for studying system-level effects of gate-levelpermanent faults. To the best of our knowledge, SWAT-Sim is the first simulator that facilitates detailed under-standing of permanent fault propagation from the gatelevel, through the microarchitecture, to the full systemlevel, with real-world applications running on an oper-ating system. SWAT-Sim is both fast (compared to gate-level simulators) and accurate (compared to µarch-levelsimulators), with a small average overhead of 3x, for thecomponents we simulate, over µarch-level simulators.
• With SWAT-Sim, we study the system-level manifes-tations of faults injected in a Decoder, an Arithmeticand Logic Unit (ALU), and an Address GenerationUnit (AGEN) of a superscalar processor. We injectfaults under µarch-level stuck-at, gate-level stuck-at,and gate-level delay fault models, and use the previ-ously studied SWAT detection techniques to understandtheir system-level manifestation [12]. We show that, in
106
general, µarch-level stuck-at faults do not result in sim-ilar system-level fault manifestation as gate-level stuck-at or delay faults. We thus infer that more accurate mod-els are needed to model gate-level faults at the µarchlevel.
• Based on an extensive analysis of the propagation ofgate-level faults to the microarchitecture, we derive twoprobabilistic fault models, the P-model and the PD-model, for gate-level stuck-at and delay faults. Ouranalysis suggests that these models are, in general, inac-curate µarch-level models for gate-level faults becausethey fail to capture the complex manifestation of gate-level faults. However, we identify several reasons of theinaccuracies of the models that could aid deriving betterµarch-level models in the future.
Overall, this paper makes a first attempt towards under-standing the differences in system-level effects between theµarch-level stuck-at fault models and gate-level stuck-at anddelay fault models. Our extensive analysis and modelingshowed that it is highly complex to capture the several factorsthat should be used for deriving µarch models that accuratelyrepresent the behavior of gate-level faults. Therefore, un-til there are further breakthroughs in µarch-level fault mod-els, we believe that gate-level simulations are necessary tocapture the behavior of gate-level faults. Hence, fast simu-lation methods, such as the proposed hierarchical simulator,SWAT-Sim, are essential for studying system-level effects ofhardware faults.
2 The SWAT-Sim InfrastructureSWAT-Sim is fundamentally a µarch-level simulator that
only simulates the faulty µarch-level blocks, such as a faultyALU or decoder, at the gate level. This greatly minimizes thegate-level simulation overhead.
2.1 Interfacing the Simulators
SWAT-Sim couples a full-system µarch-level and a gate-level simulator. A gate-level Verilog module of the faultyunit is simulated only when the unit is utilized by the µarch-level simulator. The inputs to the µarch-level unit are passedas stimuli to the gate-level simulator. When the gate-levelsimulation completes, the results are passed back to theµarch-level simulator, which then continues execution.
This communication between the two simulators isachieved using UNIX named pipes. In the µarch-level sim-ulation, each time an instruction utilizing the faulty unit isencountered, the stimuli needed by the gate-level module arewritten to a dedicated stimuli pipe. After the gate-level simu-lation completes, the computed data is written to a dedicatedresponse pipe from where the µarch-level simulator can readthe response.
While the µarch-level simulator can access the namedpipes like files, the gate-level simulator is enhanced with twosystem tasks, implemented using the Verilog Procedural In-terface (VPI) [9], that handle accesses to/from the pipes: One
collects signals from the stimuli pipe and the other writes theresults to the response pipe. The stimuli and response (argu-ments of the two tasks) are tailored to the µarch-level struc-tures under fault injection.
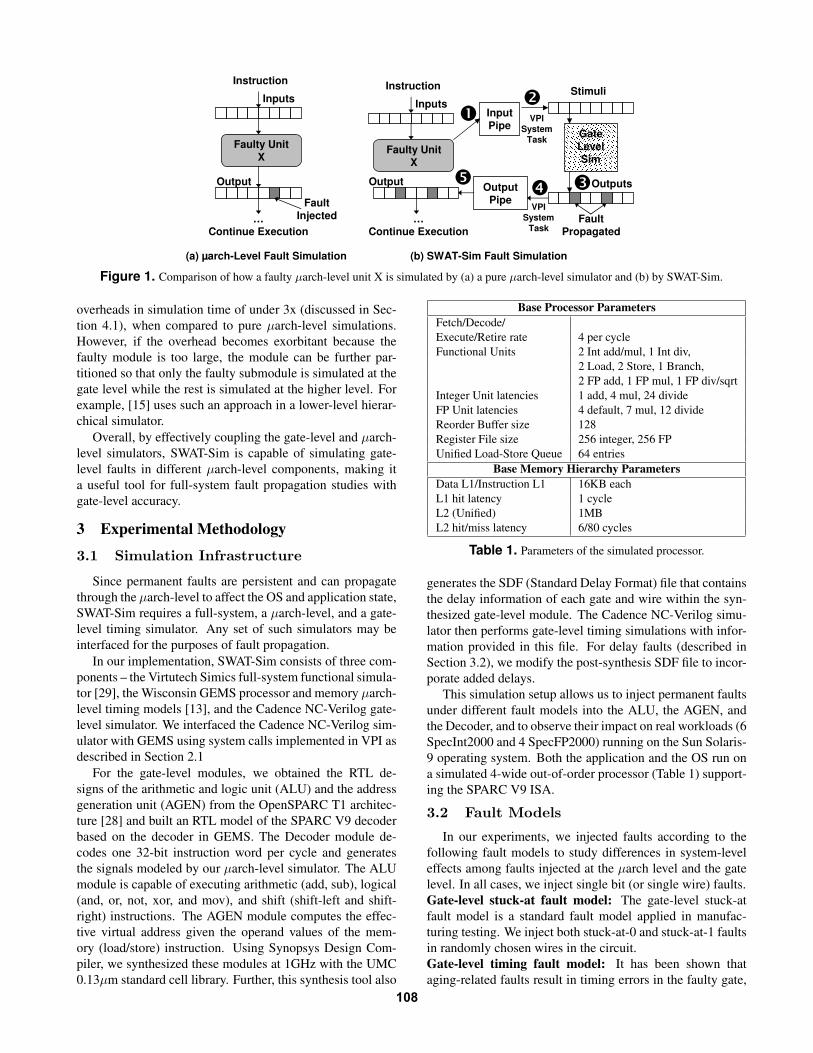
Figure 1 compares how a single fault in a µarch-levelstructure X is simulated in a purely µarch-level simulator(Figure 1(a)) and in SWAT-Sim (Figure 1(b)).
In Figure 1(a), a single fault in X is modeled as a single-bit corruption at the output latch of X because the µarch-levelsimulator lacks the gate-level details of X.
On the other hand, at the gate-level, a single fault in Xis modeled as a fault in a specific gate or net. Figure 1(b)shows the steps of how the SWAT-Sim hierarchical simula-tor simulates the effect of this fault. (1) An instruction inthe µarch-level simulator uses X. SWAT-Sim collects the rel-evant input vectors and sends them to the stimuli pipe. (2)The Verilog system task reads from the input pipe and sendsthe stimuli to the gate-level simulator. (3) The gate-level sim-ulator feeds the stimuli to the faulty module and obtains theoutput after gate-level simulation. (4) The Verilog systemtask transfers the result from the gate-level simulator to theresponse pipe. (5) The µarch-level simulator reads the resultfrom the response pipe and continues simulation. In partic-ular, the figure shows the effect of a single gate-level faultpropagating into a multiple-bit corruption at the output latch.In contrast, the fault injected in pure µarch-level simulationonly results in a single-bit corruption (Figure 1(a)).
2.2 Different µarch-level Structures
Given the wide variety of structures within a modern pro-cessor and the differences in the abstraction levels betweena typical µarch-level simulator and its corresponding gate-level counterpart, several factors should be considered whenperforming such hierarchical simulations.Simulating sequential logic: Simulating combinationallogic with single- or multi-cycle latency in SWAT-Sim isstraightforward. As long as the outputs are read after thestipulated latency, the outputs are guaranteed to be correctfor each invocation. Sequential logic, however, requires stateto be maintained across invocations. In SWAT-Sim, since thegate-level simulator is invoked (and thus clocked) only whenthe unit is utilized, state is maintained across multiple invoca-tions, resulting in accurate simulation of sequential circuits.Handling gate-level signals that are not modeled at theµarch level: In some cases, due to abstract modeling in theµarch simulators, not all signals modeled at the gate-levelappear at the µarch level. If the faulty component containssuch signals, the µarch-level simulator can be enhanced withthose signals to help propagate faults in these paths, improv-ing its accuracy. Even in the absence of these enhancements,SWAT-Sim would present a more accurate fault model thanexisting µarch-level fault models.Simulating large µarch-level components that may resultin large overheads: Since the primary aim of SWAT-Simis being able to study the propagation of gate-level faults tothe system level, simulations must be carried out at reason-able speeds. The components we study in the paper present
107
Instruction
Faulty UnitX
Inputs
Output
…Continue Execution
FaultInjected
(a) µarch-Level Fault Simulation
�
Instruction
Faulty UnitX
Inputs
(b) SWAT-Sim Fault Simulation
…Continue Execution
InputPipe
OutputPipe
GateLevelSim
��
��
VPISystem
Task
Stimuli
Outputs
FaultPropagated
Output
VPISystem
Task
Figure 1. Comparison of how a faulty µarch-level unit X is simulated by (a) a pure µarch-level simulator and (b) by SWAT-Sim.
overheads in simulation time of under 3x (discussed in Sec-tion 4.1), when compared to pure µarch-level simulations.However, if the overhead becomes exorbitant because thefaulty module is too large, the module can be further par-titioned so that only the faulty submodule is simulated at thegate level while the rest is simulated at the higher level. Forexample, [15] uses such an approach in a lower-level hierar-chical simulator.
Overall, by effectively coupling the gate-level and µarch-level simulators, SWAT-Sim is capable of simulating gate-level faults in different µarch-level components, making ita useful tool for full-system fault propagation studies withgate-level accuracy.
3 Experimental Methodology3.1 Simulation Infrastructure
Since permanent faults are persistent and can propagatethrough the µarch-level to affect the OS and application state,SWAT-Sim requires a full-system, a µarch-level, and a gate-level timing simulator. Any set of such simulators may beinterfaced for the purposes of fault propagation.
In our implementation, SWAT-Sim consists of three com-ponents – the Virtutech Simics full-system functional simula-tor [29], the Wisconsin GEMS processor and memory µarch-level timing models [13], and the Cadence NC-Verilog gate-level simulator. We interfaced the Cadence NC-Verilog sim-ulator with GEMS using system calls implemented in VPI asdescribed in Section 2.1
For the gate-level modules, we obtained the RTL de-signs of the arithmetic and logic unit (ALU) and the addressgeneration unit (AGEN) from the OpenSPARC T1 architec-ture [28] and built an RTL model of the SPARC V9 decoderbased on the decoder in GEMS. The Decoder module de-codes one 32-bit instruction word per cycle and generatesthe signals modeled by our µarch-level simulator. The ALUmodule is capable of executing arithmetic (add, sub), logical(and, or, not, xor, and mov), and shift (shift-left and shift-right) instructions. The AGEN module computes the effec-tive virtual address given the operand values of the mem-ory (load/store) instruction. Using Synopsys Design Com-piler, we synthesized these modules at 1GHz with the UMC0.13µm standard cell library. Further, this synthesis tool also
Base Processor ParametersFetch/Decode/Execute/Retire rate 4 per cycleFunctional Units 2 Int add/mul, 1 Int div,
2 Load, 2 Store, 1 Branch,2 FP add, 1 FP mul, 1 FP div/sqrt
Integer Unit latencies 1 add, 4 mul, 24 divideFP Unit latencies 4 default, 7 mul, 12 divideReorder Buffer size 128Register File size 256 integer, 256 FPUnified Load-Store Queue 64 entries
Base Memory Hierarchy ParametersData L1/Instruction L1 16KB eachL1 hit latency 1 cycleL2 (Unified) 1MBL2 hit/miss latency 6/80 cycles
Table 1. Parameters of the simulated processor.
generates the SDF (Standard Delay Format) file that containsthe delay information of each gate and wire within the syn-thesized gate-level module. The Cadence NC-Verilog simu-lator then performs gate-level timing simulations with infor-mation provided in this file. For delay faults (described inSection 3.2), we modify the post-synthesis SDF file to incor-porate added delays.
This simulation setup allows us to inject permanent faultsunder different fault models into the ALU, the AGEN, andthe Decoder, and to observe their impact on real workloads (6SpecInt2000 and 4 SpecFP2000) running on the Sun Solaris-9 operating system. Both the application and the OS run ona simulated 4-wide out-of-order processor (Table 1) support-ing the SPARC V9 ISA.
3.2 Fault Models
In our experiments, we injected faults according to thefollowing fault models to study differences in system-leveleffects among faults injected at the µarch level and the gatelevel. In all cases, we inject single bit (or single wire) faults.Gate-level stuck-at fault model: The gate-level stuck-atfault model is a standard fault model applied in manufac-turing testing. We inject both stuck-at-0 and stuck-at-1 faultsin randomly chosen wires in the circuit.Gate-level timing fault model: It has been shown thataging-related faults result in timing errors in the faulty gate,
108
with increasing delay as the aging worsens [3]. Ideally, wewould like to model this effect using transition fault modelsand path delay faults, with different amount of delays. Here,we experiment with two delay fault models: (1) We injecta one-clock-cycle delay into the faulty gate such that timingviolations occur along all paths containing the gate when atransition occurs. (2) The faulty gate is injected with a half-clock-cycle delay, potentially causing a subset of the gate’soutput cone to violate timing.Microarchitecture-level stuck-at fault model: Due to theabsence of more accurate fault models, stuck-at faults at theinput/output latch of a faulty µarch-level unit have been usedto estimate the effect of gate-level faults (both stuck-at andtiming-related faults). We adopt this fault model, injectingboth stuck-at-0 and stuck-at-1 faults in the input of the De-coder and the output latch of the ALU or AGEN.
3.3 Studying System-Level Effects
A key objective of this study is to understand the differ-ences, if any, in system-level manifestations of µarch-leveland gate-level faults within µarch-level structures. For thispurpose, we use the SWAT symptom-based detection schemebecause these detectors essentially capture how hardwarefaults manifest into the system level and software [12].
We inject faults using the fault models described in Sec-tion 3.2 and rely on SWAT-Sim’s full-system µarch-levelsimulator to propagate the fault effect to the software for theSWAT detectors to detect. Specifically, we use the followingSWAT detectors – (1) FatalTraps, such as memory addressmisalignment, illegal instruction, etc., denoting an abnormalsoftware execution, (2) Hangs of the application and the OS,identified using a hardware hang detector, and (3) HighOS,representing abnormal executions that have excessive con-tiguous OS instructions (30,000 contiguous instructions forour experiments) [12]. Following the methodology used in[12], we consider faults detected within 10 million instruc-tions (after corruption of some architectural state) to be re-coverable (e.g., using pure hardware [19, 26], or hybrid hard-ware/software recovery schemes). Therefore, for each faultinjection run, SWAT-Sim performs a detailed timing simula-tion (both µarch and gate-level) for 10 million instructionsafter the first architectural state corruption.1 If there is noarchitectural state corruption for 10 million instructions afterthe fault injection, the fault is assumed to be masked and thesimulation is terminated.
Thus, at the end of the above 10 million instruction win-dow, a fault results in one of the following outcomes: (1)µarch-Mask: the µarch-level state (output latches of ALU,AGEN, and Decoder) is never affected. (2) Arch-Mask: thearchitectural state is not corrupted. (3) Detected: a detec-tion occurs. (4) Unknown: the fault is neither detected normasked at the µarch and architecture level.
The faulty cases that result in unknown are then simulatedin functional mode and can have one of three outcomes: (1)Application-level masking: even though the fault corrupts the
1Architectural state corruptions are determined by continuously compar-ing against a golden fault-free run (see [12]).
architectural state, the application output remains correct. (2)Detected>10M: the fault is detected later in the execution,but is deemed not recoverable. (3) Silent data corruption(SDC): the fault remains undetected and corrupts the appli-cation output.
Given the injection outcomes, we study the differencesbetween the various fault models using two metrics, coverageand detection latency, as follows.Coverage: We define coverage as the percentage of un-masked faults that are detected within 10 million instructionsand calculated as Total Detected
Injected − Masked × 100, where µarch-Mask, Arch-Mask, and App-Mask constitute masked injec-tions.Detection Latency: The latency of detection determines therecoverability of the fault. Faults with shorter detection la-tencies can be fully recovered using hardware techniques(e.g., [19, 26]) with little hardware buffering to handle in-put/output commit problems. On the other hand, while thememory state corrupted by faults with longer detection la-tencies can be recovered using hardware techniques, the sup-port for handling the input/output commit problems wouldbe more complex and may require software involvement.We measure the latency of detection from the instruction atwhich the architectural state (of either the application or theOS) is corrupted until the detection.
3.4 Parameters of the Fault Injection
Our fault injection campaign consists of several runs foreach of our 10 applications, with 1 fault injected per run. Foreach combination of fault model (Section 3.2), faulty struc-ture, and application, we inject a fault in one of 4 differentrandomly chosen points in the application and one of 50 dif-ferent points in the faulty unit. For the gate-level stuck-atand delay fault models, the 50 points in a structure are cho-sen from the 1853, 2641, and 757 wires of the synthesizedgate-level representation of the Decoder, ALU, and AGENrespectively. For the µarch-level faults, these points are ran-domly chosen from the 32 bits of the input latch of the De-coder and from the 64 bits of the output latches of the ALUand AGEN. Further, since there are multiple decoders, ALUsand AGEN units in our superscalar processor, one of themis chosen randomly for each injection. We also ensure thatthe samples are chosen so that gate-level stuck-at and delayfaults are injected in the same set of wires to facilitate a faircomparison among the gate-level faults.
This gives us a total of 2000 simulations per fault modelper structure (4× 10× 50). Each injection run whose fault isnot masked is a Bernoulli trial for coverage (either detectedor not). Further, since the injection experiments are inde-pendent of each other, this gives us a low maximum error of1.1% for the reported coverage numbers, at a 95% confidenceinterval.
3.5 Limitations of the Evaluation
Here, we list some of the assumptions and limitations ofour evaluation.
109
• SWAT-Sim assumes that a Verilog description of themodule of interest is readily available for interfacing.This is true for the large fraction of the processor thatis typically re-used from older tape-outs. However, formodules that are yet to be developed, neither SWAT-Sim nor pure gate-level simulators can be used to per-form fault injection experiments. As these models startto become available, SWAT-Sim can be incrementallyinterfaced with them.
• Using SWAT-Sim, we study the propagation of gate-level faults in only three microarchitecture units (De-coder, ALU, and AGEN) as we could not find otherVerilog modules close enough to the SPARC architec-ture modeled by the µarch-level simulator (we used thein-order UltraSPARC T1 as our Verilog source and theout-of-order GEMS as our µarch-level source).
• The timing information generated in the SDF file rep-resents pre-layout timing, which does not reflect accu-rate post-layout timing for both gate delays and inter-connect. By extracting this information using a place-and-route tool, the accuracy of our timing simulations,and thus our results, can be further improved.
• Although prior work has suggested other statistical de-lay models for timing faults (e.g., based on thresholdvoltage and temperature [16, 24]), we inject fixed andarbitrarily chosen delay that may or may not representreal-world failure modes. Integrating more accuratelower-level timing fault models in SWAT-Sim is a sub-ject of our future work.
In spite of these assumptions and limitations, the resultspresented in this paper demonstrate the importance of us-ing hierarchical simulators, such as SWAT-Sim, to accuratelymodel gate-level faults at the µarch level.
4 ResultsThe hierarchical nature of SWAT-Sim allows us to achieve
gate-level accuracy in fault modeling, at speeds compara-ble with µarch-level simulators. We first summarize SWAT-Sim’s performance when compared to both the µarch-levelsimulation and pure gate-level simulation (Section 4.1). Wethen use the SWAT-Sim simulator to first evaluate the accu-racy of the previously used µarch-level stuck-at fault mod-els for representing gate-level faults (Section 4.2). Subse-quently, we extensively analyze the reasons for the differ-ences in the manifestations of gate-level faults from µarch-level faults (Section 4.3). From this detailed analysis, we de-rive two candidate probabilistic µarch level fault models formodeling gate-level stuck-at and delay faults (Section 4.4).
4.1 Performance Overhead of SWAT-Sim
To understand the performance overhead incurred bySWAT-Sim when compared with pure µarch-level simula-tion, we profile a set of 40 fault-free runs for each structure
Unit Fault Model Max Avg
ALU Gate Stuck-At 2.20 1.56Gate Delay 2.65 1.93
AGEN Gate Stuck-At 1.59 1.26Gate Delay 1.89 1.35
Decoder Gate Stuck-At 2.91 2.12Gate Delay 5.10 2.91
Table 2. Slowdowns of SWAT-Sim when compared to pureµarch-level simulation.
and each fault model. We do not inject a fault in the de-sired faulty unit, but force the unit to be simulated at the gatelevel. To be conservative, we always use the most utilizedunit for this purpose (e.g., ALU 0 for faulty ALU). For delayfaults, we simulate the chosen unit with SDF timing annota-tion. Table 2 shows the maximum and average slowdowns ofSWAT-Sim compared to pure µarch-level simulation, whensimulating the ALU, the AGEN, and the Decoder across dif-ferent fault models.
Overall, the worst average-case slowdown of SWAT-Sim,compared to the µarch-level simulation, is under 3x, whichis an acceptable overhead considering SWAT-Sim’s ability tomodel gate-level faults. In particular, Table 2 shows that theDecoder incurs the most overhead, with average slowdownsof gate-level stuck-at and delay faults being 2.12x and 2.91xrespectively. The average slowdowns of the ALU and theAGEN are under 2x. The maximum slowdowns observed forthe ALU and the AGEN are under 2.7x and 2x, respectivelywhile the overall maximum slowdown of 5.1x is measuredfor the Decoder. The Decoder incurs higher overhead thanother units because it sits at the processor front-end and ismore utilized than the ALU and the AGEN.
As expected, the delay fault simulations always incurhigher overhead than the stuck-at fault simulations becausesimulating delay faults requires timing information which ismore compute-intensive.
Since we do not have the corresponding gate-level modelof the superscalar processor we simulate at the µarch level,we cannot directly determine the performance benefit ofSWAT-Sim over pure gate-level simulation. Instead, we de-rive a rough conservative estimation of the performance ben-efit as follows. Assume (conservatively) that we need tosimulate a fault in a circuit that contains 4 times the num-ber of gates and is utilized twice as often as the Decoder.Assume that the full superscalar processor we wish to sim-ulate has 25 million gates. Assuming SWAT-Sim’s worst-case slowdown is linear to the utilization and the size of thegate-level module and the baseline µarch simulator simulatesat the rate of 17k instr/sec (which is the measured averagespeed of our µarch-level simulator), it would take SWAT-Sim 10M instr × 4×2×5.1
17k instr/sec = 6.7 hr to simulate 10million instructions in the worst case. On the other hand,conservatively assuming the gate-level simulator simulates25M gates-cycles/sec (more than 1300x the speed reportedin [20]) and the execution has an IPC of 1, it would take10M instr × 25M gates
1 instr/cycle×25M gates−cycles/sec = 2778 hr
to simulate 10 million instructions. SWAT-Sim thus achieves110
0%10%20%30%40%50%60%70%80%90%
100%
Gat
e s@
0G
ate
s@1
Dela
y 1c
ycDe
lay
0.5c
yc
µarc
h s@
0µa
rch
s@1
Gat
e s@
0G
ate
s@1
Dela
y 1c
ycDe
lay
0.5c
yc
µarc
h s@
0µa
rch
s@1
Gat
e s@
0G
ate
s@1
Dela
y 1c
ycDe
lay
0.5c
yc
µarc
h s@
0µa
rch
s@1
INT ALU AGEN Decoder
Perc
enta
ge o
f Inj
ecte
d Fa
ults
µarch-Mask Arch-Mask App-MaskDetected Detected>10M SDC
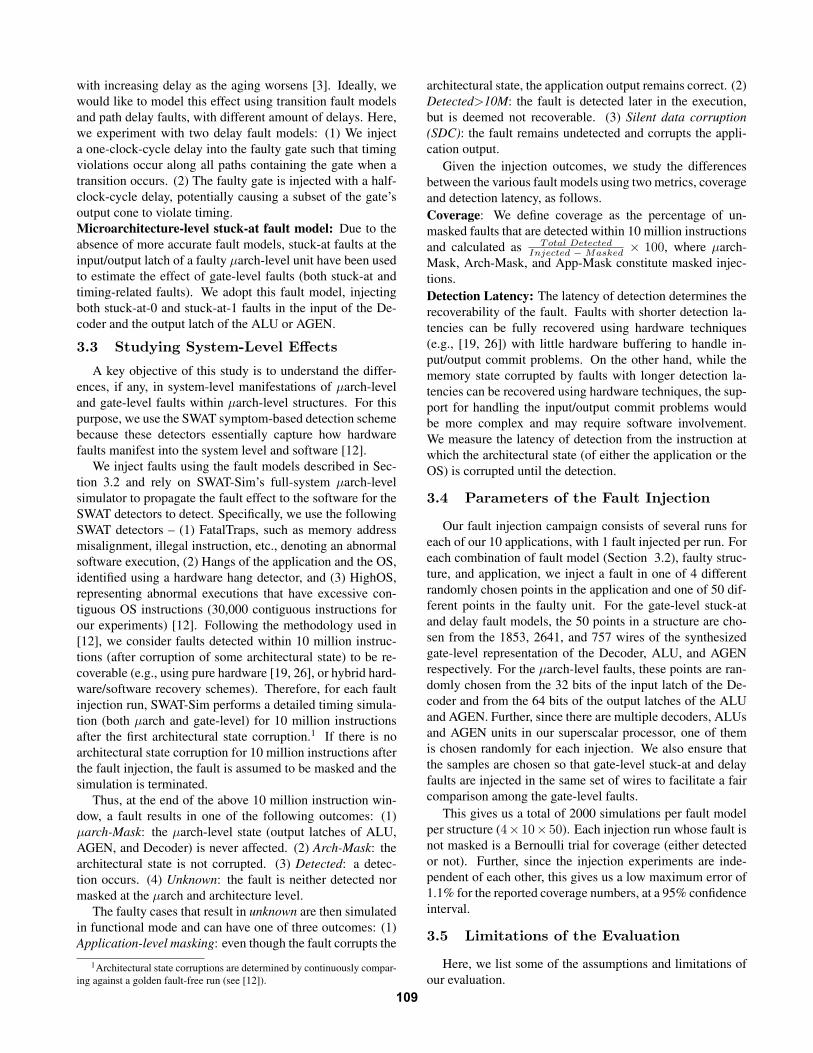
94 94 89 85 99 100 96 95 95 90 94 97 96 98 95 95 100 100
Figure 2. Efficacy of the SWAT fault detectionscheme [12] under different fault models for the ALU,AGEN, and Decoder. Depending on the fault model and thestructure, the µarch-level fault may or may not capture thesystem-level effects of gate-level faults accurately, as indi-cated by the differences in coverage.
a 417x speedup over traditional gate-level simulation.
4.2 Accuracy of Microarchitecture-LevelFault Models
We next investigate the accuracy of µarch-level fault mod-els. If these fault models were accurate enough, then we caneliminate gate-level simulations entirely, thus eliminating theneed for SWAT-Sim and its overhead.
4.2.1 Comparison of CoverageFigure 2 compares the efficacy of the SWAT scheme in de-tecting different faults injected using different fault modelsinto the ALU, the AGEN, and the Decoder. The bars repre-sent the outcomes for the µarch-level stuck-at-1 (µarch s@1)and stuck-at-0 (µarch s@0) models, the gate-level stuck-at-1 and stuck-at-0 models (Gate s@1 and Gate s@0, re-spectively), and the gate-level 1-cycle-delay and 0.5-cycle-delay models (Delay 1cyc and Delay 0.5cyc, respectively).Each bar shows the fraction of fault injections that aremicroarchitecturally masked (µarch-Mask), architecturallymasked (Arch-Mask), application-masked (App-Mask), de-tected within 10M instructions (Detected), detected beyond10M instructions (i.e., not recoverable) (Detected >10M),and those that lead to silent data corruptions (SDC). Thenumber on top of each bar represents the coverage.
Figure 2 shows that depending on the structure and thefault model, the µarch-level fault model may or may not ac-curately capture the effect of gate-level faults, as indicated bythe coverage. For the AGEN, the coverage of µarch stuck-atfaults is similar to that of the gate-level stuck-at and 1-cycledelay fault models (between 94% and 97%). However, thecoverage of 0.5-cycle delay AGEN faults is noticeably lower(90%). For the Decoder and the ALU, the coverage for theµarch-level stuck-at faults is near perfect (99+%) while thecoverage of the gate-level stuck-at faults (94% for the ALUand between 96% and 98% for the Decoder) and the Decoder
delay faults (95%) is slightly more pessimistic. In contrast,the coverage of the ALU delay faults is significantly lower(89% and 85% for 1-cycle and 0.5-cycle delay faults, respec-tively).2
The following analyzes the faults that do not result in de-tection in more detail.
Masking: A large source of discrepancy among the dif-ferent fault models lies in the masking rate (µarch-level, ar-chitectural, and application masking). The µarch-level stuck-at fault models have very little masking of all three kinds(on an average, 0.3% for the Decoder, 2% for the ALU, andunder 9% for the AGEN), while the gate-level fault modelsshow a much higher rate of masking (>30% for all struc-tures, with 0.5-cycle delay faults in the AGEN having thehighest masking rate of 54%).
The masking rates of µarch-level faults are low mainlybecause the faults are rarely µarch-masked when comparedto gate-level faults. As µarch-level faults directly change thelatch data, the only case where it does not result in a µarchcorruption (i.e., is µarch-masked) is when the data does notactivate the latch fault, e.g., correct data value of 0 masksa stuck-at-0 fault. At the gate level, there are two scenarios:(1) the fault at the gate is not activated, and (2) the fault is ac-tivated but does not propagate due to other signals in the cir-cuit. Thus, the gate-level faults see much higher µarch mask-ing rates. Further, the µarch-level faults are hardly maskedat the application and architecture levels since the they tendto perturb the data more severely and cause symptoms moreeasily than the gate-level faults.
Interestingly, gate-level faults injected into the 3 struc-tures exhibit different masking behaviors. All structures havehigh µarch-level masking. However, architectural masking issignificant only for the Decoder (25% to 31%) and applica-tion masking is substantial only for the ALU (35% to 42%).
Decoder faults are more likely to be masked at the archi-tecture level than other structures. For these cases, we ob-serve that the faults affect a subset of instructions of typesthat are sparingly used and corrupt only wrong-path instruc-tions. Thus, even though the gate-level faults become mi-croarchitecturally visible, they are not activated again afterthe pipeline flush and thus the fault becomes architecturallymasked. For the ALU and AGEN, however, we see relativelyfew faults that get activated only by speculative instructions.
On the other hand, a significant number of ALU faults aremasked by the application. This is likely due to the activatedfaults being logically masked. For example, suppose instruc-tion r1 ← r2 + r3 uses the faulty ALU and the fault causesr1 to change from 1 to 2. If r1 is only used for the branchinstruction beq r1, 0, L, the fault effect is masked by the ap-plication. This type of masking is relatively rare in otherstructures. Since it is more likely for Decoder faults to affectthe program control flow and for AGEN faults to change theaddresses of memory accesses, these faults, once activated,
2We found the coverage with SWAT-Sim improves significantly (from89% to 94% for 0.5-cycle delay faults in ALU) when the undetected casesare run for 50M instructions, showing that SWAT’s detectors remain effec-tive at this longer latency (which is still recoverable [19]).
111
0%10%20%30%40%50%60%70%80%90%
100%
Gat
e s@
0G
ate
s@1
Dela
y 1c
ycDe
lay
0.5c
yc
µarc
h s@
0µa
rch
s@1
Gat
e s@
0G
ate
s@1
Dela
y 1c
ycDe
lay
0.5c
yc
µarc
h s@
0µa
rch
s@1
Gat
e s@
0G
ate
s@1
Dela
y 1c
ycDe
lay
0.5c
yc
µarc
h s@
0µa
rch
s@1
ALU AGEN Decoder
Perc
enta
ge o
f Det
ecte
d Fa
ults
<10M<1M<100k<10k<1k
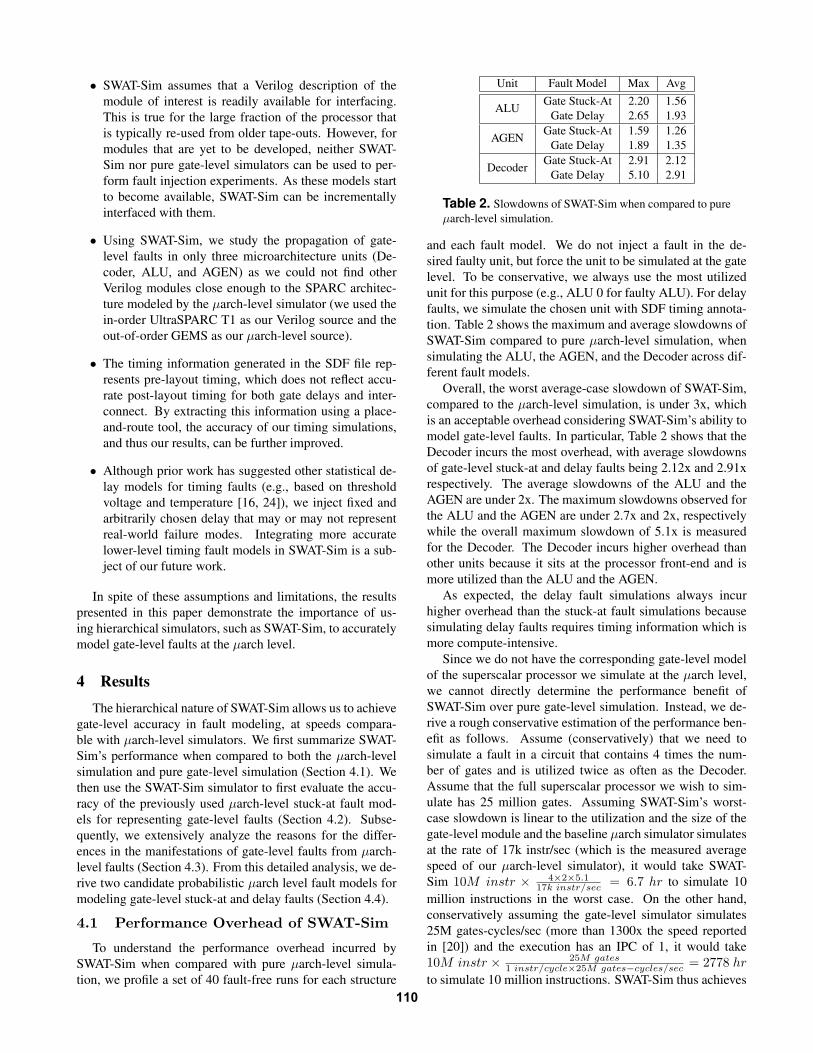
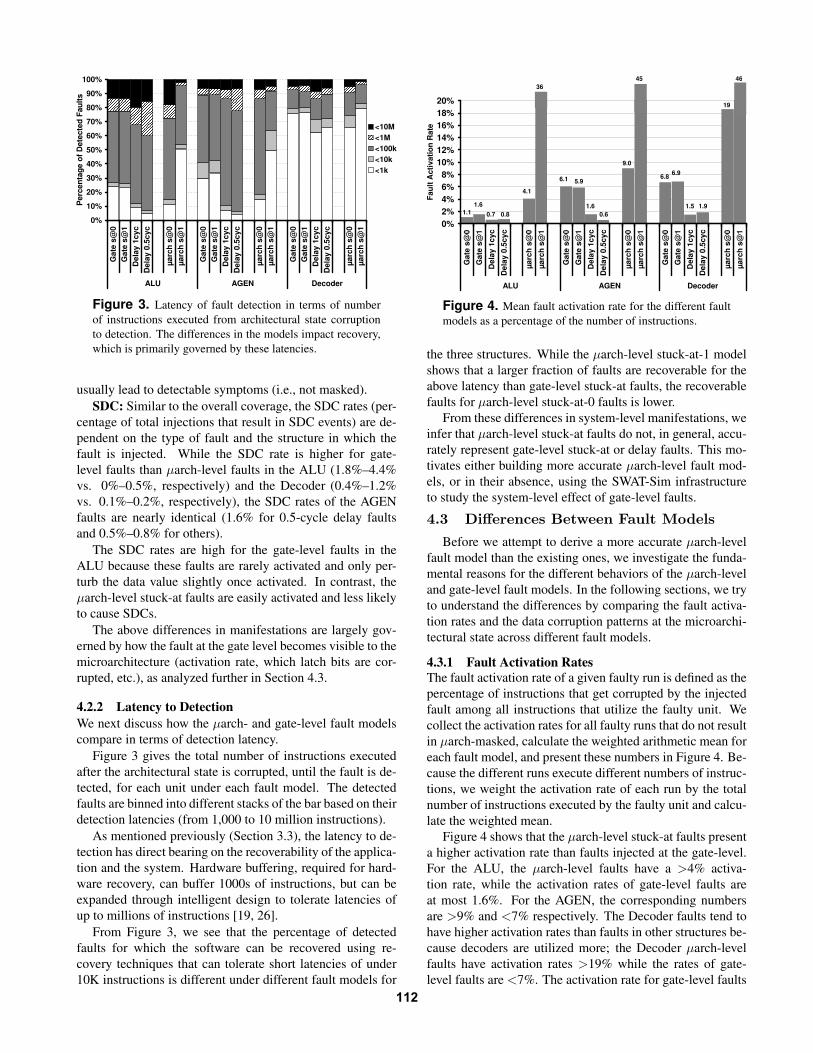
Figure 3. Latency of fault detection in terms of numberof instructions executed from architectural state corruptionto detection. The differences in the models impact recovery,which is primarily governed by these latencies.
usually lead to detectable symptoms (i.e., not masked).SDC: Similar to the overall coverage, the SDC rates (per-
centage of total injections that result in SDC events) are de-pendent on the type of fault and the structure in which thefault is injected. While the SDC rate is higher for gate-level faults than µarch-level faults in the ALU (1.8%–4.4%vs. 0%–0.5%, respectively) and the Decoder (0.4%–1.2%vs. 0.1%–0.2%, respectively), the SDC rates of the AGENfaults are nearly identical (1.6% for 0.5-cycle delay faultsand 0.5%–0.8% for others).
The SDC rates are high for the gate-level faults in theALU because these faults are rarely activated and only per-turb the data value slightly once activated. In contrast, theµarch-level stuck-at faults are easily activated and less likelyto cause SDCs.
The above differences in manifestations are largely gov-erned by how the fault at the gate level becomes visible to themicroarchitecture (activation rate, which latch bits are cor-rupted, etc.), as analyzed further in Section 4.3.
4.2.2 Latency to DetectionWe next discuss how the µarch- and gate-level fault modelscompare in terms of detection latency.
Figure 3 gives the total number of instructions executedafter the architectural state is corrupted, until the fault is de-tected, for each unit under each fault model. The detectedfaults are binned into different stacks of the bar based on theirdetection latencies (from 1,000 to 10 million instructions).
As mentioned previously (Section 3.3), the latency to de-tection has direct bearing on the recoverability of the applica-tion and the system. Hardware buffering, required for hard-ware recovery, can buffer 1000s of instructions, but can beexpanded through intelligent design to tolerate latencies ofup to millions of instructions [19, 26].
From Figure 3, we see that the percentage of detectedfaults for which the software can be recovered using re-covery techniques that can tolerate short latencies of under10K instructions is different under different fault models for
0%2%4%6%8%
10%12%14%16%18%20%
Gat
e s@
0G
ate
s@1
Dela
y 1c
ycDe
lay
0.5c
yc
µarc
h s@
0µa
rch
s@1
Gat
e s@
0G
ate
s@1
Dela
y 1c
ycDe
lay
0.5c
yc
µarc
h s@
0µa
rch
s@1
Gat
e s@
0G
ate
s@1
Dela
y 1c
ycDe
lay
0.5c
yc
µarc
h s@
0µa
rch
s@1
ALU AGEN Decoder
Faul
t Act
ivat
ion
Rate
1.11.6
0.7
4.1
36
6.1 5.9
1.6
9.0
45
6.8 6.9
1.5
19
46
0.8 0.61.9
Figure 4. Mean fault activation rate for the different faultmodels as a percentage of the number of instructions.
the three structures. While the µarch-level stuck-at-1 modelshows that a larger fraction of faults are recoverable for theabove latency than gate-level stuck-at faults, the recoverablefaults for µarch-level stuck-at-0 faults is lower.
From these differences in system-level manifestations, weinfer that µarch-level stuck-at faults do not, in general, accu-rately represent gate-level stuck-at or delay faults. This mo-tivates either building more accurate µarch-level fault mod-els, or in their absence, using the SWAT-Sim infrastructureto study the system-level effect of gate-level faults.4.3 Differences Between Fault Models
Before we attempt to derive a more accurate µarch-levelfault model than the existing ones, we investigate the funda-mental reasons for the different behaviors of the µarch-leveland gate-level fault models. In the following sections, we tryto understand the differences by comparing the fault activa-tion rates and the data corruption patterns at the microarchi-tectural state across different fault models.
4.3.1 Fault Activation RatesThe fault activation rate of a given faulty run is defined as thepercentage of instructions that get corrupted by the injectedfault among all instructions that utilize the faulty unit. Wecollect the activation rates for all faulty runs that do not resultin µarch-masked, calculate the weighted arithmetic mean foreach fault model, and present these numbers in Figure 4. Be-cause the different runs execute different numbers of instruc-tions, we weight the activation rate of each run by the totalnumber of instructions executed by the faulty unit and calcu-late the weighted mean.
Figure 4 shows that the µarch-level stuck-at faults presenta higher activation rate than faults injected at the gate-level.For the ALU, the µarch-level faults have a >4% activa-tion rate, while the activation rates of gate-level faults areat most 1.6%. For the AGEN, the corresponding numbersare >9% and <7% respectively. The Decoder faults tend tohave higher activation rates than faults in other structures be-cause decoders are utilized more; the Decoder µarch-levelfaults have activation rates >19% while the rates of gate-level faults are <7%. The activation rate for gate-level faults
112
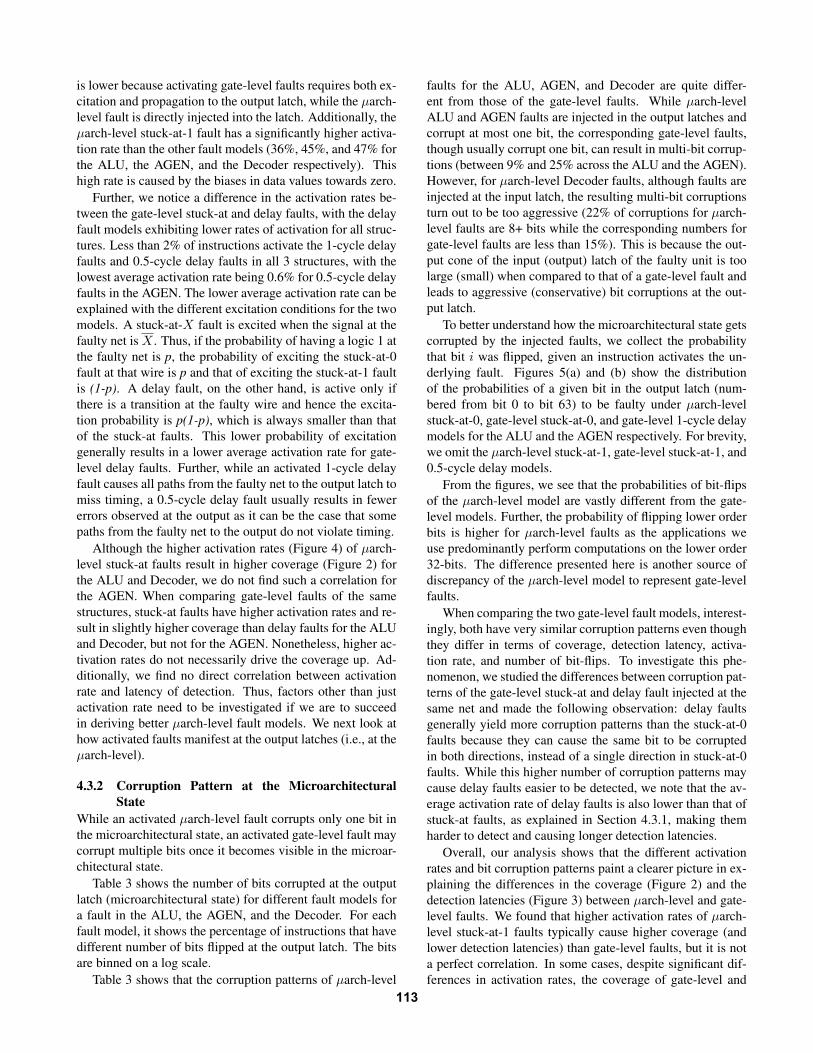
is lower because activating gate-level faults requires both ex-citation and propagation to the output latch, while the µarch-level fault is directly injected into the latch. Additionally, theµarch-level stuck-at-1 fault has a significantly higher activa-tion rate than the other fault models (36%, 45%, and 47% forthe ALU, the AGEN, and the Decoder respectively). Thishigh rate is caused by the biases in data values towards zero.
Further, we notice a difference in the activation rates be-tween the gate-level stuck-at and delay faults, with the delayfault models exhibiting lower rates of activation for all struc-tures. Less than 2% of instructions activate the 1-cycle delayfaults and 0.5-cycle delay faults in all 3 structures, with thelowest average activation rate being 0.6% for 0.5-cycle delayfaults in the AGEN. The lower average activation rate can beexplained with the different excitation conditions for the twomodels. A stuck-at-X fault is excited when the signal at thefaulty net is X . Thus, if the probability of having a logic 1 atthe faulty net is p, the probability of exciting the stuck-at-0fault at that wire is p and that of exciting the stuck-at-1 faultis (1-p). A delay fault, on the other hand, is active only ifthere is a transition at the faulty wire and hence the excita-tion probability is p(1-p), which is always smaller than thatof the stuck-at faults. This lower probability of excitationgenerally results in a lower average activation rate for gate-level delay faults. Further, while an activated 1-cycle delayfault causes all paths from the faulty net to the output latch tomiss timing, a 0.5-cycle delay fault usually results in fewererrors observed at the output as it can be the case that somepaths from the faulty net to the output do not violate timing.
Although the higher activation rates (Figure 4) of µarch-level stuck-at faults result in higher coverage (Figure 2) forthe ALU and Decoder, we do not find such a correlation forthe AGEN. When comparing gate-level faults of the samestructures, stuck-at faults have higher activation rates and re-sult in slightly higher coverage than delay faults for the ALUand Decoder, but not for the AGEN. Nonetheless, higher ac-tivation rates do not necessarily drive the coverage up. Ad-ditionally, we find no direct correlation between activationrate and latency of detection. Thus, factors other than justactivation rate need to be investigated if we are to succeedin deriving better µarch-level fault models. We next look athow activated faults manifest at the output latches (i.e., at theµarch-level).
4.3.2 Corruption Pattern at the MicroarchitecturalState
While an activated µarch-level fault corrupts only one bit inthe microarchitectural state, an activated gate-level fault maycorrupt multiple bits once it becomes visible in the microar-chitectural state.
Table 3 shows the number of bits corrupted at the outputlatch (microarchitectural state) for different fault models fora fault in the ALU, the AGEN, and the Decoder. For eachfault model, it shows the percentage of instructions that havedifferent number of bits flipped at the output latch. The bitsare binned on a log scale.
Table 3 shows that the corruption patterns of µarch-level
faults for the ALU, AGEN, and Decoder are quite differ-ent from those of the gate-level faults. While µarch-levelALU and AGEN faults are injected in the output latches andcorrupt at most one bit, the corresponding gate-level faults,though usually corrupt one bit, can result in multi-bit corrup-tions (between 9% and 25% across the ALU and the AGEN).However, for µarch-level Decoder faults, although faults areinjected at the input latch, the resulting multi-bit corruptionsturn out to be too aggressive (22% of corruptions for µarch-level faults are 8+ bits while the corresponding numbers forgate-level faults are less than 15%). This is because the out-put cone of the input (output) latch of the faulty unit is toolarge (small) when compared to that of a gate-level fault andleads to aggressive (conservative) bit corruptions at the out-put latch.
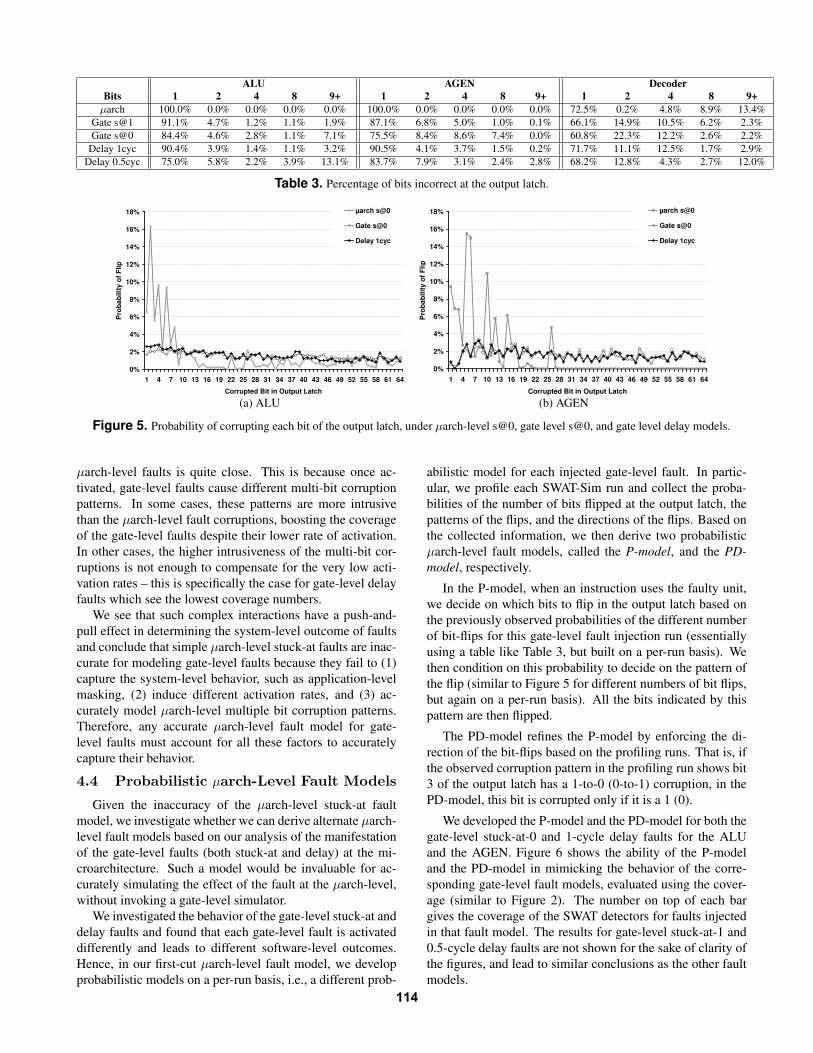
To better understand how the microarchitectural state getscorrupted by the injected faults, we collect the probabilitythat bit i was flipped, given an instruction activates the un-derlying fault. Figures 5(a) and (b) show the distributionof the probabilities of a given bit in the output latch (num-bered from bit 0 to bit 63) to be faulty under µarch-levelstuck-at-0, gate-level stuck-at-0, and gate-level 1-cycle delaymodels for the ALU and the AGEN respectively. For brevity,we omit the µarch-level stuck-at-1, gate-level stuck-at-1, and0.5-cycle delay models.
From the figures, we see that the probabilities of bit-flipsof the µarch-level model are vastly different from the gate-level models. Further, the probability of flipping lower orderbits is higher for µarch-level faults as the applications weuse predominantly perform computations on the lower order32-bits. The difference presented here is another source ofdiscrepancy of the µarch-level model to represent gate-levelfaults.
When comparing the two gate-level fault models, interest-ingly, both have very similar corruption patterns even thoughthey differ in terms of coverage, detection latency, activa-tion rate, and number of bit-flips. To investigate this phe-nomenon, we studied the differences between corruption pat-terns of the gate-level stuck-at and delay fault injected at thesame net and made the following observation: delay faultsgenerally yield more corruption patterns than the stuck-at-0faults because they can cause the same bit to be corruptedin both directions, instead of a single direction in stuck-at-0faults. While this higher number of corruption patterns maycause delay faults easier to be detected, we note that the av-erage activation rate of delay faults is also lower than that ofstuck-at faults, as explained in Section 4.3.1, making themharder to detect and causing longer detection latencies.
Overall, our analysis shows that the different activationrates and bit corruption patterns paint a clearer picture in ex-plaining the differences in the coverage (Figure 2) and thedetection latencies (Figure 3) between µarch-level and gate-level faults. We found that higher activation rates of µarch-level stuck-at-1 faults typically cause higher coverage (andlower detection latencies) than gate-level faults, but it is nota perfect correlation. In some cases, despite significant dif-ferences in activation rates, the coverage of gate-level and
113
ALU AGEN DecoderBits 1 2 4 8 9+ 1 2 4 8 9+ 1 2 4 8 9+
µarch 100.0% 0.0% 0.0% 0.0% 0.0% 100.0% 0.0% 0.0% 0.0% 0.0% 72.5% 0.2% 4.8% 8.9% 13.4%Gate s@1 91.1% 4.7% 1.2% 1.1% 1.9% 87.1% 6.8% 5.0% 1.0% 0.1% 66.1% 14.9% 10.5% 6.2% 2.3%Gate s@0 84.4% 4.6% 2.8% 1.1% 7.1% 75.5% 8.4% 8.6% 7.4% 0.0% 60.8% 22.3% 12.2% 2.6% 2.2%
Delay 1cyc 90.4% 3.9% 1.4% 1.1% 3.2% 90.5% 4.1% 3.7% 1.5% 0.2% 71.7% 11.1% 12.5% 1.7% 2.9%Delay 0.5cyc 75.0% 5.8% 2.2% 3.9% 13.1% 83.7% 7.9% 3.1% 2.4% 2.8% 68.2% 12.8% 4.3% 2.7% 12.0%
Table 3. Percentage of bits incorrect at the output latch.
0%
2%
4%
6%
8%
10%
12%
14%
16%
18%
1 4 7 10 13 16 19 22 25 28 31 34 37 40 43 46 49 52 55 58 61 64Corrupted Bit in Output Latch
Prob
abili
ty o
f Flip
µarch s@0
Gate s@0
Delay 1cyc
0%
2%
4%
6%
8%
10%
12%
14%
16%
18%
1 4 7 10 13 16 19 22 25 28 31 34 37 40 43 46 49 52 55 58 61 64Corrupted Bit in Output Latch
Prob
abili
ty o
f Flip
µarch s@0
Gate s@0
Delay 1cyc
(a) ALU (b) AGEN
Figure 5. Probability of corrupting each bit of the output latch, under µarch-level s@0, gate level s@0, and gate level delay models.
µarch-level faults is quite close. This is because once ac-tivated, gate-level faults cause different multi-bit corruptionpatterns. In some cases, these patterns are more intrusivethan the µarch-level fault corruptions, boosting the coverageof the gate-level faults despite their lower rate of activation.In other cases, the higher intrusiveness of the multi-bit cor-ruptions is not enough to compensate for the very low acti-vation rates – this is specifically the case for gate-level delayfaults which see the lowest coverage numbers.
We see that such complex interactions have a push-and-pull effect in determining the system-level outcome of faultsand conclude that simple µarch-level stuck-at faults are inac-curate for modeling gate-level faults because they fail to (1)capture the system-level behavior, such as application-levelmasking, (2) induce different activation rates, and (3) ac-curately model µarch-level multiple bit corruption patterns.Therefore, any accurate µarch-level fault model for gate-level faults must account for all these factors to accuratelycapture their behavior.
4.4 Probabilistic µarch-Level Fault Models
Given the inaccuracy of the µarch-level stuck-at faultmodel, we investigate whether we can derive alternate µarch-level fault models based on our analysis of the manifestationof the gate-level faults (both stuck-at and delay) at the mi-croarchitecture. Such a model would be invaluable for ac-curately simulating the effect of the fault at the µarch-level,without invoking a gate-level simulator.
We investigated the behavior of the gate-level stuck-at anddelay faults and found that each gate-level fault is activateddifferently and leads to different software-level outcomes.Hence, in our first-cut µarch-level fault model, we developprobabilistic models on a per-run basis, i.e., a different prob-
abilistic model for each injected gate-level fault. In partic-ular, we profile each SWAT-Sim run and collect the proba-bilities of the number of bits flipped at the output latch, thepatterns of the flips, and the directions of the flips. Based onthe collected information, we then derive two probabilisticµarch-level fault models, called the P-model, and the PD-model, respectively.
In the P-model, when an instruction uses the faulty unit,we decide on which bits to flip in the output latch based onthe previously observed probabilities of the different numberof bit-flips for this gate-level fault injection run (essentiallyusing a table like Table 3, but built on a per-run basis). Wethen condition on this probability to decide on the pattern ofthe flip (similar to Figure 5 for different numbers of bit flips,but again on a per-run basis). All the bits indicated by thispattern are then flipped.
The PD-model refines the P-model by enforcing the di-rection of the bit-flips based on the profiling runs. That is, ifthe observed corruption pattern in the profiling run shows bit3 of the output latch has a 1-to-0 (0-to-1) corruption, in thePD-model, this bit is corrupted only if it is a 1 (0).
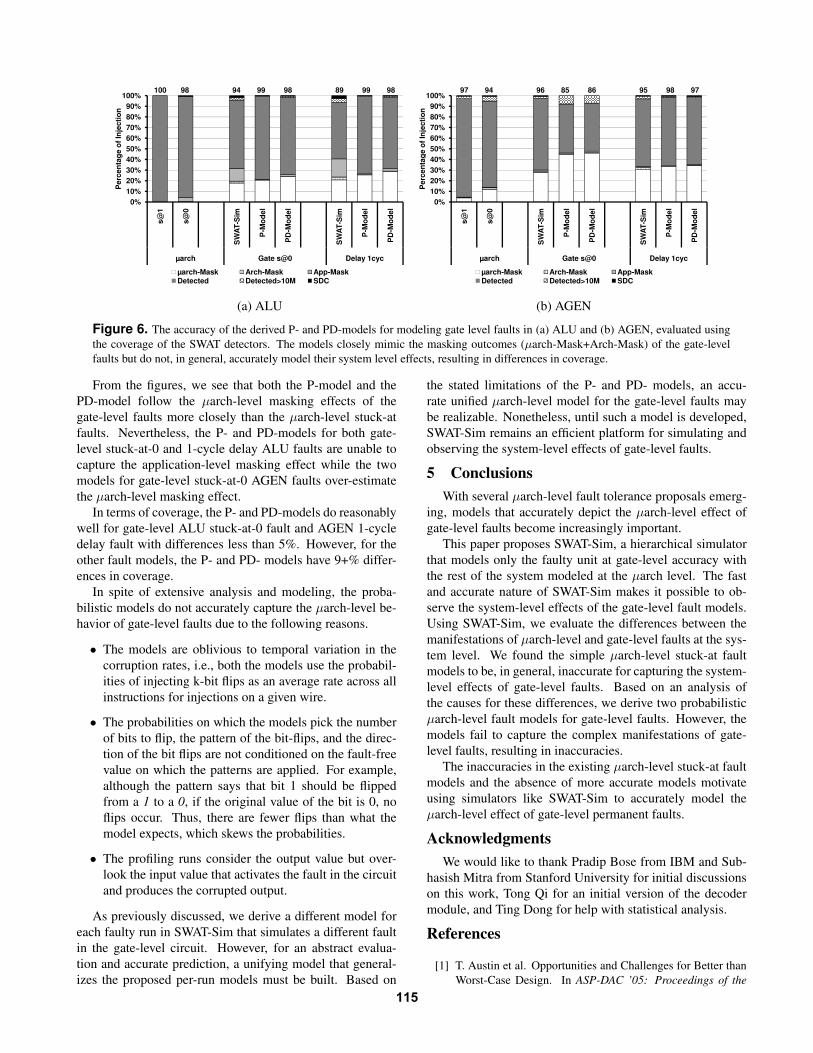
We developed the P-model and the PD-model for both thegate-level stuck-at-0 and 1-cycle delay faults for the ALUand the AGEN. Figure 6 shows the ability of the P-modeland the PD-model in mimicking the behavior of the corre-sponding gate-level fault models, evaluated using the cover-age (similar to Figure 2). The number on top of each bargives the coverage of the SWAT detectors for faults injectedin that fault model. The results for gate-level stuck-at-1 and0.5-cycle delay faults are not shown for the sake of clarity ofthe figures, and lead to similar conclusions as the other faultmodels.
114
20%30%40%50%60%70%80%90%
100%
Perc
enta
ge o
f Inj
ectio
n
100 98 94 99 98 89 99 98
0%10%20%
s@1
s@0
SWAT
-Sim
P-M
odel
PD-M
odel
SWAT
-Sim
P-M
odel
PD-M
odel
µarch Gate s@0 Delay 1cyc
Perc
enta
ge o
f Inj
ectio
n
µarch-Mask Arch-Mask App-MaskDetected Detected>10M SDC
20%30%40%50%60%70%80%90%
100%
Perc
enta
ge o
f Inj
ectio
n
97 94 96 85 86 95 98 97
0%10%20%
s@1
s@0
SWAT
-Sim
P-M
odel
PD-M
odel
SWAT
-Sim
P-M
odel
PD-M
odel
µarch Gate s@0 Delay 1cyc
Perc
enta
ge o
f Inj
ectio
n
µarch-Mask Arch-Mask App-MaskDetected Detected>10M SDC
(a) ALU (b) AGEN
Figure 6. The accuracy of the derived P- and PD-models for modeling gate level faults in (a) ALU and (b) AGEN, evaluated usingthe coverage of the SWAT detectors. The models closely mimic the masking outcomes (µarch-Mask+Arch-Mask) of the gate-levelfaults but do not, in general, accurately model their system level effects, resulting in differences in coverage.
From the figures, we see that both the P-model and thePD-model follow the µarch-level masking effects of thegate-level faults more closely than the µarch-level stuck-atfaults. Nevertheless, the P- and PD-models for both gate-level stuck-at-0 and 1-cycle delay ALU faults are unable tocapture the application-level masking effect while the twomodels for gate-level stuck-at-0 AGEN faults over-estimatethe µarch-level masking effect.
In terms of coverage, the P- and PD-models do reasonablywell for gate-level ALU stuck-at-0 fault and AGEN 1-cycledelay fault with differences less than 5%. However, for theother fault models, the P- and PD- models have 9+% differ-ences in coverage.
In spite of extensive analysis and modeling, the proba-bilistic models do not accurately capture the µarch-level be-havior of gate-level faults due to the following reasons.
• The models are oblivious to temporal variation in thecorruption rates, i.e., both the models use the probabil-ities of injecting k-bit flips as an average rate across allinstructions for injections on a given wire.
• The probabilities on which the models pick the numberof bits to flip, the pattern of the bit-flips, and the direc-tion of the bit flips are not conditioned on the fault-freevalue on which the patterns are applied. For example,although the pattern says that bit 1 should be flippedfrom a 1 to a 0, if the original value of the bit is 0, noflips occur. Thus, there are fewer flips than what themodel expects, which skews the probabilities.
• The profiling runs consider the output value but over-look the input value that activates the fault in the circuitand produces the corrupted output.
As previously discussed, we derive a different model foreach faulty run in SWAT-Sim that simulates a different faultin the gate-level circuit. However, for an abstract evalua-tion and accurate prediction, a unifying model that general-izes the proposed per-run models must be built. Based on
the stated limitations of the P- and PD- models, an accu-rate unified µarch-level model for the gate-level faults maybe realizable. Nonetheless, until such a model is developed,SWAT-Sim remains an efficient platform for simulating andobserving the system-level effects of gate-level faults.
5 ConclusionsWith several µarch-level fault tolerance proposals emerg-
ing, models that accurately depict the µarch-level effect ofgate-level faults become increasingly important.
This paper proposes SWAT-Sim, a hierarchical simulatorthat models only the faulty unit at gate-level accuracy withthe rest of the system modeled at the µarch level. The fastand accurate nature of SWAT-Sim makes it possible to ob-serve the system-level effects of the gate-level fault models.Using SWAT-Sim, we evaluate the differences between themanifestations of µarch-level and gate-level faults at the sys-tem level. We found the simple µarch-level stuck-at faultmodels to be, in general, inaccurate for capturing the system-level effects of gate-level faults. Based on an analysis ofthe causes for these differences, we derive two probabilisticµarch-level fault models for gate-level faults. However, themodels fail to capture the complex manifestations of gate-level faults, resulting in inaccuracies.
The inaccuracies in the existing µarch-level stuck-at faultmodels and the absence of more accurate models motivateusing simulators like SWAT-Sim to accurately model theµarch-level effect of gate-level permanent faults.
AcknowledgmentsWe would like to thank Pradip Bose from IBM and Sub-
hasish Mitra from Stanford University for initial discussionson this work, Tong Qi for an initial version of the decodermodule, and Ting Dong for help with statistical analysis.
References
[1] T. Austin et al. Opportunities and Challenges for Better thanWorst-Case Design. In ASP-DAC ’05: Proceedings of the
115
2005 conference on Asia South Pacific design automation,pages 2–7, New York, NY, USA, 2005. ACM.
[2] T. M. Austin. DIVA: A Reliable Substrate for Deep Submi-cron Microarchitecture Design. In Proceedings of Interna-tional Symposium on Microarchitecture, 1998.
[3] J. Blome et al. Self-Calibrating Online Wearout Detection.In Proceedings of International Symposium on Microarchi-tecture, 2007.
[4] S. Borkar. Microarchitecture and Design Challenges for Gi-gascale Integration. In Proceedings of International Sympo-sium on Microarchitecture, 2005. Keynote Address.
[5] F. A. Bower, D. Sorin, and S. Ozev. Online Diagnosis ofHard Faults in Microprocessors. ACM Transactions on Ar-chitecture and Code Optimization, 4(2), 2007.
[6] M. Bushnell and V. Agarwal. Essentials of Electronic Test-ing for Digital, Memory, and Mixed-Signal VLSI Circuits.Springer, 2000.
[7] H. Cha et al. A Gate-Level Simulation Environment forAlpha-Particle-Induced Transient Faults. IEEE Transactionson Computers, 45(11), 1996.
[8] K. Constantinides et al. Software-Based On-Line Detectionof Hardware Defects: Mechanisms, Architectural Support,and Evaluation. In Proceedings of International Symposiumon Microarchitecture, 2007.
[9] C. Dawson, S. Pattanam, and D. Roberts. The Verilog Pro-cedural Interface for the Verilog Hardware Description Lan-guage. In Verilog HDL Conference, 1996.
[10] Z. Kalbarczyk et al. Hierarchical Simulation Approach to Ac-curate Fault Modeling for System Dependability Evaluation.IEEE Transactions on Software Engineering, 25(5), 1999.
[11] G. Kanawati et al. FERRARI: A Flexible Software-BasedFault and Error Injection System. IEEE Computer, 44(2),1995.
[12] M. Li et al. Understanding the Propagation of Hard Errorsto Software and Implications for Resilient Systems Design.In Proceedings of International Conference on ArchitecturalSupport for Programming Languages and Operating Systems,2008.
[13] M. Martin et al. Multifacet’s General Execution-Driven Mul-tiprocessor Simulator (GEMS) Toolset. Computer Architec-ture Newsletters, 33(4), 2005.
[14] A. Meixner, M. Bauer, and D. Sorin. Argus: Low-Cost, Com-prehensive Error Detection in Simple Cores. In Proceedingsof International Symposium on Microarchitecture, 2007.
[15] S. Mirkhani, M. Lavasani, and Z. Navabi. Hierarchical FaultSimulation Using Behavioral and Gate Level Hardware Mod-els. In 11th Asian Test Symposium, 2002.
[16] B. C. Paul et al. Temporal Performance Degradation Un-der NBTI: Estimation and Design for Improved Reliabilityof Nanoscale Circuits. In DATE, 2006.
[17] A. Pellegrini et al. CrashTest: A Fast High-Fidelity FPGA-Based Resiliency Analysis Framework. In International Con-ference on Computer Design, 2008.
[18] M. Pirvu, L. Bhuyan, and R. Mahapatra. Hierarchical Simu-lation of a Multiprocessor Architecture. 2000.
[19] M. Prvulovic et al. ReVive: Cost-Effective Architecture Sup-port for Rollback Recovery in Shared-Memory Multiproces-sors. In Proceedings of International Symposium on Com-puter Architecture, 2002.
[20] R. Raghuraman. Simulation Requirements For Vectors inATE Formats. In Proceedings of International Test Confer-ence, 2004.
[21] P. Ramachandran et al. Statistical Fault Injection. In Proceed-ings of International Conference on Dependable Systems andNetworks, 2008.
[22] S. Sahoo et al. Using Likely Program Invariants to DetectHardware Errors. In Proceedings of International Conferenceon Dependable Systems and Networks, 2008.
[23] J. H. Saltzer et al. End-to-End Arguments in System Design.ACM Trans. on Comp. Systems, 2(4), 1984.
[24] S. Sarangi et al. A Model for Timing Errors in Processors withParameter Variation. In International Symposium on QualityElectronic Design, 2007.
[25] S. Shyam et al. Ultra Low-Cost Defect Protection for Micro-processor Pipelines. In Proceedings of International Confer-ence on Architectural Support for Programming Languagesand Operating Systems, 2006.
[26] D. Sorin et al. SafetyNet: Improving the Availabilityof Shared Memory Multiprocessors with Global Check-point/Recovery. In Proceedings of International Symposiumon Computer Architecture, 2002.
[27] J. Srinivasan et al. Exploiting Structural Duplication for Life-time Reliability Enhancement. In Proceedings of Interna-tional Symposium on Computer Architecture, 2005.
[28] Sun. OpenSPARC T1 Processor. Website, 2007. http://www.opensparc.net/.
[29] Virtutech. Simics Full System Simulator. Website, 2006.http://www.simics.net.
[30] N. Wang and S. Patel. ReStore: Symptom-Based Soft Er-ror Detection in Microprocessors. IEEE Transactions on De-pendable and Secure Computing, 3(3), July-Sept 2006.
[31] D. Yen. Chip Multithreading Processors Enable ReliableHigh Throughput Computing. In Proceedings of Interna-tional Reliability Physics Symposium, 2005. Keynote Ad-dress.
116

![Accurate Fault Modeling and Fault Simulation of Resistive ...faculty.cs.tamu.edu/walker/pubs/sardessai98.pdf · The bridging fault simulator proposed by [8] is based on accurate modeling](https://static.fdocuments.net/doc/165x107/5f57d134e454a8594468c8f4/accurate-fault-modeling-and-fault-simulation-of-resistive-the-bridging-fault.jpg)