Accumulation and Food Retailer Store Type: Determining ...
184
University of Tennessee, Knoxville University of Tennessee, Knoxville TRACE: Tennessee Research and Creative TRACE: Tennessee Research and Creative Exchange Exchange Doctoral Dissertations Graduate School 12-2005 Accumulation and Food Retailer Store Type: Determining Hispanic Accumulation and Food Retailer Store Type: Determining Hispanic Consumers' Attitude Toward Store Attributes in the San Antonio Consumers' Attitude Toward Store Attributes in the San Antonio Market Market Carol Lynn Nute University of Tennessee, Knoxville Follow this and additional works at: https://trace.tennessee.edu/utk_graddiss Part of the Home Economics Commons Recommended Citation Recommended Citation Nute, Carol Lynn, "Accumulation and Food Retailer Store Type: Determining Hispanic Consumers' Attitude Toward Store Attributes in the San Antonio Market. " PhD diss., University of Tennessee, 2005. https://trace.tennessee.edu/utk_graddiss/4346 This Dissertation is brought to you for free and open access by the Graduate School at TRACE: Tennessee Research and Creative Exchange. It has been accepted for inclusion in Doctoral Dissertations by an authorized administrator of TRACE: Tennessee Research and Creative Exchange. For more information, please contact [email protected].
Transcript of Accumulation and Food Retailer Store Type: Determining ...

University of Tennessee, Knoxville University of Tennessee, Knoxville
TRACE: Tennessee Research and Creative TRACE: Tennessee Research and Creative
Exchange Exchange
Doctoral Dissertations Graduate School
12-2005
Accumulation and Food Retailer Store Type: Determining Hispanic Accumulation and Food Retailer Store Type: Determining Hispanic
Consumers' Attitude Toward Store Attributes in the San Antonio Consumers' Attitude Toward Store Attributes in the San Antonio
Market Market
Carol Lynn Nute University of Tennessee, Knoxville
Follow this and additional works at: https://trace.tennessee.edu/utk_graddiss
Part of the Home Economics Commons
Recommended Citation Recommended Citation Nute, Carol Lynn, "Accumulation and Food Retailer Store Type: Determining Hispanic Consumers' Attitude Toward Store Attributes in the San Antonio Market. " PhD diss., University of Tennessee, 2005. https://trace.tennessee.edu/utk_graddiss/4346
This Dissertation is brought to you for free and open access by the Graduate School at TRACE: Tennessee Research and Creative Exchange. It has been accepted for inclusion in Doctoral Dissertations by an authorized administrator of TRACE: Tennessee Research and Creative Exchange. For more information, please contact [email protected].

To the Graduate Council:
I am submitting herewith a dissertation written by Carol Lynn Nute entitled "Accumulation and
Food Retailer Store Type: Determining Hispanic Consumers' Attitude Toward Store Attributes in
the San Antonio Market." I have examined the final electronic copy of this dissertation for form
and content and recommend that it be accepted in partial fulfillment of the requirements for the
degree of Doctor of Philosophy, with a major in Human Ecology.
Youn-Kyung Kim, Major Professor
We have read this dissertation and recommend its acceptance:
Ann Fairhurst, Laura D. Jolly, William L. Seaver
Accepted for the Council:
Carolyn R. Hodges
Vice Provost and Dean of the Graduate School
(Original signatures are on file with official student records.)

To the Graduate Council:
I am submitting herewith a dissertation written by Carol Lynn S. Nute entitled "Acculturation and Food Retailer Store Type: Determining Hispanic Consumer�' Attitudes Toward Store Attributes in the San Antonio Market'' I have examined the final paper copy of this dissertation for form and content and recommend that it be accepted in partial fulfillment of the requirements for the degree of Doctor of Philosophy, with a major in Human Ecology.
W'e have read this dissertation and recommend its acceptance:
Acceptance for the Council:


ACCULTURATION AND FOOD RETAILER STORE TYPE: DETERMINING HISPANIC CONSUMERS' ATTITUDES TOWARD STORE
ATTRIBUTES IN THE SAN ANTONIO MARKET
A Dissertation Presented for the
Doctor of Philosophy Degree
The University of Tennessee, Knoxville
Carol Lynn S. Nute December 2005

Copyright ©2005 by Carol Lynn S. Nute All rights reserved.
11

DEDICATION
The Holy Bible tells us to always give thanks to God the Father for everything, and thus I do so with a humble heart.
This dissertation is dedicated to my Lord and Savior, Jesus Christ, who provided all I needed for its successful completion.
It is also dedicated to my husband, David R. L. Nute. David, for always inspiring me with encouraging words, I give you my heartfelt thanks.
Your limitless faith that I could accomplish this was ever-motivating. Your hugs, kisses and sometimes just listening were always appreciated.
I couldn't have done it without your support.
111

ACKNOWLEDGMENTS
To my daughters, Mari and Zari, thanks for inspiring me to study Hispanics. For all my other children, Greg, Ashley, King, Joe, Mike, Mandy, and all my grandchildren, you gave me
hugs and laughter through the tears, as I struggled being apart from you while completing this work.
For my parents Bill and Betty Schmidt, the best role models a daughter could have, and my siblings Kevin, Colleen, Cathy and Will who thought I was crazy for doing this but
graciously listened to all my stories, and encouraged me to "hang in there."
For my graduate friends, Linda Strouby, Sylvia Smith, and Derek Norton your help and support throughout my final year was a blessing. Call me anytime; I'll be there for you.
I wish to thank The University of Chicago Press for granting permission to use the Monroe and Guiltinan model figure in this dissertation manuscript.
I would like to thank all those who served on my doctoral committee: Dr. Ann Fairhurst, Dr. Laura Jolly, Dr. William Seaver and my chair, Dr. Youn-Kyung Kim.
I am especially indebted to Dr. Seaver for keeping me on track with all the statistical analyses of the data throughout his summer "vacation."
I am also especially grateful to Dr. Kim who helped with numerous revisions of this manuscript, in addition to teaching me how to be a better researcher in the future.
Thank you, thank you one and all.
IV

ABSTRACT
The purpose of this study was to add to the body of knowledge by determining
Hispanic consumers' food retailer store choice. This study tested: (1) how Hispanic
consumers' attitudes towards store environmental attributes of the primary food retail store
type shopped will differ by variety of acculturation (as measured by the attributes'
importance and likelihood the preferred food retailer contains these attributes); (2) how
Hispanic consumers' primary food retail store type choice is dependent upon variety of
acculturation; and (3) how Hispanic consumers' attitudes toward store environmental
attributes will differ by the type of primary food retail store shopped.
The survey data was collected during a festival event held in San Antonio, Texas, in
April 2005. Of the surveys collected, 260 responses were used for the data analyses. Variety
of acculturation was determined by using the Mendoza (1989) Cultural Life Style Inventory
scale. Implementing a variety of multivariate methods including fuzzy cluster analysis,
nearest neighbor discriminant analysis, MANOVA and Hotellings T2 randomization tests,
the results of the study determined that Hispanic consumers' attitudes toward store
environmental attributes differed by the two types of stores studied (supermarkets and
supercenters).
Food retailers who are interested in Hispanics as either a portion of, or their sole
target market will unearth several interesting findings from this study. First, food retailers
can learn which store attributes influence Hispanics' attitudes and thus the type of primary
food store shopped. Second, Hispanics' different shopping habits and expenditures, as
revealed in the study provide useful information for food retailers. Each of these
V

conclusions contributes to understanding why food retailers should target Hispanics
consumers. Therefore, this study included a number of managerial implications as well as
ideas for future research.
Additional investigations of the data revealed a number of important findings that
food retailers can readily use to gain ideas for their own markets. These findings
included how Hispanics ranked store attributes overall as well as by individual variety of
acculturation, and how expenditures differed between Hispanics overall and their
individual varieties of acculturation.
VI

TABLE OF CONTENTS
Chapter Page
1 - INTRODUCTION ............................................................................................................. 1 llispanic Demographics ........................................................................................... 2
Population Size, Location and Diversity ................................................. 2 Income, Age and Spending Power ........................................................... 3
llispanic Acculturation ............................................................................................ 4 Store Attributes ......................................................................................................... 6 Definitions ................................................................................................................. 7
Problem Statement and Objectives ..................................................................................... 8
2 - LITERATURE REVIEW ......................................... .' ..................................................... 10 Conceptual Model ................................................................................................................ 10
Monroe and Guiltinan Model ............................................................................... 10 A Conceptual Model for Hispanic Consumers' Attitudes ................................ 12
llispanic Consumer Characteristics ................................................................................... 12 Acculturation ........................................................................................................... 13
Acculturation Defined .............................................................................. 13 Acculturation Measurements ................................................................... 15 Hispanic Studies of Acculturation .......................................................... 16 Berry's Acculturation Scale ...................................................................... 18 Mendoza's Acculturation Scale ............................................................... 20 Segmenting a llispanic Market ................................................................ 22
Attitudes Toward Food Retailers ....................................................................................... 24 Attitude Defmed ..................................................................................................... 25
Attitude Components ............................................................................... 26 Multi-attribute Attitude Models ............................................................................ 26
Fishbein's Attitude Model ........................................................................ 27 A Multi-attribute Attitude Model .......................................................... 27
Store Environment ................................................................................................. 28 Atmospherics and Servicescapes .......................................................................... 29 The Hofftnan and Turley Model .......................................................................... 31
Food Retail Store Choice .................................................................................................... 32 Where llispanics Shop for Food .......................................................................... 33
Research Questions .............................................................................................................. 36 Hypotheses ........................................................................................................................... 36
Varieties of Acculturation and Attitudes toward Food Retailers ..................... 37 Varieties of Acculturation and Food Retail Store Type Choice ....................... 37 Attitudes toward Food Retailers and Food Retail Store Type Choice ............ 38
3 - METHODOLOGY ........................................................................................................... 39 The Survey Instrument ........................................................................................................ 39
vu

Chapter Page
3 - METHODOLOGY continued Part A: Importance of Store Environmental Attributes ................................... 40 Part B: Food Store Shopped and Perception of Store Environmental Attributes ..................................................................................... 40 Part C: Variety of Acculturation ........................................................................... 41 Part D: Demographic Information ...................................................................... 42
Pre-Testing of the Surv-ey ................................................................................................... 42 Pretest Results ......................................................................................................... 43
The Sample and Data Administration ............................................................................... 44 Data Analysis ..................................................................................................................... 47
Preliminary Procedures .......................................................................................... 48 Multivariate Analyses ............................................................................................. 48
Principal Component Analysis versus Factor Analysis ....................... 49 Fuzzy Clustering ........................................................................................ 50 Nearest Neighbor Discriminant Analysis .............................................. 51
Hypotheses Testing ................................................................................................ 51 MANOVA ................................................................................................. 52 Cross Tabulation ....................................................................................... 53
4 - RESULTS ............................................................................................................................ 54 Data Screening ..................................................................................................................... 54
Missing Data ............................................................................................................ 54 Computations and New Variables ....................................................................... 55
Overall Demographic Analysis ............................................................... 56 Univariate Normality and.Outliers ....................................................................... 57 Don't Know/Not Applicable ............................................................................... 58
Variety of Acculturation ...................................................................................................... 59 Chi Square Analysis ................................................................................................ 61 Principal Component Analysis ............................................................................. 62 Factor Analysis ........................................................................................................ 62 Fuzzy Clustering ..................................................................................................... 63 Nearest Neighbor Discriminant Analysis ........................................................... 64 Demographic Characteristics by Mendoza's Variety of Acculturation .................................................................... 65
Hypotheses Testing ............................................................................................................. 66 Hypothesis 1 ............................................................................................................ 66 Hypothesis 2 ............................................................................................................ 68 Hypothesis 3 ............................................................................................................ 68 Additional Hypotheses Tests ................................................................................ 69
Finding a Significant Attribute Subset ................................................... 70 Retesting Hypothesis Three .................................................................... 71
Additional Findings ................................................................................................ 73 Overall Store Attribute Rankings ........................................................... 73 Assimilated Hispanics Store Attribute Rankings .................................. 73
vm

Chapter Page
4 - RES UL TS continued Integrated Hispanics Store Attribute Rankings .................................... 7 4 Separated Hispanics Store Attribute Rankings ..................................... 74 Overall Shopping Trips and Expenditures ............................................ 7 5 Assimilated Hispanics Shopping Trips and Expenditures .................. 76 Integrated Hispanics Shopping Trips and Expenditures .................... 7 6 Separated Hispanics Shopping Trips and Expenditures ..................... 77
"Don't Know/Not Applicable" Data Evaluation ............................................. 77 Summary .................................................................................................................. 78
5 - CONCLUSIONS, MANAGERIAL IMPLICATIONS AND FUTURE RESEARCH ................................................................................................... 80 Conclusions ........................................................................................................................... 81
Major Findings ........................................................................................................ 82 Additional Findings ................................................................................................ 83
Acculturation and Attitudes ................................................................... 83 Shopping Habits and Expenditures ....................................................... 84 Attributes Rankings .................................................................................. 85
Managerial Implications .......................... �············································································ 87 Major Findings ........................................................................................................ 87
Friendly and Knowledgeable Employees .............................................. 89 Organized Layout ...................................................................................... 91 Convenient Location ................................................................................ 92 Pleasant Interiors and Outside Appearance .......................................... 93 Easy Parking ............................................................................................... 94
Additional Findings ................................................................................................ 95 Limitations ............................................................................................................................. 97
Generalizing Results ............................................................................................... 98 Sample and Data Collection Bias ......................................................................... 98
Future Research .................................................................................................................... 99 Questionnaire Revisions ........................................................................................ 99 Additional Respondent Probing ......................................................................... 100 Larger Sample Sizes .............................................................................................. 101 Hispanic Food Retailers ....................................................................................... 101 Store Attribute Importance ................................................................................. 102 Summary ................................................................................................................ 102
LIST OF REFERENCES .......................................................................................................... 103
APPENDIX ................................................................................................................................. 113
VITA ................................................................................................................................................. 166
lX

LIST OF TABLES
1. Varieties of Acculturation ................................................................................................. 114 2. Fishbein's Attitude Model. ......... . . . . . ...................... ............................................................ 114 3. A Multi-attribute Model: Attitudes Towards Food Retailers ...................................... 114 4. The Frontstage Model (Hoffman & Turley, 2002) ....................................................... 115 5. The Frontstage Model and the Survey ................ .............. .............................................. 116 6. Summary of Total Surveys Used for Overall Data Analysis ...................................... 117 7. Variety of Acculturation for 260 Observations ............................................................. 117 8. PCA Results: Eigenvalues for 260 Observations .............. . . . . . ...................................... 118 9. PCA Factor Loadings Summary: Mendoza Scale .......... ................................................ 119 10. Factor Analysis Structure Summary after Varimax Rotation: Mendoza Scale .......... 121 11. Fuzzy Cluster Medoids Section .............................. .............. ............................................ 122 12. Sample of Fuzzy Cluster Output ...................... ............................................................... 122 13. Discriminant Analysis Jackknife and Stepwise Results .......................... ....................... 123 14. Demographic Differences ....... . . . .......... .. . ..................... · ... . . . . . . . . . . ... ................................ . . .... 124 15. MANOVA Tests for Hypothesis 1 .................................... ............................................. 125 16. Means and Standard Deviations for Hypothesis 1 ............. ........................................... 126 17. ANOVA Tests for Hypothesis 1 ................ ................................ ................. . . . . . . .. ............ 130 18. MANOVA Tests Section for Hypothesis 3 ... . � ............. ................................................. 131 19. Means and Standard Deviations for Hypothesis 3 ............................ .... ........................ 132 20. ANOVA Tests Section for Hypothesis 3 ............................................ ........................... 135 21. Hotelling's T2 Test Section for Hypothesis 1 ................................................................ 136 22. Hotelling's T2 Test Section for Hypothesis 3 ..................... ........................................... 136 23. Hotelling's T2 Student's T-Test Section for Hypothesis 3 .......................................... 137 24. McHenry Selection Results ................................................ ............................................... 138 25. MANOVA Tests Section for Hypothesis 3, 14 Attributes .......................................... 139 26. Means and Standard Deviations for Hypothesis 3, 14 Attributes .... ........ .................. 140 27. ANOVA Tests Section for Hypothesis 3, 14 Attributes .............................................. 142 28. Hotelling's T2 Test Section for Hypothesis 3, 14 Attributes ....................................... 143 29. Store Attribute Rankings and Means: Overall ..................................... ......................... 143 30. Store Attribute Rank and Means: Assimilated Hispanics ............................................. 144 31. Store Attribute Rankings and Means: Integrated Hispanics ........................................ 145 32. Store Attribute Rankings and Means: Separated Hispanics ......................................... 146 33. Shopping Trips and Expenditures: Overall .................................................................... 147 34. Shopping Trips and Expenditures: Assimilated Hispanics ..... . .................................... 148 35. Shopping Trips and Expenditures: Integrated Hispanics . . ........................................ . . 149 36. Shopping Trips and Expenditures: Separated Hispanics ............................................. 150 3 7. Shopping Trips and Expenditures: "Don't Know/Not Applicable" ......................... 151 38. Overall Store Attribute Rank and Scores by Variety of Acculturation ...................... 152
X

LIST OF FIGURES
Figure Page
1. Monroe & Guiltinan Store Choice Model ...................................................................... 153 2. A Conceptual Model for Hispanic Consumers' Attitudes ............................................ 154 3. Proposed Hypotheses ........................................................................................................ 155 4. Procedures Followed for Variety of Acculturation Measure ....................................... 156 5. Scree Plot of Eigenvalues ................................................................................................. 157 6. Scatter Plot #1 (Mendoza) ................................................................................................ 158 7. Scatter Plot #2 (Fuzzy) ...................................................................................................... 158 8. The Surv-ey ............................................................................................................................ 159
Xl


CHAPTER!
INTRODUCTION
In the best-selling book "Why We Buy" Underhill (1999) states that retailers are not
opening stores to serve new markets anymore, that retailers are trying to steal someone else's
customers, and that there is a need for an edge as the competition gets heated. Gaining an
edge has become especially important to food retailers whose markets have become highly
fragmented (Segal & Giacobbe, 1994). When buying groceries, consumers have a plethora
of food retail choices including convenience stores, neighborhood grocery stores,
supermarkets, superstores and warehouse clubs. Due to the variety of choices consumers
have when shopping for grocery items, it is essential to food retailers that obtaining
knowledge about their consumers be ongoing. Questions such as 'Why do consumers shop
at a particular food retailer?' and 'Why do some individuals of a particular consumer group
shop at one food store, while others in the same group select different ones?,' become
significant points for understanding the consumer behavior of these fragmented markets.
By providing some answers to these important questions, this study will fill a current void in
research by developing and empirically testing a food retailer store choice model for
Hispanic consumers. This will enable food retailers to successfully create a strategic plan for
their company by effectively targeting the fastest growing market segment in the United
States-the Hispanic market.
Often, in the process of developing a strategic plan, a retailer will study the
characteristics or consumer behaviors of a target market, the location and retail mix of a
store including specific store design components, and also their competitive environment
(Dunne & Lusch, 2005). Food retailers also know how important it is to keep an eye on
1

population, social, and economic trends, since they affect the way consumers shop given the
growing diversity of today's population and the tightening of consumer spending (Dunne, et.
al., 2005). Studying trends often enables a retailer to segment a market into smaller
homogenous groups, based on the characteristics of a particular group (Dunne, et. al., 2005).
Specifically, market segmentation is defined as the dividing of a heterogeneous consumer
population into smaller, more homogeneous groups based on their characteristics (Dunne,
et. al., 2005). Retailers, academicians and the government currently implement numerous
studies in order to identify who these groups might be. Due to the impact of immigration
and the changing demographics of the U.S. population (U.S. Census, 2001), ethnicity has
been increasingly studied as a variable that influences consumer behavior (e.g., Hirschman,
1981; Maldonado & Tansuhaj, 2002). The consumer behavior of a specific ethnic group can
be determined and targeted since group members often exchange information and
experiences with each other (Pires & Stanton, 2000).
Hispanic Demographics
One immigrant ethnic group gaining considerable attention is the burgeoning
Hispanic market. Some basic demographic information that should be reviewed by retailers
includes Hispanic population size, location and diversity, as well as average income, age and
spending power. These figures reflect how marketing to Hispanics could benefit food
retailers through increased traffic and sales.
Population Size, Location and Diversity. The U.S. Census (2001) identifies
"Hispanics" as consisting of Mexicans, Central and South Americans, Puerto Ricans, Cubans
and other Latin Americans. From 1990 to 2000, Census figures show double-digit growth in
their population. The 2000 U.S. Census Bureau reports the total Hispanic population
2

reached about 35 million or 13% of the total population, representing a 58% increase
between 1990 and 2000. While a large number of Hispanics are still concentrated in
California, New Mexico, Texas, Florida and New York, the population is now located all
around the country with every state in the nation containing 2-42% of the various Hispanic
groups (U.S. Census, 2001). While Mexicans make up the largest percentage(66%) of the
Hispanic market, 15% of this segment originated from Central and South America, 9% from
Puerto Rico, 4% from Cuba, and 6% from other Latin countries (Hawkins, Best, & Coney,
2003; U.S. Census, 2001b). Current projections for the 2020 Census show population
figures for Hispanics reaching 21 % of the total population; that is, one out of every five U.S.
residents will be of Hispanic origin (Yorgey, 2000).
Income, Age and Spending Power. The median income of Hispanic-American
hoµseholds was $32,997 (U.S. Census, 2004). One in six Hispanic families had a mean
annual income of over $50,000 (U.S. Census, 2001). With a median age of 26, many
Hispanics are in their prime earning years.
This demographic market shows a tremendous increase in buying power as well.
According to the University of Georgia's Selig Center for Economic Growth, the buying
power of Hispanics grew 118% from 1990 to 2001 compared to 67.9% growth for non
Hispanics O oiner, 2003). In addition, U.S. Hispanic buying power is expected to reach
$926.1 billion in 2007, an increase of 315% over 1990's figure (Humphreys, 2002).
This increased buying power is good news to many retailers, especially food retailers,
since the Food Marketing Institute reports that supermarkets (including supercenters) are the
food retail store of choice among U.S. Hispanics with 85% shopping there at least once a
month Gaketic, 2002). As the most rapidly growing ethnic group in the U.S., these figures are
3

expected to change and possibly increase as more information is gathered through additional
government and industry analyses. With the prospect of increasing annual population
growth rates and improved market share, it becomes increasingly evident that food retailers
need to develop a competitive strategy to target this ethnic group.
A number of food retailers of various sizes have already begun positioning their
stores accordingly. For example, the 7-Eleven Inc. convenience chain, based in Dallas,
Texas, offers its Florida residents a Cuban sandwich, which is the number one selling
sandwich in its Florida stores. Positioning to Hispanic tastes has also paid off nationally as
Latin American food gains in popularity with all market segments. For example, salsa is the
number one condiment in America today surpassing ketchup (Del Toro, 2002; Solomon,
2004). This interest in ethnic fare has become important to food retailers as they change the
product and service mix of their stores to keep up with the demands of the shopping public
and the changing demographics in America.
Hispanic Acculturation
Before they can agree on how to position their product, brand or store, food retailers
who are determined to target Hispanics must first understand the Hispanic culture with its
vastly different generations each with their respective needs (Gore, 2005). Through various
marketing strategies including market segmentation, retailers can build brand identity by
positioning their brand to stand apart from the competition in the marketplace (V akratsas,
Demetrios & Ambler, 1 999). In reviewing national demographics for every store location in
their company, Albertson's supermarket came to realize that Hispanics make up between 2%
and 5% of individual store trade areas and have begun to target them with various products
like pan dulce (sweet bread) as well as Mexican papayas and mangos (Clark, 2003). While
4

some experts in the industry are saying that the majority of the nation's Hispanic population
is now acculturated, they are still strongly bound by their heritage (Gore, 2005), and
therefore exhibit different shopping behaviors.
In order to understand changes in the Hispanic market and therefore reach the
Hispanic market, food retailers must understand acculturation which is the phenomena
resulting when groups of individuals from different cultures come into continuous contact
with one another resulting in changes in the original culture patterns of either or both
societies (Berry, 1980). While most Hispanics assimilate or absorb into many areas of the
Anglo-American host culture, some actively resist. Therefore, retailers who treat Hispanics
as an extension of the Anglo market are making a costly mistake (Herbig & Yelkur, 1997).
Assimilation, when an individual adapts the cultural identify of the host society, is one of the
four .levels or varieties of acculturation defined by John Berry (1980). The remaining three
varieties are: separation, individuals who retain their cultural identity; integration, individuals
who retain their cultural identity and also adapt some of the customs of the host society; and
marginalization, individuals who reject both. Understanding varieties of acculturation would
be beneficial to food retailers planning to segment the local Hispanic market.
These different varieties of acculturation also appear to be one reason some
Hispanics shop smaller food markets, or bodegas, when looking for items from their home
country, while others patronize larger stores that offer better prices (Howell, 1999). By
understanding the different varieties of acculturation and by developing marketing strategies
that specifically target each one, retailers could position their store, product or brand in such
a way as to ensure greater success with the Hispanic consumer. Retailers often create and
design their store environment based on research they have gathered with regards to what
5

their customers want or need. There are various store attributes that a consumer takes into
consideration when determining which store to choose when shopping (Solomon, 2004).
While price, location and the product assortment offered from a store are some of the
important attributes consumers search for when selecting a place to shop (Tigert, 1983), this
list of possible attributes for an individual consumer may be extensive and can include both
emotional and environmental components as well. While these attributes may exert a
consistent influence on store choice, Mitchell and Kiral (1999) note that the list of important
attributes changes over time and is dependent upon a shopper's needs and motives as well as
overall risks involved.
Store Attributes
A range of store environmental attributes can influence consumer and employee
behavior as well as impact the success of a service transaction (Hoffman & Turley, 2002). A
service encounter can occur haphazardly, or a marketer can systematically manage it through
the effective use of atmospheric variables (Hoffman, et. al., 2002). With regards to an
overall strategic marketing plan, stores can effectively use store environmental attributes
such as signage, point of purchase displays, store employees, etc. to position themselves in
the forefront of a consumer's mind thereby influencing consumer behavior. Many of these
store attributes are a way to communicate directly with the Hispanic market through
language, cultural symbols or traditions. Thus far, research has failed to provide sufficient
information as to whether Hispanic consumers who exhibit different varieties of
acculturation may or may not be influenced in their store choice decisions based on some of
these environmental attributes.
6

Attributes are characteristics of an attitude object (Solomon, 2004) . Attitudes are
formed as a result of personal learning based on experience and can be affected by an
individual's cultural environment, including both customs and traditions (Walters, 1974).
Attitudes can be complex and often marketers turn to multi-attribute attitude models in an
effort to understand them (Solomon, 2004) . These models are composed of three elements
including attributes, beliefs and importance weights that identify specific beliefs and how
they combine to derive a measure of the consumer's overall attitude that can then be used to
predict an attitude toward a store, product or brand (Solomon, 2004). Attitudes can be
influenced and strengthened by people-based external effects such as friends, teachers,
parents and co-workers (Walters, 1974), and media-based external effects such as advertising
(Walters, 1974; Solomon, 2004) . As these attitude changes come about with the Hispanic
consumer, language and communication become significant on several fronts, not just from
an external advertising perspective but also internally in how and whether Hispanics respond
once within the store environment.
Definitions
Progressive Grocer, in its 71 st Annual Report of the Grocery Industry, notes that
grocery stores are food retailers with over 12,900 stores nationwide and less than $2 million
in sales volume (www.fmi.org/ facts_figs/keyfacts/ stores.htm). A supermarket food retailer
is defined as a full-line, self-service grocery store generating a sales volume of $2 million or
more annually (www.fmi.org/ facts_fig/ superfact.htm) .
The supermarket description by FMI also encompasses supercenters, which are a
different store type. In this study, the term 'food retailer' is used to encompass four store
types. The first store type, "supercenter," (1) will include stores carrying food and other
7

merchandise such as Wal-Mart and SuperTarget. The "supermarket" (2) store type label will
be used in this study as it is most familiar to researchers. The "supermarket" store type will
include national/regional chains such as Kroger, Food Town and H.E.B. The grocery store
type will include smaller "neighborhood" or "local" stores (3) with sales of less than $2
million. Warehouse clubs (4) such as Costco and Sam's will count as another store type·.
Problem Statement and Objectives
To increase sales and differentiate themselves from the competition, food retailers
need to tap into the Hispanic population, the fastest growing segment in terms of both their
size and buying power. In order to effectively target this market and thereby expand their
customer base, food retailers need to understand what influences the Hispanic shopper's
store choice behavior.
A body of research exists on the Hispanic consumer market, their varieties of
acculturation, and the store choice behaviors of the Hispanic shopper. Yet, the Hispanic
consumer characteristic of varieties of acculturation, and how the influence of this
characteristic on attitudes toward food retailers should be. investigated. Despite the
proliferation of research on store environmental attributes, the Hispanic shoppers' attitudes,
as measured by ·the importance and perception of these attributes, and how /whether these
attitudes influence food retailer store choice also has not been investigated. Furthermore,
the influence of varieties of acculturation in the context of food retailer store choice has not
been studied.
The purpose of this study is to add to the body of knowledge by determining
Hispanic consumers' food retailer store ·choice. This study will test: (1) how Hispanic
consumers' attitudes towards store environmental attributes of the primary food retail store
8

type shopped will differ by variety of acculturation (as measured by the attributes'
importance and likelihood the preferred food retailer contains these attributes); (2) how
Hispanic consumers' primary food retail store type choice is dependent upon variety of
acculturation; and (3) how Hispanic consumers' attitudes towards store environmental
attributes will differ by the type of primary food retail store shopped.
9

CHAPTER 2
LITERATURE REVIEW
To detennine where Hispanic consumers shop for food, this study will propose and
test a conceptual food retailer store choice model in the San Antonio market. The model is
based on a previously developed store choice model (Monroe & Guiltinan, 1975), and will
include the Hispanic consumer characteristic of variety of acculturation, attitudes regarding
certain store environmental attributes, and food retailer store choice. Importance and
perception are key components used to measure attitudes, and this study will develop and
implement a multi-attribute attitude model in order to facilitate this measurement. In
addition, by defining important terms and reviewing key variables in the framework, a
foundation will be laid for understanding why the Hispanic shopper should be an important
aspect of a food retailer's strategic plan.
Conceptual Model
There have been a number of models of consumer behavior ( e.g., Engel, Kollat, &
Blackwell, 1986; Engel, Blackwell & Miniard 1995) and patronage behavior (e.g., Darden &
Ashton, 197 4; Monroe & Guiltinan, 197 5) that reveal how consumer attitudes and the
stimuli associated with them influence purchases and store choice. These models have been
used in a number of additional studies and textbooks to explain how and why a consumer
behaves in a particular way in selecting a store (Dunne, et. al., 2005; Eckman, Kotsiopulos,
& Bickle, 1997; Solomon, 2004; Sullivan & Savitt, 1997).
Monroe and Guiltinan Model
Monroe and Guiltinan (197 5) investigated what determined store choice among
consumers and developed a model to identify the sequence and effects of store choice. In
1 0

their model, although basic household/buyer characteristics of consumers were not
specifically measured, the component is inclined to be enduring and was included in the
model (Figure 1) 1 • Longitudinal data were collected from a panel of grocery store shoppers
in order to determine consumer feelings regarding the relative importance of particular store
attributes. The attributes of "relatively low pricing" and "helpful advertising" were
subsequently targeted as those most likely to directly influence information processing and
search. Monroe et. al.'s (1975) results pointed out that four components - "general opinions
and activities," "perceptions of store attributes," "strategies for planning and budgeting,"
and finally, "importance of store attributes" were the most important parts in the model.
Since the study did not encompass all the model components, nor all possible store
attributes, more research in the area of the store choice process was needed.
Years later, Eckman et. al. (1997) used an adapted version of the Monroe and
Guiltinan model as the conceptual framework in a study examining the patronage behavior
of higher income Hispanic versus non-Hispanic consumers. The study measured the
perceived importance of 45 store attributes on patronage behavior. There were a few
differences between the groups. For instance, store hours, pricing policies, comfort, and
selection were all more important to higher income Hispanics, indicating that ethnicity
influenced factors related to store choice. Also some similarities, such as customer service,
convenience, merchandise offering and advertising were found between the two groups
implying that mainstreaming might be appropriate for certain strategies related to shared
characteristics of the two groups (Eckman, et. al., 1997).
1 All figures and tables are located in the Appendix.
1 1

A Conceptual Model for Hispanic Consumers' Attitudes
A number of unanswered questions regarding the Eckman et. al., (1977) study
prompted this study. Hence, an adapted version of the Monroe and Guiltinan (1975) model
was developed (Figure 2). For instance, what is it about their acculturation that influences
where a Hispanic consumer shops? What about the various store environmental attributes
(Hoffman, et. al., 2002) that were not addressed in the Eckman study? Finally, if Hispanics
as a group are influenced to shop one store over another, which store type should be
investigated? Supermarkets are key players in the field of food retail with over 33,800
supermarkets nationwide and sales totaling $432.8 billion for 2003 (www.fmi.org/facts_figs/
superfact.htm), while grocery stores play an important role in searching for the right food
items for some shoppers (Howell, 1999). According to the Bureau of Labor Statistics,
Hispanics spend more on groceries than non-Hispanic households (Clark, 2003); therefore,
it was determined that studying the food retailer store type would prove worthwhile.
The model (Figure 2) reflects Hispanic consumer characteristics, including varieties
of acculturation in place of Monroe and Guiltinan's household/buyer characteristics. The
Hispanic consumer's attitude towards a food retailer is measured by the importance and
perceptions of store environment attributes (or a multi-attribute attitude model). This
attitude towards a food retailer may influence their food retailer store choice.
Hispanic Consumer Characteristics
As noted in the food retailer store choice model, Hispanic consumer characteristics
include both demographics and varieties of acculturation. Before retailers can determine
whether a particular group will choose to shop a certain store, retailers must draw on past
experiences and research in an effort to understand a shopper's attitudes and behaviors. As
1 2

many retailers scramble to understand this rising Hispanic group, researchers must first
begin with the basics, acculturation information.
Acculturation
A number of studies on different ethnic groups including Hispanics, Asians, and
Native Americans have been conducted in recent years. Since the Hispanic ethnic group has
become such a population phenomenon, many researchers are seeking to understand how to
measure the adjustment of this ethnic group into the mainstream society using acculturation
scales.
Acculturation Defined. There are almost as many definitions of acculturation as
there are studies. According to Berry (1980), the concept of acculturation originated within
the discipline of anthropology. Berry refers to Redfield's, Linton's and Herskovits' 1936
definition of the concept of acculturation:
"Acculturation comprehends those phenomena which result when groups of
individuals having different cultures come into continuous first-hand contact,
with subsequent changes in the original culture patterns of either or both
groups . . . under this definition acculturation is to be distinguished from
culture change, of which it is but one aspect, and assimilation, which is at
times a phase of acculturation. It is also to be differentiated from diffusion,
which while occurring in all instances of acculturation, is not only a
phenomena which frequently takes place without the occurrence of the types
of contact between peoples specified in the definition above, but also
constitutes only one aspect of the process of acculturation" (Berry, 1980, p. 9).
1 3

While this definition is lengthy and verbatim in Berry's seminal research article, Gentry, Jun
and Tansuhaj (1995) abbreviate the definition to "the generic process consisting of all
phenomena that result when groups of individuals from different cultures come into
continuous first-hand contact and subsequent changes in the original patterns of either or
both groups occur" (p. 129). Other researchers have defined acculturation as the process of
learning a culture that is different from the one in which a person was raised (Ueltschy &
Kramp£, 1987; Valencia, 1985). Seitz (1998) defined acculturation simply as the process of
acquiring the customs of an alternate society. Acculturation in this study is derived from
Hernandez, Cohen and Garcia's (2000) description, and is defined as the behaviors and
values of the members of an immigrant culture that may change as a result of contact with a
dominant host culture.
Just as acculturation definitions are different, it is important to note that some
researchers mingle the various terms of assimilation, acculturation and ethnicity when
studying the changes that take place between the host society and other cultures. Further
investigation of the literature reflects these terms are not the same. Assimilation is a process
of acculturation (Berry, 1980). Ethnic identity is defined as "one's basic group or cultural
identity and consists of relatively stable properties" (Maldonado et. al., 2002, p. 415). Major
ethnic identity indicators have been identified as language use, self-identification, social
interaction, religion, and parent's ethnic identity. It is important to note, "it has been
common practice in consumer research that the same set of indicators are used to
operationalize both the concepts of acculturation and ethnicity" (Hui, Joy, Kim & Laroche,
1992, p. 467). Maldonado and Tansuhaj (2002) noted that often a strong ethnic influence
1 4

remains in an individual. Therefore, factors such as ethnic identity and level of acculturation
are important variables to understand and consider when studying the Hispanic market.
Acculturation Measurements. Since Hirschman's (1981) seminal study, which noted
that most consumer research either had not focused on ethnic groups or had failed to
classify consumers according to perceptions of the ethnic group members, more research
has been conducted to classify group members more specifically ( e.g. Maldonado, et. al.,
2002). Unfortunately, there is no standardized measurement for acculturation. Over the
years there have been a number of studies resulting in acculturation scales by variety,
category or type (Berry, 1980; Cuellar, Arnold, & Maldonado, 1995; Hernandez, et. al., 2000;
Penaloza, 1994); by level of assimilation (assimilated versus less assimilated) (Korgaonkar,
Karson & Lund, 2000) and by level of acculturation (high versus low) (Kara & Kara, 1996;
O'Guinn & Faber, 1986). There are bidimensional scales (Marin & Gamba, 1996), scales for
Mexican Americans (Cuellar, et. al. 1995; Mendoza, 1989) and even short acculturation scales
(Marin, Sabogal and B. Marin, Otero-Sabogal, & Perez-Stable, 1987). These scales include
either uni-dimensional or multi-dimensional acculturation measurements.
A dozen years after John Berry's seminal article on varieties of acculturation (Berry,
1980), Hui, Joy, Kim, and Laroche (1992) provided empirical evidence that acculturation is
indeed a multidimensional process. · They developed six acculturation indicators in order to
measure the extent of acculturation of Greek immigrants in Quebec. The measures included
language use, self-identification, social interaction, religious beliefs, parents' ethnic identity
and upbringing. The structure of a model in a later study by Laroche, Kim, Hui and Tomiuk
(1997) also assumed a multidimensional process and incorporated the three acculturation
dimensions of media exposure, social interaction and participation, and English language
1 5

use, in their study of Italian Canadians residing in Montreal. In addition, they included a
measure for the dimension of ethnic identification. They tested whether acculturation was
related to the consumption frequencies of convenience foods and found that the three
acculturation dimensions, more often than not, were positively related to the consumption
of convenience goods (Laroche, et. al., 1997).
While the various measurements may seem confusing at first glance, those
mentioned here have proven to be both reliable and valid. Methods used to test the scales
have included factor analysis for validity and Cronbach's alpha for reliability. Many of the
measurements have a number of common factors such as language and social affiliations.
There have been a number of important findings in studying Hispanic consumers using the
varieties of acculturation scales.
Hispanic Studies of Acculturation. Using acculturation as a method to identify the
Hispanic market can facilitate an understanding of how they think, along with what is
important to them at different stages in their adjustment to the host society. A "host"
society consists of the traits of the dominant cultural group in a set of people. While many
consider the United States to be the "melting pot" society, the dominant cultural group is
that of the Anglo-American. Many Hispanics in this country are immigrants. With recent
increases in immigration, they are born to first, second and later generation immigrants.
Either way, this group brings strong ethnic ties to the Hispanic culture that remain in place
as adjustments are made to the dominant society in which they live. Research has shown
that dependent upon Hispanics' variety of acculturation, attitudes and beliefs are different.
One of the premier studies on acculturation by Deshpande, Hoyer, and Donthu
(1986) found a number of behavioral differences between high (strong Hispanic identifier)
1 6

and low (weak Hispanic identifier) levels of acculturation. For example, they found that
strong Hispanic identifiers tended to be more brand loyal when it comes to national brands
and may view the consumption of high quality national brands as evidence that they have
"arrived" in the local economy (Deshpande, et. al., 1986). They also discovered that strong
Hispanic identifiers were more likely to rely heavily on their "native" language-Spanish
when searching for information prior to a purchase and when communicating with others
(Deshpande, et. al., 1986).
Other academic researchers have made important discoveries as well. A number of
researchers have discovered that the existing level of acculturation in current society impacts
Hispanic behavior. Studies include the effect acculturation plays with regards to how
Hispanics seek information prior to shopping and how they perceive advertising ( eg.,
Holland & Gentry, 1999; Korgaonkar, et. al., 2000; O'Guinn et. al., 1986; Ueltschy, et. al.,
1997); which grocery brands they choose (Maldonado & Tansuhaj, 2002) whether Hispanics
respond to direct response purchasing (Seitz, 1998); and how Hispanic decision processes
are impacted (Kara & Kara, 1996).
Fueled by interest in this important demographic group, the business sector has also
begun investigating the important behavioral component of acculturation. For instance, new
research led by the Food Marketing Institute, New American Dimensions and ADVO
dispels the past notion of brand loyalty and argues that only low acculturated Hispanics
display above average brand loyalty (Indvik, 2004). ACNeilson through its Homescan Panel
surveys have studied the effects of acculturation and have found that as the Hispanic
population acculturates, they shop more often in mainstream channels, spend more in
supermarkets, and tend to live in the suburbs (www.retailwire.com/ ACN/Tipl 1.cfm).
1 7

Berry's Acculturation Scale. The seminal work by Berry (1980) involving the study
of acculturation has been cited by numerous researchers and has provided a research
foundation for many (e.g., Cuellar, et. al., 1995; Hui, et. al., 1992; Korgaonkar, et. al., 2000;
Kosic, 2002; Laroche, et. al., 1997; Maldonado et. al., 2002; Penaloza, 1994). Berry suggested
that acculturation involves a three-phase process: contact, conflict, and adaptation. Without
contact there would not be acculturation. In other words there would be no reason for an
individual to change his behavioral patterns if he never interacted with another individual's
or group's culture. Phase two, conflict, occurs in the case of an individual or groups'
resistance - by any degree - to change. Cultural values and beliefs are learned from an early
age and individuals or groups do not tend to give up valued aspects of their culture. The
third phase, adaptation, refers to a variety of ways in which an individual or group will
reduce or stabilize conflict. Within the adaptation phase, Berry notes that there are
essentially four varieties of acculturation: assimilation, integration, rejection, and
deculturation.
In combining these four concepts, Berry noted that two important questions need to
be asked of all groups and individuals undergoing acculturation: "Is my cultural identity of
value to be retained?" and "Are positive relations with the larger ( dominant) society to be
sought?" (Berry, 1980, p. 13). From these two questions, and based upon the answers given,
Berry created an acculturation scheme that reflected the four varieties (Table 1). For
example, if both questions received a "yes" response, the individual was identified as
integrated. If both received a "no" response, the individual was identified as deculturated.
A mixture of positive and negative responses identified one as rejected, while negative and
positive responses identified one as assimilated.
1 8

Berry felt there were both positive and negative varieties of acculturation. He noted
that both assimilation and integration are positive varieties of acculturation. With
assimilation, an individual or group relinquishes their cultural identity and moves into the
larger society. However, with integration, the individual or group retains their cultural
identity and moves to become an integral part of the larger societal framework (Berry, 1980).
Berry's negative varieties of acculturation are rejection and deculturation. Rejection
is the self-imposed withdrawal from the larger society. When society imposes this same step,
it is called separation. Deculturation is a striking out against society and may be caused by
feelings of alienation, loss of identity, and acculturation stress. In this phase, groups are out
of contact with either their own traditional culture or that of the larger society (Berry, 1980).
In later research, Berry and his colleagues ren3:med the negative varieties of rejection and
deculturation, and called them separation and marginalization, respectively (Berry, Kim,
Minde & Mok, 1987). Table 1 illustrates the varieties of acculturation with the revised
names used in this study.
Berry's varieties of acculturation provided the foundation for further studies (e.g.,
Berry, et. al., 1987; Hernandez, et. al., 2000; Maldonado et. al., 2002; Penaloza, 1994). Lisa
Penaloza (1994) used Berry's varieties of acculturation as a basis for an ethnographic
research study. She determined that the environment in which an individual resides played a
key role in addition to demographic variables, language ability, recentness of arrival, and
ethnic identity in determining an individual's acculturation. Using these variables, she
developed a model of consumer acculturation of Mexican immigrants. In her model, an
individual's differences influenced one of two consumer acculturation agents (culture of
1 9

origin, culture of immigration. These agents in tum affected the consumer acculturation
processes which in tum affected the consumer acculturation outcome (Berry's scale).
In testing Berry's varieties of acculturation, Hernandez, et. al., (2000) suggested that
the dichotomous ("yes" and "no") scale used by Berry prevented an estimate of reliability
measures. The researchers recommended the use of multiple indicators ( e.g., a Likert scale)
of the two items ("Hispanics retention of cultural identity" and "Seek positive relationship to
American society") (fable 1) to measure the response of the two items.
Mendoza's Acculturation Scale. Richard Mendoza's empirical scale to measure type
and degree of acculturation described acculturation as a multidimensional process (Mendoza,
1989). Incorporating the prior research of Mendoza and Martinez (1981), he described four
typological patterns of acculturation (Mendoza, 1989). The first pattern, cultural resistance,
describes the acquisition of alternate cultural norms while maintaining native customs. The
second pattern, cultural shift, describes a substitution of alternate cultural norms for native
customs, while the third pattern, cultural incorporation, is an adaptation of customs from both
native and alternate cultures. Finally the last pattern, cultural transmutation, is an alteration of
native and alternate cultural practices that creates a unique subcultural entity (Mendoza,
1989).
Mendoza (1989) also noted that immigrant individuals are generally multifaceted with
respect to the various types and dimensions of acculturation, and that it would be advisable
to describe acculturating individuals by measures of multifaceted profiles rather than a single
acculturative score. Further, acculturation reflects changes in context. For example, while
demographic factors are good predictors of group trends, they may not represent the
variability among individuals within groups and therefore, "demographic factors should be
20

restricted to providing support for the validity of instruments that are based on actual
indicators of cultural customs" (Mendoza, 1989, p. 374) .
Mendoza (1989) also developed a dimensional scale called the Cultural Life Styles
Inventory (CLSI) incorporating such items as intrafamilial language use, extrafamilial
language use, social affiliation, cultural familiarity, and cultural identification and pride.
Mendoza, through various testing on Mexican-Americans, proved that the instrument
possessed adequate content and construct validity.
As did Berry's, Mendoza's research prompted for further research. Within seven
years Mendoza's CLSI scale was further tested by a group of researchers on 1 78 Hispanics of
varying national origins (Magana, de la Rocha, Masei, H. Magana, Fernandez, & Rulnick,
1996). Respondents were recruited from a primary-care clinic. The results, using a variety of
test measures, proved the CLSI scale to be both reliable and valid. Furthermore, the
researchers investigated whether the theory of acculturation took into account biculturalism,
based on the assumption that some individuals may become fluent in both the native and the
host cultures. As a result of their investigation, Magana and his associates coined the term
bidimensional scoring that is defined as "counting the number of responses in a given direction
to create multiple scales" (p. 448) . They continued to say that it "avoids the problem of
embedding bicultural scores in the middle of the range and provides the advantage that
correlates of biculturality per se can now be investigated'' (p. 448) .
Mendoza's scale was again tested in 1996, using a Puerto Rican population (De Leon
& Mendez, 1996). The sample consisted of college students, 203 from Puerto Rico and 199
from the United States. The students were given a packet of materials including instructions
and the CLSI scale along with background information. They were interviewed in groups of
2 1

20 - 25. A factor analysis, with a varimax rotation, proved the reliability of the 29 CLSI
items that were rated on a a 5-point Llkert scale.
Mendoza's scale of 29- items measures both behavioral and attitudinal dimensions.
The 29 items in the CLSI has response options that correspond to three of Berry's four
acculturation varieties. Mendoza's work identified four acculturation varieties. Three out of
four of Mendoza's varieties correspond directly to Berry's as follows: cultural resistance
compares to Berry's separation, cultural shift compares to Berry's assimilation category; and
cultural incorporation compares to Berry's integration category. The fourth Mendoza variety
alters between ethnic and alternative cultural practices, and is considered eccentric (Magana,
et. al., 1996), whereas Berry's marginalization category rejects both.
Segmenting a Hispanic Market. In order to segment a market into distinct attitudinal
behavioral patterns and then determine grocery brand choice, Maldonado and Tansuhaj
(2002) used a blending of Berry's taxonomy and Mendoza's Cultural Life Style Inventory
(CLSI) scale. First, Maldonado and Tansuhaj (2002) used Berry's taxonomy to segment a
Latino market, and applied Mendoza's CLSI scale to empirically test, based on the
respondent's variety of acculturation, their grocery brand choice. They noted that Berry's
taxonomy provided an important structure for understanding acculturation and that brand
choice could be a part of the social adaptation process. They believed that the varieties of
assimilation, integration and separation were good indicators of consumption behavior.
They too adhered to the process of identifying multidimensional factors in acculturation
research (Mendoza, 1989), that incorporated both an attitudinal dimension of ethnic identity
and a behavioral dimension of respondents' participation in host and ethnic cultural
behavior (the CLSI scale).
22

Furthermore, Maldonado and Tansuhaj (2002) used the CLSI scale (Mendoza, 1989)
to measure varieties of acculturation, naming them using Berry's scale as noted. Maldonado
and Tansuhaj measured an individual's acculturation variety by taking the sum of the number
of responses in each variety and dividing it by the total number of responses. The highest
percentage represented the acculturation variety. For example, there are 29 item responses
possible using a 5-point Likert scale, with the upper end of the scale representing the
English/American on!J (5) and the lower end representing the Spanish/Hispanic on!J (1) options.
Let's assume a respondent answers 11 items with a "5," 3 items with a "4," 6 items with a
",3" 5 items with a "2," and 4 items with a "1." These results are then tallied as follows: the
number of 5 and 4' answers are added together, in this example 11 + 3= 14. The resulting
score represents the assimilation variety. The score of "3" represents the integration
category and stands by itself, in this example representing a total score of "6." Finally, the
scores of 2's and 1's are added together, or 5+4=9, in this example, representing the
separation category. Each of these totaled scores is divided by 29, with the resulting highest
percentage (or assimilation in this example) representing the variety of acculturation for a
specific individual. Implementing a test of Cronbach's alpha and a factor analysis, the CLSI
scale was found to be reliable exhibiting a high internal consistency (Mendoza, 1989).
Maldonado and Tansuhaj (2002) tested several hypotheses regarding grocery brand
choice as it refers to a particular variety in Berry's (1980) taxonomy. Using a mail survey
sent to Latinos living in a U.S. northwestern community, they found that the first step in the
analysis was to segment the responses by acculturation variety. Following this, they tested
predictions about grocery brand choice within each variety. Maldonado's and Tansuhaj's
findings showed that acculturation varieties are useful groupings for studying consumer
23

behavior concepts in the acculturation process. Findings indicated that respondents in the
assimilation variety chose U.S. grocery brands, as opposed to Mexican brands, 73% of the
time; compared to 48% and 32% in the integration and separation varieties respectively.
Individuals in the marginalized category were not part of the sampling frame of the study.
This study will incorporate the term "host society" as referring to that of the
dominant Anglo or White American culture and the term "ethnic society" as that of the
Hispanic culture. Also, as depicted in the Maldonado and Tansuhaj (2002) study, a Hispanic
individual's reference group is likely to be from the Anglo American society in Berry's
assimilation variety; from the Hispanic culture in the separation variety; and come equally
from the American and Hispanic culture in the integration variety.
Attitudes Toward Food Retailers
The age-old expression "Imitation is the best form of flattery," is not lost on the
food retail industry. Environmental psychologists have known for decades that the store
environment is yet another external effect capable of influencing a wide range of behaviors.
Food retailers and researchers alike study these behaviors in an effort to find ways to
increase the number of shoppers who make purchases, "for the science of shopping is, if it is
anything, a highly practical discipline concerned with using research, comparison and
analysis to make stores and products more amenable to shoppers" (Underhill, 1999, p. 17).
Hispanic consumers purchasing groceries at a particular food retailer can be
influenced by attitudes toward a food retailer (Figure 2). To understand how attitudes can
affect the type of food retailer store shopped, an attitude's definition and its components as
well as how it is measured (using a multi-attribute attitude model) should be comprehended.
Since store environment attributes are incorporated in the model, this study will provide
24

pertinent definitions of these various attributes including "atmospherics" and
"servicesc_apes." While various attributes have been duplicated in many food retail stores,
understanding which of these single or combined attributes, as shown in the previous
research of Hoffman and Turley (2002), are most significant to Hispanic consumers, who are
different in their variety of acculturation, is what this study will attempt to identify.
Attitude Defined
An attitude is defined as the "relatively lasting manner whereby the perceptions and
motives of consumers are organized toward certain market objects, events or situations"
�alters, 1974, p. 160). Solomon (2004) defines an attitude as an enduring, general
evaluation of people (as well as oneself), objects, advertisements, or issues. Martin Fishbein
(1967) developed a behavior theory with regards to the relationship between beliefs aboutan
object and the attitude toward this object. He notes:
" . . . any belief about an object can be defined in terms of the "probability" or
"improbability" that a particular relationship exists between the object of belief ( e.g.,
an attitude object) and any other object, concept, value, or goal. If the object of
belief (i.e., the attitude object) is viewed as a "stimulus" and if the object or concept
related to the object of belief is viewed as a "response," a belief statement may be
viewed as a stimulus-response association. Thus a belief about an object may be
seen as being highly related to the probability that the stimulus elicits the
response . . . " (Fishbein, p. 389).
Psychology in a large way deals with the relationship between stimulus and response, and any
stimulus in a psychological theory or experiment constitutes a part of the environment
(Mehrabian & Russell, 1974). A belief system is the sum total of an individual's beliefs about
25

an object (Fishbein, 1967). In fact, "an individual associates many different concepts with
any given attitude object" (Fishbein, p. 390). It is also important to note that once an
individual has learned a concept, he may learn a new association towards it (Fishbein, 1967).
This new evaluative response then becomes associated with the stimulus concept. How a
stimulus will be interpreted may be determined by its relationship with other events,
sensations or images (Solomon, 2004). For example, if a food consumer knows that bread is
an important source of the nutritional daily requirements for grains but then learns certain
breads contain less fat and carbohydrates, they might seek out and change the brand they
currently purchase to another one.
Attitude Components. An attitude has three components: affect - the way a
consumer feels about an attitude object; behavior - the intentions to do something with
regard to an attitude object; and cognition - the beliefs a consumer has about an attitude
object (Solomon, 2004). With respect to any object, an individual has a positive, negative, or
neutral attitude about it (Fishbein, 1967). Consumer attitudes are known to vary in intensity
and often some consumers may even tend toward neutral predisposition toward a product or
store (Walters, 1974).
Multi-attribute Attitude Models
Attitudes can be measured using a multi-attribute attitude model. The model's basic
purpose is to yield attitude scores which are significantly related to measures of a consumer's
purchase predisposition (Wilkie & Pessemier, 1973). In their seminal article on the uses and
evolution of multi-attribute attitude models, Wilkie and Pessemier (1973) note that a multi
attribute attitude model enhances an understanding of attitudinal structure. There are a
number of important components in a multi-attribute model including attributes, importance
26

and beliefs. The attributes included in a multi-attribute attitude model provide the basic
dimensionality of the model (Wilkie & Pessemier, 1973). Importance weights provide for
individual respondent differences in stress placed on various attributes (Wilkie & Pessemier,
1973). Beliefs affect the entry of brand-specific judgments and differences into the model
and this variable reflects a respondent's perceptions of the association between a particular
attribute and a given brand (Wilkie & Pessemier, 1973).
Fishbein's Attitude Model. The Fishbein model known as the most influential multi.
attribute model, measures the salient beliefs about an object, the probability that a particular
object has an important attribute, along with an evaluation of each of the important
attributes (fable 2). Essentially, an overall attitude score is computed by summing the
scores on each attribute after weighting each by its relative importance.
A Multi-attribute Attitude Model. The conceptual model for determining Hispanic
consumers' attitudes (Figure 2) will determine what store environment attributes impact a
Hispanic consumer's decision to choose a particular food retail store. In order to assist in
determining this, this study will implement a multi-attribute attitude model (fable 3) based
on Fishbein's attitude model as an instrument measuring food retailer store choice.
Psychologists (e.g., Albert Mehrabian) have studied the relationship between a store's
environment and a consumer's patronage and purchasing habits. Stores can be readily
designed, through their environments, to elicit feelings from their customers of both
pleasantness and arousal and create the positive attitudes that will lead to store choice. It is
this combination of emotions that makes people most susceptible to influence and thereby
increases both customer suggestibility and purchasing (Mehrabian, 1976), which certainly
would lead to increased favorable attitudes and sales, which every food retailer wants.
27

Store Environment
Store design is one strategic component that food retailers often view in an effort to
increase favorable attitudes and sales from their customers. Food retailers do this in hopes of
influencing consumer behavior in a positive way, and to assure that their store is positioned
to be the one their targeted consumers select when shopping for a particular food item. In
designing a store and creating an environment that is satisfying to their customers' buying
orientation, a food retail store's environment may contain a number of different store
environment attributes including atmospherics and servicescapes. Many of these attributes
are included in the Hoffman and Turley model (2002), which lists the frontstage portion of
what a consumer experiences, or sees up front, while shopping in a particular store.
Some grocery shoppers choose a food retailer due to prices offered, convenience of
their location, or both. While price and location are considered important food store
attributes, there are a number of other store environment attributes that play an important
role in where a consumer chooses to shop. Luomala (2003) noted that retail environments
embody meanings and these meanings vary according to the type of retail environment and
the type of individual. In 1974, Albert Mehrabian and James Russell developed a behavioral
framework that incorporated the environment as an object to which individuals evoked both
an emotional and a behavioral response. Their theory proposed that physical or social
stimuli in an environment directly affected the emotional state of an individual that then
influenced their behavior in their environment. Turley and Chebat (2002) noted that
physical or social stimuli in an environment will influence an individual either to explore and
stay in a particular environment (approach) or to leave and not return (avoidance). For
example, targeting the food consumer shopping for a particular type of bread, a food retailer
28

could use the environment component of odor, or the smell of fresh baked bread, that this
consumer is looking for in order to entice favorable attitudes and sales. In other words, a
food retailer can implement a marketing strategy designed to influence a consumer by
employing physical stimuli experienced at the point of purchase, thereby creating an
influential atmosphere in their exchange environments (Turley & Milliman, 2000).
To market effectively, retail managers need to understand the thought processes used
by both consumers and employees during each stage of the consumer decision process
(Hoffman & Turley, 2002). Food retailers are reminded that "a person's attitudes are the
best guide to what a person feels and believes" (Walters, 197 4, p. 172). It is equally
important to realize that the importance of an attitude object such as a product, brand or
store may be entirely different for different people. Since individuals come from different
backgrounds, they have different beliefs or attitudes about an object such as the physical -
stimuli contained in a store's environment. Retailers who are trying to devise strategies that
will appeal to different customer segments can find it useful to understand an attitude's
centrality to an individual as well as to others who share similar characteristics (Solomon,
2004). With regards to Hispanics, their attitudes are expected to be different as their variety
of acculturation changes.
Atmospherics and S enicescapes
Before a marketer can understand attitudes toward store environment variables, they
must first grasp an understanding of the store environment and all that it encompasses. A
store environment contains many sets of stimuli at varying levels that influence attitudes.
Lewison and DeLozier (1982) define a store's physical environment as a combination of the
tangible elements of appearance reflected in the way land, buildings, equipment, and fixtures
29

are combined for the convenience and comfort of both customers and retailer. They note
that the perceived atmosphere the retailer creates and the store's psychological environment
are equally important (Lewison & DeLozier, 1982) .
From the study of the store environment over the years, a new term "atmospherics"
has evolved. Atmospherics is defined as "the conscious designing of space to create certain
effects in buyers. More specifically, "it is the effort to design buying environments to
produce specific emotional effects in the buyer that enhance his purchase probability"
(Kotler, 1974, p. 50) . It is the conscious planning of atmospheres that contributes to the
buyer's purchasing propensity (Kotler, 1974) .
Other researchers have described atmospherics in a similar fashion. Bitner (1 992)
refers to atmospherics as the physical design and decor elements. Turley and Milliman
(2000) refer to atmospherics as "the intentional control and structuring of environmental
cues." (p. 193) . Years later, Hoffman and Turley (2002) describe atmospherics as "the
intentional control and manipulation of environmental cues" (p. 34) .
The seminal study by Bitner in 1992 provided a new term for researchers that tied
external and internal environmental cues together and is referred to as "servicescapes."
Servicescapes provide a visual metaphor for an organization's total offering (Bitner, 1992) .
Specifically, servicescapes refers to a "framework that describes how the built environment
(i.e., the manmade, physical surroundings as opposed to the natural or social environment)
affects both consumers and employees in service organizations" (Bitner, 1992, p. 2) . More
specifically, Bitner added the dimension of the human contact to the cues being researched.
Bitner notes that firms want to encourage approach behaviors between employees and
30
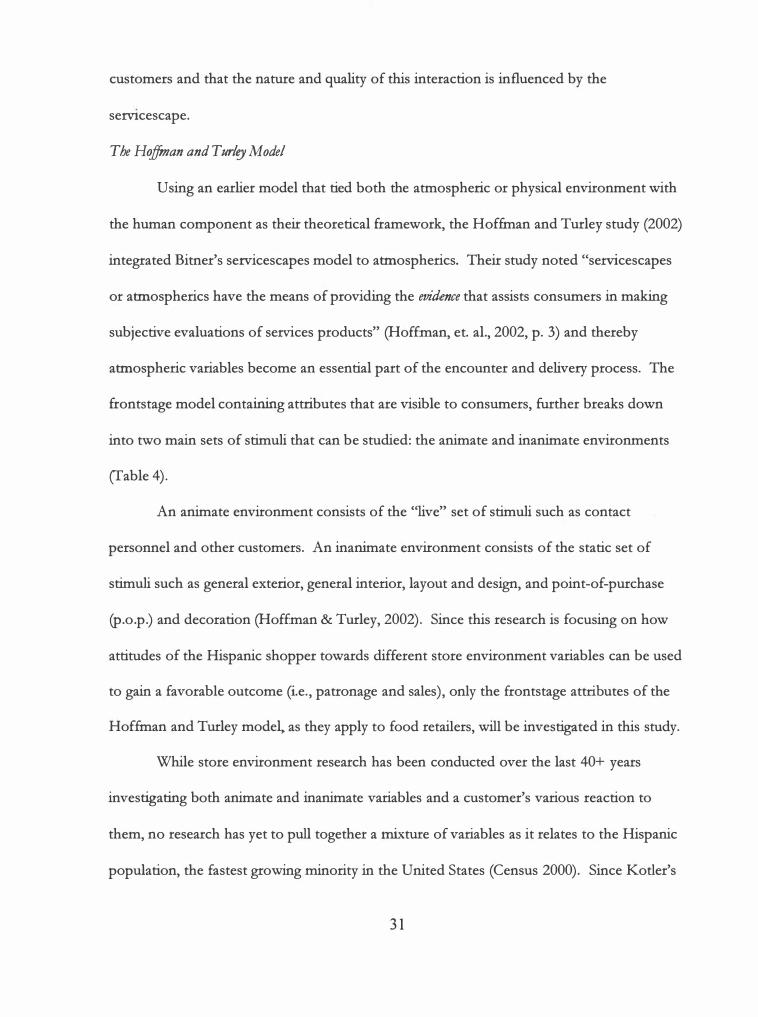
customers and that the nature and quality of this interaction is influenced by the
servtcescape.
The Hoffman and Turley Model
Using an earlier model that tied both the atmospheric or physical environment with
the human component as their theoretical framework, the Hoffman and Turley study (2002)
integrated Bitner's servicescapes model to atmospherics. Their study noted "servicescapes
or atmospherics have the means of providing the evidence that assists consumers in making
subjective evaluations of services products" (Hoffman, et. al., 2002, p. 3) and thereby
atmospheric variables become an essential part of the encounter and delivery process. The
frontstage model containing attributes that are visible to consumers, further breaks down
into two main sets of stimuli that can be studied: the animate and inanimate environments
(Table 4).
An animate environment consists of the "live" set of stimuli such as contact
personnel and other customers. An inanimate environment consists of the static set of
stimuli such as general exterior, general interior, layout and design, and point-of-purchase
(p.o.p.) and decoration (Hoffman & Turley, 2002). Since this research is focusing on how
attitudes of the Hispanic shopper towards different store environment variables can be used
to gain a favorable outcome (i.e., patronage and sales), only the frontstage attributes of the
Hoffman and Turley model,. as they apply to food retailers, will be investigated in this study.
While store environment research has been conducted over the last 40+ years
investigating both animate and inanimate variables and a customer's various reaction to
them, no research has yet to pull together a mixture of variables as it relates to the Hispanic
population, the fastest growing minority in the United States (Census 2000). Since Kotler's
3 1

definition of atmospherics in 1973, researchers have shown how both atmospheric and
servicescape stimuli combine to influence the behavior of individuals. For example, the
extensive study by Turley and Milliman (2000) provided a summary of 60 published studies
that showed statistically significant relationships between consumer behavior and the store
environment.
A number of researchers have implemented their independent or combined sets of
"cues" or variables in order to show retailers how to create environments that will help them
achieve their purpose. While many researchers incorporate the same definition for
atmospherics or servicescapes, they are not always measured in the same way. Further, some
researchers alter their research terminology. For instance, they refer to the particular
environmental stimuli as "variables," '.'cues," or "store attributes." The term "variables" is
defined as "manifestations or concrete, measured expressions of these aspects that we can
count, categorize, or otherwise assign numerical values to" (Dooley, 2001, p. 60). Cues are
defined as "a characteristic or dimension, external to a person, which can be encoded and
used to categorize a stimulus object" (Eroglu &Harrell, 1986, p. 351). For the purposes of
this study, the term attribute, which is the characteristic of an object (Solomon, 2004), will be
used.
Food Retail Store Choice
Changing consumers' attitudes about their store choice would be an advantage to
any food retail store hoping to gain new customers. Food retailers are often so standardized
in their merchandise and store layout that shoppers have difficulty distinguishing between
them and therefore may not be as particular. There have been a number of studies
specifically regarding supermarket or grocery food retail store choice. Smith and Sanchez
32

(2003) found some shoppers chose a store due to its location or prices offered, while
Zarkada-Fraser and Fraser (2002) reflected that shoppers chose a supermarket food retailer
based on whether it was foreign or domestically owned. Other patronage research (Darden
& Ashton, 1974, 1975; Sullivan et. al., 1997) studied shopping orientations including
lifestyles, store attribute preferences and outshopping preferences. Relating current research
to food retailers' particular problems is important, especially as these stores hope to alter
attitudes and therefore shopping behaviors of a new market segment.
Where Hispanics Shop For Food
The Food Marketing Institute's (FMI) U.S. Hispanics: Insights Into Grocery Shopping
Preferences and Attitudes, 2002, found that as a group, U.S. Hispanics want fresh, high quality
products; Hispanic products; and bilingual store employees, signage and product packaging
Qaketic, 2002). Another study by FMI, Trends in the United States: Consumer Attitudes and the
Supermarket, 2002, noted that Spanish-Preferred Hispanics shopped at supermarket food
retailers 4.4 times per month, while English-Preferred Hispanics shopped there 6.1 times per
month Qaketic, 2002). Both groups also shopped at bakeries and butcher shops. The study
found the total average number of trips among all store types for Spanish-Preferred
Hispanics was 18.1 per month, for English-Preferred Hispanics was 16.1 per month, and for
Non-Hispanic shoppers, it was just 8.8 trips per month-half the number of trips Spanish
Preferred and English-Preferred made Qaketic, 2002).
Based on the above studies, it is easy to see why the Hispanic market segment
continues to increase in importance especially in regard to food retailer choice. As
previously mentioned, the economic clout of the Hispanic market is expected to swell to
$926.1 billion by 2007 as Hispanics' buying power grows at a rate almost three times as fast
33

as that of whites, according to the Selig Center for Economic Growth at The University of
Georgia (Humphreys, 2002). Buying power can be defined as the total personal income of
residents that is available for spending on goods and services, after taxes (Solis, 2002). The
growth of Hispanic buying power is propelled by many factors including their growing
population. Hispanic spending habits reflect the differences in their per capita income,
wealth, demographics, and culture, compared with those of the average U.S. consumer
(Humphreys, 2002) . . For instance, despite their lower average income levels, Hispanic
households spend a greater percentage of their total annual expenditures on groceries (10. 7
%) versus that of their non-Hispanic counterparts (7.9 %) (Humphreys). Additional
research based on demographic and psychographic data has shown that as their
socioeconomic status increased, Hispanics' shopping behaviors became less differentiated
from those of non-Hispanics (Eckman, et al., 1997).
Many food retailers, such as supermarket chains, where Hispanic consumers
purchase products at higher than normal proportions, are interested in understanding
Hispanic shopping behaviors. As previously mentioned, acculturation varieties appear to be
one reason some Hispanics shop smaller food markets, or bodegas, while others patronize
larger stores that offer better prices (Howell, 1999). Seeing the overall sales potential, some
supermarket food retailers are offering more choices for the Hispanic consumer by opening
new store concepts geared towards the Hispanic market while some food retailers are simply
introducing or enhancing their ethnic food selections. For example, Albertson's Super Saver
in California, Marsh Supermarkets Savin$ Mercado located in Indiana, and Publix' S abor in
Florida, are all new concepts that have opened recently (Clark, 2003; Toothman, 2005). One
supermarket, Safeway, reaches the Hispanic market where they live, in their own language
34

and is also changing the way they merchandise (Vavra, 2001). Safeway believes that seeing a
richer more colorful store and implementing creative displays for holidays are some of the
store design components that Hispanics want to see (Vavra, 2001 ).
These new food retail concepts as well as some of the current store concepts in
various markets warrant new investigations of how acculturation plays a role in determining
food retailer store choice. To effectively reach a particular market, food retailers should rely
more on empirical research in order to gain an understanding of how to target a particular
group in relation to its acculturation into the mainstream culture. This understanding may
mean positioning the organization to fit the marketplace rather than bending the
marketplace to fit the organization (Segal, et. al., 1994). Positioning is when "a brand must
differentiate itself, if possible, through tangible product attributes and then communicate
that differentiation positively" (V akratsas et.al., 1999, p. 5).
Some supermarket food retailers are positioning themselves to gain a greater share of
the market, often at the expense of smaller or regional grocers, and are teaching others
through their successes. Their strategy is a simple one: "food drives frequency, frequency
drives sales, and sales drive the bottom line" (Schulz, 2002, p. S2). In order to increase the
number of consumer shopping trips, thereby raising sales, the retail category of general
merchandisers have copied this idea by placing grocery items in their own stores. Yet,
despite the unprecedented growth of these general merchandisers, or supercenters,
consumers still make more shopping trips to supermarket food retailers ( e.g., Kroger,
H.E.B., Albertson's) than to any other type of retail store by more than a three-to-one ratio
over mass merchandisers (Schulz, 2002). This fact, along with the knowledge that Hispanics
make more grocery trips per week compared to non-Hispanic shoppers Oaketic, 2002),
35

emphasizes the importance for all food retailers to determine what single, or combination of,
store environment attributes this target market finds important and how Hispanic
consumers' attitudes might be influenced by these attributes when determining their store
choice.
An overall understanding of the needs of the Hispanic shopper is a significant factor
to food retailers who are constantly trying new ideas including merchandising, signage or
even bilingual employees, as a way to increase communication to and sales from their target
market Gaketic, 2002). Food retailers have an opportunity to reach the loyal Hispanic
shopper through segmenting their overall market just as Alb_ertson's, Publix and Marsh
supermarkets have recently demonstrated.
Research Questions
How will the variety of acculturation (separation, assimilation, integration, and
marginalization) of Hispanic shoppers affect their attitudes toward an assortment of store
environment attributes? In addition, how will variety of acculturation affect their store
choice of food retailer?
Hypotheses
Understanding how Hispanic consumers' acculturation variety influences their food
retailer store choice would be a helpful marketing tool for food retailers. This study will
adopt the methods implemented by Maldonado and Tansuhaj, which incorporated Berry's
taxonomy and Mendoza's Cultural Life Styles Inventory as an acculturation measurement
tool.
36

Van'eties of Acculturation and Attitudes toward Food Retailers
The findings of previous research suggest that Hispanics exhibiting different varieties
of acculturation will reflect diverse attitudes and behaviors. Because each variety of
acculturation is based on a measure of multifaceted profiles (Mendoza, 1989), one would
expect that a Hispanic individual in the assimilation variety of acculturation has attitudes
towards a food retailer's store attributes different from that of a Hispanic individual in a
different variety of acculturation. For example, a Hispanic individual who reflects the
assimilation variety of acculturation is not expected to portray the same attitudes as a
Hispanic in either the integration or separation variety since different varieties of
acculturation result from different cultural strengths of identity along with other measures.
Since each variety of acculturation represents individuals who reflect diverse characteristics
but are similar as a whole, the resulting attitudes regarding which environmental components
are important to each acculturation variety are also expected to reflect different measures.
Therefore, based on the strength of attitude toward store environment attributes, as
measured by the multi-attribute attitude model, it is hypothesized that:
H1 Hispanic consumers' attitudes towards store environmental attributes of the
primary food retail store type shopped will differ by variety of acculturation.
Varieties of Acculturation and Food Retail Store Type Choice
The Maldonado and Tansuhaj's (2002) study found that different acculturated
groups of individuals selected either "American" or "Hispanic" store brands. It is assumed
that similar results will be found for a Hispanic's food retail store type choice. That is,
Hispanics will group together with those who have characteristics similar to themselves and
select the same type of food retailer. For example, it is assumed that a Hispanic reflecting an
37

assimilation variety of acculturation is more likely to choose a type of food retail store
normally associated with an "American" culture, such as a supercenter or a supermarket,
more often than a Hispanic, neighborhood grocery store which is more likely to be selected
by Hispanics identified as separated. Hispanic individuals in the integration variety are likely to
select American or Hispanic neighborhood food retail store types equally. Integrated
Hispanics will select a store depending upon which culture they are associating with at the
time, and may even shop at both. Thus, it is hypothesized that:
H2 Hispanic consumers' primary food retail store type choice is dependent upon
variety of acculturation.
Attitudes toward Food Retailers and Food Retail Store Type Cho ice
It has been shown in past research (Fishbein, 1967) that attitudes are learned and
that beliefs about an object (such as one's environment) are viewed in terms of the stimulus
response associated with it. People from different cultures have different experiences and
value structures and their cultural differences may have significant impact on the evaluative
component of attitudes (O'Guinn, et. al., 1986). In other words, attributes that people
consider to be important in selecting an object (product, brand or store) are different based
on beliefs that stem from the culture in which they were raised. Understanding how the
Hispanic consumer, based on his or her level of acculturation, communicates the
significance of various store environment attributes through his or her primary food retail
store type choice is thus far an unanswered question. It is hypothesized that:
H3 Hispanic consumers' attitudes towards store environmental attributes will differ
by the type of primary food retail store shopped.
38

CHAPTER 3
METHODOLOGY
The conceptual model (Figure 2) reveals a number of different components that will
determine a Hispanic consumer's attitudes toward a food retailer based on their variety of
acculturation and their food retail store choice. Each of these components contributes to
the empirical testing of the hypotheses (Figure 3). Specifically, the following three
hypotheses will be tested: H1 Hispanic consumers' attitudes toward store environmental
attributes of the primary food retail store type shopped will differ by variety of acculturation;
H2
Hispanic consumers' primary food retail store type choice is dependent upon variety of
acculturation; H3 Hispanic consumers' attitudes towards store environmental attributes will
differ by the type of primary food retail store shopped.
The Survey Instrument
Based on the studies of Mendoza (1989), and Hoffman and Turley (2002), a survey
instrument (Appendix, Figure 7) was developed using Likert scales, the most widely used
method of measuring attitudes (Hodge & Gillespie, 2003), and open-ended questions.
The survey contained four parts and included of a total of 85 questions (Appendix,
Figure 8). Parts A and B (fable 5) contained store environment questions, Part C contained
acculturation questions and a few demographic questions, while Part D contained the
remaining demographic questions.
Separate English and Spanish versions of the survey were developed using
translation and back translation. The written English version was created first. Following
this, a bilingual translator was hired to convert the English survey into a Spanish survey.
39

Then, another bilingual translator received the Spanish survey and then "back translated" the
survey to English without seeing the original English version as a guide.
It was during the translation into the Spanish version that the survey was initially
revised to insure clarity of choices. Following the translation into Spanish, the layout of the
survey was slightly altered to create a "booklet" type survey that would allow for a
respondent to fill out the instrument with greater ease. Two survey booklets were created,
one in English and one in Spanish. Two different colors were used for these two versions.
The questions were identical, excluding language.
Part A: Importance of Store Environmental Attributes
Questions developed from the list of frontstage attributes as noted in the Hoffman
and Turley model (fable 5) were used for both Parts A and B (Appendix, Figure 8). The
first set of 21 questions used in Part A pertained to the importance of various attributes
when shopping a food retail store. Attribute importance was measured using a 5-point Likert
scale (1= not important; 5 = very important). Using an odd numbered scale ensured a
neutral point, which is important for attitude measurement. In addition, a column for
"Don't Know/Not Applicable" was included in case a statement did not apply. For
example, parking would be "Not Applicable" if the respondent rode a bus.
Part B: Food Store Shopped and Perception of Store Environmental Attributes
Respondents were asked three questions regarding the store shopped most often for
groceries. They were: 'What one store do you shop most frequently for groceries?' 'How
often each week do you shop at this store?' and 'On average, how much do you spend on
groceries each week at this store?' (Appendix, Figure 8). Then they were asked to answer a
second set of 21 questions, based on the Hoffman and Turley model (fable 5, column 3)
40

pertaining to the actual store location where the respondent shopped most frequently and
the perception of the extent to which the store the respondent shops has the attributes.
These questions pertaining to the perception were identical to those in Part A, excluding the
verbal description of the rating scale. Again, 5-point Likert scales were implemented;
however, the scale changed from strongly disagree (1) to strongly agree (5) . Once again, a
column for "Don't Know /Not Applicable" was included in case a statement did not apply.
Finally, three questions related to grocery shopping that were the same as those in the first
set except the secondary, instead of the primary food retailer, were listed. If respondents
answered they did shop another food retailer when purchasing groceries, they were asked to
list the name of the food retailer, how often they shopped at that store each week and the
average amount spent on groceries.
Part C: Variety of Acculturation
Respondents were asked a series of 29 questions derived from the Cultural Life Style
Inventory scale (Mendoza, 1989), 2 questions on the varieties of acculturation taxonomy
(Berry, 1980), and 2 questions regarding national origin and strength of ethnic identity
(Appendix, Figure 8). A 5-point Likert scale was used along with an option for "Don't
Know /Not Applicable" for the Cultural Life Style Inventory (CLSI) scale. The first
dimensions of the CLSI which dealt with intra- and extra-familial language used the scale of:
Spanish only (1); more Spanish than English (2); Spanish and English equally (3); more
English than Spanish (4); and English only (5). The remaining dimensions of the CLSI
which included culture and ethnicity used the scale of: Hispanic only (1 ); more Hispanic than
American (2); Hispanic and American equally (3); more American than Hispanic (4);
American only (5).
4 1

To determine Berry's (1980) variety of acculturation taxonomy, two questions were
asked using a 5-point rating scale of 1 (strongly disagree) to 5 (strongly agree), with an
additional column of "Don't Know /Not Applicable." To determine national origin and
strength of ethnic identity, two questions were asked. The question on national origin, by
using the same format as that asked in the Census 2000, asked respondents, 'What is your
national origin?' and then asked respondents to check either 'Cuban; Mexican, Mexican
'American, Chicano; Puerto Rican; or other Spanish/Hispanic/ Latino' and finally asked
respondents to print the name of the group in a space provided just below the fourth item.
The question regarding strength of ethnic identity was rated on a 5-point Likert scale;
strongly disagree (1) to strongly agree (5), with an additional column of "Don't Know/Not
Applicable."
Part D: Demographic Information
Eleven demographic questions were asked for descriptive analysis purposes
(Appendix: Figure 8). Questions included respondents' gender, age, income, education,
number of people in household, as well as city and zip code information. In addition,
respondents were asked questions pertaining to where they were born, how long they had
lived in the U.S., how often they visited their home country and the amount of schooling
received in their home country.
Pre-Testing of the Survey
A pre-test of the survey was implemented in an effort to determine if statements
needed clarification or revision and, if possible, to reduce the number of questions asked.
Surveys were distributed to 7 4 Hispanic individuals for pre-testing in two cities located in the
southeastern United States to obtain both English and Spanish speaking respondents. The
42

respondents were predominantly personal friends, acquaintances, Hispanic church group
members, and the researcher's family members. Two bilingual survey assistants were hired
to facilitate survey distribution and completion. The survey assistants were trained on proper
surveying techniques, were familiar with the survey and were able to answer questions from
the respondents in either English or Spanish. The survey was administered during a three
week period in March 2005. Respondents were screened with two questions: whether they
were Hispanic and whether they were the primary grocery shopper in their family. The
respondents who qualified were given a choice of either the English or the Spanish version
of the survey, which contained the same questions. While the respondents were filling out
the survey, the time it took for the survey's completion was noted in order to aid in the
planning of the implementation of the main survey scheduled during a later time frame. The
time involved to take the survey ranged from 10 to 40 minutes. Following its completion,
the survey assistants checked the survey for completion through quick scanning.
Pretest Results
Of the 7 4 surveys distributed and returned, 44 surveys contained no missing
information. Few observations contained "Don't Know/Not Applicable" or neutral type
responses to questions. The above noted 44 surveys were used for item analysis and
reliability testing. Approximately half the surveys were answered in each language: 24 in
English and 20 in Spanish.
Since the sample was non-random, it may have introduced some bias and will limit
the external validity of the pretest. However, the pretest was mainly conducted to test the
reliability of the instrument using Cronbach's alpha and to determine if there were
misleading or confusing questions. Parts A, B and C, which contained Likert scales, were
43

tested independently for reliability. In addition, an item analysis within each part was
implemented in order to possibly diminish the number of survey questions asked while still
maintaining high reliability.
The Cronbach's alpha coefficients in the three parts were high (Part A - .865950;
Part B - .902820; and Part C - .880763) indicating high reliability for each scale. The item
analysis of the Likert scales did not reveal that any of the first 20 questions should be
removed.
Based on personal responses and statistical data, the survey instrument was revised
to clarify any misleading or confusing questions. The only question that was dropped was
the open-ended question (#21) at the end of the list of store characteristics (Parts A and B)
where respondents were asked to fill in an ""other characteristic." Most often, this question
was left blank, or filled out incorrectly. Also, some responses did not apply to store
characteristics, but rather to prices and other store attributes. Changes were made to both
the English and the Spanish booklets in time for the actual test of the survey in San Antonio,
Texas in mid-April 2005.
The Sample and Data Administration
The revised survey instrument was administered during Fiesta®, an annual 10-day
Hispanic festival located in San Antonio, Texas, during April 2005. This annual 10-day
festival included museum exhibits, parades, a carnival, strolling musicians and many other
events scheduled daily. The festival commission estimated over 3.5 million visitors attended
the various events with crowds at the final two parades estimated at 250,000 each.
After discussions with Fiesta® commission personnel and various committee
members were held, several events were pre-selected for survey implementation, based on
44

estimated crowds and the likelihood of obtaining responses. These events included the
Paseo Del Rio Children's Festival, Fiestas Fantasias-Market Square, Battle of Flowers
Parade®, Night in Old San Antonio (NIOSA); King William Fair & Parade; and the Fiesta
Flambeau Night Parade.
Due to the number of required completed surveys (approximately 300) for adequate
survey results, three interviewers were hired in order to assist in the survey collection.
Different time frames of various festival events ensured adequate coverage. Two
interviewers were bilingual. In addition to asking the required filter questions, all
interviewers were trained to answer questions from respondents if an item was unclear.
A multi-step process was used to randomly select respondents at the various events
and to ensure that potential candidates were _the proper sample. Potential candidates were
visually identified as Hispanic, and after the introduction, filter questions were used to screen
out inappropriate survey candidates. Filter questions included whether they lived in the U.S.,
self-identified themselves as Hispanic, and were the household member responsible for
selecting the food retailer where groceries were purchased. Then, if this household member
was present, he or she was asked to fill out the survey. The survey respondents were found
sitting along a parade route, strolling along during an outdoor event, or standing in line
during a festival event. Respondents filled out the survey on-site, and were encouraged to
complete the survey in exchange for a festival pin. The pins used as incentives were
considered collectors' items and were enthusiastically accepted by the survey respondents.
The Paseo Del Rio Children's Festival was held on the first Saturday of the festival.
The survey was administered during the hours of 11 AM to 2 PM. This event, designed for
children and their families, included live entertainment by children, face painting, story
45

telling, interactive games, and a moon bounce. The event was held at the River Walk, an
open air/outdoor location along the San Antonio River, next to the Rivercenter Mall. A
total of 35 surveys were collected.
Fiestas Fantasias-Market Square took place downtown and was sponsored by the San
Antonio Parks Foundation. The events included more than 30 food booths and live
entertainment from five stages. This event was surveyed during the final Thursday and
Saturday of the festival. A total of 25 and 68 surveys respectively, were collected.
The Battle of Flowers Parade was held on the final Friday of the 10-day event and
included just over 200 segments consisting of floats, high school and college marching
bands, downs, and equestrian units. The 2.6-mile parade route wound throughout the
downtown area of San Antonio. Spectators purchased reserve seating, brought their own
seats, or stood along the parade route. The theme of the parade was "Entertainment Live in
2005" and has continued, since its inception in 1891, to honor the heroes of the Alamo and
to commemorate the Battle at San Jacinto where Texas won its independence from Mexico.
The parade was held in the middle of the day beginning approximately at noon and took
over three hours to complete. In honor of the festival, schools and many businesses were
closed and therefore this event was well attended. A total of 123 surveys were collected.
A Night in Old San Antonio (NIOSA) took place in the historic downtown village of
La Villita. Visitors gathered to enjoy more than 240 elaborately decorated food and drink
booths and more than a dozen nonstop entertainment stages representing the diverse
culture� and customs of the city. This event supported the many programs of the San
Antonio Conservation Society. A total of ten surveys were collected.
46

The King William Fair and Parade event held in the King William historic district
included a parade, four stages of musical entertainment, and local artisan craft booths. This
event was held the final Saturday of the 10-day event. A total of 26 surveys were collected.
The Fiesta Flambeau Night Parade was held the final Saturday of the 10-day event
and celebrated its 58th edition themed "Through the Eyes of a Child." This parade has been
the largest illuminated march in the nation. This parade followed the same 2.6-mile route
taken by the Battle of Flowers parade held the day before. Again, spectators purchased
reserve seating, brought their own seats, or stood along the parade route. The one hundred
eighty parade elements included floats, equestrian groups, clowns, various military and drill
teams, and university and high school bands. The parade lasted over three hours. A total of
61 surveys were collected.
The crowds at the various events described above were large, ranging from several
hundred to several hundred thousand. Respondents were friendly, enthusiastic and willing
to take the survey. Noting that San Antonio is a border town, it was assumed that some
potential respondents might be suspicious of our approach and the entire survey process.
This was not found to be the case, as very few people refused to answer the survey.
Data Analysis
Due to the multiple components that are part of this research, several preliminary
procedures were executed prior to the multivariate analyses. In addition, it was determined
whether any assumptions should be made about the data, and which statistical procedures
should be implemented (Dooley, 2001).
47

Preliminary Procedures
Prior to executing any statistical data analysis, a researcher generally initiates
preliminary procedures such as screening the data O ohnson, 1998) and determines whether
any computations or grouping of the data is required. For purposes of this study, the data
were screened for missing or incorrect information regarding the observations. Following
the data screening, additional steps were performed in order to better categorize or group
responses. First, mathematical results were obtained from the multi-attribute attitude model
for determining food retailer choice using the survey information (Appendix, Figure 8, Part
A, #1 - 20; Part B, #2 - 21). These results established the attitudes towards food retail
stores. Second, a new variable was created that grouped respondents' primary food retail
store choice (Appendix, Figure 8, Part B, #1) observations into four categories: warehouse
clubs, supercenters, national/ regional supermarkets, and neighborhood/Hispanic grocers.
In addition, another variable was created that grouped respondent's secondary food retail
store choice (Appendix, Figure 8, Part B, #22). Third, both Berry's (Appendix, Figure 8,
Part C, #1 & 2) and Mendoza's (Appendix, Figure 8, Part C, #5 - 33) scales for variety of
acculturation were tabulated. Then the results obtained were separated into their respective
varieties of acculturation (assimilation, integration, separation and marginalization). Finally,
the demographic information (Appendix, Figure 8, Part C, #3 - 4; part D, 1 - 11) was
tabulated and combined with some of the above information to more clearly describe the
Hispanic consumers in our study as well as their food shopping habits and expenditures.
Multivariate Ana!Jses
Following the preliminary procedures, a number of multivariate methods of analyses
were implemented due to several data structures and relationships investigated in the data
48

set. The multivariate methods implemented included principal component analysis, factor
analysis, fuzzy cluster analysis, nearest neighbor discriminant analysis, and multivariate
analysis of variance (MANOV A). The principal component analysis, factor analysis, fuzzy
cluster analysis, nearest neighbor discriminant analysis were employed with the 29 items of
Mendoza's Cultural Llfe Styles Inventory (CLSI) scale to identify and verify the varieties of
acculturation into which an observation fell.
Principal Component Analysis versus Factor Analysis. A principal component
analysis (PCA) is a tool that can be used to reduce the number of variables into a smaller
number of dimensions (linear combinations of original variables), while retaining as much of
the information (variation) as possible (Hintze, 2004). A calculation of this uncorrelated set
of variables (a linear combination of original variables) is then ordered so that the first few
retain the majority of the variation present in all of the original variables (Hintze, 2004).
One way of assessing the construct validity of a measure, such as the Mendoza scale,
is by implementing a statistical method known as factor analysis (Dooley, 2001). By
implementing a factor analysis (FA), response variables were placed in a subset, with each
subset consisting of variables that were more highly related to others within the same subset
than to those in other subsets Oohnson, 1998). Factor analysis will assess construct validity;
however, it will not lead to data reduction.
PCA, unlike FA, will always yield the same solution from the same data apart from
arbitrary differences in the sign (Hintze, 2004, Johnson, 1998). In addition, in PCA no
assumptions, such as multivariate normality, are made with regards to the data O ohnson,
1998). However, in FA, assumptions such as the factors are independently and identically
distributed with a mean of zero, are made (Hintze, 2004; Johnson, 1998). While the PCA
49

scores were implemented to reduce the number of variables into a smaller number of
factors, the results of the factor analysis were reviewed for interpretation of the data.
Fuzzy Clustering. By implementing a fuzzy cluster analysis, one hopes to obtain
some predictability with regards to how many varieties of acculturation can be classified. In
other words, does the Mendoza scale accurately predict the number of varieties of
acculturation wherein a Hispanic individual may lie? In order to verify which clusters
observations belonged to, a Fuzzy Cluster Analysis procedure was implemented. Fuzzy
clustering generalizes partition-clustering methods (such as k-means and medoid) by
allowing an individual to be partially classified into more than one cluster (Hintze, 2004;
Seaver, Triantis, & Reeves, 1999). In regular partition clustering, such as Wards, each
individual is a member of only one cluster. For example, if a researcher has K clusters, he or
she may want to define a set of variables that represent the probability that object "t" is
classified into cluster "k" (Hintze, 2004). Using partition-clustering algorithms, such as
Wards, one of these values will be one and the rest will be zero, thus resulting in an
. individual observation being classified into one and only one cluster. However, in fuzzy
clustering, the membership is spread among all the clusters in the sample. When reviewing
the results, a researcher can learn whether and how strongly an observation is classified into
one or more clusters. While an advantage of fuzzy clustering is that it does not force every
object into a specific cluster, fuzzy clustering's disadvantage is that there is much more
information to be interpreted (Hintze, 2004). For instance, equal membership into several
clusters may signal that the observation is an outlier or a uniquely different observation, or
an observation that may have diverse acculturation profiles, as in this research.
50

Nearest Neighbor Discriminant Analysis. A nearest neighbor discriminant analysis
enables a researcher to predict the population from which an observation is most likely to
have come Oohnson, 1998). In other words, it is used to predict what group, or variety of
acculturation, an individual comes from (Hintze, 2004). In addition, a nearest neighbor
discriminant analysis makes no distributional assumptions of normality. The nearest
neighbor discriminant -analysis procedure was implemented using SAS software. In addition,
a subset of variables, using a stepwise procedure, was found for both the Mendoza and the
fuzzy methods to determine if this smaller set of variables could also discriminate as well as
or better than the initial 29 employed.
When conducting a nearest neighbor discriminant analysis, a researcher should be
able to determine, or estimate, the probabilities of correct classifications of new observations
the discriminant rule (or classification scheme) obtained from the analysis employed
Oohnson, 1998). Of the initial 29 variables, a jackknife method for the discriminant rule
obtained was implemented in order to determine the best discriminators. Jackknife, or
cross-validation, estimates are nearly unbiased estimates of the true probabilities of correct
and incorrect classifications Oohnson, 1998). Once these groups or varieties were validated,
it was possible to determine whether the Mendoza method was statistically supported and
whether its process of classifying individuals into a particular variety of acculturation should
then be used to further investigate the remaining data.
Hypotheses Testing
Once the varieties of acculturation were determined, the hypotheses were set to test
for significance. For this purpose, based on the structure of the data, two different tests
were used. Hypotheses one and three employed a MANOV A test; hypothesis two employed
5 1
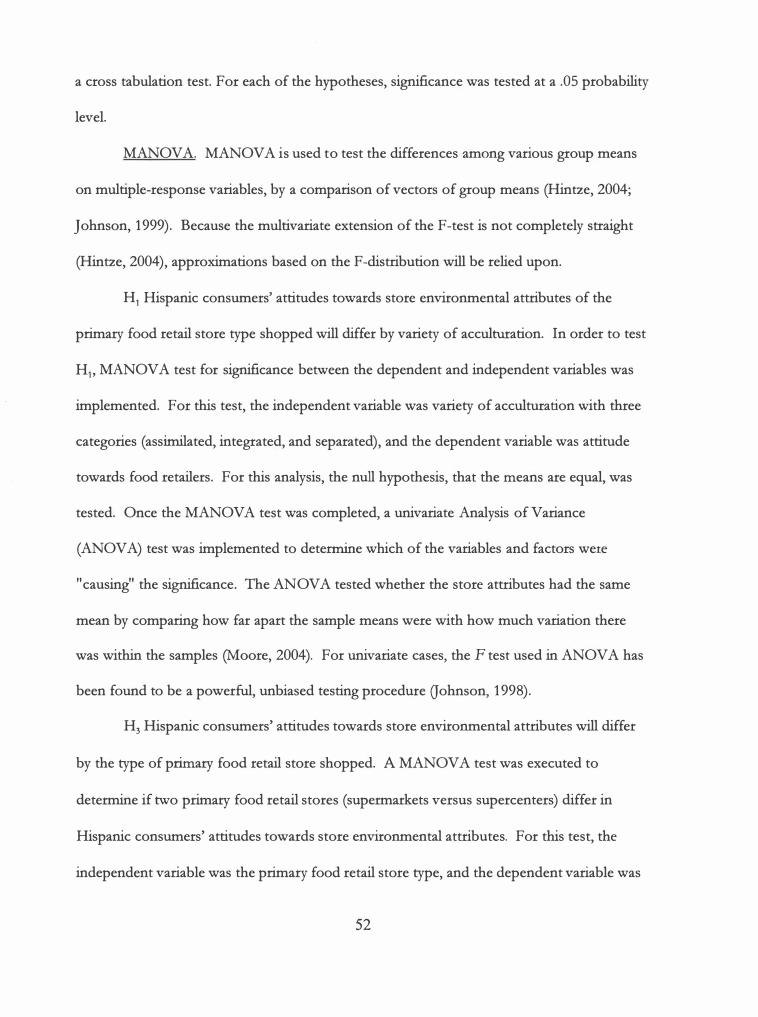
a cross tabulation test. For each of the hypotheses, significance was tested at a .OS probability
level.
MANOV A. MANOV A is used to test the differences among various group means
on multiple-response variables, by a comparison of vectors of group means (Hintze, 2004;
Johnson, 1999). Because the multivariate extension of the F-test is not completely straight
(Hintze, 2004), approximations based on the F-distribution will be relied upon.
H1 Hispanic consumers' attitudes towards store environmental attributes of the
primary food retail store type shopped will differ by variety of acculturation. In order to test
H1 , MANOVA test for significance between the dependent and independent variables was
implemented. For this test, the independent variable was variety of acculturation with three
categories (assimilated, integrated, and separated), and the dependent variable was attitude
towards food retailers. For this analysis, the null hypothesis, that the means are equal, was
tested. Once the MANOV A test was completed, a univariate Analysis of Variance
(ANOVA) test was implemented to determine which of the variables and factors were
"causing" the significance. The AN OVA tested whether the store attributes had the same
mean by comparing how far apart the sample means were with how much variation there
was within the samples (1-foore, 2004). For univariate cases, the F test used in ANOVA has
been found to be a powerful, unbiased testing procedure Qohnson, 1998).
H3 Hispanic consumers' attitudes towards store environmental attributes will differ
by the type of primary food retail store shopped. A MAN OVA test was executed to
determine if two primary food retail stores ( supermarkets versus supercenters) differ in
Hispanic consumers' attitudes towards store environmental attributes. For this test, the
independent variable was the primary food retail store type, and the dependent variable was
52

attitude towards food retailers. For this analysis, the null hypothesis, that the means are
equal, was tested. The univariate ANOV A test was implemented to determine which of the
variables and factors were "causing" the significance.
Cross Tabulation. In addition to the MANOVA test, a cross tabulation was
implemented to test for statistical significance between the categorical variables of primary
food retail store type and variety of acculturation. The resulting chi square test was
investigated to determine if a relationship exists between these two variables (Moore, 2004).
H2
Hispanic consumers' primary food retail store type choice is dependent upon
variety of acculturation. A cross tabulation determined if there is statistical significance
between the two variables: primary food retail store type and variety of acculturation.
Upon completion of the survey implementation, the various analyses described
above were executed. Following this, the analysis results were obtained for further
investigation. In addition, any other pertinent information revealed by the study will be
discussed as well.
53

CHAPTER 4
RESULTS
A total of 348 surveys were collected during the festival event. The survey responses
were coded and entered into an Excel file. A careful check of the entries was made to
ensure the responses were correctly entered. Following data entry, the Excel file was
imported into the Number Cruncher Statistical Systems (NCSS) software program, release
version 2004, for further statistical analysis.
Data Screening
Prior to the actual data analysis, a screening of the data should take place in order to
determine if the data contains missing information, whether there is normality of the
variables or whether outliers occur Gohnson, 1998). In addition, the data should be
screened for any other unusual or pertinent information that might reveal either
abnormalities or latent traits. Following the data screening, the researcher must determine
how best to handle observations that contain any of these data issues CT ohnson, 1998; Lohr,
2003) and whether any assumptions should be made with regards to the data (Dooley, 2001).
Missing Data
Of the 348 surveys collected, 11 of the responses failed to identify the food retail
store shopped. These surveys were dropped from the analysis since it would not be possible
to determine where the respondent shopped for groceries and how or whether this affected
the accuracy of responses for Part B.
The remaining 337 surveys were further screened, using NCSS software, to evaluate
whether they contained the necessary data to calculate a respondents' variety of
acculturation, their attitudes towards store attributes and their food retail store choice. Of
54

the 33 7 observations remaining, 35 observations contained missing information in Parts A -
C. Since the occurrence of missing data appeared to be random, estimates for the missing
information were obtained using a multivariate method. Specifically, a multivariate
imputation method, the EM algorithm (Little & Rubin, 1987), which assumes multivariate
normality, was calculated. These 35 observations were then combined back with the other
302 responses for further analysis.
An item analysis was performed on the 33 7 surveys to test the reliability of the
revised instrument. Parts A (importance of store environmental attributes), B (perception of
store environmental attributes) and C (variety of acculturation), were tested independently
for reliability. The Cronbach's alphas in the three parts were high (Part A - .857305; Part B -
.9028450; and Part C - .871801) again indicating high reliabilities of the scales.
Computations and New Variables
Of the 33 7 surveys, computational procedures were undertaken to compute the
scores of the multi-attribute attitude model and the Mendoza model. Using responses for
Parts A and B, the multi-attribute attitude model scores were calculated. Average scores for
each of the 20 store environmental attributes were determined following the individual
computation of scores.
The primary stores shopped, as named in question B-1 , were identified as belonging
to one of four groups of stores: supercenter (1 ), supermarket (2), neighborhood grocer (3),
and warehouse club (4). A new variable (Sl ) was created to identify the store group. During
this procedure it was discovered only one respondent shopped a neighborhood market and
only one respondent shopped a warehouse club as their primary food store. These
observations were not included in the remaining analyses since they would not significantly
55

contribute to the understanding of Hispanic food shoppers. In addition, a variable (S2)
representing the secondary store shopped, using the same store group values (1-4), was also
created.
The variety of acculturation for each of the 335 observations was then computed
using Mendoza's previously described method (5 and 4 = assimilation; 3 = integration; 2 and
1 = separation). The results revealed 16 "ties." That is, when the Mendoza measurement
was computed, two varieties of acculturation had the same resulting score. These ties were
either between assimilated and integrated scores, or integrated and separated scores. Since a
specific variety of acculturation score could not be obtained, as per the previously noted
computational procedures ( e.g., Magana, et. al., 1996), these 16 surveys were eliminated from
further analysis. Since the acculturation variables were critical to several hypotheses in the
study, these 29 variables underwent further data screening. Also, for analysis purposes, a
new variable was created. The "Agroup" variable represented the actual acculturation variety
as _follows: assimilation (1), integration (2), and separation (3). There were no scores
obtained for marginalization.
Overall Demographic Analysis. Upon further examination of the 319 observations,
it was noted that some of the responses contained missing demographic information, such as
education or income level. These observations were included in the analysis, since the
demographic information was not included for hypotheses testing. Of the surveys collected
from Hispanic food shoppers, an overall summary of respondent characteristics was
revealed. When comparing the survey results, 97% preferred to answer in English and
requested the English version, while 3% requested the Spanish version. Eighty-six percent
of the respondents were female, while 14% were male. The average age of all respondents
56

was 41. Seventy two percent of the respondents were from the San Antonio area; and 91 %
were born in the United States. Those not born in the U.S. were predominantly from
Mexico (58%) and have lived in the U.S. for an average of 19 years. Respondents identified
their national origin as follows: .01 % were Cuban; 58% were in the Mexican, Mexican American,
Chicano category; .02% were Puerto Rican and 40% identified themselves as other Spanish/
Hispanic/ Latino. On average, households had five members with three adults and two
children residing in them. The highest percentage of respondents (32%) had completed 9 -
12 years of schooling; the second highest percentage (31 %) had completed 1 - 2 years of
college. In addition, the highest percentage of respondents (21 %) had an average total
annual household income of $30,000 - $44,999; the second highest percentage (18%) had an
average total income of $15,000 - $29,999.
Univariate Normality and Outliers
Of the remaining 319 observations, the data screening revealed that none of the
acculturation variables were univariate normal and the data contained 50 outliers or uniquely
different observations. Data containing a univariate normal distribution for every possible
set of selected values are said to have a multivariate normal distribution O ohnson, 1998);
however, the converse is not true. That is, univariate normality does not guarantee
multivariate normality, but multivariate normality does guarantee univariate normality. The
data entries were reexamined visually to verify that no recording errors were made. None
were found. Robust methods have been found to decrease or completely remove the
influence of observations that are outliers (Hintze, 2004), and preliminary data screening
hinted at their existence. For instance, the EM algorithm, used in the estimation of the
study's missing data, is a robust technique which uses weights that are inversely proportional
57

to how "outlying" the observation is and modifies the means and covariances weights
(Hintze, 2004).
Dont Know/NotAppkcabk
Upon further screening of the data, it was noted that 59 observations contained one
or more "Don't Know/Not Applicable" responses. Of these, 42 surveys had this response
category in the acculturation variety measure, and 17 surveys had this response category in
the store attribute measure. Past research (Krusnick, et. al., 1998; Lohr, 2003) has shown
that further probing of respondents who selected the "Don't Know" option should be
undertaken. The same could be applied to "Not Applicable" responses. Since further
probing was not available due to the structure of the survey implementation, it is unknown
how respondents might have altered their answers. That is, if these particular observations
had been answered only using the 5-point Likert scale, the resulting scores might have
changed the outcome. For example, on observation #16 there was a total score of 14 for
assimilation, 12 for integration and 3 "Don't Know/Not Applicable" responses. Dependent
upon how the "Don't Know/Not Applicable" responses would have changed with further
respondent probing or even re-wording of some of the questions, respondents' total score
reflecting their acculturation variety could have been affected.
Similarly, of the 17 surveys reflecting "Don't Know /Not Applicable" responses to
questions on store attributes, it was determined that the resulting scores also could have
been affected. For instance, using the reflected score of "9" for the "don't know/ not
applicable" response would have greatly inflated the scores of the multi-attribute attitude
model and could have changed, for example, the response on whether a respondent felt
bilingual signage or music was important.
58

It is worthwhile to note that as the surveys were executed, some additional
information emerged through incidental conversations that occurred with survey assistants.
For instance, several respondents remarked that parents or grandparents were deceased and
therefore the question(s) regarding the language spoken did not apply. In addition, some
respondents could not recall whether a store had bilingual signs or not. Thus, in both cases,
the respondent selected the response option of "Don't Know /Not Applicable." However,
not every respondent verbally expressed his or her reasons for selecting the option "Don't
Know/Not Applicable." Several respondents also remarked that the question regarding
language spoken to spouse did not apply to respondents who were single. The same could
be said for respondents not having children regarding the questions pertaining to language
spoken to children, language taught to children, and names given to children. Had further
probing of these 59 respondents been possible, the resulting total score may possibly have
changed the outcome of the leading acculturation variety or the attribute score. Due to the
inability to know whether the respondent should have answereded "Don't Know" or "Not
Applicable" or even whether the respondent, due to a lower education level, was simply
more likely to take the less cognizant approach (Krosnick, et. al., 1996), these observations
were not included in the overall data analysis (fable 6), but rather were evaluated separately
for descriptive purposes.
Variety of Acculturation
Since the variety of acculturation must be determined prior to hypotheses testing,
both the Berry and Mendoza scales for determining the variety of acculturation that had
previously been calculated were reevaluated using a number of different procedures. These
59

procedures incorporated various analyses including a chi square analysis, principal
component analysis, factor analysis, and fuzzy clustering.
Implementing the Berry variety of acculturation measurement first, the following
results were found. Of the 260 respondents, none were identified as assimilated, 91 % were
identified as integrated, and .01 % was identified as separated. In addition, 7% could not be
classified since these respondents answered in the neutral category, "neither agree nor
disagree," for one or both questions. Thus, of the observations that were classified, the
study sample appears to be represented by three varieties of acculturation, with heavy
domination in the integration variety (fable 7)�
It is worthwhile to mention that the Berry scale was altered from its original
"yes/no'' response options to that of a 5-point Likert scale in order to test its reliability and
maintain the same scale as the majority of the survey questions. In hindsight, the scale could
have been a four-point scale in order to properly determine the "yes/no" categories. This
issue was not detected during the pretest survey, as no respondents selected the neutral
response of "neither agree nor disagree."
During the survey implementation, a number of respondents were offended by the
two questions (Appendix, Figure 8, Part C, #1 and 2) relating to the Berry scale; while they
identified themselves as Hispanic, they felt they were already integrated into the American
society, and although they called themselves "Hispanic" they considered themselves
"American" first. This may be the reason why such a vast number of respondents (40%)
identified their origin as "other Spanish/Hispanic/ Latino" (Appendix, Figure 8, Part C, #3)
but did not respond to the additional question for specifically identifying a particular group.
60

The Mendoza scale revealed that among the 260 respondents, 44% were assimilated,
49% were integrated, and 8% were separated, with no respondents identified in the
marginalization variety of acculturation. The Mendoza results reflected three varieties of
acculturation with the heaviest domination in the integration variety (fable 7).
Chi Square Anafysis
As was reflected in Table 7, there was a noticeable difference between the results of
the Berry and Mendoza computations for the variety of acculturation. To test the
relationship between the two scales, a chi square analysis was implemented between Berry ,
and Mendoza's scale of measurement. A resulting chi square score of 2.81 (df=4, p= .59) led
to the conclusion that no relationship between the two was found.
Of the 260 observations, there were a number of respondents (7%) who could not
be classified into an acculturation variety using the Berry scale due to a neutral response on
the 5-point Likert scale. Since the Mendoza scale reflected a greater uniformity of responses
using the previous computations (5 and 4 = assimilation; 3 = integration; 2 and 1 =
separation), all 260 observations could be implemented. Using all the observations better
facilitated this study's investigation of determining the effects of Hispanic consumers' variety
of acculturation on food retail store type choice and on attitudes toward food retail stores.
Therefore, the Mendoza scale identified varieties of acculturation and were used for further
analyses. Given that the varieties of acculturation (assimilation, integration, separation and
marginalization) are comparative to Mendoza's CLSI scale, this study will continue to use
these terms when referring to the different varieties of acculturation. A series of specific
statistical analyses (Figure 4) were conducted to select the variety of acculturation items to be
used in this study.
6 1

Pn"ncipal Component Ana/ysis
Regardless of whether a PCA or an FA is performed, the number of components or
factors to retain must be determined. Many researchers ( e.g., Hintze, 2004; Johnson, 1998)
agree that the best PCA method is either Kaiser's (1960) method (using eigenvalues > 1) or
Jolliffe's (1972) method (using eigenvalues > .7). This method, of the number of eigenvalues
to retain, along with scree tests results (Cattell, 1966) is tl_ie most effective way to determine
the number of factors.
In this study, the PCA resulted in four factor scores containing an eigenvalue above
1.0 and six containing an eigenvalue above .7 (fable 8). However, as the scree plot (Figure
5) of the eigenvalues reflected, there is not much difference in the values past the point of
the third factor. Therefore, three factors were retained for purposes of further analysis.
The PCA factor structure/loadings summary (fable 9) was made up of dimensional
structures previously identified by Mendoza (1989). Only those PCA factor scores of .40 or
higher are included (regardless of their sign). For example, Factor 1 was comprised of all 29
variables representing the dimensions of intra-family language; extra-family language; social
affiliation and activities; cultural familiarity and activities; and cultural identification and
pride. Factor 2 was comprised of 16 variables representing the same five dimensions, and
Factor 3 was comprised of intra-family language. The PCA scores were saved and then
analyzed in the fuzzy cluster analysis.
Factor Ana!Jsis
Factor analysis is a statistical method useful for assessing the construct validity of the
Mendoza varieties of acculturation. A robust estimation was used in order to adjust for any
outliers in the data. In addition, the number of factors specified was three, based on the
62

results from the principal component analysis. A varimax rotation was implemented in order
to improve the ability of interpreting the "meaning" of each factor (Hintze, 2004). The
results of the rotated factor analysis (fable 10) revealed the underlying influential variables
that made up each factor. Only those FA factor scores of .40 or higher are included
(regardless of their sign). Factor 1 was made up of five items that are: intra-family language,
extra-family language, social affiliation and activities, cultural familiarity and activities, and
cultural identification and pride; Factor 2 consisted of the same five items; and Factor 3
consisted of intra-family language use, specifically language used with parents and
grandparents. Factors have distinct groupings based on factor loadings, which leads to
construct validity.
Fuzzy Clustering
It was important to investigate if the Mendoza scale accurately predicted the number
of varieties of acculturation of potential groups. To test this, a fuzzy cluster analysis was
implemented. The three factor scores from the robust (unrotated) principal component
analysis were used. Again, by using a robust method, the influence of outliers is removed.
As another means to verify the possible number of clusters, the resulting three factor
scores were plotted into two different 3D scatter plots (Figures 6 & 7). Based on these
visual portrayals of both the Mendoza varieties of acculturation (Figure 6) and the Fuzzy
acculturation groups (Figure 7), it appeared there were indeed three clusters present in the
survey. In addition, there appeared to be a number of uniquely different scores that might
influence where an observation fell with regards to a particular cluster. Using the PCA
scores, the fuzzy cluster report (fable 11) revealed the location of the medoid (most
centrally location) of the nearest hard cluster configuration.
63

Upon a close review of the analysis results, the three fuzzy clusters revealed that a
number of observations, whose scores fell below . 70, might belong to more than one cluster.
A sample cross-section of the result (fable 12) illustrates that observation 31 may have
belonged to Cluster 1 as well as its identified cluster, Cluster 2. The actual number of
observations that were classified into more than one cluster from the data was 36.
Nearest Neighbor Discriminant Ana!Jsis
Using the nearest neighbor discriminant analysis procedures in SAS, jackknife scores
were obtained for both the fuzzy cluster and Mendoza method. The analysis revealed that
224 out of 260 observations (86.2%) were correctly classified for the fuzzy clustering
method (fable 13). The results for the Mendoza clustering method reflected that 206 out of
260 observations (79.2%) were correctly classified. Finally, a stepwise procedure for both
the Mendoza and the fuzzy clustering methods was implemented to determine if a smaller
set of variables could also discriminate as well as or better than the initial 29 employed. The
results for the fuzzy clustering method re�uced the number of variables to 14 with a
resulting score of 86.5% correctly classified, while the results of the Mendoza clustering
method reduced the number of variables to 9 with a resulting score of 86.2% correctly
classified (fable 13).
Several steps were taken to determine whether to use (1) the fuzzy cluster or
Mendoza method and (2) 29 items or a reduced number of items. First, it was found that,
based on 29 items, the fuzzy results of the jackknife gave slightly better results (86.2%) than
those of the Mendoza method (79.2%). However, the fuzzy clusters do not represent the
same combination of scores (5 and 4 = assimilation; 3 = integration; 2 and 1 = separation).
In analyzing the Mendoza jackknife method, it produced a greater percentage of correctly
64

classified with 9 items (86.2%) than with 29 items (79.2%). While the result of the Mendoza
method was stronger with fewer variables, the computations for how the Mendoza scale is
calculated should not be altered. In addition, since the data were not based on a nationwide
sample, these results cannot be generalized to all populations. That is, the results might
change in different demographic markets. Finally, when testing whether there was a
relationship between the Mendoza varieties of acculturation and the fuzzy cluster result, a
cross tabulation report revealed a chi square value of 147.74, (df =4,p = .0000) showing
there was a strong relationship between the two. For these reasons, 29 items entered in
classifying three varieties of acculturation using the Mendoza method.
Demographic Characteristics "by Mendoza's Variety of Acculturation
A table revealing the breakdown of the demographic differences of the Hispanics in
the survey was created (fable 14) . The overall results revealed the respondent's average age
was 42, and the total number of people in their household was 4 (3 over 1 8; 1 under 1 8) .
The education level overall was evenly split for 9 - 12 years (33%), and 1 -2 years of college
(33%) representing the majority of respondents. The single highest income level category
was $30,000 - $44,999 with 23% of the respondents represented. The percentage of all
Hispanics born in the USA was 91 %.
The results for the assimilated group revealed the respondent's average age was 42,
and the total number of people in their household was 4 (3 over 1 8; 1 under 1 8) . The
education level was nearly evenly split for 9 - 12 years (30%) , and 1 -2 years of college (31 %)
representing the majority of respondents. The single highest income level category was
$30,000 - $44,999 with 24% of the respondents represented. The percentage of assimilated
Hispanics born in the USA was 97%.
65

The results for the integrated group revealed the respondent's average age was 41,
and the total number of people in their household was 3 (2 over 18; 1 under 18). The
education level overall was nearly evenly split for 9 ·- 12 years (34%), and 1-2 years of college
(36%) representing the majority of respondents. The single highest income level category
was $30,000 - $44,999 with 23% of the respondents represented. The percentage overall of
Hispanics born in the USA was 91 %.
The results revealed that separated Hispanics were the youngest of all varieties
(average age was 35) with the largest household size of 4 (3 over 18; 1 under 18). The
majority of this demographic group reached an education level of 9 - ·12 years (47%). The
single highest income level category was $15,000 - $29,999 with 47% of the respondents
represented. The percentage of Hispanics born in t�e USA were 97% for assimilated, 93%
for integrated and 40% for separated individuals.
· Hyp·otheses Testing
The testing of hypotheses. required implementation of several statistical methods
including MANOVA, ANOVA, and cross tabulation, using NCSS software. The
significance level was determined at a .05 probability level. In addition to these methods, the
data underwent further investigation in order to describe whether interesting patterns could
be learned from the survey responses.
Hypothesis 1
H1 Hispanic consumers' attitudes towards store environmental attributes of the .
-
primary food retail store type shopped will differ by variety of acculturation.
In order to determine whether Hispanic consumers' attitudes toward store
environmental attributes differ by variety of acculturation, it must be determined whether a
66

relationship exists between the two variables by testing for statistical significance. Using a
significance level of .05, the null hypothesis that there is no relationship between the two
variables was tested by implementing a MANOVA test. The results (fable 15) of the test
statistics including Wilks' Lamda, Hotelling-Lawley Trace, Pillai's. Trace, and Roy's Largest
Root revealed probability levels above .05. Therefore, the null hypothesis that no
relationship existed between varieties of acculturation and attitudes was accepted. That is,
that the three varieties of acculturation, assimilation (1 ), integration (2) and separation (3)
groups being compared were not different in their attitudes towards their primary food
retailer. A review of the different means and standard deviations for the 20 attributes (Table
16) revealed that there was not much difference between the three varieties of acculturation
groups.
Although the MAN OVA results show no difference between the groups, the
AN OVA showed that several items appeared to reveal a difference. When reviewing the
results of the individual variables (fable 17) or univariate tests for significance, the resulting
ANOVA scores revealed three of the variables did obtain probability levels below .05.
These were: bilingual signage, knowledgeable employees, and bilingual employees. When
reviewing the differences in the means (fable 16) for these three variables, the results for
signage showed that separated Hispanics rated it more positively with a mean of 15.95 than
either integrated (14.94) or assimilated (12.82) individuals. The results for knowledgeable
revealed that integrated Hisp·· r°Lics rated it more positively with a mean of 22.56 than either
separated (21.55) or assimilated (20.98) individuals, while the results for bilingual revealed
that integrated Hispanics rated it more positively with a mean of 17.60, than either separated
(17.15) or assimilated (14.73) individuals.
67

Hypothesis 2
H2 Hispanic consumers' primary food retail store type choice is dependent upon
variety of acculturation.
In order to determine whether Hispanic consumers' primary food retail store type
choice is dependent upon variety of acculturation, it must be tested whether a relationship
exists between the two categorical variables. A cross tabulation report revealed a chi square
score of .76 . (df = 2,p =.68), and led to the acceptance of the null hypothesis that there was
no relationship between the two variables (variety of acculturation and primary food retail
store type choice) . It indicated that the three acculturation groups were not different in the
type of primary food retail store shopped.
Hypothesis 3
H3 Hispanic consumers' attitudes towards store environmental attributes will differ
by the type of primary food retail store shopped.
In ord€r to determine whether Hispanic consumers' attitudes toward store
environmental attributes will differ by the type of primary food retail store shopped, it must
be tested whether a relationship exists between the two variables. Using a significance level
of .05, the null hypothesis that there is no relationship between the two variables was
evaluated by implementing a MANOV A test. The results (Table 1 8) of the test statistics
including Wilks' Lamda, Hotelling-Lawley Trace, Pillai's Trace, and Roy's Largest Root
revealed probability levels below .05. These results led us to reject the null hypothesis that
no relationship existed between these two variables. That is, of the two store types being
compared, supercenter (1) and supermarket (2), Hispanic consumers' attitudes toward store
environmental attributes were different. A review of the different means and standard
68

deviations for the 20 attributes (fable 19) revealed there were several differences in attitudes
towards store environmental attributes between the two store types.
Upon further review of the results of the individual variables (fable 20) or univariate
tests for significance, the resulting ANOVA scores revealed eight attributes did obtain
probability levels below .05. These were: easy parking (p = .0063); convenient location (p =
.0021); outside appearance (p = .0166); shopping area (p = .0096); pleasant interior (p =
.0049); organized layout (p = .0272); friendly employees (p = .0006); and knowledgeable
employees (p = .0008).
When reviewing the differences in the means (Table 19) for each of the eight
attributes, the results revealed that supermarket shoppers had more positive attitudes
towards all variables than supercenter shoppers. Specifically for each variable the table
revealed the following means for supercenter versus supermarket: easy parking (14. 92 vs.
18.49); convenient location (18.08 vs. 21.05); outside appearance (15.32 vs. 18.20); shopping
area (16.20 vs. 19.06); pleasant interior (17.20 vs. 20.15); organized layout (19.12 vs. 21.31);
friendly employees (19 .20 vs. 22.32); and knowledgeable employees (18. 96 vs. 22.09). In
conclusion, the store groups do differ on a number of the variables, resulting in an overall
high power and a significant test result Oohnson, 1998).
Additional Hypotheses Tests
Since the MANOVA tests for Hypotheses one and three relied upon multivariate
normality of the data, an additional test, the two-sample Hotelings T2 employing a
randomization procedure, was executed to confirm that the outcome of the hypotheses was
correct. A two-sample Hotelling's T2 is the multivariate extension of the common two
group Student's t-test (Hintze, 2004). Randomization tests (provided in NCSS software) do
69

not rely on the assumptions of equal variances and multivariate normality (Hintze, 2004).
Randomization tests compute a test statistic on original data and uses repeated samples,
looking at the percent of times they exceed what the original test statistic reported.
Significance was tested at a .05 probability level. When reviewing the results of the
unequal variance-covariance randomization test (fable 21) for hypothesis one, the
randomization test reflected test scores of p = .1020 for variety 1 and 2; p = .2020 for variety
1 and 3; and p =.5130 for vanety 2 and 3, thus accepting the null hypothesis that the group
means for all response variables are equal and confirming the results of the MAN OVA test
for hypothesis one.
When reviewing the results of the unequal variance-covariance randomization test
(fable 22) for hypothesis three, the randomization test reflected a test score of p =.21 26,
· thus accepting the null hypothesis that the group means for all response variables are equal
and disconfirming the results of the MAN OVA test for hypothesis three. However, upon
further analysis of the individual variables (fable 23), the same variables as in the AN OVA
results above (fable 20), also revealed significance levels below .05. Again these variables
are: easy parking (.0063), convenient location (.0021), outside appearance (.0166), shopping
area (.0096), pleasant interior (.0049), organized layout (.0272), friendly employees (.0006)
and knowledgeable employees (.0008). Further tests on the data itself may reveal specifically
why this discrepancy occurs between the MAN OVA and randomization tests, although it is
expected that multicolinearity, lack of multivariate normality, or outliers/uniquely different
observations are some of the possible reasons.
Finding a Significant Attribute Subset. Since good results were revealed with some
of the individual variables, a McHenry's Select Algorithm method was employed in order to
70

seek a subset of variables that would provide a maximum value of R-Squared. This
algorithm first seeks the best single variable, and then seeks the best pair of variables by
keeping the best and removing the worst (Hintze, 2004). This switching process continued
with the data set until the algorithm could no longer improve the R-squared value (Hintze,
2004). Various model sizes were entered until an optimal model resulted (fable 24) . Each
of the models, with various combinations of attribute variables was tested until a maximum
set of variables could be found. A subset of 14 variables with a resulting R-squared value =
0.1382, was found. These 14 variables were represented by the following attributes: easy
parking, convenient location, outside appearance, pleasant interior, pleasant odors, color
scheme, well-lit interior, organized layout, wide aisles, product shelf space, friendly
employees, knowledgeable employees, sufficient assistance, and crowded w / shoppers. The
Cronbach's alpha for the 14 variables was .8916, indicating high reliabilities of the scales.
Since the original set of 20 variables revealed a discrepancy between the MANOV A and
randomization tests of significance, the new subset of 14 variables will be used to determine
if a better result for both tests can be found.
Retesting Hypothesis Three. To retest hypothesis three, it must be again determined
whether Hispanic consumers' attitudes towards store environmental attributes will differ by
the type of primary food retail store shopped. It must be tested whether a relationship exists
between the two variables. Again using a significance level of .05, the null hypothesis that
there is no relationship between the two variables was evaluated by implementing a
MANOVA test. The results (fable 25) of the test statistics including Wilks' Lamda,
Hotelling-Lawley Trace, Pillai's Trace, and Roy's Largest Root revealed probability levels
below .05. These results led us to reject the null hypothesis that no relationship existed
7 1

between these variable groups. That is, that the two store types, supercenter (1) and
supermarket (2) groups being compared were different in their attitudes towards their
primary food retailer. A review of the different means and standard deviations for the 14
attributes (fable 26) revealed that there were differences in attitudes towards seven store
attributes between the two store types. However, these seven attributes are not the same as
those previously reported in Table 20.
Upon further review of the results of the individual variables (fable 27) or univariate
tests for significance, the resulting ANOVA scores revealed that seven attributes exhibited
probability levels below .05. These were: easy parking (p = .0063); convenient location (p =
.0021); outside appearance (p = .0166); pleasant interior (p = .0049); organized layout (p =
.0272); friendly employees (p = .0006); and knowledgeable employees (p = .0008).
When reviewing the differences in the means (fable 26) for each of the seven
variables, the results revealed that supermarket shoppers had a more positive attitude
towards each variable than supercenter shoppers. Specifically for each variable the table
revealed the following means for supercenter versus. supermarket: easy parking (14. 92 vs.
18.49); convenient location (18.08 vs. 21.05); outside appearance (15.32 vs. 18.20); pleasant
interior (17.20 vs. 20.15); organized layout (19.12 vs. 21.31); friendly employees (19.20 vs.
22.32); and knowledgeable employees (18.96 vs. 22.09). As previously noted, the store
groups do differ on a number of the variables, resulting in an overall high power and a
significant test result.
When reviewing the results of the unequal variance-covariance randomization test
(fable 28) using the selected 14 attributes for hypothesis three, the randomization test
reflected a test score of p =.0434, thus rejecting the null hypothesis that the group means for
72

all response variables are equal and confirming the results of the MAN OVA test for
hypothesis three.
Additional Findings
Additional investigations of the data revealed a number of important findings that
food retailers can readily use to gain ideas for their own markets. These findings included
how Hispanics ranked store attributes overall as well as by individual variety of acculturation,
and how expenditures differed between Hispanics overall and their individual varieties of
acculturation.
Overall Store Attribute Rankings. Based on the overall average, following the model
calculations, all store attribute responses (from all 20 attributes measured) were tallied by
rank (Table 29) with "1" as the most important. The top five overall respo�ses were friendly
employees (22.0), knowledgeable employees (21 .7), organized layout (21 .0), convenient
location (20.7) and pleasant odors (20.4) . The top responses changed for those consumers
who shopped a supercenter. A well-lit interior .(20.4) was the most important store attribute
followed by pleasant odors (19.3), friendly employees (1 9.2), organized layout (1 9.1), and
knowledgeable employees (1 9.0) . The top were the same as "overall," although the averages
were different: friendly employees (22.3), knowledgeable employees (22. 1 ), organized layout
(21 .3), convenient location (21 .0) and pleasant odors (20.6). The least important attribute for
all three categories was pleasing background music.
Assimilated Hispanics Store Attribute Rankings. Assimilated food shoppers
identified many of the same store attributes (Table 30) as most important as those previously
noted in the overall category above, although the order is slightly different. Overall,
assimilated shoppers identified the top five store attributes as most important: friendly
73

employees (21.6) were ranked first, followed by knowledgeable employees (21.0), convenient
location (20.9), organized layout (20.8) and pleasant odors (20.3). The rank order was the
same for supermarket shoppers with different means: friendly employees (21.9) were ranked
first, followed by knowledgeable employees (21.5), convenient location (21.2), organized
layout (20.9) and pleasant odors (20.4). Those assimilated shoppers who visited supercenters
wanted an organized layout (20.0), a well-lit interior (19. 7), pleasant odors (19.2), friendly
employees (18.8) and convenient location (18.2). Pleasing background music was ranked the
least important for both "overall" and supercenter shoppers, while bilingual store signage
ranked last for supermarket shoppers.
Integrated Hispanics Store Attribute Rankings. Overall, food shoppers identified as
integrated ranked knowledgeable employees (22.6) as most important followed by friendly
employees (22.4), organized layout (21. 7), sufficient assistance (20.8) and pleasant odors
(20.7) (fable 31). For integrated Hispanics who shopped supercenters, the top five store
attributes were knowledgeable employees (21.4), well-lit interior (21.1), friendly employees
(20.5), wide aisles (19.6), and sufficient assistance (19.5). For integrated food shoppers who
shopped supermarkets, the top five store attributes were knowledgeable employees (22.7),
friendly employees (22.6), organized layout (22.0), pleasant odors (21.0) and finally, sufficient
assistance (21.0). Pleasing background music was the least important for both overall (13.0)
and supermarket (12.8). Supercenter shoppers, however, ranked easy parking as least
important (12.7).
Separated Hispanics Store Attribute Rankings. Overall, food shoppers identified in
the separated acculturation variety (fable 32) ranked knowledgeable employees (21.8),
friendly employees (21.7), convenient location (20.8), pleasant odors (20.6) and pleasing
74

inside environment (20.4) as the most important store attributes. Supercenter shoppers
ranked pleasant odors/smell (25.0), convenient store location (21 .7), sufficient assistance
available from employees (21 .7), pleasant interior (20.7) and outside appearance (20.7) as the
most important store attributes. Supermarket shoppers found friendly employees (22.9),
knowledgeable
Employees (22.4), convenient location (20.7), pleasant interior (20.3) and organized
layout (20.1 ) as the most important store attributes. Pleasing background music was ranked
least important for "overall" and supermarket (13.9), while bilingual signage (5.7) was ranked
least important for supercenter shoppers.
Overall Shopping Trips and Expenditures. All the Hispanics surveyed in the study
shopped their primary food store at least once a month and at most seven days a week. They
spent as little as $5.00 and as much as $315.00 each week. On average, Hispanics shopped
twice a week and spent $102.56 at their primary store (fable 33). Forty two percent of all
Hispanic shoppers in the survey also shopped a second store, spent an additional $53.89 and
shopped there 1 . 1 times per week. Of the shoppers who selected a supercenter (10%) as
their primary food store of choice, Hispanics in the study shopped there 1 .8 times per week
and spent $122.00. While 48% did not shop elsewhere, supercenter shoppers who did
choose supermarkets ( 40%) as their secondary food store, shopped there 1.2 times per week
and spent an additional $61 .25 per week. The vast majority (90%) of Hispanics shopped
supermarkets as their primary food store, shopped twice a week and spent $100.43. While
59% of supermarket consumers did not shop a secondary store, of those who did, a different
supermarket was the leading store of choice (19%) with all Hispanics in the study. Hispanics
made 1 . 1 trips per week to their secondary supermarket and spent an additional $45.20.
75

Shoppers who selected a supercenter as their secondary store of choice, shopped there more
often (1.3 times per week) and spent more money ($62.71) than any of those who selected
any of the other secondary food store options.
Assimilated Hispanics Shopping Trips and Expenditures. Hispanics identified as
assimilated in the study shopped 1.9 times per week and spent $99.80 at their primary store
(fable 34). Forty two percent of all assimilated shoppers also shopped a second food store,
shopped there on average once a week and spent an additional, $62.42. Those assimilated
Hispanics (9%) whose primary food store was a supercenter shopped there an average of 1.6
times per week and spent $125.00. Supercenter shoppers' secondary store choice was a
supermarket with 30% selecting it as their food store. Supercenter consumers spent an
additional $43.13 at a supermarket, shopping the!e 1.2 times per week. The vast majority
(90%) of assimilated Hispanics shopped supermarkets as their primary food store 1.9 times
and spent $97 .28 per week. While 60% of assimilated supermarket shoppers did not shop a
secondary store, of those who did, supermarkets were the leading store of choice (19%).
Supermarket consumers shopped on average once per week at a different supermarket and
spent an additional $54.55.
Integrated Hispanics Shopping Trips and Expenditures. Hispanics identified as
integrated shopped their primary food store 2.1 times per week and spent $105.86 (Table
35). While only 38% shopped a second food store, of those who did they shopped an
average of 1.3 times per week and spent an additional $49.79. Survey results revealed 10%
of integrated shoppers selected a supercenter as their primary food store. These stores were
shopped an average of 1.9 times per week with $125.77 being spent. For supercenter
shoppers, their only secondary choice was a supermarket with 50% choosing to shop there.
76

Supercenter shoppers made an average of 1.4 trips per week to a supermarket and spent
$70.00. The remaining 90% of integrated shoppers selected a supermarket as their primary
food store. These shoppers spent $103.51 per week while making an average of 2.2 trips per
week. Integrated supermarket shoppers' second food store of choice was a supercenter with
1 .5 trips per week resulting in an average $53.57 being spent.
Separated Hispanics Shopping Trips and Expenditures. Hispanics identified as
separated spent an average of $93.89 while making 1 .8 trips per week to their primary food
store (fable 36) . An overwhelming 70% of this group of shoppers also visited a secondary
food retailer and spent an additional $44.38 making .9 trips per week. Fifteen percent of
separated shoppers chose a supercenter as their primary food store and spent $88.33 while
making an average 1 .5 trips per week. Supercenter consumers shopping a second store
(66%) were evenly split between shopping a supermarket (33%), where they spent $70.00 on
average and made .3 trips per week, and shopping a warehouse club (33%), where they spent
$80.00 and made one trip per week. The majority of separated Hispanics consumers (85%)
selected a supermarket as their primary store of choice and spent $95.00 while making 1 .8
trips per week. Supermarket consumers shopping a secondary store chose a different
supermarket as their store of choice and spent an additional $33.75 while making .8 trips per
week.
''Don 't Know/ Not Applicable" Data Evaluation
When a data screening report was obtained, using NCSS software, the 59
observations revealed that only one of the acculturation variables were univariate normal
(language of the music listened to). There were no outliers.
77

Of the 59 respondents, 85% were female. The average total household consisted of
3 people, with 2 over the age of 18 and 1 under 18. The average education was 1-2 years of
college and the average income for the households in this segment of the survey was $45,000
- $59,999.
On average, these 59 respondents shopped 1.9 times per week and spent $100.26 at
their primary store (fable 37). Forty one percent of these respondents also shopped a
second store once a week and spent an average of $35.34. The shoppers, who selected a
supercenter (15%) as their primary food store of choice, shopped 1.5 times per week and
spent $103.06. While 78% did not shop elsewhere, of those supercenter shoppers who did,
supermarkets were their only store of choice, with .8 additional trips per week made and
$13.75 spent. The majority of_ these respondents (83%) shopped a supermarket as their
primary food store, shopped there twice a week and spent $97.56. While 57% of
supermarket consumers did not shop a second store, of those who did either a supercenter
(20%) or a different supermarket (20%) was selected most often. Those supercenter
consumers shopping at a supercenter shopped an additional 1.2 times per week and spent
$38.75, while those supermarket consumers who shopped at a different supermarket made .8
trips per week and spent $36.50.
Summary
The results of this study revealed that of the three hypotheses tested, only hypothesis
three was rejected .. Specifically, hypothesis one that "Hispanic consumers' attitudes towards
store environmental attributes of the primary food retail store type shopped will differ by
variety of acculturation" was not shown to be significant. Hypothesis two that "H2 Hispanic
consumers' primary food retail store type choice is dependent upon variety of acculturation."
78

was also not shown to be significant. While hypothesis three that "Hispanic consumers'
attitudes towards store environmental attributes will differ by the type of primary food retail
store shopped." was shown to be significant. In addition, , for this study of Hispanic
consumers in the San Antonio, Texas market, the food retailer store choice model was not
supported. Furthermore, the data revealed a number of important findings. These findings,
as discussed in the following chapter, have significant managerial implications for food
retailers in other markets, especially those interested in targeting Hispanic consumers.
79

CHAPTER S
CONCLUSIONS, MANAGERIAL IMPLICATIONS AND
FUTURE RESEARCH
This study tested a conceptual model determining Hispanic consumers' attitudes
toward store attributes, based on variety of acculturation and food retail store types in the
San Antonio, Texas market. The hypotheses tested were: H1 Hispanic consumers' attitudes
towards store environmental attributes of the primary food retail store type shopped will
differ by variety of acculturation; H2
Hispanic consumers' primary food retail store type
choice is dependent upon variety of acculturation; and H3 Hispanic consumers' attitudes
towards store environmental attributes will differ by the type of primary food retail store
shopped. The results revealed that hypotheses one and two were accepted when testing
their respective null hypotheses. Conversely, hypothesis three's test of its null hypothesis
_ was rejected, which means that Hispanics' attitudes toward stort environmental attributes
differed by the type of primary food retail store shopped . .
This chapter will focus on several components including conclusions, managerial
implications, limitations of the study and future research. The conclusion section of this
chapter focuses on the study's results and provides information about what was learned
regarding Hispanic consumers. Whether operating in new or existing markets, the
managerial implications section provides some insightful strategies for food retailers to
implement as a means to better equip their stores or company to serve the ever-growing
Hispanic market. Furthermore, this study, despite its limitations, reveals numerous insights
for further research.
80

Conclusions
The results revealed that hypotheses one and two were accepted while hypothesis
three was rejected, when testing the respective null hypothesis of each. The test results of
hypothesis one revealed that significant differences were not found (fable 16) among
assimilated, integrated and separated Hispanics varieties of acculturation in their means of
attitudes toward food retailers, as measured by various store environment attributes. That is,
that the different varieties of acculturation (assimilated, integrated and separated) that
Hispanic consumers exhibited did not influence Hispanics' attitudes towards the various
store attributes.
The test results of hypothesis two revealed significant differences were not found
between each of the varieties of acculturation and the primary food retail store type
shopped. That is, the type of primary food retail store shopped did not differ by variety of
acculturation (assimilated, integrated and separated) that Hispanic consumers exhibited.
The test results of hypothesis three did reveal significant differences between the two
primary food retail store types chosen (specifically, supermarkets and supercenters were
tested) chosen in Hispanic consumers' attitudes toward food retailers, as measured by
various store environment attributes. That is, Hispanics' attitudes towards the various store
attributes differed by type of primary food retail store shopped.
From the results, food retailers can learn which store types Hispanics shopped in
the San Antonio market and which attributes influenced Hispanics' attitudes toward the
respective retail store. Both the results from hypothesis three and the additional findings
from the study revealed interesting and important information about Hispanic consumers
8 1

not previously known. By reviewing these results, food retailers can draw inferences for
possible use in their own markets as to the behavior of Hispanic consumers .
Major Findings
As the results indicated (H3) , Hispanic consumers' attitudes towards store
environmental attributes differed by the type of primary food retail store shopped. The two
store types tested were supercenters and supermarkets. The 20 attributes tested were: easy
parking, convenient location, outside appearance, shopping area, pleasant interior,
background music, pleasant odors, color scheme, well-lit interior, organized layout, wide
aisles, product shelf space, attractive signs, bilingual signage, attractive decor, friendly
employees, knowledgeable employees, bilingual employees, sufficient assistance, and
crowded w/shoppers. Of these 20, 7 ·attributes (easy parking, convenient location, outside
appearance, pleasant interior, organized layout, friendly employees, and knowledgeable
employees), based on .A.NOVA, or univariate test, provided significant differences between
supercenters and supermarkets (Table 27).
The means of the seven attributes (Table 29) were higher for supermarket shoppers
than for supercenter shoppers, revealing that Hispanics who shop a supermarket as their
primary food retail store have a more positive attitude towards each of these seven store
attributes than Hispanics who shopped a supercenter. These attitudes were based on a
formula where attitudes are equivalent to importance times perception (belief) (Table 3).
Specifically, the means for supercenter versus supermarket were as follows: easy parking
(14.9 vs. 18.5); convenient location (18.1 vs. 21.0); outside appearance (15.3 vs. 18.2);
pleasant interior (17.2 vs. 20.2); organized layout (19.1 vs. 21.3); friendly employees (19.2 vs.
22.3); and knowledgeable employees (19.0 vs. 22.1).
82

Additional Findings
Food retailers who are interested in Hispanics as either a portion of, or their sole
target market will unearth a number of additional interesting findings from this study. First,
Hispanics exhibiting different varieties of acculturation had different attitudes, although not
significant through hypothesis testing, about the various store attributes. Second, Hispanics'
different shopping habits and expenditures, as revealed in the study, provide useful
information for food retailers. Third, the data revealed several store attributes that
Hispanics had the most positive attitudes toward when the mean results were ranked (fable
29). Each of these findings contributes to understanding why food retailers should target
Hispanic consumers.
Acculturation and Attitudes. Although the study did not find that Hispanic
consumers' attitudes towards store environmental attributes of the primary food retail store
shopped differed by their variety of acculturation (Hypothesis 1 was not -rejected), the data
from the study (fables 30 - 32) did reveal that Hispanics exhibiting these different
acculturation varieties did vary in some attitudes regarding food retailers. For instance,
assimilated shoppers (fable 30) had the most positive attitude_s toward friendly employees
(m = 21.6), knowledgeable employees (m = 21.0), convenient location· (m = 20.9), organized
layout (m = 20.8) and pleasant odors (m = 20.3), while integrated shoppers (fable 31) had
more positive attitudes toward knowledgeable employees (m = 22.6), friendly employees (m
= 22.4), organized layout (m = 21.7), sufficient assistance (m = 20.8), and pleasant odors (m
= 20. 7). Separated shoppers (fable 32) had more positive attitudes toward knowledgeable
employees (m = 21.8), friendly employees (m = 21.7), convenient location (m = 20.8),
pleasant odors (m = 20.6), and pleasant interior (m = 20.4).
83

Shopping Habits and Expenditures. Although the study did not find that Hispanic
consumers' variety of acculturation led to their primary food retail store type choice
(Hypothesis 2 was not significant), the results did reveal interesting information regarding
shopping trips and expenditures for Hispanics overall, as well as those differing by
acculturation variety (fables 33 - 36). Hispanics shopped twice a week and spent $102.56 at
their primary food retail store (fable 33). A number of Hispanic shoppers (42%) in the
survey also shopped a secondary store 1.1 times per week and spent an additional $53.89.
Of the shoppers who selected a supercent�r (10%) as their primary food store of choice,
Hispanics shopped there 1.8 times per week and spent $122.00. Hispanic shoppers who
shopped supercenters as their primary food store chose supermarkets most often ( 40%) as
their secondary food store, shopped 1.2 times per week and· spent an additional $61.25 per
week. The vast majority (90%) of Hispanics shopped supermarkets as their primary food
store twice a week and spent $100.43. Hispanics who shopped supermarkets as their
primary food store also made 1.1 trips per week to a different secondary supermarket and
spent an additional $45.20. Hispanic shoppers, who selected a supercenter as their secondary
store of choice, shopped ther� more often (1.3 times per week) and spent more money
($62.71) than any of those who selected any of the other secondary food store options.
Also, assimilated and integrated Hispanics who selected a supercenter as their
primary food store spent more per week, $125.00 and $125.77, respectively, than did
Hispanics identified as separated who spent just $88.33. When reviewing various single or
combined food store shopped across varieties of acculturation, integrated shoppers, in
general, spent more and shopped more often. For example, integrated shoppers whose
primary store was a supercenter and secondary store was a supermarket spent a combined
84

$195.77, compared to assimilated shoppers who spent $168.13 and separated shoppers who
spent $158.33.
Another interesting finding is related to the separated Hispanic shopper (fables 34 -
36). Separated Hispanics were more likely to shop a supercenter store (15%) than either the
assimilated or integrated Hispanic shopper (10%). While this study is not about how
Hispanic individuals change over time, this finding may suggest that supercenters are losing
business to supermarkets as separated individuals become more acculturated. In all varieties,
those shoppers who selected a supercenter as a secondary food store spent at least 30%
more than those who shopped at a supermarket as a secondary store.
The higher means in supermarkets may explain why 90% of Hispanics shop a
supermarket (fable 33) as their primary food retailer compared to 10% who shop a
supercenter. In addition, Hispanics shopping a supermarket as their primary food retailer
type also choose a different supermarket as their secondary store choice over supercenters.
Even Hispanics who shop a supercenter as their primary food retailer type shop a
supermarket as their secondary store choice over other options. The fact that so many
Hispanics are choosing to shop a secondary retailer implies they are not having all their
needs met at their primary food store choice.
Attribute Rankings. When the mean data were reorganized and tallied by rank (fable
29) with "1" as the most important, the results revealed the store attributes that Hispanics
had the most positive attitude towards, whether their primary choice for food shopping was
a supercenter or a supermarket. The top five ranked attributes for a supercenter were a well
lit interior (m = 20.4), pleasant odors (m = 19 .3), friendly employees (m = 19 .2), organized
layout (m = 19.1) and knowledgeable employees (m = 19.0); while the top five ranked
85

attributes for a supermarket were friendly employees (m = 22.3), knowledgeable employees
(m = 22.1), organized layout (m = 21.3), convenient location (m = 21.0), and pleasant odors
(m = 20.6). Of these top five attributes selected by supercenter and supermarket shoppers,
the dimensions (fable 4) of contact personnel, layout and design, general interior and
general exterior were represented, while the dimensions of other customers and point-of-
purchase and decoration were not.
Equally interesting was that both bilingual employees and bilingual signage ranked
near the bottom of each list (16th and 19th place for supercenter and supermarket,
respectively). This appears to contradict what is often read in the news (e.g., Cardona, . 2005,
Kinsella, 2003, Toothman, 2005), that food retailers are adding both of these store attributes
in an effort to reach out to the Hispanic market. Perhaps this low ranking is due to the
location where the survey took place (San Antonio is 59% Hispanic). That is, that the food
retailers in the San Antonio market are already offering both the product assortment and
familiar brands recognizable to the Hispanic shopper. This low ranking may also be
attributed to some consumers shopping by sight and not relying on either signage or
employees for help when looking for a particular item; rather, these Hispanic consumers may
choose to travel each aisle until their product is found.
When reviewing the individual rankings of attitudes, it is important to note that of
the 20 store attributes investigated, 19 were ranked higher by Hispanics who chose
supermarkets as their primary food retail store. The only attribute where a supercenter
hedges a slightly higher rank is the well-lit interior attribute (m = 20.4 and 20.1 for
supercenter and supermarket, respectively).
86

Customer needs as well as the characteristics of competition and the competitive
structure within selected markets should be an ongoing review for all food retailers (Segal, et.
al., 1994). The findings of this study can help those interested in obtaining a share of the
Hispanic market to generate ideas for implementation in their own markets. As grocery
sales dollars are at stake, maintaining a stronghold over the competition will require food
retailers to implement both aggressive and possibly different market strategies.
Managerial Implications
Both the results from hypothesis three, along with the additional findings from this
study, provide supporting evidence as to changes food retailers can initiate at their stores in
order to more effectivdy target Hispanic consumers. This study revealed that Hispanics
have more positive attitudes toward supermarkets than supercenters based on different store
environmental attributes. Specifically, this study focused on 20 different store
environmental attributes and examined how or whether these attributes. provided additional
insights into Hispanic shopping behavior in the San Antonio, Texas market. By narrowing
the attribute list to the seven most significant ones (Table 27), managers can investigate how
these store attributes can further promote positive attitudes and increase shopping at their
own store.
Ma.for Findings
Often stores are looking for opportunities to capture a larger share of a particular
market. While there are many similarities with regards to different food retailers'
merchandise and store operations, it is worthwhile to note there are some differences
between the store types, and both supercenters and supermarkets can learn from the results
of this research. After further investigating specific components of certain store attributes,
87
supercenter/ supermarket managers can examine their own current store attributes and
determine their store's weaknesses. In addition to investigating their own stores, managers,
by visiting other stores in their market can perform a competitive analysis in order to
determine whether their competition does or does not feature top attributes and whether a
niche exists that can be exploited. In addition, new Hispanic-oriented food retail stores such
as Publix's Sabor can be visited. In doing so, managers can gather ideas on how to best
correct their own store's weaknesses . . For example, the results of this study revealed that
supermarkets need to continue to maintain a better performance in each of the most
important attribute areas in order to remain competitive. Supercenters, on the other hand,
need to improve their strategies to better compete with supermarkets.
Based on McHenry's Algorithm, MANOV A and ANOV A test results, it was
discovered from the outcome (fable 27) of hypothesis three that Hispanic consumers had
more positive attitudes towards supermarkets than supercenters in terms of seven attributes
( easy parking, convenient location, outside appearance, pleasant interior, organized layout,
friendly employees, and knowledgeable employees).
Regarding these seven attributes, food retail managers should further investigate,
through the use of a short survey or focus group, what specific components make up each
attribute. For instance, does "easy parking" mean available parking spaces in front of the
store, wider parking spaces, better access to the parking lot itself or more parking spaces
available overall? Does "convenient location" mean convenient to work, home, or a bus
stop? Does "organized layout" mean products should be organized by breakfast, lunch and
dinner items, by like-minded items (cold medicine and tissues), or by some other method?
By using a focus group of current or potential Hispanic consumers, or some other means of
88

research, managers could specifically examine what individual items make up each store
attribute and then, with this list of attributes in hand, further investigate their own stores.
However, it is important to note that individual items that make up the attribute for different
store types may be different. For example, some supermarkets have storefr9nt windows that
may be included in the "pleasant outside appearance" itemized list regarding this particular
attribute, whereas supercenters, such as Wal-Mart, may not mention windows as part of the
store's itemized components under the same attribute heading.
Armed with this list, managers could determine whether changes to an existing store
should be made to be more competitive in the Hispanic market and which top store
attributes would be a more worthwhile investment when targeting Hispanics. Again,
supercenter managers especially should look to their own stores to determine where
improvements can be made, especially since the results revealed that supercenters had a
lower mean score in 95% of the attributes listed.
Friendly and Knowledgeable Employees. The high means (Table 29) for friendly
employees and knowledgeable employees for supercenters (19 .2 and 19 .0, respectively) and
supermarkets (22.3 and 22.1, respectively) indicate these attributes play an important role in
determining where Hispanics shop for food. Stores should ensure each of these important
attributes exist by carefully evaluating current and future employees. Finding the right
employee requires special attention to hiring practices, including good interviewing skills and
reference checks of potential candidates.
Regardless of an employees' job description, managers are reminded that they should
hold special information or training sessions for employees as part of the hiring process.
Whether an employee is in management, or is a stock clerk, each comes in contact with the
89

customer, thus proper and continuous training is important. Sometimes employees need to
be reminded that they should be friendly, helpful and sensitive to the needs of all cultures,
especially those the store is currently targeting. Furthermore, store managers wishing to
target the Hispanic shopper should also train employees as to cultural differences found in
this demographic group. Then, these knowledgeable employees could better assist Hispanic
customers in finding the brands they need, or even suggesting alternative or related items.
By being able to identify w1th the needs of the Hispanic shopper, friendly and
knowledgeable employees can make a "connection" to their customer. For example, the
idea of connecting food and family together (Y avra, 2001) is one strategy stores can
implement as a way to make the entire shopping experience more pleasurable. This idea may
he the reason behind why the attributes of friendly and knowledgeable employees were so
important to a number of Hispanics and why food retailers should take great care in hiring
and training the right employees in order to meet these needs.
One way managers can measure how well employees are friendly and knowledgeable
is by hiring secret shoppers to help management evaluate their contact personnel. Secret
shoppers are trained shoppers who take careful notes regarding the service they receive from
store employees and then relay this information to management.
Wherever possible, food retailers can ensure that the image their store projects in any
advertising focuses on some of the key store attributes revealed in this study. For instance,
there are many examples where an attitude change can be brought about by changes in the
environment, changes in a product about which one has a belief, or even changes in one's
perception about a product or store through advertising or communications (Walters, 1974).
Therefore, food retailers (i.e., supermarkets) who wish to enhance the positive attitudes or
90

food retailers (i.e., supercenters) who wish to change the negative attitudes currently held by
Hispanic shoppers, need to implement good promotional strategies in order to obtain the
needed change in behavior.
Since Hispanic attitudes were more positive towards supermarkets, supercenter
managers need to develop a strategy that will increase the positive awareness of their
supercenter. The use of promotional advertising featuring friendly and knowledgeable
contact employees that enhances a Hispanic consumer's attitude regarding these store
attributes is one way. For instance, Wal-Mart is well known for featuring "greeters" at each
of their stores, and supercenters creating an ad featuring a friendly /knowledgeable employee
(possibly other than the "greeting" store front location) providing assistance to a Hispanic
customer will help influence a positive perception regarding these attributes.
While supermarket stores may not have "greeters" they do have ''baggers" and
supermarket managers can use these contact employees to their advantage by ensuring the
last thing a Hispanic customer sees are the smiling faces of these employees. By continuing
to offer assistance to customers as they leave the store, supermarket managers can continue
to remain competitive.
Organized Layout. Organized layout is another important attribute to food shoppers
in both supercenters (m = 19 . 1) and supermarkets (m = 21 .3) . Hispanic consumers
obviously want to be able to quickly find what they need for various meals, without feeling
they are looking for a "needle in a haystack." Store managers can feature popular "Hispanic"
products on the "end-caps" of grocery aisles, making them readily visible to shoppers.
Generally speaking, food retailers may feel they perform well at this particular task as stores
are often set up in a similar manner. However, if the Hispanic consumer feels this attribute
91

is important, as this study reveals, it is worth a second look to decide specifically which items
come to mind when a Hispanic determines if a store layout 1s organized and specifically if a
manager finds whether this is the case in their own store.
Organized layout to some Hispanics may mean the store is organized the way meals
are cooked. For instance, one survey respondent commented that they would like to see rice
and beans on the same aisle, the way they are prepared in meals. Supercenters, due to better
space availability,' have an opportunity to improve in this area as they are better able to place
complimentary items together in multiple sections of the store, such as placing bananas in
the cereal aisle (where bananas are frequently used) as well as in the produce aisle and at
check-out counters as a "quick snack" item. Supermarkets, on the other hand, due to their
smaller store size, can continue to offer easier product accessibility. Hispanic consumers are
less likely to feel overwhelmed since they won't have to cross over a large general
merchandise section to get to the personal hygiene products.
Convenient Location. Supermarkets (m = 21.0) received a more favorable mean
score than supercenters (m = 18.1) which may imply that supermarkets are closer to home
(and further investigation will reveal this) or simply that supermarkets have more store
locations. While both supermarkets and supercenters tend to carefully evaluate sites for new
store locations, additional studies should take place in order to reevaluate how demographics
have changed over time and how this affects current store locations.
Supercenters may be able to overcome the lower positive attitude scores, with
regards to their Hispanic consumers, by increasing supplementary retail venues within their
stores. Most supercenters currently feature additional "store within a store" venues such as
hair/ nail salons, eyewear, cellular phones, etc. Based on Hispanic shoppers' preferences,
92

supercenter managers can create even more opportunities for one-stop shopping by offering
additional components such as banking, money transfers or bill payment services within
their store, thus making the supercenter more convenient overall to this important
demographic group.
Supermarkets with their smaller space requirements can continue to move into new
developments with greater ease. In addition, as older retail stores close or are consolidated,
supermarkets can move into existing locations.
Pleasant Interiors and Outside Appearance. Pleasant interior was more important to
Hispanics who shopped a supermarket (m = 20.2) than those who shopped a supercenter (m
= 17.2). In addition, outside appearance was more important as Hispanics who shopped a
supermarket (m = 18.2) had a more positive attitude about this attribute than Hispanics who
shopped a supercenter (m = 15.3). Store managers can influence Hispanic consumers'
positive attitudes toward each of these attributes by concentrating on each component or
item by observing how their individual store, both inside and out, addresses each one. For
instance, if cleanliness appears as an item that makes the outside environment and the
interior described as pleasant, then the store should be clean, from the floors to the
windows, to the interior ceiling. Signage that appears outdated, peeling paint or potholes in
the parking lot are not pleasant invitations to shop a food store and these problems, if they
appear, should be remedied.
Supercenters such as Wal-Mart own the land where their stores are located and have
greater flexibility with regards to making both interior and exterior changes to their stores.
Supercenters have an opportunity to improve Hispanic consumers' attitudes as many of
these store types are stand-alone properties that hire full time employees to operate both
93

inside and outside maintenance. This allows changes or enhancements to be made in a
timely manner at a supercenter. In addition, by owning their own property, supercenters
have greater flexibility with regards to enhancing or altering the outside appearance of their
stores with more attractive landscaping and familiar plants and trees.
Supermarkets, with their smaller size stores, can present a more pleasant "at home"
atmosphere within their stores. While supercenters tend to appear more generic in their
interiors, as a sort of "one size fits all" atmosphere, supermarkets can more readily
customize their interiors based on the demographic composition of the neighborhoods
surrounding their store. That is, by implementing the specific components mentioned that
make an interior more pleasant to their Hispanic shopper.
Easy Parking. Finally, easy parking should be addressed by store managers.
Hispanic shoppers again had a more positive attitude regarding supermarkets (m = 1 8.5)
than supercenters (m = 14.9). While this may be due to the size of supercenters and their
resulting spread out parking areas, further investigation will reveal specifically which
components Hispanic shoppers think of when measuring this attribute. While parking at
various stores may not be easily controlled due to shopping center management constraints
or other zoning issues, managers of both supercenters and supermarkets can make an effort
to control where their employees park. If employees are taking the front parking spaces,
customers will have to walk further, and thus the positive perception with regards to this
attribute is lost.
Supercenters, due to ownership of their property, have an opportunity to improve in
this area since they may have greater control over various parking lot components (e.g.,
spaces available, traffic flow). On the other hand, supermarkets are more likely to lease their
94

space, and may not be to alter their parking lot. However, supermarkets can ease the
parking aggravation by offering friendly customer assistance (e.g., baggers) and take Hispanic
customers' purchases out to the car, as well as hold umbrellas on rainy days.
Additional Findings
At first glance at this study's results, supermarket managers may feel that, with 90%
of San Antonio's respondents selecting supermarkets as the primary store shopped, their
store may be leading locally in the market share among Hispanics. The review of means of
store attributes also reveals that San Antonio's supermarkets are leading over supercenters
with regards to Hispanic consumers' positive attitudes. These findings may cause them to
overlook what the results also reveal, that is, a good percentage of food dollars are leaving
one supermarket retailer for another supermarket, as well as other types of food retailers.
For instance, while supermarkets have an overall larger share of Hispanics who shop their
stores (fable 33), Hispanics shopping other food retailers, such as supercenters and
warehouse clubs, are spending more dollars per week, which makes up some of this vast
difference.
Wal-Mart continues to grow in many markets opening their traditional supercenters
and now also opening smaller neighborhood grocery stores. In addition, in recent years
Target has also entered the grocery market. As the competition begins to eat away at the
supermarket share of the billion-dollar grocery market (Monroe, 2005), supermarket food
retailers would be wise to do whatever is necessary to reduce lost revenues at their own
stores. Supercenters and other food retail type stores, where Hispanics shop less frequently
(fable 33), should look for, and then take advantage of, opportunities not currently utilized
by supermarkets.
95

While not featured on the list of seven attributes that were significant in hypothesis
three, another attribute that received high mean scores for both supercenters (19 .3) and
supermarkets (20.6) was pleasant odors. While past research ( e.g., Mulhern & Williams,
1995) has suggested that food retailers alter their retail mix by carrying more ethnic-oriented
store brands as an additional incentive for consumers to shop one store over another, many
food retailers are already doing this. While freshly baked bread is often the first thing that
may come to mind, when thinking about pleasant smells and groceries, ethnic foods such as
freshly baked guava pastries, may be more in tune with what Hispanics are looking for, and
additional research regarding the individual components that make up this store attribute will
help determine this. Managers should keep in mind that not every customer is going to
smell whatever is baking if the bakery is loq.ted at the back of the store and therefore
alternative methods such as food cooking stations located in various parts of the store could
.be initiated during peak hours/ days. As research warrants it, ethnic foods such as fried
plantains, frijoles con jamon (beans with ham) may be on the menu in order to peak the
interest of the Hispanic shopper.
Even though this study did not reveal significant results for Hypothesis two,
"Hispanic consumers' primary food retail store type choice is dependent upon their variety
of acculturation," the data did reveal information that there were some differences in
behavior between Hispanics exhibiting different varieties of acculturation. Food retailers
whose own demographic market reveals a strong base of Hispanic consumers may wish to
identify which variety of acculturation best represents their own customers.
While the results of this study cannot be generalized to markets other than San
Antonio, managers wishing to further explore the varieties of acculturation of their own
96

customer base could develop a questionnaire for use in their own market, especially if their
market is Mexican American and similar to that of San Antonio. Using the results of this
study, which indicated that Mendoza's original 29 questions could be reduced to 9 (fable
13), retailers could begin their own investigations to determine if these variables could be
used to determine with an 86.2% accuracy rate, a Hispanic's variety of acculturation.
The questions used for measuring variety of acculturation could possibly be added to
a store's preferred customer application for new customers, or mailed to current customers
who have Spanish surnames. Preferred customer cards, generally used by supermarkets for
offering discounts and check cashing privileges to customers, as well as a means to track
shopping expenditures and products purchased, can be used to obtain a wealth of
information about Hispanic shoppers through various data mining techniques. The
responses obtained from the questionnaire could be used to further identify customers in the
store's database by their variety of acculturation.
Then, similar to this study, supermarket managers could specifically survey their own
Hispanic customers in an effort to determine if shopping expenditures and money spent per
week were different. In addition, managers could target specific groups of Hispanics and
measure the different response rates to various promotional campaigns. They could also
determine if a promotional image campaign resulted in increased expenditures for Hispanic
shoppers overall or differed by variety of acculturation.
Limitations
This study is not without its limitations. For example, the results cannot be
generalized to the entire population and the study may contain some sample and data
collection bias.
97

Generalizing Results
As previously mentioned, the results of this study including the reduction of the
Mendoza scale and the top ranked store attributes cannot be generalized to all markets.
Without further testing to determine which components of Mendoza's scale could be
reduced, say to Puerto Ricans, Cubans or even rural Mexican Americans, food retailers
should use caution when implementing these results in their own market. Similarly,
Hispanics in other markets may not rate store attributes similarly. Therefore, food retailers
should conduct studies in their own markets using these results as a guideline.
5 ample and Data Collection Bias
By limiting the results of the study to those surveys that were fully completed, some
potential bias may have been introduced into the sample estimates (Lohr, 2003) . In addition,
the loss of the 59 surveys due tq the "don't know/ not applicable" response options may also
have-introduced some survey error. As with much of the research conducted today,
adequate software is needed to analyze complex data sets, minimize the loss of observations,
and enhance data interpretation.
Although this survey was cost effective when compared to other methods and there
was an overwhelming positive response, the lack of randomness of this survey may have
introduced some potential bias in data collection. That is, the survey was taken during a
particular festival event held in one city as opposed to a nationwide sample. In addition, the
categories of variety of acculturation and store type may not have been represented fairly
( only 20 of the 260 observations were represented by separated Hispanics and only 25 of the
235 observations were represented by supercenters) and therefore, sample bias may have
occurred with regards to these two categories.
98

While there are numerous culturally themed festivals held throughout the nation that
would allow researchers to directly target specific groups, there is a lack of information on
how to target individuals at these events to ensure a random sample. As with other popular
survey methods, such as mail and telephone, researchers could consider increasing the
number of festivals for data collection to minimize limitations. Finally, since this survey was
not implemented as an exit interview at various food retailer locations, how well a shopper
remembered their actual purchasing habits and their primary food store attributes might
have limited the accuracy of this study's results. Researchers who wish to obtain more
information regarding Hispanics in the future should use caution against generalizing results
as well as avoiding potential hazards of sample and data collection bias.
Future Research
Future research of Hispanics will continue to enable retailers to more successfully
develop strategic plans that management could implement to reach this fast-growing
population. This future research could encompass revisions of the questionnaire measuring
variety of acculturation, allow for further probing as to why Hispanics shop at secondary
food retailers, increase the sample size in order to obtain more "balanced" representation of
the categories, determine what can be learned from regional and national food retailers who
have recently begun to (re)position their stores by targeting Hispanics, and determine how
store attribute rankings change for other retailers (e.g., clothing stores, shoe stores) or other
ethnic groups.
Questionnaire &visions
While neither the original Mendoza (1989) research nor any of the subsequent tests
(e.g., Maldonado, et. al., 2002) of the Cultural Life Styles Inventory (CLSI) scale, addresses
99

the use of a "don't know /not applicable" response option, tlus study revealed that using the
questions in their original form required this optional response. It is believed that excluding
this response option would have resulted in far more missing data, especially since this study
revealed there were some conflicts with regards to the 29 questions currently asked such as
deceased parents, etc. Therefore, future research should adopt some rewording of the
questionnaire or allow for further probing of respondents, should this option be selected.
As was previously mentioned, a number of respondents selected the neutral option
of "3" as their response to the Berry acculturation scale questions. Therefore, adopting a 4-
point Likert scale for future measurements of the Berry scale is necessary to more accurately
reflect a "yes/ no" response option.
Additional &spondent Probing
As the study revealed, supermarkets are the primary store of choice (Table 33) for
Hispanics when shopping for food. Yet, it also revealed that, 41 % of those who shop a
supermarket are not having all their needs met and are shopping a secondary food retailer,
spending almost an additional one-third of their weekly budget at another food retailer when
they do so. The question food retailers should ask is why? Is it the product, the price or
· some other factor that leads Hispanics to leave one food retailer and shop another during
the same week? This question is worth investigating as the answer may provide lucrative
results along with a prudent strategy for implementation.
The idea behind "birds of a feather flock together" is that members of the same
cluster tend to respond in similar way, often as the result of some underlying factor (Lohr,
2003). In other words, members of a particular cluster tend to be more similar than those
selected at random from the entire population (Lohr, 2003). However, there is expected to
1 00

be some overlap of the variables as respondents move from one acculturation variety to
another, similar to that exhibited (fable 12) in the fuzzy cluster output. It would be
interesting to discover just which of these characteristics cause this "fuzziness" to occur.
Further probing of other Hispanic respondents in the future, or even those of other
ethnic groups, and testing which variables of Mendoza's 29-item scale could be eliminated
would facilitate shorter questionnaires with "as good" results. In addition, studies that allow
researchers to investigate which traits or dimensions an individual currently exhibits and how
they may alter with time, causing one to move from one variety of acculturation to another,
would further enhance our knowledge of various immigrant cultures.
l...a,gcr sample s izcs
In order for both the variety of acculturation and store type categories to be
represented fairly, a larger sample size is needed. A more evenly distributed response for
variety of acculturation might be obtained by interviewing Hispanic grocery shoppers in
different residential areas. Within these areas, interviews conducted as an intercept survey at
each store type, might provide a more representative sample.
Hispanic Food Retailers
In an effort to learn how well food retail stores who specifically are targeting
Hispanics are doing, future research could include comparative analyses of these stores and
other food retailers. Differences in retail mix, advertising, and store attributes are some of
the components that could be investigated in an effort to identify lessons food retailers can
learn and which mistakes they can avoid.
1 0 1

Store Attribute Importance
Future research should investigate whether these same 20 store attributes, as
measured in this study for food retailers, hold the same level of significance for other retailer
types. As noted previously, retailers could then determine why their own stores are not
meeting the needs of the Hispanic consumer and how they can implement changes in order
to do so. In addition to other retail stores, future research could also target other groups of
individuals, such as African Americans or Asians and perform a comparative analysis to
determine how groups differ with regards to attitudes towards these particular store
attributes.
Summary
This study has revealed a number of interesting behaviors and traits of Hispanic
consumers and has attempted to highlight the significance of these findings by offering food
retailers insights and practical managerial implications that can be implemented in their
stores. Hispanic behaviors including their attitudes toward certain store attributes, their food
retailer preferences, along with their food retailer shopping expenditures revealed motivating
reasons why food retailers should target this particular consumer group. In addition,
demographic traits such as · their population growth and expected expenditures have helped
to quantify why the Hispanic culture is worth further investigation and study.
1 02

LIST OF REFERENCES
1 03

LIST OF REFERENCES
Berry, J. W. (1980) . "Acculturation as varieties of adaptation," in Acculturation: Theory, Models
and Some New Findings, ed. Amado M. Padilla, Boulder, CO: Westview, 9 - 26.
Berry, ]. W., Kim, U., Minde, T., & Mok, D. (1987) . Comparative studies of acculturative
stress, International Migration Review, 21 , pp. 491 - 51 1 .
Bitner, Mary Jo. (1 992) . Servicescapes: The impact of physical surroundings on customers
and employees. Journal of Marketing, New York, 56 (2), 57 - 71 .
Cattell, R.B. (1 966) . The scree test for the number of factors. Multivariate Behavioral Research, 1
pp. 245-276.
Clark, K. (2003) . From Bodega to mega store: Hispanics give new meaning to 'super market. ' Chain
Store Age, February, pp. 35 - 37.
Cardona, M. (2005) . More big retailers expand Hispanic marketing strategies. AdAge. com,
retrieved, January 5.
Cuellar, I., Arnold, B., & Maldonado, R. (1995) . Acculturation rating scale for Mexican
Americans-II: A revision of the original ARSMA scale. Hispanic Journal of Behavioral
Sciences, 1 7 (3), pp. 275 - 305.
Darden, W. R., & Ashton, D. (1974, 1975) . Psychographic profiles of patronage preference
groups, Journal of Retailing, 50 (4), Winter, pp. 99 - 1 12.
Deshpande, R., Hoyer, W.D., & Donthu, N. (1986) . The intensity of ethnic affiliation: A
study of the sociology of Hispanic consumption. Journal of Consumer Research. 1 3,
September, pp. 214-220.
Dooley, D. (2001). Social Research Methods, 4th Ed., Prentice Hall, Upper Saddle River, New
Jersey.
1 04

Dunne, P. M., & Lusch R. F. (2005). Retailing, Fifth Ed., Thomson South-Western, United
States.
Eckman, M., Kotsiopulos, A., & Bickle, M. C. (1997). Store patronage behavior of Hispanic
versus non-Hispanic consumers: Comparative analyses of demographics,
psychographics, store attributes, and information sources. Hispanic Journal of Behavioral
Sciences, 19(1 ), pp. 69-84.
Engel, ]. F., Blackwell, R. D., & Miniard, P. W. (1986). Consumer Behavior 5th ed., Dryden
Press, Orlando.
Engel, ]. F., Blackwell, R. D., & Miniard, P. W. (1995). Consumer Behavior 8th ed., Dryden
Press, Orlando.
Fishbein, M. (1 967). A behavior theory approach to the relations between beliefs about an
object and the attitude toward the object. In M. Fishbein (ed.), Readings in Attitude
Theory and Measurement, (pp. 389 - 400), New York, Wiley.
Gentry, ]. W., Jun, S., & Tansuhaj, P. (1995). Consumer acculturation processes and cultural
processes: How generalizable is a North American model for marketing globally? Journal
ofBusiness Research, 32, pp. 129 - 1 39.
Gore, C. (2005). It's time to think Latino. Globe Street Retail, retrieved July 1 4, 2005 from
www.globest.com.
Hawkins, D.I., Best, R.J., & Coney, KA. (2003). Consumer Behavior. McGraw-Hill/Irwin:
New York, NY.
Herbig, P., & Yelkur, R. (1 997) Differences between Hispanic and Anglo consumer
expectations. Management Decision. Jan-Feb. 35, 1 -2. p. 125 (8). Retrieved May 29, 2002,
from InfoTrac database.
1 05

Hernandez, S. A., Cohen, ). F., & Garcia, H. L. (2000). Hispanic acculturation: Conceptual
and modeling issues, The Journal of Applied Business Research, 16 (4), pp. 73 - 82.
Hirschman, E. C. (1981). American Jewish ethnicity: Its relationship to some selected aspects
of consumer behavior, Journal of Marketing, 45 (Summer), pp. 102-110.
Hintze, J. (2004). NCSS and Pass. Number Cruncher Statistical Systems, Kayesville, Utah.
Hodge, D. & Gillespie, D. (2003) Phrase completions: An alternative to Likert scales, Social
Work Research, 27 (1) pp. 45 - 56.
Hoffman, K.D., & Turley, L.W. (2002). Atmospherics, service encounters and consumer
decision making:A integrative perspective, Journal of Marketing Theory and Practice,
Statesboro, 10(3), (Summer) pp. 33-47.
Holland, )., & Gentry, ). W. (1999). Ethnic consumer reaction to targeted marketing: A
theory of intercultural accommodation. Journal of Advertising, 28(1), 65-77.
Howell, D. (1999). Spanish-speaking Hispanics prefer neighborhood shops. Discount Store
News, New York, 38(19), (October), Retrieved April 25, 2003 from Proquest
database.
Hui, M. K., Joy, A., Kim, C., & Laroche, M. (1992). "Acculturation as a determinant of
consumer behavior: Conceptual and methodological issues," in AMA Winter Educators'
Conference, 3, ed. Chris T. Allen, et al., Chicago, IL: American Marketing Association,
pp. 466 - 473.
Humphreys, J. M. (2002). The multicultural economy 2002: Minority buying power in the
new century. Geo'l'gia Business and Economic Conditions, University of Georgia, 62 (2), pp 1 -
27.
1 06

Indvik, K. (2004). High brand loyalty among Latinos dispelled, survey says. Video Store, 26
(28), Ouly) p. 8.
Jaketic, M; (2002). Language Preference Affects Shopping Choices Among Hispanics.
SuperMarket Research, Food Marketing Institute, Washington D.C. Ouly/August) p. 1.
Joiner, W. (2003). What Hispanic women want. Folio: The Magaine far Magaine Management,
Stamford, Oanuary) p. 138.
Jolliffe, LT. (1972). Discarding variables in a principal component analysis, I: Artificial data.
Applied Statistics, 21 : 160-173.
Jolliffe, I.T. (1986) . Principal Component Anafysis. Springer-Verlag. New York.
Johnson, D. (1998) . Applied Multivariate Methods for DataAnafysts, Brooks/Cole Publishing
Company, California.
Kaiser, H.F. 1960. The application of electronic computers to factor analysis. Educational and
P.rychological Measurement, 20, pp. 141 -1 5 1 .
Kara, A. & Kara, N.R. (1996) . Ethnicity and consumer choice: A study of Hispanic decision
processes across different acculturation levels, Journal of Consumer Marketing, 18 (3),
pp. 203 - 21 8.
Kinsella, B. (2003) . Borders's Pico Rivera store targets Hispanics. CriticasNews, Ouly / August,)
p. 5.
Korgaonkar, P. K., Karson, E.J., & Lund, D. (2000). Hispanics and direct marketing
advertising. The Journal of Consumer Marketing, Santa Barbara, 17 (2), pp. 137 - 1 52.
Retrieved February 1 1 , 2003, from ProQuest database.
Kosic, A. (2002) . Acculturation attitudes, need for cognitive closure, and adaptation of
immigrants. The Journal of Social P.rychology, 142 (2), pp. 179-201 .
1 07

Kotler, P. (1973-1974). Atmospherics as a marketing tool. Journal of Retailing. 49 (4), pp. 48 -
64.
Krosnick, J. A., Holbrook, A. L., Berent, M. K., Carson, R. T., Hanemann, W. M., Kopp, R.
J., Mitchell, R. C., Presser, S., Ruud, P. A., Smith, V. K., Moody, W. R., Green, M. C.,
& Conaway, M. (2002) . The impact of "no opinion" response options on data
quality: non-attitude reduction or an invitation to satisfice? Public Opinion Quarterly,
66, pp. 371 - 403.
Laroche, M., Kim, C., Hui, M., & Tomiuk, M. A. (1997) . A multidimensional perspective on
acculturation and its relative impact on consumption of convenience foods, Journal of
International Consumer Marketing, 10½, pp. 33 - 56.
Lewison, D. M., & DeLozier, M. W. (1982). Retailing, Merrill Publishing Company,
Columbus, OH.
Little, R. & Rubin, D. (1987) . StatisticalAna!Jsis with Missing Data. John Wiley & Sons. New
York.
Lohr, S., (2003) . Sampling: Design andAna!Jsis. Duxberry Press, California.
Luomala, H. T. (2003). Understanding how retail environments are perceived: a
conceptualization and a pilot study, The International Review of Retail, Distribution and
Consumer Research, 13(3), Ouly), pp. 279 - 300.
Magana, J. R., de la Rocha, 0., Amsel, J., Magana, H., Fernandez, I. M., & Rulnick, S. (1996) .
Revisiting the dimension of acculturation: Cultural theory and psychometric practice,
Hispanic Journal of Behavioral Sciences, 18 (4), pp. 297 - 316.
Maldonado, R., & Tansuhaj, P. (2002). Segmenting a local Latino market using Berry's
acculturation taxonomy, Advances in Consumer Research, 29, pp. 414 - 420.
1 08

Marin, G., & Gamba, R. J. (1996) . A new measurement of acculturation for Hispanics: The
bidimensional acculturation scale for Hispanics. Hispanic Journal of Behavioral Sciences. 18
(3), pp. 297 - 317.
Marin, G., Sabogal, F., Marin, F.V., Otero-Sabogal, R., & Perez-Stable, E. (1987) .
Development of a short acculturation scale for Hispanics. Hispanic Journal ofBehaviorial
Sciences, 9 (2), pp. 183 - 205.
Mehrabian, A. (197 6). Public places and private spaces: The p,rychology of work, play and living
environments. New York: Basic Books Inc.
Mehrabian, A., & Russell, J .A. (l 97 4). An approach to environmental p,rychology. Cambridge, MA,
MIT Press.
Mendoza, R. H. (1989). An empirical scale to measure type and degree of acculturation in
Mexican-American adolescents and adults, Journal of Cross-Cultural P.rychology, 20, pp. 372-
385.
Mitchell, V.W. & Kiral, H.R. (1999) . Risk positioning of U.K. multiple grocery retailers, The
International Review of Retail, Distribution and Consumer Research, (9)1 January, pp. 17 - 39.
Monroe, K., & Guiltinan, J. (1975). A path-analytic exploration .of retail patronage
influences, Journal of Consumer Research, 2 Oune), pp. 19 - 28.
Moore, D. S. (2004) . The Basic Practice of Statistics 3rd Edition. W. H. Fre�man and Company,
New York.
Mulhern, F. J ., & Williams, J. D. (199 5). Understanding Hispanic shopping behavior using
retail scanner data, Stores Magazine, 77 (4), p. rr3 - rr6.
1 09

O' Guinn, T. C., & Faber, R. J., (1986). Advertising and subculture: The role of ethnicity and
acculturation in market segmentation, Cumnt Issues and Research in Advertising, 9 (1 ), pp.
133 - 147.
Penaloza, L. N. (1994) . Atravesando Fronteras/Border crossings: A critical ethnographic
exploration of the Consumer acculturation of Mexican immigrants, Journal of Consumer
Research, 21 CTune), pp. 32 - 54.
Pires, G. D., & Stanton, J. (2000) . Marketing services to ethnic consumers in culturally
diverse markets: Issues and implications, Journa/ of Seroices Marketing, Santa Barbara,
14 (7), (I\,farch), pp. 607 - 61 8. Retrieved February 14, 2003 from ProQuest database.
Schulz, D. P. (2000). The definitive ranking of the nation's biggest specialty chains. Stores.
(August) .
Seaver, B., Triantis, K., & Reeves, C. (1999). The identification of influential subsets in
regression using a fuzzy clustering strategy; Nov. 41 (4) Technometrics 41 (4) November
pp. 340-351 .
Segal, M. N. & Giacobbe, R.W. (1994) . Market segmentation and competitive analysis for
supermarket retailing. International Journal of Retail & Distribution Management, 22 (1), pp. 38
- 48.
Seitz, V. (1998). Acculturation and direct purchasing behavior among ethnic groups in the
US: implications for business practitioners. The Journal of Consumer Marketing, Santa
Barbara, 1 5 (1), pp. 23 - 31 . Retrieved February 1 1 , 2003, from ProQuest database.
Solis, D. (2002, July 18) . Hispanic buying power to continue growing fastest among
minorities, study says, The Dallas Morning News, Knight Ridder Tribune Business
News, �ashington).
1 1 0

Solomon, M.R. (2004) . Consumer behavior: Buying, having and being. Pearson/Prentice Hall,
Upper Saddle River, NJ.
Smith, L. D., & Sanchez, S. M. (2003) . Assessment of business potential at retail sites:
Empirical findings from a US supermarket chain, The International Review of Retail,
Distribution and Consumer Research, 13 (1), pp. 37 - 58.
Sullivan, P. & Savitt, R. (1997) . Store patronage and lifestyle factors: Implications for rural
grocery retailers, International Journal of Retail & Distribution Management, 25 (10/11),
pp. 351 - 365.
Tigert, J .D. (1983) . Pushing the hot buttons for a successful retailing strategy, in Darden,
W.R. and Lusch, R.F. (eds), Patronage Behavior and Retail Management, Elsevier Science,
Amsterdam, pp. 89 - 113.
Toothman, M. (2005) . New market, new flavor: Supermarket chain celebrates opening of
Hispanic-centered store in Kissimmee, The I..edger, April 22, E2, pp. 1.
Turley, L. W., & Milliman, R. E. (2000) . Atmospheric effects on shopping behavior: A
review of the experimental evidence, Journal of Business Research. 49, 193 - 211 . .
Turley, L. W., & Chebat, J. (2002). Linking retail strategy, atmospheric design and shopping
behavior, Journal of Marketing Management, 18, pp. 125 - 144.
Ueltschy, L. C., & Krampf, R. F. (1997) . The influence of acculturation on advertising
effectiveness to the Hispanic market, Journal of Applied Business Research, Laramie, 13
(2), (Spring), pp 87 - 101. Retrieved March 5, 2003 from ProQuest database.
U.S. Census Bureau. (2001) . The Hispanic population in the United States: Population characteristics
March 2000. (March) .
U.S. Census Bureau. (2001b) . The Hispanic population: Census 2000 brief. (May) .
1 1 1

U.S. Census Bureau. (2004). Income, poverry, and health insurance coverage in the United Stales.
(August). Retrieved June 8, 2005 from www.census.gov/hhes/www /income/
income03.html.
Vakratsas, Demetrios, & Ambler, Tim, (1999). How advertising works: What do we really
know? Journal of Marketing, New York, 63 (1), Qanuary), pp 26 - 43. Retrieved
February 11, 2003 from ProQuest database.
Valencia, H. (1989). Hispanic values and sub-cultural research. Journal of the Academy of
Marketing Science, 17(1), 23-28.
Vavra, Bob, (2001). Bring the message En casa, Supermarket Business, New York, 56 (6), Qune
15), pp. 33, 36. Retrieved February 14, 2003, from ProQuest database.
Walters, C. G. (1974). Consumer behavior theory and practice. (revised). Homewood, IL: Richard
D. Irwin, Inc.
Wilkie, W. L., & Pessemier, E. A. (1973). Issues in marketing's use of multi-attributeattitude
models, Journal of Marketing Research, 10 (November), pp. 428 - 421.
www.fmi.org/ facts_figs/ superfact.htm. Retrieved November 4, 2004.
www.fmi.org/facts_figs/keyfacts/stores.htm. Retrieved November 16, 2004.
www.retailwire.com/ACN/Tip11.cfm. Retrieved January 5, 2005.
Yorgey, L. (2000). The Latino Renaissance. Target Marketing. 23(12), 40-50.
Zarkada-Fraser, A. & Fraser, C. (2002). Store patronage prediction for foreign-owned
supermarkets, International J oumal of Retail & Distribution Management, 30(6), pp.
282 - 299.
1 1 2

APPENDIX
1 1 3

Table 1: Varieties of Acculturation
Hispanic Seek Positive Varieties of Retention of Relationship to
Acculturation Cultural Identity? American Society? Assimilation No Yes Integration Yes Yes Separation Yes No Marginalization No No
Table 2: Fishbein's Attitude Model
Formula Symbol Symbol Meaning i attribute
j brand k consumer I importance weight given attribute i by consumer k
B consumer·k's belief regarding the extent to which brand j possesses attribute i
A A particular consumer's (k's) attitude score for brand j
Fishbein's Formula: Aik = I8i;kfa
Table 3: A Multi-attribute Model: Attitudes Toward Food Retailers
Formula Symbol Symbol Meaning i attribute s store k consumer I importance weight given attribute i by consumer k p consumer k's belief regarding the extent to which store s
possesses attribute i a particular consumer's (k's) attitude score for store s
As = LPiskLk
1 14

Table 4: The Frontstage Model (Hoffman & Turley, 2002)
Animate Environment Inanimate Environment Contact personnel General exterior. Employee characteristics Parking and location Number of employees Exterior store design Appearance of provider Exterior windows Gender of service provider Macroenvironment or shopping district Other customers General interior. Crowding Interior environment as a whole
Music Ambient odors Colors Lighting Ltyout and design Layout knowledge Use of power aisles P-0-P & Decoration Shelf space Product displays In-store signage In-arena signage Decorative style
1 1 5

Table 5: The Frontstage Model and the Survey
Hoffman & Turley Model Corresponding Survey Question
Part A I Part B
Inanimate Environment General exterior: General Outside: Parking and location 1 . Easy parking 2.
2. Convenient store location 3. Exterior store design 3. Pleasing exterior appearance 4. Exterior windows (not used) Macroenvironment or shopping 4. Pleasing shopping area around 5. district store General interior: General Inside: Interior environment as a whole 5. Pleasing interior environment 6. Music 6. Pleasing background music 7. Ambient odors 7. Pleasant odors/ smell 8. Colors 8. Pleasant color scheme 9. Lighting 9. Well-lit interior 10. 1..Ayout and design Layout & Design: Layout knowledge 10. Organized store layout 1 1 . Use o f power aisles 1 1 . Wide aisles 12. P-O-P & Decoration Point of Purchase & Decoration: Shelf space 12. Adequate shelf space for products 13 . Product displays (not used) In-store signage 1 3. Attractive store signage 14.
14. Bilingual store signage 1 5. In-arena signage (not used) Decorative style 15 . Attractive decorative style 1 6.
Animate Environment Contact personnel Contact PersonneL· Employee characteristics 1 6. Friendly employees · 17 .
17 . Knowledgeable employees 1 8. 1 8. Bilingual employees 1 9.
Number of employees 1 9. Sufficient assistance available 20. from employees
Appearance of provider (not used) Gender of service provider (not used) Other customers Other Customers: Crowding 20. Not crowded with other shoppers 21 .
in store
1 1 6
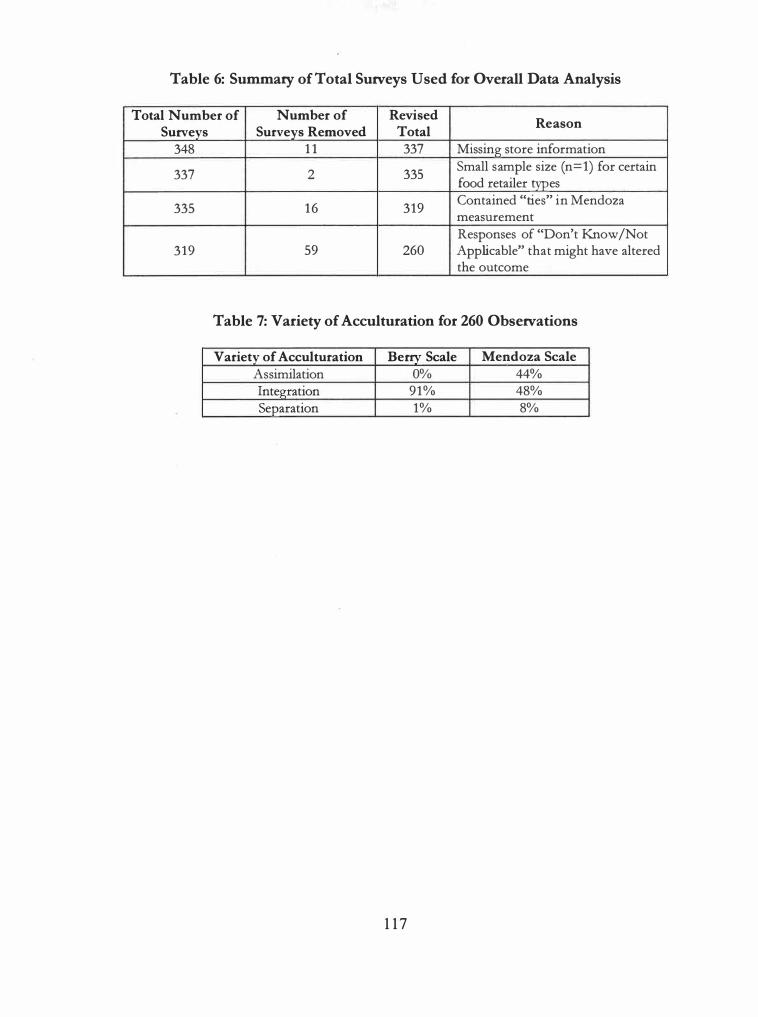
Table 6: Summary of Total Surveys Used for Overall Data Analysis
Total Number of Number of Revised Reason
Surveys Surveys Removed Total 348 1 1 337 Missing store information
337 2 335 Small sample size (n= l) for certain food retailer types
335 16 319 Contained "ties" in Mendoza measurement Responses of ''Don't Know/Not
319 59 260 Applicable" that might have altered the outcome
Table 7: Variety of Acculturation for 260 Observations
Variety of Acculturation Berry Scale Mendoza Scale Assimilation 0% 44%
Integration 91% 48%
Separation 1% 8%
1 1 7

Table 8: PCA Results: Eigenvalues for 260 Observations
Eigenvalues Individual Cumulative Percent Percent
No. Eigenvalue 1 14.32733 49.40 49.40 2 4.446227 15.33 64.74 3 1 .328642 4.58 69.32 4 1 .062043 3.66 72.98 5 0.886214 3.06 76.04 6 0.784690 2.71 78.74 7 0.636835 2.20 80.94 8 0.532298 1 .84 82.77 9 0.488678 1 .69 84.46
10 0.438353 1 .51 85.97 1 1 0.391352 1 .35 87.32 12 0.361872 1 .25 88.57 13 0.339414 1 . 17 89.74 14 0.335016 1 . 16 90.89 15 0.302755 1 .04 91 .94 16 0.285704 0.99 92.92 17 0.247828 0.85 93.78 18 0..24431 1 0.84 94.62 19 0.232637 0.80 95.42 20 0.212732 0.73 96. 15 21 0.191 800 0.66 96.82 22 0.1 64744 0.57 97.38 23 0. 1 51605 0.52 97.91 24 0.135279 0.47 98.37 25 0.1 17921 0.41 98.78 26 0. 1 1 0936 0.38 99. 16 27 0.098591 0.34 99.50 28 0.091316 0.31 99.82 29 0.052879 0. 18 100.00
1 1 8

Table 9: PCA Factor Loadings Summary: Mendoza Scale
Factor 1 Factor 2 Factor 3 Variables Loadings Variables Loadings Variables Loadings Culture most Language used Language spoken comfortable with -0.831563 w/siblings 0.494088 w / grand-parents -0.554471
Culture most Language of TV Language spoken familiar with -0.773127 watched -0.461 657 w/father -0.548306
Ethnicity of Language spoken people you want Language used w/mother -0.521 140 acceptance from -0.763834 w/spouse -0.459984
Ethnicity of Language used friends -0.758392 w/children -0.454144
Culture most Language used in proud of -0.738932 !prayer -0.451 688
Language used Language used w / siblings -0.736444 w/friends -0.447935
Language of radio Ethnic foods listened to -0.736310 eaten 0.447091
Ethnicity of Language of jokes people at social familiar with -0.730978 functions 0.445375
Language of music Ethnicity of listened to -0.730421 marriage partner 0.436908
Language used w/spouse -0.727729 Ethnicity of dates 0.434751
Ethnicity of Language used in people you want prayer -0.727413 acceptance from 0.432362
Ethnic Ethnicity of background of people at social indiv. admired functions -0.726546 most 0.423422
Language used Ethnicity of w/friends -0.721972 friends 0.422925
Ethnic composition of
Language of TV community most watched -0.71 5886 want to live in 0.4201 51
Culture w/most Language of jokes !positive impact -0.7 1 1 138 familiar with -0.412800
Ethnic holidays Language spoken
observed -0.707713 w/mother -0.410977
Language used w/children -0.706906
Ethnicity of dates -0.69721 1
1 1 9

Table 9: Continued.
Factor 1 Factor 2 Factor 3
Variables Loadings Variables Loadings Variables Loadings
Ethnic composition of community most want to live in -0.693852
Language teach/have taught children -0.690372
Ethnic background of indiv. admired most -0.676185
Ethnic foods eaten -0.655935
Language spoken w/father -0.655107
Language spoken w/mother -0.654576
Ethnicity of marriage partner -0.639727
Language spoken w / grand-parents -0.585626
Language used when reading print -0.564100
Culture criticize most -0.542087
1 20

Table 10: Factor Analysis Structure Summary after Varimax Rotation: Mendoza Scale
Factor 1 Factor 2 Factor 3 Variables Loadings Variables Loadings Variables Loadings Ethnicity of Language people you want Language of spoken w/ acceptance from -0.841 546 TV watched -0.842069 father -0.791 921
Language of Language Ethnicity of jokes familiar spoken w/ friends -0.831 1 95 with -0.813344 mother -0.772359 Ethnicity of Language people at social Language spoken w/ functions -0.82091 8 used in prayer -0.786965 grandparents -0.568395
Language used
Ethnicity of dates -0.784627 w/friends -0.786404
Ethnic composition of Language community most used want to live in -0.775073 w/spouse -0.782142
Language Culture most used �omfortable with -0.771989 w/siblings -0.777676 Ethnic oackground of Language of indiv. admired music listened most -0.759033 to -0.765082
Language of Ethnic foods radio listened ieaten -0.758869 to -0.75581 5
Language !Culture most used tproud of -0.753026 w/children -0.755626
Language teach/have
tEthnicity of taught marriage partner -0.737365 children -0.675049
Language �ulture most used when familiar with -0.726895 reading print -0.67247
Language Ethnic names spoken used for children -0.720766 w/mother -0.508786
Language Ethnic holidays spoken observed -0.715531 w/father -0.482809
�ulture w/most !Positive impact -0.714626 !Culture criticized most -0.50121 6
1 2 1

Table 11: Fuzzy Cluster Medoids Section
Variable Cluster1 Cluster2 Cluster3 Factorl 3 .0491910 -4.61 1571 -0.3824265 Factor2 0.5769297 1 . 190495 -2.3128540 Factor3 0. 1 1 84767 3 . 726162E-02 ·-0.5142558 Row 46 7 131
Table 12: Sample of Fuzzy Cluster Output
Observation Cluster Number Number Cluster 1 Cluster 2 Cluster 3
31 2 0.360150686 0.431587746 0.208261 568 32 3 0.006558944 0.009503639 0.98393741 8 33 3 0.30725531 1 0.032326171 0.660418518 34 3 0.286564370 0.022519798 0.690915832 35 3 0.077965256 0.014352968 0.907681775 36 3 0.010468496 0.037022124 0.952509379
1 22

Table 13: Discriminant Analysis Jackknife and Stepwise Results
Cluster/ % Correctly Method Classified Variables
224/260 or 86.2% All 29
Culture most comfortable with; Ethnic background of individual admired most; Language of music listened to;
Fuzzy Language used in prayer; Ethnic holidays observed;
Cluster 225/260 or Ethnicity of people attend social functions with; Ethnic
86.5% names used for children; Culture most proud of; Language of 1V programs watched; Language used w/friends; Language used w/mother; Language used w/parents; Culture criticized most; Ethnic composition of community most want to live in
206/260 or 79.2% All 29
Mendoza Language used in prayer; Culture most comfortable with;
Method 224/260 or Language of music listened to; Language used w/father;
86.2% Language used w / friends; Language of familiar jokes; Ethnic holidays observed; Ethnic foods eaten; Culture most familiar with
1 23

Table 14: Demographic Differences
Variety of Acculturation Hispanics Demographic Variable Assimilated Inte,R_rated Separated Overall
Total in each group (%) 44 48 8 100
Gender (f/m by count) 103/1 1 104/22 17/3 225/35
Age (average) 43 41 35 42
Household Total (average) (over 1 8 / under 18) 3 (2/1) 3 (2/1) 4(3/1) 4(3/1)
Education Level (%) Elementary - 6 2 2 0 2
7 - 8 0 1 0 0 9 - 12 30 34 47 33
1 - 2 years of college 31 36 32 33 3 - 4 years of college 13 10 0 1 1
College graduate and higher 24 1 8 21 21
Income (%) less than $1 5,000 7 7 5 7
$15,000 - $29,999 13 1 8 47 1 8 $30,000 - $44,999 24 23 21 23 $45,000 - $59,999 14 16 1 1 1 5 $60, 000 - $74,999 10 14 5 12 $75, 000 - $89,999 14 8 0 10 $90,000 - $104,999 10 8 5 9
$105,000 - $1 1 9,999 3 1 0 2 over $120,000 5 5 5 5
Bom in USA (%) 97 93 40 91
1 24

Table 15: MANOVA Tests for Hypothesis 1
Term(DF) Test F- Prob Test Statistic Value DF1 DF2 Ratio Level <(0.05) A(2):AGroup Wilks' Lambda 0.821843 40 476 1 .23 0. 166801 Accept Hotelling-Lawley Trace 0.206491 40 474 1 .22 0. 169786 Accept Pillai's Trace 0. 1 8661 1 40 478 1 .23 0. 163869 Accept Roy's Largest Root 0. 122562 20 239 1 .46 0.094791 Accept
1 25

Table 16: Means and Standard Deviations for Hypothesis 1
Standard Attribute/Variety Mean Deviation Easy Parking
All 1 8.27467 Assimilated 1 8.54386 0.6094351 Integrated 17.7301 6 0.5796884 Separated 1 8.55000 1 .4550060 Convenient Location
All 20.84805 Assimilated 20.93860 0.6094351 Integrated 20.55556 0.5796884 Separated 21 .05000 1 .4550060 Outside Appearance
All 1 8. 16377 Assimilated 17.67544 0.6094351 Integrated 1 8.01 587 0.5796884 Separated 1 8.80000 1 .4550060 Shopping Area
All 1 8.49659 Assimilated 1 8.85088 0.6094351 Integrated 1 8.88889 0.5796884 Separated 17.75000 1 .4550060 Pleasant Interior
All 1 9.82129
Assimilated 1 9.41228 0.6094351 Integrated 20.301 59 0.5796884 Separated 1 9.75000 1 .4550060 Music
All 1 3.25007 Assimilated 1 9.41228 0.6094351 Integrated 20.30159 0.5796884 Separated 1 9.75000 1 .4550060
1 26

Table 16: Continued.
Standard Attribute/Variety Mean Deviation
Pleasant Odors
All 20.3491 6
Assimilated 20.30702 0.6094351
Integrated 20.69048 0.5796884
Separated 20.05000 1 .4550060 Color Scheme
All 1 6.27197
Assimilated 1 5.34210 0.6094351
Integrated 1 6.02381 0�5796884
Separated 17 .45000 1 .4550060 Well-lit Interior
All 19.92178
Assimilated 19.88597 0.6094351
Integrated 20.57936 0.5796884
Separated 19.30000 1 .4550060 Organized Layout
All 20.55971
Assimilated 20.78070 0.6094351
Integrated 21 .69841 0.5796884
Separated 19.20000 1 .4550060 Wide Aisles
All 19.70486
Assimilated 19.89474 0.6094351
Integrated 20.26984 0.5796884
Separated 1 8.95000 1 .4550060 Product Shelf Spac�
All 19.47256
Assimilated 1 8.87719 0.6094351
Integrated 19.69048 0.5796884
Separated 19.85000 1 .4550060
1 27

Table 16: Continued.
Standard Attribute/Variety Mean Deviation
Attractive Signs
All 17.69206 Assimilated 16.83333 0.6094351 Integrated 17.14286 0.5796884 Separated 19.10000 1.4550060 Bilingual Signage
All 14.56743 Assimilated 12.81579 0.6094351 Integrated 14.93651 0.5796884 Separated 15.95000 1.4550060 Attractive Decor
All 15.74218 Assimilated 15.40351 0.6094351 Integrated 15.87302 0.5796884 Separated 15.95000 1.4550060 Friendly Employees
All 21.90310 Assimilated 21.62281 0.6094351 Integrated 22.43651 0.5796884 Separated 21.65000 1.4550060 Knowledgeable Employees
All 21.69600 Assimilated 20.98246 0.6094351 Integrated 22.55556 0.5796884 Separated 21.55000 1.4550060 Bilingual Employees
All 16.49110 Assimilated 14.72807 0.6094351 Integrated 17.59524 0.5796884 Separated 17.15000 1.4550060
1 28

Table 16: Continued.
Standard Attribute/Variety Mean Deviation Sufficient Assistance
All 19.71433 Assimilated 19.35965 0.6094351 Integrated 20.83333 0.5796884 Separated 1 8.95000 1.4550060 Crowded w /Shoppers
All 1 6.47295 Assimilated 16.62281 0.6094351 Integrated 1 6.74603 0.5796884 Separated 16.05000 1 .4550060
1 29

Table 17: ANOVA Tests for Hypothesis 1
Term(DF) Test Prob Test Statistic Value DF1 DF2 F-Ratio Level <(0.05) A(2):AGroup Easy Parking 21 .546951 2 257 0.55 0.577934 Accept Convenient Locatic 5.292049 2 257 0.25 0.780917 Accept Outside Appearanc 1 1 .726028 2 257 0.35 0.702135 Accept Shopping Area 1 1 .639552 2 257 0.42 0.658973 Accept Pleasant Interior 23.820678 2 257 0.95 0.389783 Accept Background Music 14.752445 2 257 0.38 0.685305 Accept Pleasant Odors 6.339291 2 257 0.22 0.799788 Accept Color Scheme 42. 1 75998 2 257 1 . 16 0.31 5640 Accept Well-lit Interior 22.71 8823 2 257 0.86 0.423799 Accept Organized Layout 64.469464 2 257 2.92 0.055587 Accept Wide Aisels 16.241957 2 257 0.62 0.536363 Accept Product Shelf Space 22.543440 2 257 0.93 0.394231 Accept Attractive Signs 43.736355 2 257 1 .35 0.260274 Accept Bilingual Signage 1 72.282410 2 257 3.30 0.038327 Reject Attractive Decor St 7.427344 2 257 0.20 0.821362 Accept Friendly Employeei 21 .290540 2 257 1 . 1. 3 0.325393 Accept Knowledgeable Employees 74.669681 2 257 3.78 0.024089 Reject Bilingual Employee 253.759418 2 257 4.91 0.008094 Reject Sufficient Assistanc 77.9151 1 5 2 257 2.82 0.061450 Accept ' Crowded w /Shopp 4.205833 2 257 0. 10 0.905476 Accept
1 30

Table 18: MANOVA Tests Section for Hypothesis 3
Term(DF) Test Prob
Test Statistic Value
DF1 DF2 F-Rati Level
<(0.05) A(2):S1Type Wilks' Lambda 0.860138 20 239 1 .94 0.010658 Reject Hotelling-Lawley Trace 0. 162605 20 239 1 .94 0.010658 Reject Pillai's Trace 0.139862 20 239 1 .94 0.010658 Reject Roy's Largest Root 0. 162605 20 239 1 .94 0.010658 Reject
1 3 1

Table 19: Means and Standard Deviations for Hypothesis 3
Standard Attribute/Variety Mean Deviation
Easy Parking
All 1 6.70681
Supercenter 14.92000 1 .2987840
Supermarket 1 8.49362 0.4236165
Convenient Location
All 1 9.56340
Supercenter 1 8.08000 1 .2987840
Supermarket 21 .04681 0.4236165
Outside Appearance
All 1 6.76213
Supercenter 1 5.32000 1 .2987840
Supermarket 1 8 20426 0.4236165 Shopping Area
All 17 .62979
Supercenter 1 6.20000 1 .2987840
Supermarket 19.05957 0.42361 65
Pleasant Interior
All 1 8.67660
Supercenter 17.20000 1 .2987840
Supermarket 20. 1 5319 0.4236165
Background Music
All 12.6791 5
Supercenter 12.32000 1 .2987840
Supermarket 13.03830 0.4236165 Pleasant Odors
All 19.94000
Supercenter 1 9.28000 1 .2987840
Supermarket 20.60000 0.42361 65
Color Scheme
All 14.96128
Supercenter 1 3.88000 1 .2987840
Supermarket 1 6.04255 0.4236165
1 32

Table 19: Continued.
Standard Attribute/Variety Mean Deviation
Well-lit Interior
All 20.29447 Supercen ter 20.44000 1 .2987840 Supermarket 20. 14894 0.42361 65 Organized Layout
All 20.21745 Supercenter 1 9.12000 1 .2987840 Supermarket 21 .31489 0.4236165 Wide Aisles
All 1 9.46596 Supercenter 1 8.80000 1 .2987840 Supermarket 20. 1 31 91 0.4236165 Product Shelf Space
All 1 8.53021 Supercenter 17.52000 1 .2987840 Supermarket 1 9.54043 0.4236165 Attractive Signs
All 1 6.33660 Supercenter 1 5.32000 1 .2987840 Supermarket 1 7.353 19 0.4236165 Bilingual Signage
All 1 3.63575 Supercenter 13.08000 1 .2987840 Supermarket 14. 1 9149 0.4236165 Attractive Decor
All 14.94340 Supercenter 14.04000 1 .2987840 Supermarket 1 5.84681 0.4236165 Friendly Employees
All 20.75957 Supercenter 1 9.20000 1 .2987840 Supermarket 22.31915 0.42361 65
1 33

Table 19: Continued.
Standard Attribute/Variety Mean Deviation
Knowledgeable Employees
All 20.52468 Supercenter 1 8.96000 1 .2987840 Supermarket 22.08936 0.4236165 Bilingual Employees
All 1 5.45319 Supercenter 14.40000 1 .2987840 Supermarket 16.50638 0.4236165 Sufficient Assistance
All 19.38000 Supercenter 1 8.56000 1 .2987840 Supermarket 20.20000 0.4236165 Crowded w /Shoppers
All 16.37106 Supercenter 16.04000 1 .2987840 Supermarket 16.70213 0.4236165
1 34

Table 20: ANOVA Tests Section for Hypothesis 3
Term(DF) Test Prob
Test Statistic Value
DF1 DF2 F-Ratio Level
<(0.05) A(2):S1Type Easy Parking 288.569574 1 258 7.57 0.006349 Reject Convenient 198.890278 1 258 9.67 0.002083 Reject Location Outside 1 87.975794 1 258 5.81 0.01 6625 Reject Appearance Shopping Area 184.772504 1 258 6.81 0.009589 Reject Pleasant Interior 197.068740 1 258 8.04 0.004940 Reject Background 1 1 .658527 1 258 0.30 0.584539 Accept Music Pleasant Odors 39.371538 1 258 1 .40 0.237936 Accept Color Scheme 105.673993 1 258 2.92 0.088678 Accept Well-lit Interior 1 .914304 1 258 0.07 0.788093 Accept Organized 108.858282 1 258 4.94 0.027163 Reject Layout Wide Aisels 40.085516 1 258 1 .55 0.214423 Accept Product Shelf 92.240196 1 258 3.87 0.050325 Accept Space Attractive Signs 93.409509 1 258 2.90 0.089609 Accept Bilingual 27.91 5483 1 258 0.52 0.469402 Accept Signage Attractive Decor 73.766432 1 258 1 .98 0. 1 61059 Accept Style Friendly 219.840016 . 1 258 12. 13 0.000582 Reject Employees Knowledgeable Employees 221 .281980 1 258 1 1 .41 0.000844 Reject Bilingual 100.255728 1 258 1 .89 0.170535 Accept Employees Sufficient 60.77461 5 1 258 2.1 8 0. 141 121 Accept Assistance Crowded 9.906448 1 258 0.23 0.628317 Accept w/Shoppers
1 35
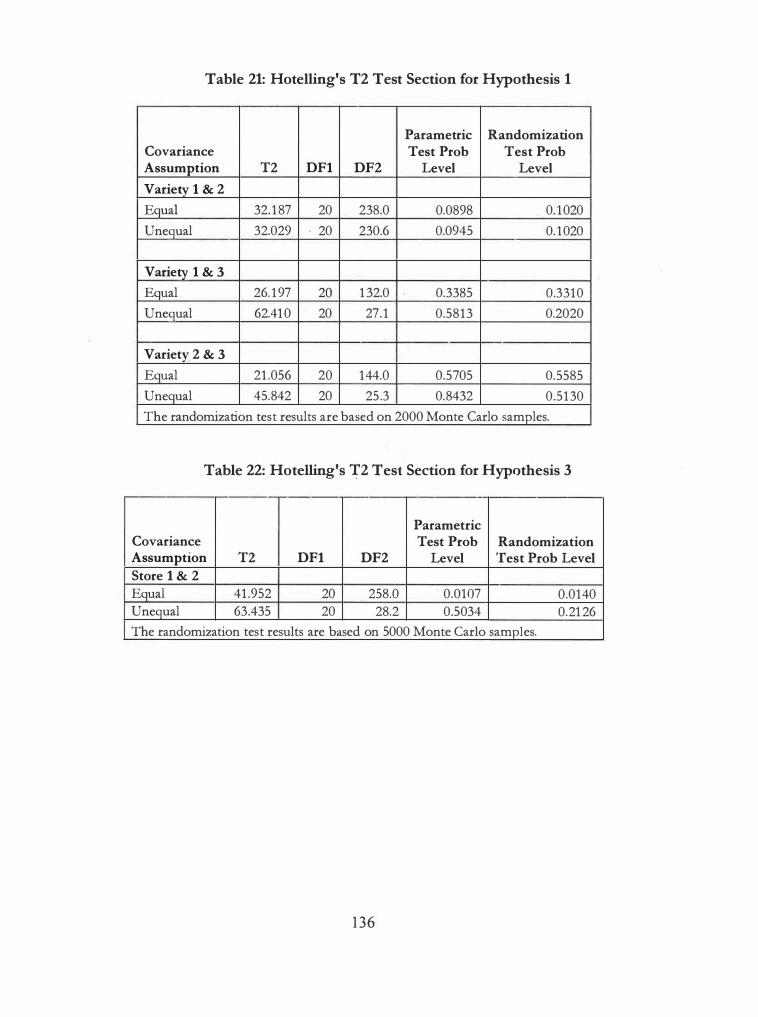
Table 21: Hotelling's T2 Test Section for Hypothesis 1
Parametric Randomization Covariance Test Prob Test Prob Assumption T2 DF1 DF2 Level Level
Variety 1 & 2
Equal 32.187 20 238.0 0.0898 0.1020 Unequal 32.029 20 230.6 0.0945 0.1020
Variety 1 & 3
Equal 26.197 20 132.0 0.3385 0.3310 Unequal 62.410 20 27.1 0.5813 0.2020
Variety 2 & 3
Equal 21.056 20 144.0 0.5705 0.5585 Unequal 45.842 20 25.3 0.8432 0.5130 The randomization test results are based on 2000 Monte Carlo samples.
Table 22: Hotelling's 12 Test Section for Hypothesis 3
-
Parametric Covariance Test Prob Randomization Assumption T2 DF1 DF2 Level Test Prob Level Store 1 & 2 Equal 41.952 20 258.0 . 0.0107 0.0140 Unequal 63.435 20 28.2 0.5034 0.2126 The randomization test results are based on 5000 Monte Carlo samples.
1 36

Table 23: Hotelling's T2 Student's T-Test Section for Hypothesis 3
T2 Parametric Randomization
Test Test Variable or
Prob Prob I Student's T
Level Level All (f2) 41 .952 0.0107 0.0140 Easy Parking 2.752 0.0063 0.0080 Convenient Location 3 .1 10 0.0021 0.0020 Outside Appearance 2.41 1 0.0166 0.0140 Shopping Area 2.610 0.0096 0.0080 Pleasant Interior 2.835 0.0049 0.0050 Background Music 0.547 0.5845 0.5835 Pleasant Odors 1 . 1 83 0.2379 0.2665 Color Scheme 1 .709 0�0887 0.0910 Well-lit Interior 0.269 0.7881 0.7945 Organized Layout 2.222 0.0272 0.0260 Wide Aisels 1 .245 0.2144 0.2035 Product Shelf Space 1 .966 0.0503 0.0520 Attractive Signs 1 .704 0.0896 0.1000 Bilingual Signage 0.725 0.4694 0.4490 Attractive Decor Style 1 .406 0. 1 61 1 0.1 655 Friendly Employees 3.483 0.0006 0.0025 Knowledgeable Employees 3.378 0.0008 0.0030 Bilingual Employees 1 .374 0.1 705 0. 17 15 Sufficient Assistance 1 .476 0.141 1 0. 1 395 Crowded w /Shoppers 0.485 0.6283 0.6410 The randomization test results are based on 5000 Monte Carlo samples .
1 37

Table 24: McHenry Selection Results
Model R-Squared
R-Squared Coded Variables
Size Change 1 0.044912 0.044912 p 2 0.065203 0.020291 BP 3 0.080385 0.015182 BIP 4 0.095442 0.01 5057 BEIP 5 0.104426 0.008984 BEIJP 6 0. 1 1 1423 0.006996 BEIJPT 7 0.120532 0.009109 BEHIJPT 8 0.125768 0,005237 ABEHIJPT 9 0.128042 0.002274 ABEHIJPST 10 0.1 30858 0.00281 6 ABEHIJPQST 1 1 0.1 33488 0.002630 ABCEHIJPQST 12 0.1 34943 0.001455 ABCEHIJLPQST 1 3 0. 1 36762 0.001 818 ABCEHIJKLPQST 14 0. 1 38161 0.001400 ABCEGHIJKLPQST 1 5 0. 1 38717 0.000556 ABCEGHIJKLPQRST
1 3 8

Table 25: MANOVA Tests Section for Hypothesis 3, 14 Attributes
Term(DF) Test Prob Test Statistic Value
DF1 DF2 F-Rati Level
<(0.05) A(2):S1Type Wilks' Lambda 0.861839 14 245 2.81 0.000663 Reject Hotelling-Lawley Trace 0. 160310 14 245 2.81 0.000663 Reject Pillai's Trace 0. 138161 14 245 2.81 0.000663 Reject Roy's Largest Root 0. 160310 14 245 2.81 0.000663 Reject
1 39

Table 26: Means and Standard Deviations for Hypothesis 3, 14 Attributes
Standard Attribute/Variety Mean Deviation
Easy Parking
All 1 6.70681 Supercenter 14.92000 1 .2987840 Supermarket 1 8.49362 0.4236165 Convenient Location
All 1 9.56340 Supercenter 1 8.08000 1 .2987840 Supermarket 21.04681 0.4236165 Outside Appearance
All 1 6.76213 Supercenter 1 5.32000 1.2987840 Supermarket 18.20426 0.4236165 Pleasant Interior
All 18.67660 Supercenter 17.20000 1 .2987840 Supermarket 20.15319 0.4236165 Pleasant Odors
All 19.94000 Supercenter 19.28000 1.2987840 Supermarket 20.60000 0.4236165 Color Scheme
All 14.96128 Supercenter 13.88000 1 .2987840 Supermarket 16.04255 0.4236165 Well-lit Interior
All 20.29447 Supercenter 20.44000 1.2987840 Supermarket 20.14894 0.4236165 Organized Layout
All 20.21745 Supercenter 19.12000 1.2987840 Supermarket 21.31489 0.4236165
1 40

Table 26: Continued.
Standard Attribute/Variety Mean Deviation
Wide Aisles
All 19.46596 Supercenter 18.80000 1.2987840 Supermarket 20.13191 0.4236165 Product Shelf Space
All 18.53021 Supercenter 17.52000 1 .2987840 Supermarket 19.54043 0.4236165 Friendly Employees
All 20.75957 Supercenter 19.20000 1.2987840 Supermarket 22.31915 0.4236165 Knowledgeable Employees
All 20.52468 Supercenter 18.96000 1.2987840 Supermarket 22.08936 0.4236165 Sufficient Assistance
All 19.38000 Supercenter 18.56000 1 .2987840 Supermarket 20.20000 0.4236165 Crowded w /Shoppers
All 16.37106 Supercenter 16.04000 1.2987840 Supermarket 16.70213 0.4236165
1 4 1

Table 27: ANOVA Tests Section for Hypothesis 3, 14 Attributes
Terrn(DF) Test Statistic A(2):S1Type Test
Value DF1 DF2 F-Ratio Prob. Level <(0.05) Easy Parking 288.569574 1 258 7 .57 0.006349 Reject Convenient Location 198.890278 1 258 9.67 0.002083 Reject Outside Appearance 187.975794 1 258 5.81 0.016625 Reject Pleasant Interior 197.068740 1 258 8.04 0.004940 Reject
Pleasant Odors 39.371538 1 258 1.40 0.237936 Accept
Color Scheme 105.673993 1 258 2.92 0.088678 Accept Well-lit Interior 1.914304 1 258 0.07 0.788093 Accept Organized Layout 108.858282 1 258 4.94 0.027163 Reject
Wide Aisels 40.085516 1 258 1.55 0.214423 Accept Product Shelf Space 92.240196 1 258 3 .87 0.050325 Accept Friendly Employees 219.840016 1 258 12. 1 3 0.000582 Reject
Knowledgeable Employees 221.281980 1 258 1 1.41 0.000844 Reject Sufficient Assistance 60.774615 1 258 2. 18 0. 141121 Accept Crowded w/Shoppers 9.906448 1 258 0.23 0.628317 Accept
1 42

Table 28: Hotelling's T2 Test Section for Hypothesis 3, 14 Attributes
Parametric Covariance Test Prob Randomization Assumption T2 DF1 DF2 Level Test Prob Level
Store 1 & 2
Equal 41 .360 14 258.0 0.0007 0.0012 Unequal 54.017 14 28.2 0.0846 0.0434 The randomization test results are based on 5000 Monte Carlo samples.
Table 29: Store Attribute Rankings and Means: Overall
Rank(Mean) Store Attribute
Overall S upercenter Supermarket Easy Parking 12(18.1) 1 5(14.9) 12(1 8.5) Convenient Location 4(20.7) 8(1 8.1) 4(21 .0J Outside Appearance 13(17.9) 13(15 .3) 1 3(1 8.2) Shopping Area 1 1 (1 8.7) 1 1 (1 6.2) 1 1 (19. 1) Pleasant Interior 9(19.8) 10(17.2) 7(20.2) Background Music 20(13.0) 20(12.3) 20(13.0) Pleasant Odors 5(20.4) 2(19.3) 5 (20.6) Color Scheme 17(1 5 .8) 1 8(1 3.9) 1 7(1 6.0) Well-lit Interior 6(20. 1) 1 (20.4) 8(20.1) Organized Layout 3(21 .0) 4(1 9.1) 3(21 .3) Wide Aisles 8(1 9.9) 6(18.8) 9(20.1) Product Shelf Space 10(19.3) 9(17.5) 10(19.5) Attractive Signs 14(17 .1) 14(15 .3) 14(17.4) Bilingual Signage 19(14.0) 19(1 3 .1) 19(14.2) Attractive Decor Style 18 (1 5.6) 17(14.0) 1 8(1 5.8) Friendly Employees 1 (22.0) 3(19.2) 1 (22.3) Knowledgeable Employees 2(21 .7) 5(19.0) 2(22. 1) Bilingual Employees 1 6(1 6.3) 16(14.4) 1 6(1 6.5) Sufficient Assistance 7 (20.0) 7(18.6) 6(20.2) Crowded w /Shoppers 15 (1 6.6) 12(16.0) 15 (1 6.7)
1 43

Table 30: Store Attribute Rank and Means: Assimilated Hispanics
Rank(Mean)
Store Attribute
Overall Supercenter Supermarket
Easy Parking 12(18.5) 11(16.1) 12(18.8) Convenient Location 3(20.9) 5(18.2) 3(21.2) Outside Appearance 13(17.7 16(14.0) 13(18.0) Shopping Area 11(18.9) 13(15.0) 10(19.2) Pleasant Interior 8(19.4) 12(15.8) 8(19.8) Background Music 20(12.7) 20(8.7) 19(13.1; Pleasant Odors 5(20.3) 3(19.2) 5(20.4) Color Scheme 17(15.3) 19(11.1) 17(15.8) Well-lit Interior 7(19.9) 2(19.7) 7(19.9) Organized Layout 4(20.8) 1(20.0) 4(20.9) Wide Aisels 6(19.9) 7(17.8) 6(20.1) Product Shelf Space 10(18.9) 8(1 7. 1) 11(19.0) Attractive Signs 14(16.8) 14(14.3) 14(17 .1) Bilingual Signage 19(12.8) 15(14.1) 20(12.7) Attractive Decor Style 16(15.4) 1 8(11.8) 16(15.8) Friendly Employees 1 (21.6) 4(1 8.8) 1(21 .9) Knowledgeable Employees 2(21.0) 10(16.1) 2(21.5) Bilingual Employees 18(14.7) 17(13.5) 18(14.8) Sufficient Assistance 9(19.4) 10(16.5) 9(19.6) Crowded w/Shoppers 15(16.6) 9(16.6) 15(16.6)
1 44

Table 31: Store Attribute Rankings and Means: Integrated Hispanics
Rank(Mean) Store Attribute
Overall S upercenter Supennarket Easy Parking 13(17.7) 20(12.7) 1 3(1 8.3) Convenient Location 7(20.6) 1 0(17. 1) 6(20.9) Outside Appearance 12(18.0) 1 5(1 5.1) 12(1 8.3) Shopping Area 1 1(18.9) 12(16.2) 1 1 (1 9.2) Pleasant Interior 8(20.3) 8(17.5) 7(20.6) Background Music 20(13.0) 1 8(14.9) 20(12.8) Pleasant Odors 5 (20.7) 7(17.9) 4(21 .0) Color Scheme 1 7(1 6.0) 1 6(1 5.0) 1 7(16. 1) Well-lit Interior 6(20.6) 2(21.1) 8(20.5) Organized Layout 3(21 .7) 6(19.3) 3(22.0) Wide Aisels 9(20.3) 4(19.6) 9(20.3) Product Shelf Space 1 0(19.7) 9(17.2) 10(20.0) Attractive Signs 1 5(17. 1) 1 3(1 5.9) 1 5 (17.3) Bilingual Signage 1 9(14.9) 1 9(14. 1) 1 9(1 5.0) Attractive Decor Style 1 8(1 5.9) 1 1(17 . 1) 18 (1 5.7) Friendly Employees 2(22.4) 3(20.5) 2(22.6) Knowledgeable Employees 1 (22.6) 1 (21 .4) 1 (22.7) Bilingual Employees 14(17.6) 14(1 5.8) 14(17 .8) Sufficient Assistance 4(20.8) 5(19.5) 5(21 .0) Crowded w /Shoppers 1 6(1 6.7) 1 7(14.9) 1 6(1 6.9)
145

Table 32: Store Attribute Rankings and Means: Separated Hispanics
Rank(Mean)
Store Attribute
Overall Supercenter Supermarket Easy Parking 13(18.2) 9(20.0) 14(17.9) Convenient Location 3(20.8) 2(21.7) 3(20.7) Outside Appearance 12(19.0) 5(20.7) 12(18.7) Shopping Area 14(18.1) 8(20.3) 15(17.6) Pleasant Interior 5(20.4) 4(20.7) 4(20.3) Background Music 20(13.9) 17(14.0) 20(13.9) Pleasant Odors 4(20.6) 1(25 .0) 7(19.8) Color Scheme 15(17.7) 12(18.7) 16(17.6) Well-lit Interior 10(19.3) 7 (20.3) 10(19. 1) Organized Layout 8(19.4) 1 5(15 .7) 5(20.1) Wide Aisels 7(19.5) 10(19.0) 9(19.6) Product Shelf Space 6(20.1) 6(20.3) 6(20.0) Attractive Signs 1 1(19.3) 14(16.3) 8(1 9.8) Bilingual Signage 19(1 5.5) 20(5.7) 1 8(17.3) Attractive Decor Style 17(1 6.2) 1 9(9.3) 17(17.4) Friendly Employees 2(21.7) 1 6(15;3) 1(22.9) Knowledgeable Employees 1 (21.8) 11 (1 8.7) 2(22.4) Bilingual Employees 1 6(17.4) 1 8(11.7) 1 3(1 8.5) Sufficient Assistance 9(19.3) 3(21.7) 1 1(18.9) Crowded w/Shoppers 18(16. 1) 13(18.7) 1 9(15.6)
1 46

Table 33: Shopping Trips and Expenditures: Overall
Food Retailer Type Hispanics - Overall % Who
Primary Store Shop Trips/ Week $/ Week
Supercenter 10% 1 .8 $122.00 Secondary Store
Supercenter 0% n/a n/a
Supermarket 40% 1 .2 $61 .25 Neighborhood grocer 8% 1 .0 $42.50 Warehouse club 4% 1 .0 $80.00 No second store 48% n/a n/a
Primary Store
Supermarket 90% 2.0 $100.43 Secondary Store
Supercenter 17% 1 .3 $62.71 Supermarket 19% 1 . 1 $45.20 Neighborhood grocer 1% 1 .3 $46.67 Warehouse club 3% 0.9 $60.00 No second store 59% n/a n/a
Overall Totals
Total Primary Store 100% 2.0 $102.56 Total Secondary Store 42% 1 . 1 $53.89
1 47

Table 34: Shopping Trips and Expenditures: Assimilated Hispanics
Food Retailer Type Assimilated Hispanics % Who
Primary Store Shop Tnps/ Week $/ Week
Supercenter 9% 1 .6 $125.00
Secondary Store
Supercenter 0% n/a n/a
Supermarket 30% 1 .2 $43 . 13
Neighborhood grocer 20% 1 .0 $35.00
Warehouse club 0% n/a n/a No second store 50% n/a n/a
Primary Store
Supermarket 90% 1 .9 $97.28
Secondary Store
Supercenter 15% 1 .0 $76.91 Supermarket 19% 1 .0 $54.55
Neighborhood grocer 0% n/a n/a
Warehouse club · 4% 1 .9 $70.00 No second store · 60% n/a n/a
Overall Totals
Total Primary Store 100% 1 .9 $99.80 Total Secondary Store 42% 1 .0 $62.42
1 48

Table 35: Shopping Trips and Expenditures: Integrated Hispanics
Food Retailer Type Integrated Hispanics % Who
Primary Store Shop Trips/ Week $/ Week
Supercenter 10% 1 .9 $125.77
Secondary Store
Supercenter 0% n/a n/a
Supermarket 50% 1 .4 $70.00
Neighborhood grocer 0% . n/a n/a
Warehouse club 0% n/a n/a
No second store 50% n/a n/a
Primary Store
Supermarket 90% 2.2 $103.51
Secondary Store
Supercenter 1 8% 1 . 5 $53.57
Supermarket 14% 1 .2 $37.81
Neighborhood grocer 1% 1 .0 $50.00
Warehouse club 3% 1 .0 $46.67
No second store 63% n/a n/a
Overall Totals
Total Primary Store 100% 2.1 $ 105.86
Total Secondary Store 38% 1 .3 $49.79
149

Table 36: Shopping Trips and Expenditures : Separated Hispanics
Food Retailer Type Separated Hispanics % Who
Pnmary Store Shop Tnps/ Week $/ Week
Supercenter 15% 1 . 5 $88.33
Secondary Store
Supercenter 0% n/a n/a
Supermarket 33% 0.3 $70.00
Neighborhood grocer 0% n/a. n/a
Warehouse club 33% 1 .0 $80.00
No second store 33% n/a n/a
Primary Store
Supermarket 85% 1 .8 $95.00 Secondary Store
Supercenter 13% 1 .0 $45 .00 Supermarket 44% 0.8 $33.75 Neighborhood grocer 13% 1 .5 $45.00 Warehouse club 0% n/a n/a
No second store 31% n/a n/a
Overall Totals
Total Primary Store 100% 1 .8 $93.89 Total Secondary Store 70% 0.9 $44.38
1 50

Table 37: Shopping Trips and Expenditures: "Don't Know/Not Applicable"
Food Retailer Type Hispanics - Overall
% Who Primary Store Shop Trips/ Week $/ Week
Supercenter 15% 1 .5 $103.06
Secondmy Store
Supercenter 0% n/a n/a
Supermarket 22% .8 $13.75
Neighborhood grocer 0% n/a n/a
Warehouse club 0% n/a n/a
No second store 78% n/a n/a
Primary Store
Supermarket 83% 2.0 $97.56
Secondary Store
Supercenter 20% 1 .2 $38.75
Supermarket 20% .8 $36.50
Neighborhood grocer 2% 1 .0 $25.00
Warehouse club 0% n/a $60.00
No second store 57% n/a n/a
Overall Totals
Total Primary Store 100% 1.9 $100.26
Total Secondary Store -41% 1.0 $35.34
1 5 1

Table 38: Overall Store Attribute Rank and Scores by Variety of Acculturation
Assimilation Integration Separation Store Attribute Overall Overall Overall Easy Parking 12(18.5) 1 3(17.7) 1 3(18.2) Convenient Location 3(20.9) 7(20.6) 3(20.8) Outside Appearance 13(17.7 12(18.0) 12(19.0) Shopping Area 11 (18.9) · 11 (18.9) 14(18.1) Pleasant Interior 8(19.4) 8(20.3) 5(20.4) Background Music 20(12.7) 20(13.0) 20(13.9) Pleasant Odors 5(20.3) 5(20.7) 4(20.6) Color Scheme 17(15.3) 17(16.0) 15(17.7) Well-lit Interior 7(19.9) 6(20.6) 10(19.3) Organized Layout 4(20.8) 3(21.7) 8(19.4) Wide Aisles 6(19.9) 9(20.3) 7(19.5) Product Shelf Space 10(18.9) 10(19.7) 6(20.1) Attractive Signs 14(16.8) 15(17 .1) 11 (19.3) Bilingual Signage 19(12.8) 19(14.9) 19(15.5) Attractive Decor Style 16(15.4) 18(1 5.9) 17(16.2) Friendly Employees 1(21.6) 2(22.4) 2(21 .7) Knowledgeable Employees 2(21.0) 1 (22.6) 1(21.8) Bilingual Employees 18(14.7) 14(17.6) 16(17.4) Sufficient Assistance 9(19.4) 4(20.8) 9(19.3) Crowded w/Shoppers 15(16.6) 16(16.7) 18(16. 1)
1 52

llous•hotd/ Buyer Ch.a ncteristica ._ .. _____ _., • l..o<ation .. l)emop-•pbic ,.aot• -LLte Style -'Pe HOM lity •Economic
c�nu•l Opinion• •nd Acttvitle•
Conurning SMppi.ng/Seuch
t I I
Attitude ._ ___ ... ,.,<. Toward St-0r�•
L-----------------��----------J
Figure 1 . Monroe & Guiltinan Store Choice Model
Source: Monroe, K., & Guiltinan, J. (1975) . A path-analytic exploration of retail patronage infl.uences,Journal of Consumer Research, 2 Oune), pp. 19 - 28.
1 53

Hispanic Consumer Characteristics
- Varieties of Acculturation
Food Retailer
Store Type
Choice
Attitudes Towards Food Retailers
·· · · · · · · · · · · · · · · · · · · · · � : Importance of Store : : Environment Attributes : . . . . · · · · · · · ·1· · · · ·1· · · · · · · · .. . . . . . . . . . . . · · · · · · · \ : Perceptions of Store : : Environment Attributes : . . . . . . . . • • . . . . . . . . . . . . . ••
Figure 2. A Conceptual Model for Hispanic Consumers' Attitudes
1 54

Varieties of Acculturation
I 1
Food Retailer Store Type
Choice
Figure 3. Proposed Hypotheses
1 55
Attitudes Towards Food
Retailers

Principal Component Analysis (to identify number of factors)
Fuzzy Cluster Analysis (to confirm clusters)
Nearest Neighbor Discriminant Analysis
Factor Analysis with varimax rotation
(to assess construct validity)
with jackknife and stepwise analyses (to detennine percent correctly classified
and variable reduction)
Enter into Hypotheses 1 and 2
Figure 4. Procedures Followed for Variety of Acculturation Measure
1 56

260 Observations
2 3 4 5 6 7 8 9 10 1 1 12 13 14 15 16 1 7 18 19 20 21 22 23 24 25 26 27 28 29
Number
Figure 5. Scree Plot of Eigenvalues
1 57

1 5
Factor2 Factor3
Figure 6. Scatter Plot #1 (Mendoza)
1 5
1 0
• 1
N tim 2
Factor2 Fador3
Figure 7 . Scatter Plot #2 (Fuzzy)
1 58

Figure 8. The Survey.
1 59

University of Tennessee Consumer Survey
PART A· Please indicate how important each store characteristic is to you when shoppingfor groceries, regardless of the store shopped, where 5 means "very important" an d " "p� k 1 means not very important. ease czrt
Store Characteristic: 1 . Easy parking 2. Convenient store location 3. Pleasing outside appearance 4. Pleasing shopping area around store 5. Pleasing inside environment
6. Pleasing background music 7. Pleasant odors/ smell 8. Pleasant color scheme 9. Well-lit interior 10.Organized store layout
1 1 .Wide aisles 12.Adequate shelf space for products 13.Attractive store signage 14.Bilingual store signage 15.A ttractive decorative style
16.Friendly employees 17 .Knowledgeable employees 1 8.Bilingual employees 19.Sufficient assistance available from employees 20.Not crowded with other shoppers in store
- -.g < 9
'"O 0 (1) 0 a � � a a
5 4 5 4
5 4
5 4
5 4
5 4
5 4 5 4 5 4 5 4
.5 4 5 4 5 4 5 4 5 4
5 4
5 4
5 4 5 4
5 4
1 60
(::
§" j" � '"0 5 0 ::..· 0 >-I � ::r � I') (1) I') ::::3 >-I a .....
3 3
3
3
3
3
3 3 3 3
3
3 3 3 3
3
3
3
3
3
your answer.
-- z 9 9 0 '"O z '"O ..... 0 0 <
a � � (1) a � a
2 1 2 1
2 1
2 1
2 1
2 1
2 1 2 1 2 1 2 1
2 1 2 1 2 1 2 1 2 1
2 1
2 1
2 1 2 1
2 1
> � :g g t, =-: � 0 n ......._ ::::3 §- z ..... � ro" �
9
9
9
9
9
9
9
9
9
9
9
9
9
9
9
9
9
9
9
9

PART B· Pleasefiii in the blank with the appropriate response.
1 . What one store do you shop most frequently for groceries?
b. How often each week do you shop at this store? __ _ c. On average, how much do you spend on groceries each week at this store?
Please indicate to what extent you agree or disagree that the above named store (where you shop most frequentfy for groceries) has the following characteristics, where 5 means ''strongly agree " and 1 means ''strongly disagree. "Please circle your answer.
Z o C/)
C/) o > 0 � 0 C/) � g > o > § � � Iii" � � Iii' 8 !ii " � > ... � � 0
I>) 0 ... . II) 0 I>) 0 :g � 0 � � 0 e- � � � 0
o crs.. 0 ::r o O O 0 ::r 0 ca. =-: 0 '< � o O '"' 0 � 0 '< n o
Store characteristic: '"' � � n ......__
2. Easy parking 5 4 3 2 1 9 3. Convenient store location 5 4 3 2 1 9 4. Pleasing outside 5 4 3 2 1 9 appearance 5. Pleasing shopping area 5 4 3 2 1 9 around store
6. Pleasing inside 5 4 3 2 1 9 environment 7. Pleasing background 5 4 3 2 1 9 music 8. Pleasant odors/ smell 5 4 3 2 1 9 9. Pleasant color scheme 5 4 3 2 1 9 10.Well-lit interior 5 4 3 2 1 9 1 1 .Organized store layout 5 4 3 2 1 9
12.Wide aisles 5 4 3 2 1 9 13.Adequate shelf space for 5 4 3 2 1 9 products 14.Attractive store signage 5 4 3 2 1 9 1 5.Bilingual store signage 5 4 3 2 1 9 16.Attractive decorative 5 4 3 2 1 9 style
1 7.Friendly employees 5 4 3 2 1 9 1 8.Knowledgeable 5 4 3 2 1 9 employees 1 9.Bilingual employees 5 4 3 2 1 9 20.Sufficient assistance 5 4 3 2 1 9 available from employees 21 .Not crowded with other 5 4 3 2 1 9 shoppers in store
1 6 1

22.Do you shop another food retailer when purchasing groceries? (check one) __ No --+(skip to PART C) __ Yes """l (If Yes) b.Please list their name here: (If Yes) c. How often do you shop at this store each week? ______ _ (If Yes) d. On average, how much do you spend on groceries each week at this store?
Part C: Please indicate to what extent do you agree or disagree with each �f the following statements, where 5 means ''strong/y agree " and 1 means "strongly disagree. " Please
. I. czrc. e your answer. C/) A" C/)
o > z tJ g, 0
>o ::,
� - � t"D �- 3 as. � � I>) t"D - · I>) t"D '< t"D � �
t"D e- � � > t"D ::r- t"D ::, t"D t"D ::r-� !:;
t"D O >-I t"D !:;
t"D t"D
1. Should Hispanics become an integral part of American 5 4 3 2 society? 2. Is the Hispanic culture 5 4 3 2 worth preserving? I 3. What is your national origin? (check on�)
Cuban --__ Mexican, Mexican American, Chicano
Puerto Rican --- Other Spanish/Hispanic/Latino (Prini group in blank Jpace below)
C/) q C/)
Part C continued: Please indicate 0 o > r:n ::, >
o
i;;· � '* t, o
to what extent you agree with the � � � �- 3 I>) t"D ... .
I>) t"D t"D � � (ti
e- � � fallowing statement: (1) ::r- (1) ::, t"D t"D ::r-
(Jq !:;
(1) 0 >-I t"D � "'
n:
4. I identify with my 5 4 3 2 national origin.
1 62
u C/J � - 8 � ::, t"D as. t"D '<
l
1
u C/J � - 8 � � � '<
1
z tl � g > �
"O .... "O � =-: ::, n o
g: t t"D
9
9
tl 0 >
"O ::, % Z � n o
I>) .... 0- 0 � � ........_
9

Part C continued· Please indicate which language(s)you use in each situation described below, where 5 means ''English on/y" and 1 means ''Spanish on/y. " Please circle your answer.
trJ trJ en > � en :::,
"'C)
0 � trJ en :::, trJ I>) en "'C) � � ...0 'E � I::) e. � 0 ]
"'C) 0 t, e..� e . ;. Q C 2 "' c,q "' 0
% � -� � 0
� ,,, . ::r i::-: ::r >; n -....... :::, '< "' "' .... (1) "' .... (1) � z .... � ::r ::r ::r '< ::r � ::r ::r I>) I>) r5""' Q. I::) 0- I::)
What language do you use when speaking: 5. with your grandparents? 5 4 3 2 1 9
6. with your father? 5 4 3 2 1 9
7. with your mother? 5 4 3 2 1 9
8. with your brothers and 5 4 3 2 1 9 sisters? 9. with your spouse? 5 4 3 2 1 9
10.with your children? 5 4 3 2 1 9
1 1 .in prayer? 5 4 3 2 1 9
12.with your friends? 5 4 3 2 1 9
What is the language of: 13. the newspapers and 5 4 3 2 1 9 magazines you read? 14.the music you listen to? 5 4 3 2 1 9
1 5.the radio stations you 5 4 3 2 1 9 listen to? 1 6.the television programs 5 4 3 2 1 9 you watch? 17.the jokes you are familiar 5 4 3 2 1 9 with? 18.What language(s) would you teach/have taught your 5 4 3 2 1 9
children?
1 63

Part C continued: Please indicate which of the choices best applies to your personal situation, where 5 means ''American on/y" and 1 means 'Hispanic on/y. " Please circle your answer.
.... � > e- � ::r 0 I>) 0 I>) >"\ ::3 >"\ = (b
Z c:, � g > .... � . o t � � §. 0 �
� � > (b
-¾ s· c:: 'ij t"l 9 � e. "g :g � �I>) I>) ('b Cll
'ij (b « e. � ::3 ::3 e g. '< � · ; g. "g t"l g 0
::3 � �- O" � n · � 0.. ib" '
What culture: 1 9.do you feel most familiar 5 4 3 2 1 9 with? 20.do you feel most 5 4 3 2 1 9 comfortable with? 21 .do you feel most proud 5 4 3 2 1 9 of? 22.do you criticize the most? 5 4 3 2 1 9
23.do you feel has had the most positive impact on 5 4 3 2 1 9 your life? What is the ethnicity of: 24.your friendship ties? 5 4 3 2 1 9
25.your dates? 5 4 3 2 1 9
26.people with whom you 5 4 3 2 1 9 attend social functions? 27.people you want most to 5 4 3 2 1 9 be accepted by? 28.your marriage partner 5 4 3 2 1 9 preferences?
29.What ethnic holidays do 5 4 3 2 1 9 you observe? 30.What ethnic foods do 5 4 3 2 1 9 you eat? 31 .What is the ethnic background of individual(s) 5 4 3 2 1 9 you admire the most? 32.What is the ethnic composition of the 5 4 3 2 1 9 community you would most want to live in? 33.What ethnic names would you use for your 5 4 3 2 1 9 children?
1 64

PART D: The following sets of questions are designed onjy for the purpose of statistical anajysis. As with all other responses, they 'II be kept in strict confidentiality under all circumstances. Onjy aJ!l,regated data, such as means, will be used in our stucfy. Please.ft/I in the blank with the appropriate response.
1 . Are you? (check one) __ Male Female 2. What is your age as of your last birthday? 3. What is the name of the city where you live? ________ _ 4. What is the zip code where you live? ________ _ 5. How many people currently live in your household? ____ (18 or older) ____ (under 18)
6. What is the last grade you completed in school: (check the one that applies)
_ Elementary ---- 6 7 - 8 9 - 12
_ 1 .:.... 2 years of college _ 3 - 4 years of college __ College graduate and higher 7 . What is the total annual income of your household? (check the one that applies)
_ less than $15,000 _ _ $15,000 - $29,999 _ $30,000 - $44,999 _ $45,000 - $59,999 _ $60, 000 - $74,999 _ $75, 000 - $89,999 _ $90,000 - $104,999 _ $105,000 - $1 19,999 _ over $120,000
8. In what country were you born? ________ _ If born in a country, other than the United States:
9. How long have you lived in the United States? ________ _ 10. How often do you return to visit the home country where you were born?
1 1 . How many years of schooling did you receive in your home country?
Thank you for participating in our survey. We appreciate your time and effort!
1 65

VITA
Carol Lynn S. Nute was born in Tampa, Florida on September 3, 1959. She attended
the University of Florida, where she received her Bachelor of Science degree in Business
Administration with a major in Marketing in 1983. She received her Master of Arts in
Teaching from the University of South Carolina in 2000, and her Doctor of Philosophy
(Human Ecology) with a focus on Retail and Consumer Sciences at the University of
Tennessee.
Her work experience includes an extensive background in retail, marketing and
teaching. Her retail experience includes management positions at Maas Brothers (now
Burdines), Body Shop and Gap. She. was a marketing director for Mercer Mall, a regional
center in Bluefield, WV. While a member of the International Council of Shopping Centers,
Carol Lynn obtained her Certified Marketing D1.rector certification. From there she became
a regional marketing director for power centers for New Market Management in their West
Chester, PA office, primarily serving the northeastern United States.
Following this, Carol Lynn started her own company, Retail Results, which she
operated for five years before going back to school to earn her master's degree. While
operating Retail Results, Carol Lynn continued to market shopping centers in South
Carolina, North Carolina and Florida, as well as consulted with a number of local retailers.
In addition, she operated a sister company, The Retail Press where she wrote, created and
designed a customized quarterly newsletter for regional malls which featured local events and
industry news. In 1995, she self-published a book, Common Sense to Retailing, and has sold
1 66

over 2000 copies. Also, as a continued involved member of the International Council of
Shopping Centers, Carol Lynn obtained her Senior Certified Marketing Director status.
Upon obtaining her master's degree in December 2000, Carol Lynn taught
business/marketing classes at a local high school. In addition to teaching at the high school
level, Carol Lynn also taught part time at both Midlands Technical College and Central
Carolina Community College.
Carol Lynn initially pursued her doctorate degree at the University of Tennessee part
time while teaching in the Columbia, South Carolina area. Then, in the fall of 2004, Carol
Lynn moved to the Knoxville area to attend school full time. While at the University of
Tennessee, Carol Lynn also taught courses and advised undergraduate students. She became ·
a member of both Kappa Omicron Nu Honor Society and the Association of Marketing
Theory · & Practice. She also continues to be a member of the International Counctl of ·
Shopping Centers. While attending the university, Carol Lynn presented a joint paper titled
"An Exploratory Study of Internet and Print Communication Strategies: Targeting the
Hispanic Market" which was later published in the Association of Marketing Theory ·&
Practice proceedings, in April 2004.
Upon receiving her doc�orate degree, Catol Lynn plans to continue teaching in the
Columbia, South Carolina area.
1 67