Accounting Conservatism and Controlling Shareholder ...BA%B7%A4%C7%D2%C1%20ADV/Kri… · general,...
47
1 Accounting Conservatism and Controlling Shareholder Characteristics: Empirical Evidence from Thailand Kriengkrai Boonlert-U-Thai Kiatniyom Kuntisook a Faculty of Commerce and Accountancy Chulalongkorn University, THAILAND April 9, 2009 Abstract This paper examines the effects of controlling shareholder (“CS”) characteristics on financial reporting conservatism. Controlling shareholder characteristics can be divided into two categories: i) founding family (“FF”) firms, and ii) family (“FAM”) firms. Since the alignment effect is likely to be more severe in FF and FAM firms, as FF and FAM firms are more likely to pass on their business to future generation and to protect the family’s reputation, this study hypothesized that increasing in FF and FAM member ownership are positively associated with accounting conservatism (or higher earnings quality), ceteris paribus. Consistent with our hypotheses, this study finds that conservatism, as measured by asymmetric timeliness of earnings, increases with greater controlling shareholder ownership FF and FAM firms and the effect is higher for FF firms as compared to FAM firms. This study also examines CEO characteristics (founder, descendent or hired outsider) in FF and FAM firms. In FF firms, all CEO characteristics are associated with more conservatism while, in FAM firm, only founder and hired from outside CEOs are associated with more conservatism. These results hold after controlling for industry and year-fixed effects, corporate governance (duality, board size, independent directors and big four audit firm) and firm characteristics (leverage, institutional ownership, firm size, litigation risk, and market-to-book ratio). Overall, this study provides empirical evidence for conservatism based on different controlling shareholder characteristics. Keywords: Accounting Conservatism, Controlling shareholder, Founding family, Family firm Data availability: the data used in this study are publicly available a Corresponding author: [email protected]
Transcript of Accounting Conservatism and Controlling Shareholder ...BA%B7%A4%C7%D2%C1%20ADV/Kri… · general,...

1
Accounting Conservatism and Controlling Shareholder Characteristics:
Empirical Evidence from Thailand
Kriengkrai Boonlert-U-Thai
Kiatniyom Kuntisook a
Faculty of Commerce and Accountancy Chulalongkorn University, THAILAND
April 9, 2009
Abstract
This paper examines the effects of controlling shareholder (“CS”) characteristics on financial reporting conservatism. Controlling shareholder characteristics can be divided into two categories: i) founding family (“FF”) firms, and ii) family (“FAM”) firms. Since the alignment effect is likely to be more severe in FF and FAM firms, as FF and FAM firms are more likely to pass on their business to future generation and to protect the family’s reputation, this study hypothesized that increasing in FF and FAM member ownership are positively associated with accounting conservatism (or higher earnings quality), ceteris paribus. Consistent with our hypotheses, this study finds that conservatism, as measured by asymmetric timeliness of earnings, increases with greater controlling shareholder ownership FF and FAM firms and the effect is higher for FF firms as compared to FAM firms. This study also examines CEO characteristics (founder, descendent or hired outsider) in FF and FAM firms. In FF firms, all CEO characteristics are associated with more conservatism while, in FAM firm, only founder and hired from outside CEOs are associated with more conservatism. These results hold after controlling for industry and year-fixed effects, corporate governance (duality, board size, independent directors and big four audit firm) and firm characteristics (leverage, institutional ownership, firm size, litigation risk, and market-to-book ratio). Overall, this study provides empirical evidence for conservatism based on different controlling shareholder characteristics.
Keywords: Accounting Conservatism, Controlling shareholder, Founding family, Family firm
Data availability: the data used in this study are publicly available
a Corresponding author: [email protected]

2
1. Introduction
Studies related to the influence of accounting conservatism on accounting
practices have been both long and significant1. Basu (1997) argues that
conservatism has influenced accounting practice for at least 500 years and
Sterling (1970) notes conservatism as the most influential principle of valuation
in accounting. Conservatism refers to the accountant’s tendency to require a
higher degree of verification when recognizing good news in earnings than for
recognizing bad news (Basu, 1997) or the differential verifiability required for
the recognition of accounting gains versus losses that generates understatement
of net assets (Holthausen and Watts, 2003a). Thus, conservatism can be viewed
as a means for management to manipulate accounting numbers or evidence on a
firm’s earnings quality. Recent research studies (e.g., Wang, 2006; LaFond and
Roychowdhury, 2008), suggest that founding family firms report higher quality
of earnings and when managerial ownership declines, earnings reports become
less timely in recognizing good new and more asymmetrically timely in
recognizing bad news. This study extends these studies by examining the
influence of different controlling shareholders characteristics on accounting
conservatism using a unique family ownership data set of Thailand.
When ownership is diffused to shareholders who are not family related, as is
typical in US and UK companies, agency problems arise from the conflicts of
interest between shareholders and managers who own an insignificant amount of
equity in the firm (Berle and Means, 1932; Jensen and Meckling, 1976). With
regard to the agency problem, conservatism has been hypothesized to facilitate
1 Accounting conservatism is a part of earnings attributes. Francis et al., (2004) characterize earnings attributes as either “accounting-based” or “market-based”. Accounting-based earnings attributes consist of accrual quality, persistence, predictability, smoothness while market-based earnings attributes comprise value relevance, timeliness, and conservatism.

3
efficient contracting between managers and shareholders. However, when
ownership is concentrated to a level at which an owner obtains effective control
of the firm, as is often the case in East Asia and most other locations outside the
US and the UK, the nature of the agency problem shifts away from manager-
shareholder conflicts to conflicts between the controlling owner (who is also the
manager) and minority shareholders (Fan and Wong, 2002). Thus, using a
unique sample set of Thai data would be a good means to explore conflicts
between the controlling owner and minority shareholders.
Conservatism is potentially useful with respect to controlling shareholders in
two ways. First, in compensation contracts, conservatism reduces the likelihood
that a manager (who is usually the founder or a descendant) will exert the effort
to overstate net assets and cumulative earnings in order to distribute the net
assets of the firm to themselves instead of exerting effort to take positive net
present value projects (Watts, 2003a). Second, in corporate governance,
conservatism provides timely signals for investigating the existence of negative
net present value projects and taking appropriate action if they exist.
Asymmetric verification speeds up the recognition of losses and provides
minority shareholders with a signal to investigate the reasons for those losses.
Therefore, conservative financial reporting is a governance mechanism that
reduces the controlling owner’s ability to manipulate and overstate financial
performance and increases the firm’s cash flow and value. In order to the
alignment effect motivates controlling shareholder to report higher-quality
earnings, it may reduce the demand for high-quality financial information by
contracting parties if they believe that controlling shareholder enhances
corporate governance. Controlling shareholders are unlikely to provide
4
managers with greater opportunity to use less conservative (or aggressive)
accounting2. Thus, the purpose of this study is to examine whether the
accounting conservatism is increased, ceteris paribus, when the controlling
shareholder ownership is higher.
Controlling shareholder ownership could affect accounting conservatism
reporting in one of two competing ways: the entrenchment effect and the
alignment effect. The entrenchment effect views that controlling shareholders
are less efficient because concentrated ownership creates the incentive for
controlling shareholders to expropriate wealth from the minority shareholders
(Fama and Jensen, 1983; Morck et al., 1988; Shleifer and Vishny 1997). The
alignment effect, which is based on the argument that family firms have
incentives to report earnings in good faith, implies that controlling shareholders
are more efficient because they create greater monitoring (Demsetz and Lehn,
1985; Shleifer and Vishny, 1997) and are more likely to forgo short-term
benefits from managing earnings because of the incentives to pass on their
business to future generations and to protect their family’s reputation and long-
term firm performance.
This paper examines the effects of controlling shareholder (“CS”)
characteristics on financial reporting conservatism. Controlling shareholder
characteristics can be divided into two categories: i) founding family (“FF”)
firms, and ii) family (“FAM”) firms. Using a sample of 1,733 firm-years over
2 Ball et al., (2000) argue that the opposite of aggressiveness, accounting conservatism, which is the more timely incorporation of economic losses versus economic gains into accounting earnings, arises to reduce information asymmetry. Specifically, they argue that three factors are expected to lead to accounting conservatism. First, accountants are aware that managers would like to report economic gains and suppress information about economic losses. Hence, accountants find negative information more credible, and are more likely to incorporate it into accounting income. Second, lenders are important users of financial statements, and lenders are more affected by economic losses then by economic gains. Third, the timely incorporation of economic losses provides an important corporate governance role, providing quick feedback about bad investment decisions and strategies that managers may not wish to disclose.

5
the period 2000-2006, the study hypothesizes that increasing in FF and FAM
member ownership are positively associated with accounting conservatism (or
higher earnings quality), ceteris paribus. This is because the alignment effect is
likely to be more severe in FF and FAM firms since FF and FAM are more
likely to pass on their business to future generation and to protect the family’s
reputation. As a result, firms are likely to provide managers with greater
opportunity to use more conservative accounting. Consistent with these
hypotheses, the results of this study show that conservatism, as measured by
asymmetric timeliness of earnings (Basu, 1997), increases with greater
controlling shareholder ownership in FF and FAM firms. Interestingly, the
study also finds that the effect is higher for FF firms as compared to FAM firms.
Following Anderson and Reeb (2003), this study also examines the influence of
different CEO characteristics (founder, descendent or hired outsider) on
accounting conservatism in FF and FAM firms. The results indicate that in FF
firms, all CEO characteristics are associated with more conservatism while, in
FAM firm, only founder and hired outsider CEOs are associated with more
conservatism.
The evidence in this study connects accounting conservatism and different
controlling shareholder characteristics (including FF and FAM firms), which is
important in the light of recent literature that has primarily focused on the
accounting conservatism arising out of debt contracting, corporate governance,
and international accounting. This study also finds complement in concurrent
research by LaFond and Roychowdhury (2008) in the following three important
ways. First, there are important differences in US GAAP and Thai GAAP. In
general, Thai GAAP follows International Financial Reporting Standards

6
(“IFRS”), which allow more variation in conservatism across firms. For
example, IFRS permits upward revaluations of assets and capitalization of
property, plant, and equipment and capitalization of certain internally-generated
intangibles (e.g. development costs) whereas US GAAP prohibits such upward
revaluation or capitalization of intangibles (Ahmed and Duellman, 2007).
Second, LaFond and Roychowdhury (2008) focus on examining CEO
ownership while this study emphasizes on FF and FAM firms. Third, Thailand
data are interesting because corporate governance in Thailand is weak relative to
those in western countries (Fan and Wong, 2002). This affords controlling
shareholders in Thailand the opportunity to expropriate minority shareholders’
wealth through excessive compensation schemes and related party transactions.
The remainder of this study is organized as follows. Section 2 presents
related theories and main hypotheses. Section 3 discusses empirical proxies,
data sources, and descriptive statistics. Section 4 presents empirical findings.
Section 5 concludes.
2. Related Theories and Hypothesis Development
When ownership is diffused, as is typical for US and UK corporations,
agency problems will stem from the conflicts of interest between outside
shareholders and managers who have an insignificant amount of equity in the
firm (Jensen and Meckling, 1976). On the other hand, when ownership is
concentrated to a degree that one owner has effective control of the firm, as is
typically the case in Asia (including Thailand), the nature of the agency problem
shifts away from manager-shareholder conflicts to conflicts between the
controlling owners (who are often also the managers) and minority shareholders

7
(Claessens and Fan, 2002) which are caused in two competing ways: the
entrenchment effect and the alignment effect3.
2.1 ENTRENCHMENT EFFECT
Fan and Wong (2002) mention that when ownership is concentrated to a
level at which an owner obtains effective control of the firm, the nature of the
agency problem shifts away from manager-shareholder conflict to conflict
between the controlling owner (who is often also the manager) and minority
shareholders. Gaining effective control of a corporation enables the controlling
owner to determine not just how the company is run, but also how profits are
shared among shareholders. Although minority shareholders are entitled to the
cash flow rights corresponding to their share of equity ownership, they face the
uncertainty that an entrenched controlling owner may opportunistically deprive
them of their rights. The entrenchment effect created by the controlling owner is
similar to the managerial entrenchment problem discussed by Morck et al.
(1988)4. Families are also capable of expropriating wealth from the firm through
excessive compensation, related party transactions, or special dividends. For
instance, a recent recapitalization plan at Ford Motor Co. increased the
controlling family’s voting power without providing compensation to the firm’s
other shareholders, leading to widespread criticism that the board’s plan
benefited the family at the expense of the other claimants (Schack, 2001).
3 Fan and Wong (2002) note that corporate share ownership can be viewed as a property rights arrangement through which the owner of the share is entitled to three categories of property rights. First, the owner has the decision right of deploying corporate assets, i.e., the control or voting right. Second, the owner has the right to earnings income, i.e., the cash flow right. Third, the owner has the right to transfer the share and the associated control and cash flow right to another party. 4 Morck, Shleifer and Vishny (1988) affirm that a high managerial ownership increases the capacity of the managers to make decision which do not maximize the value of the firm but improve their own wealth and their job security.

8
DeAngelo and DeAngelo (2000) suggest that the family’s desire for special
dividends can affect the firm’s capital expansion plans, leading to poor
operating and stock price performance.
2.2 ALIGNMENT EFFECT
The entrenchment effect demonstrates that family ownership and control can
lead to poor firm performance. However, family influence can also provide
competitive advantages. The alignment effect is based on the notion that the
interests of FF and other shareholders, or controlling shareholders and minority
interests, are better aligned because of the large blocks of stock owned by family
members and their long-term presence. Therefore, according to the alignment
effect, FF and CS are less likely to expropriate wealth from other shareholders
through managing earnings. Because the wealth of FF and CS is closely tied to
firm value, families have strong incentives to monitor employees (Anderson and
Reeb, 2003) and to create long-term loyalty in employees (Weber et al., 2003).
Demsetz and Lehn (1985) note that concentrated investors have substantial
economic incentives to diminish agency conflicts and maximize firm value.
Specifically, because the family’s wealth is so closely linked to firm welfare,
families may have strong incentives to monitor managers and minimize the free
rider problem inherent with small, atomistic shareholders. If monitoring requires
knowledge of the firm’s technology, families potentially provide superior
oversight because their lengthy tenure permits them to move further along the
firm’s learning curve. Stronger monitoring mechanisms, such as “No Absentee
Landlords” (Weber et al., 2003, p.110), are observed in the boards of directors
of FF firms (Anderson and Reeb, 2003; Weber et al., 2003).
9
FF firms also face reputation concerns arising from the family’s sustained
presence in the firm and its effect on third parties. The long-term nature of FF
ownership suggest that external bodies, such as suppliers or providers of capital,
are more likely to deal with the same governing bodies and practices for longer
periods in family firms than in non-family firms. Thus the family’s reputation is
more likely to create longer-lasting economic consequences for the firm relative
to non-family firms where managers and directors turn over on a relatively
continuous basis. Anderson et al. (2003a) suggest that one consequence of
families maintaining a long-term presence is that the firm will enjoy a lower cost
of debt financing compared to non-family firms.
In addition, long-term orientation and reputation protection discourages
family firms from opportunistically managing earnings, because earnings
management activities are more likely to be short-term oriented and perhaps
even detrimental to long-term firm performance.
2.3 HYPOTHESES
In this section, this study discusses how the alignment effect between
controlling shareholders (including FF and FAM members) and minority
shareholders creating an effect on accounting conservatism. Fan and Wong
(2002) note that, when controlling shareholders effectively control a firm, they
control the production of firm’s accounting information and reporting policies.
Therefore, managers in controlling shareholder firms tend to be primary sources
of information about the quality of financial statements, specifically of earnings,
and the voluntary disclosure of bad news through management earnings
forecasts. The alignment effect motivates controlling shareholder to report
10
higher-quality earnings, it may reduce the demand for high-quality financial
information by contracting parties if they believe that controlling shareholder
ownership enhances corporate governance. Minority shareholders may rely less
on the quality of financial statements to monitor controlling shareholder because
minority shareholders are better aligned with those of the controlling
shareholders. Wang (2006) indicates that founding family ownership enhances
the communication between insiders and users of financial statements through
higher-quality accounting earnings. The higher earnings quality of family firms
may result from better alignment of interests between founding family and
minority shareholders. Therefore, controlling shareholders are more likely to
forgo short-term benefits from managing earnings because of the incentives to
pass on their business to future generation and to protect the family’s reputation.
Accordingly, the alignment effect implies that controlling shareholders are less
likely to engage in opportunistic behavior in reporting accounting earnings
because it potentially could damage the family’s reputation, wealth, and long-
term firm performance. Thus, controlling shareholders are motivated to report
high earnings quality.
For CS firms, the alignment effect is likely to be more severe when the
interests of controlling shareholders and of minority shareholders are aligned.
Controlling shareholders are more likely to forgo short-term benefits from
managing earnings and provide managers with greater opportunity to use more
conservative accounting. Thus, this study predicts that increasing in controlling
shareholder member ownership are positively associated with accounting
conservatism, ceteris paribus.

11
The first hypothesis and sub-hypotheses, stated in alternate form, are as
follows::
H1: There is a positive relationship between accounting conservatism and
controlling shareholder ownership.
H1a: There is a positive relationship between accounting conservatism and
FF ownership.
H1b: There is a positive relationship between accounting conservatism and
FAM ownership.
2.4 CEO CHARACTERISTICS
To see this, consider that one of the primary effects of high family
ownership is the CEO of the firm is likely to be the founder of the firm, or a
member of the family (such as a relative or a descendant). Family CEOs can
enhance firms’ wealth because they posses special expertise (Morck et al., 1998)
and intentions of long-term presence (Anderson and Reeb, 2003). Wang (2006)
finds that the magnitudes of the coefficients on family CEOs (founder and
descendant) are positive and associated with higher earnings quality. The
alignment effect is likely to be more severe for family firms where the CEO is
the founder. The second hypothesis and sub-hypotheses where the CEO is the
founder, stated in alternate form, are as follows:
H2: There is a positive relationship between accounting conservatism and
controlling shareholder firms where the CEO is the founder.
H2a: There is a positive relationship between accounting conservatism and
FF firms where the CEO is the founder.
H2b: There is a positive relationship between accounting conservatism and
FAM firms where the CEO is the founder.

12
The third hypothesis and sub-hypotheses where the CEO is a descendent or a
relative, stated in alternate form, are as follows:
H3: There is a positive relationship between accounting conservatism and
controlling shareholder firms where the CEO is a descendant or a
relative.
H3a: There is a positive relationship between accounting conservatism and
FF firms where the CEO is a descendant or a relative.
H3b: There is a positive relationship between accounting conservatism and
FAM firms where the CEO is a descendant or a relative.
CEOs hired from outside possesses special expertise (Morck et al. 1998).
The contract of an agency relationship between a principal and an agent is
considered. The utility maximizing agent has the incentive to appropriate a
larger amount of the corporation’s resources in the form of perquisites and to
exert less than full effort to create value for shareholders. However, good
performance could be achieved by less conservative accounting. The study’s
hypothesis is stated in alternate form as follows:
The fourth hypothesis and sub-hypotheses when their CEO is hired from
outside, stated in alternate form, are as follows:
H4: There is a negative relationship between accounting conservatism and
controlling shareholder firms when their CEO is hired from outside.
H4a: There is a negative relationship between accounting conservatism and
FF firms when their CEO is hired from outside.
H4b: There is a negative relationship between accounting conservatism and
FAM firms when their CEO is hired from outside.

13
3. Empirical Proxies, Data and Descriptive Statistics
3.1 DEFINITION OF CONTROLLING SHAREHOLDER
According to the Stock Exchange of Thailand, a shareholder is a
controlling shareholder or ultimate owner of a firm if he/she owns directly or
indirectly more than 25 percent of the firm’s shares. Under the Public Limited
Companies Act, at this level of shareholdings, a shareholder has sufficient
voting power to have significant influence on the firm in 4 manners: (i) a
controlling shareholder can nullify any corporate decisions, (ii) a controlling
shareholder can demand to inspect the business operation and the financial
condition of the company, as well as the conduct of the board, (iii) a controlling
shareholder can call an extraordinary general meeting any time, (iv) a
controlling shareholder can submit a notion to the court demanding for the
dissolution of a company if he/she thinks that further company operation will
bring only losses, and that the company has no chance of recovery.
3.2 MEASURE OF MANAGERIAL OWNERSHIP
This study defines controlling shareholder characteristics as follows:
a) Founding family (hereafter “FF”) firms are established by the
founder (who takes responsibility for the firm’s early growth and
development). At least 25% of the firm’s equity is owned by the
founder or by founding family members by blood or marriage.
b) Family (hereafter “FAM”) firms are firms owned by a family who
does not take responsibility for the firm’s early growth and
development. Firms in this category refer to non-founding family
firms that have at least 25% of the firm’s equity is owned by
members of the new family by blood or marriage.

14
Following Anderson and Reeb (2003), this study defines FF firms as firms
where a single shareholder or member of his or her family by either blood or
marriage is a director, either individually or as a group. Thus, FF ownership is
defined and tested in two ways. First, OWN(rank) is used to measure FF
ownership based on the percentage of common stock owned by family members
at the beginning of the fiscal year, with a larger value indicating greater family
interest in the firm5. Every year, firms are partitioned into 10 equal groups based
on the percentage of ownership held by FF members. The scaled decile rank is
determined by first ranking observations each year into 10 groups from zero to
nine, and then scaling the ranking by nine so that the rank variable falls within
the zero-to-one interval. High rank means high ownership. The decile rank of
OWN(rank) is used instead of ownership itself, to allow for potential non-
linearity in the relationship between ownership and asymmetric timeliness. In
addition, this study divides percentage of ownership into more than 25%-50%
and more than 50%. FAM firms are also used the same measure as that of FF
firms.
As a supplement to the above variables that measure family ownership, FF
firms are classified further into three groups with different CEO attributes:
founder CEO (CEO_F), which equals one if the FF firm has the founder as CEO
and zero otherwise, descendant CEO (CEO_D), which equals one if the FF firm
is headed by a family descendant and zero otherwise, or hired CEO (CEO_H),
which equals one if the CEO is hired from outside the family and zero
5 La Porta et al., (1999) define ownership based on voting rights rather than cash flow rights. They would like to know whether corporations have shareholders with substantial voting rights, either directly or through a chain of holdings. Fan and Wong (2002) argue that controlling owners obtain the power (through high voting rights) and the incentive (through high cash flow rights) to negotiate and enforce corporate contracts with various stakeholders, including minority shareholders, managers, laborers, material suppliers, customers, debtholders, and governments.

15
otherwise. Family CEOs (founders and descendants) might be drawn from a
suboptimal labor pool that prevents more talented professional executives from
running the firms (Anderson and Reeb, 2003). Thus, family firms with family
members as CEOs might perform poorly. Conversely, family CEOs can enhance
firms’ wealth because they possess special expertise (Morck et al., 1988) and
intentions of long-term presence (Anderson et al., 2003). The same measures for
CEO characteristics are also used for FAM firms.
For some younger firms, this approach is straightforward, since the proxy
statement denotes the founder, his/her immediate family members, and their
holdings. However, several generations after the founder, the family expands to
include distant relatives such as second or third cousins whose last names may
no longer be the same. This study resolves descendant issues by examining
corporate histories for each firm in the sample. Histories are from annual
reports, the companies’ websites, and from individual companies.
3.3 MEASURE OF CONSERVATISM
Basu (1997) improves his model significantly by adding another property of
accounting income: conservatism. He interprets conservatism as the
accountant’s tendency to require a higher degree of verification for recognizing
good news than bad news in financial statements. Earnings, as a result, reflect
bad news more quickly (times) than good news, and this is called conservative
asymmetry in accounting income timeliness. His model can be written as:
EPS = β0 + β1 RD + β2 R + β3 R*RD + εit (1)

16
where EPS is the earnings per share of firm i in fiscal year t divided the price
per share at the beginning of the fiscal year, R is the return of firm i over the 12
months beginning ten months prior to the end of fiscal year t, and RD is a
dummy variable set equal to 1 if R is negative and 0 otherwise.
This study extends the Basu (1997) model to examine the link between
accounting conservatism and controlling shareholders (included FF and FAM
firms) by incorporating ownership proxies (OWN) into the model. This variable
is then interacted with the variable in the standard Basu (1997) model as shown
in equation (2):
EPS = β0 + β1 RD + β2 R + β3 R*RD + β4 OWN + β5 R*OWN
+ β6 RD*OWN + β7 R*RD*OWN +Control Variables + εit (2)
OWN(rank) is equal to the scaled decile rank of percentage of shares held by
FF or FAM firms members6. In addition, this study divides percentage of
ownership into more than 25%-50% and more than 50%. FAM firms are also
used the same measure as that of FF firms. OWN>25-50% is a dummy variable
equal to one if common stock owned by FF or FAM firms members is more than
25%-50% of outstanding shares at the beginning of the year, zero is otherwise.
OWN>50% is dummy variable equal to one if common stock owned by FF or
FAM firms members is more than 50% of outstanding shares at the beginning of
the year, zero is otherwise. All of the control variables (see detail in section 3.4)
in the regression are also interacted with RD and R.
6 Every year, firms are partitioned into 10 equal groups based on the percentage of ownership held by FF or FAM members. The scale deciled rank is determined by first ranking observations each year into 10 groups from zero to nine, and then scaling the ranking by nine so that the rank variable falls within the zero-to-one interval. High rank means high ownership.

17
CEO characteristics also add and extend the Basu (1997) model to examine
the link between accounting conservatism and CEO characteristics in controlling
shareholder (included FF and FAM firms) by incorporating CEO proxies into
the model. This variable is then interacted with the variable in the standard Basu
(1997) model as shown in equation (3):
EPS = β0 + β1 RD + β2 R + β3 R*RD + β4 F_CEO + β5 R*F_CEO
+ β6 RD*F_CEO + β7 R*RD*F_CEO + Β8 D_CEO
+ β9 R*D_CEO + β10 RD*D_CEO + β11 R*RD*D_CEO
+ β12 H_CEO + β13 R* H_CEO + β14 RD*H_CEO
+ β15 R*RD*H_CEO + Control Variables + εit (3)
CEO_F is a dummy variable equal to one if the CEO is the founder of the
FF or FAM firm, zero is otherwise. CEO_D is a dummy variable equal to one if
the CEO is a descendant of the FF or FAM firm, zero is otherwise. CEO_H is a
dummy variable equal to one if the CEO is a hired outsider for the FF or FAM
firms, zero is otherwise. All of the control variables (see detail in section 3.4) in
the regression are also interacted with RD and R.
3.4 CONTROL VARIABLES
The main control variables are divided into corporate governance and firm
characteristics control variables. Corporate governance includes DUAL,
BRDSIZE, IND and BIG4 and firm characteristics includes LEV, PINST, SIZE,
RISK and MTB. DUAL is dummy variable equal to one if the CEO is chairman
of the boards, zero otherwise. BRDSIZE is number of directors on the board at
the year-end. IND is number of independent audit committee divided by total
board size. BIG4 is a dummy variable coded 1 if the firm’s auditor is a big-four

18
firm, zero otherwise. LEV is equal to scaled deciles rank of total debts divided
by total assets at the beginning of the fiscal year. PINST is institutional share
ownership as a percentage of the total number of outstanding shares at the
beginning of the fiscal year. SIZE is equal to the scaled deciles rank of market
value of equity divided by total assets at the beginning of the fiscal year. RISK is
a dummy variable coded 1 if the firm is a technology industry and zero
otherwise. MTB is equal to the scaled deciles rank of the market-to-book ratio at
the beginning of the fiscal year.
3.5 DATA
Sample is entirely based on Thai listed company data. This study obtains
data on beginning-of-year equity ownership, member of the board of directors
and corporate governance from the company annual report (FORM 56-1) which
is annually submitted to Stock Exchange of Thailand (“SET”). This study
requires firms to have sufficient returns and accounting data on Datastream
database, from Thompson Financial, to conduct empirical analyzes.
Table 1, Panel A presents a summary of how the final sample was obtained.
Of the 2,944 firm-years over the fiscal years 2000-2006 that are in the sample,
this study eliminates 430 firm-years in the financial services and insurance
sectors and 295 firm-years in the rehabilitation companies sector. This is
because their financial reporting requirement and their characteristics of
business operation are different from other firms. Additionally, 486 firm-years
are eliminated because their data are not available or incomplete data in the
Datastream database or the company’s annual report, leaving a final sample of
1,733 firm-years (for 331 distinct firms as described in Table 1, Panel B). This

19
study winsorizes the top and bottom 1% of the earnings per share before
extraordinary items and returns to mitigate the effects of extreme observations.7
Table 1, Panel B presents the industry breakdown of the sample firms.
Industries are defined in accordance with the Stock Exchange of Thailand
definitions, and consist of agriculture and food, consumer products, industrials,
property and construction, resource, services, and technology. Each industry
contains enough observations to allow for median, differencing by industry to
control for industry effects in the regressions.
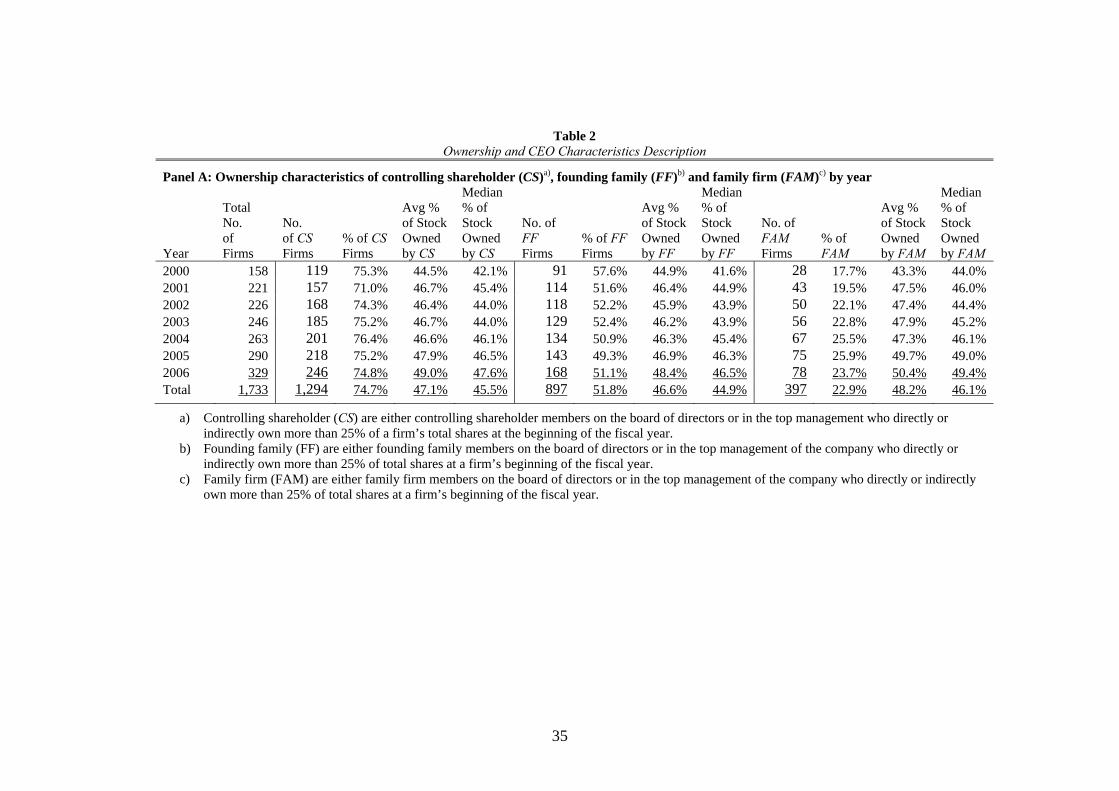
Table 2, Panel A presents a description of controlling shareholder, FF, and
FAM member ownership over the fiscal years 2000-2006. Controlling
shareholder firms are divided into FF and FAM firms. Among the final sample
of 1,733 firm-year observations, 1,294 (74.7%) are controlling shareholder firm-
year observations, 897 (51.8%) are FF firm-year observations, 397 (22.9%) are
FAM firm-year observations. These results imply that most listed companies in
Stock Exchange of Thailand (SET) are concentrated in the hands of large
shareholders, for whom the minimum ownership level is defined at 25%8. On
average, controlling shareholder members, FF, and FAM members own 47.1%,
46.6% and 48.2%, respectively. The average (median) controlling shareholder
ownership measured by percentage of common equity is 44.5% (42.1%) in year
the 2000, but this slightly increases to 49.0% (47.6%) in year the 2006. The
average (median) FF ownership measured by percentage of common equity is
44.9% (41.6%) in the year 2000, but this slightly increases to 48.4% (46.5%) in
7 Results do not significantly change when the regressions are run on the unwinsorized data. Additionally, winsorization at the 2% and 5% level do not significantly affect the results. 8 According to the Stock Exchange of Thailand, a shareholder is a controlling shareholder or ultimate owner of a firm if he/she owns directly or indirectly more than 25 percent of the firm’s shares

20
the year 2006. The average (median) FAM ownership measured by percentage
of common equity is 43.3% (44.0%) in the year 2000, but this slightly increased
to 50.4% (49.4%) in the year 2006. The average percentage of stock owned by
families in either FF or FAM firms is still relatively high after the financial
crisis in 1997.
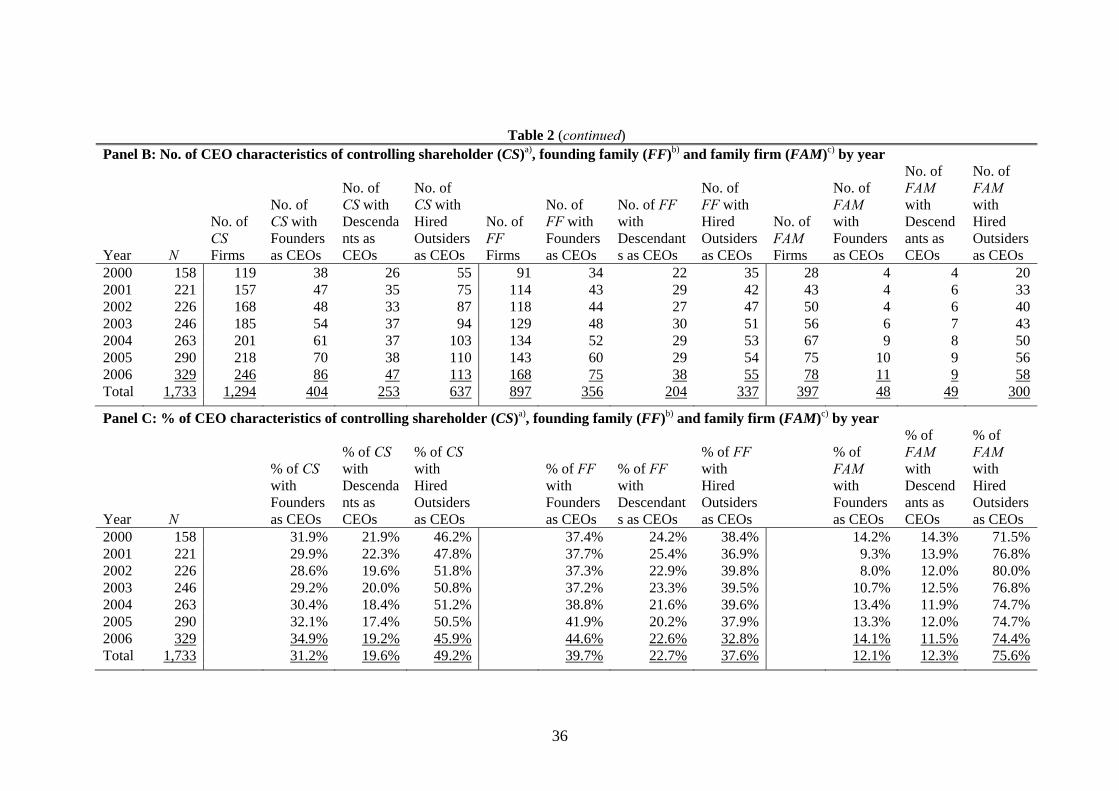
Table 2, Panel B presents number of CEO characteristic of controlling
shareholder, FF and FAM firms while table 2, Panel C presents percentage of
CEO characteristics of controlling shareholder, FF, and FAM firms. In Table 2,
Panel C, of the controlling shareholder firms, 31.9% are run by founder CEOs in
the year 2000 and 34.9% are run by founder CEOs in the year 2006. The
corresponding percentage of controlling shareholder firms run by descendents is
21.9% in the year 2000, but this slightly decreases to 19.2% in the year 2006. In
comparison, the percentage of controlling shareholder firms run by hired
outsiders as CEOs is 46.2% in the year 2000, and this also slightly decreases to
45.9% in the year 2006. The average percentage of the controlling shareholder
firms, 31.2%, 19.6% and 49.2% are run by founder, descendents and hired
outsiders as CEOs, respectively.
When the sample of CS is divided into FF and FAM, Table 2, Panel C of the
FF firms shows that 37.4% are run by founder CEOs in the year 2000 and this
increases to 44.6% in the year 2006. The corresponding percentage of FF firms
run by descendents is 24.2% in the year 2000, but this slightly decreased to
22.6% in the year 2006. In comparison, the percentage of FF firms run by hired
outsiders as CEOs is 38.4% in the year 2000, and this decreases to 32.8% in the
year 2006. The average percentage of the FF firms, 39.7%, 22.7% and 37.6%
are run by founder, descendents and hired outsiders as CEOs, respectively.

21
Of the FAM firms, 14.2% are run by founder CEOs in the year 2000 and this
slightly decreased to 14.1% in the year 2006. The corresponding percentage of
FAM firms run by descendents is 14.3% in the year 2000, but this slightly
decreased to 11.5% in the year 2006. In comparison, the percentage of FAM run
by hired outsiders as CEOs is 71.5% in year 2000 and this increases to 74.4% in
the year 2006. The average percentage of the FAM firms, 12.1%, 12.3% and
75.6% are run by founder, descendents and hired outsiders as CEOs,
respectively.
The percentage of FF firms run by founders and their descendants is higher
than the percentage of firms run by outsider CEOs. In a competitive market, this
phenomenon might be explained by the fact that founders and descendants as
CEOs possess special expertise and better knowledge of the firm’s business
activities. On the other hand, the percentage of FAM firms run by founders and
their descendants is less than the percentage run by outsider CEOs. This implies
that, founders and descendents as CEOs in FAM firms who take over firms from
other families, might have no expertise or knowledge of the firm’s business
activities. Therefore, FAM firms usually seek to engage outside CEOs, who
have more expertise, to run in their business.
Table 3, presents 2 panels of descriptive information for the sample of firms.
Panel A provides the descriptive statistics on the dependent and independent
variables used in the conservatism analyzes. Panel B shows the results of
difference of means test between CS and non-CS, FF and non-CS, FAM and
non-CS. Panel A reports the descriptive statistics on EPS (earnings per share
before extraordinary items deflected by price at the beginning of the fiscal year),
R (stock return for firm i from 10 months before the financial year-end to 2

22
months after the financial year-end), RD (an indicator variable equal to one if R
is negative, zero otherwise), OWN (the percentage of share held by the largest
shareholder members at the beginning of the fiscal year), DUAL (dummy
variable equal to one if the CEO is chairman of the boards, zero otherwise).
BRDSIZE (number of directors on the board at the year-end), IND (number of
independent audit committee divided by total board size), BIG4 (dummy
variable coded 1 if the firm’s auditor is a big-four firm, zero otherwise), LEV
(total debts divided by total assets at the beginning of the fiscal year), PINST
(institutional share ownership as a percentage of the total number of outstanding
shares at the beginning of the fiscal year), SIZE (market value of equity divided
by total assets at the beginning of the fiscal year), RISK (dummy variable coded
1 if the firm is an a technology industry, zero otherwise), and MTB (market-to-
book ratio at the beginning of the fiscal year).
The mean (median) EPS value is -0.309 (0.085). Note that the EPS
distribution is left skewed, consistent with accounting conservatism. The
average return (R) is 30.6%. The descriptive statistics on the negative return
indication variable, RD, indicate that approximately 41.0% of the sample
exhibits a negative return over the period. Mean ownership (OWN) at the
beginning of the fiscal year is 39.36%9. It exhibits considerable skewness in that
the median ownership is 37.07%. The 90th percentile value, 66.11%, indicates
that, in a portion of the sample, OWN have relatively larger ownership stakes.
About 26.9% of the sample are firms where the CEO is also chairman of the
board (DUAL). The average size of board of directors (BRDSIZE) is 11.31. The
9 Wang (2006) reports that for the period, 1994-2002 S&P 500 indices, family firms had on average 10.35% of common stock. This implies that listed companies in Stock Exchange of Thailand have ownership concentrated in hands of large shareholder members.
23
average number of independent directors (IND) is about 27.3% of the reported
board of directors. About 60.9% of the firm’s auditors have a big-four firm as
auditors (BIG4). The average firm finances about 35.2% of its reported assets
with debts (LEV). The average institutional share ownership as a percentage of
the total number of outstanding share at the beginning of the fiscal year (PINST)
is 2.38%. The market value of equity divided by total assets at the beginning of
the fiscal year (SIZE) is 1.01 times. About 13.9% of the sample belongs to high-
litigation-risk industries (RISK). The market-to-book ratio at the beginning of
the fiscal year (MTB) is 2.83 times.
Table 3, panel B presents difference of means test for variables between CS
and non-CS, FF and non-CS and FAM and non-CS. This study finds the
difference in the univariate analysis between CS and non-CS, FF and non-CS
and FAM and non-CS with the exception of ROA and ROE, which indicates that
CS, FF and FAM are significantly better performance.
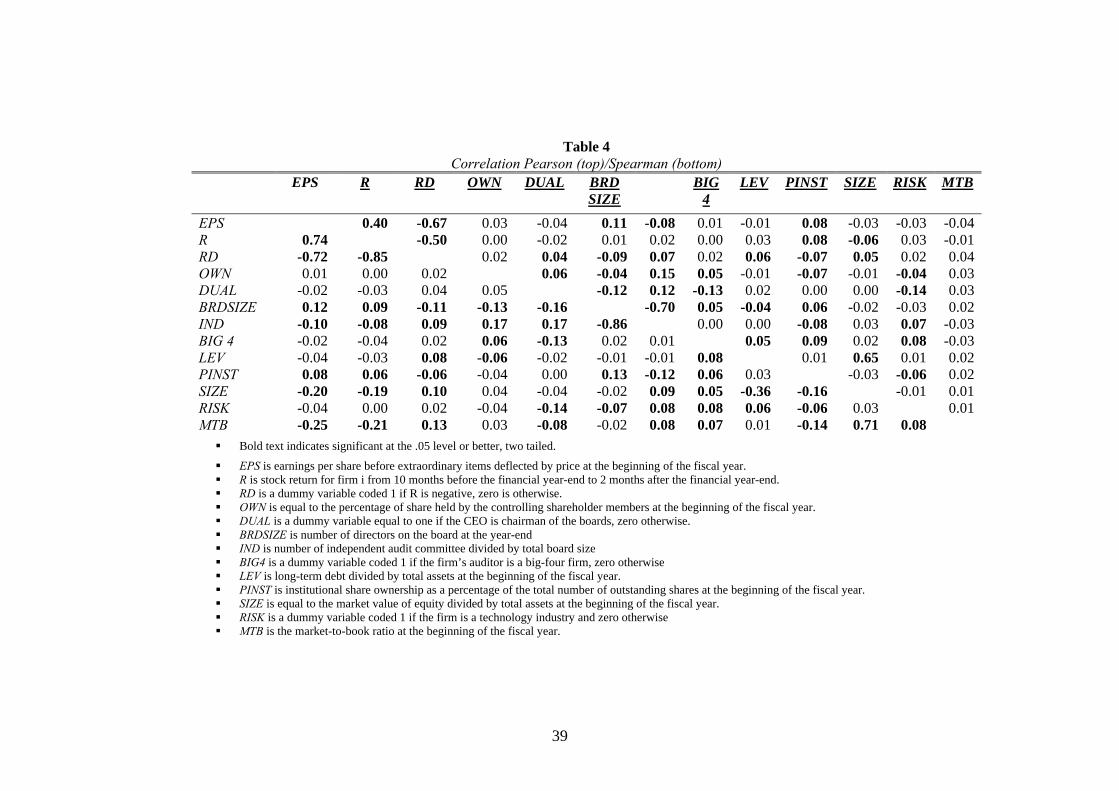
Table 4 reports the correlation matrix for the variables. The upper right-hand
portion of the tables presents Pearson product moment correlation, while the
lower left hand portion presents the Spearman rank-order correlation. To
facilitate discussion, this study focuses on the Pearson correlations; the
Spearman rank-order correlations are generally consistent with the Pearson
correlation. OWN exhibits a significantly positive (Pearson) correlation with
DUAL, IND and BIG4 and negative correlation with BRDSIZE, PINST and
RISK. EPS is positively correlated with R (0.40) and negative correlated with
RD (-0.67), indicating that reported earnings reflect at least a portion of the

24
information reflected in returns. In addition, BRDSIZE exhibits a significantly
negative (Pearson) correlation with IND (-.70). However, a variance inflation
factor (hereafter, VIF) without interaction terms is tested to detect
multicollinearity (results not reported). As a rule of thumb, a VIF greater than
ten suggests that the regressor variables are highly correlated (Myers, 1990;
Montgomery et al., 2001). This study finds that the VIFs of the regressor
variable in each model do not exceed the cut-off point (ten), suggesting that
multicollinearity among the regressor variables is not strong in this data set.
4. Results
4.1 RESULTS WITH OWNERSHIP CHARACTERISTICS
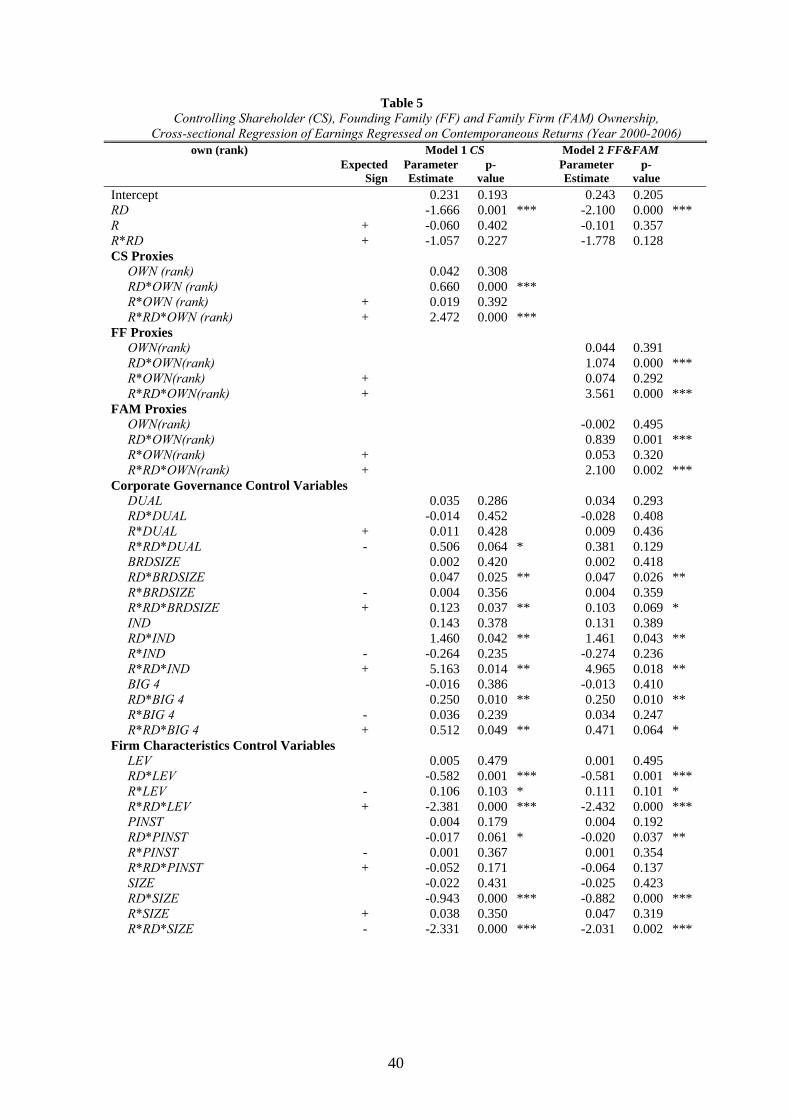
Table 5 reports the mean coefficient across 7 annual cross-sectional
regressions over the period 2000-2006. This study measures of controlling
shareholder (CS), founding family (FF) and family firm (FAM) members
ownership by using percentage of ownership members and scaled deciles rank
of percentage of shares held by controlling shareholder (CS), founding family
(FF), and family firms (FAM) members. Every year, firms are partitioned into
10 equal group bases on percentage of ownership members. For every year,
firms are partitioned into 10 equal groups based on the percentage of ownership
by CS, FF and FAM members. The scaled decile rank is determined by first
ranking observations each year into 10 groups from zero to nine, and then
scaling the ranking by nine so that the rank variable falls within the zero-to-one
interval. High rank means high ownership.

25
Concentrating on Model 1 (CS), the coefficient of R*OWNt-1(rank) is not
significant, while the coefficient of R*RD*OWNt-1(rank) is significantly
positive. These results suggest that, as CS member ownership increases,
earnings reports become more asymmetrically timely in recognizing bad news
but earnings report are not timely in recognizing good news. In model 2
(combined FF and FAM), the coefficient of R*OWN(rank) is not significant,
while the coefficient of R*RD*OWN(rank) is also significantly positive. These
results suggest that as FF and FAM member ownership increase, earnings
reports become more asymmetrically timely in recognizing bad news but
earnings report are not timely in recognizing good news..
Turning to the corporate governance control variables in Models 1 and 2, for
the board size (BRDSIZE), independent directors (IND) and big-four firms
(BIG4) variables, the coefficients of R*BRDSIZE, R*IND and R*BIG4,
respectively, are not significant. The significantly positive coefficient of
R*RD*BRDSIZE indicates that firms with high board size are more
asymmetrically timely in recognizing bad news. The significantly positive
coefficient of R*RD*IND indicates that firms with more independent directors
are more asymmetrically timely in recognizing bad news. The significantly
positive coefficient of R*RD*BIG4 indicates that firms are audited by big-four
firms are more asymmetrically timely in recognizing bad news. It implies that
high board size, more independent directors and big4 firms lead a firm to exhibit
conservatism, which is consistent with other studies.
The firm characteristics control variables in Models 1 and 2, the significant
negative coefficients of R*RD*LEV indicates that firms with greater leverage
(LEV) are less asymmetrically timely in recognizing bad news. These findings

26
are inconsistent with previous research. It can be explained that the operations of
the listed companies in SET experienced and influenced by the economic
conditions in Thailand and the Asia Pacific Region during the year 1997-2002.
Most of the listed companies in SET had been experiencing significant cash
flow problems which, coupled with the devaluation of Thailand’s currency, had
resulted in a substantial increase in the amount of the company’s foreign debt as
stated in Baht, and a substantial decrease in shareholders’ equity. Events of
default have occurred on all debts, which enable lenders to declare their debts
due and payable, and to demand immediate payment due to the listed companies
were unable to maintain certain ratios as described in loan agreement (e.g.
current ratio, debt to equity ratio, etc.). However, none of the lenders has yet
exercised rights to accelerate repayment at that time. After the financial crisis,
firms with greater debts (high leverage) might have more incentive and
capability to avoid defaults the schedule of debt and interest repayment by using
less conservative.
The coefficients of R*RD*SIZE is significantly negative in Models 1 and 2,
which is consistent with the existing literature. This study fails to find evidence
that firms in high-litigation-risk industries and with high market-to-book ratios
exhibit greater conservatism.
In summary, the results in Tables 5 show that CS, FF and FAM firms are
associated with more conservative earnings reports. CS, FF and FAM member
owner are more likely to forgo short-term benefits from being less conservative
in reporting earnings because of the incentive to pass on their business to future
generations and to protect the family’s reputation. Accordingly, it implies that,
CS, FF and FAM members owner are less likely to be less conservative in
27
reporting earnings because it potentially could damage the family’s reputation,
wealth, and long-term firm performance.
4.2 RESULTS WITH OWNERSHIP LEVEL
This study has used measures of the type of ownership as percentage of
ownership members (scaled decile rank of percentage of shares held by CS, FF
and FAM members) as described in Table 5. Table 6 reports a similar analysis as
in the Table 5 but Table 6 classifies ownership into 2 levels, ownership more
than 20%-50%, and more than 50%. Table 6 reports the cross-sectional
regression of earnings regressed on contemporaneous returns in the years 2000-
2006 for CS, FF, and FAM member ownership level. Model 1 (CS), the
coefficients of R*RD*OWN20-50% and R*RD*OWN>50% are significantly
positive. Model 2 (combined FF and FAM), the coefficients of R*RD*OWN20-
50% and R*RD*OWN>50% in both FF and FAM firms are also significantly
positive. The results suggest that, for CS, FF and FAM members who own
shares more than 20%-50% and more than 50% of the outstanding shares of a
firm, earnings reports become more asymmetrically timely recognizing bad
news.
In summary, the results in Table 6 show that high level of ownership of
firms by CS, FF and FAM members are strongly associated with more
conservative earnings reports. CS, FF and FAM member owner are more likely
to forgo short-term benefits from being less conservative in reporting earnings
because of the incentive to pass on their business to future generations and to
protect the family’s reputation which is consistent with Table 5.

28
4.3 RESULTS WITH CEO CHARACTERISTICS
Table 7 reports the cross-sectional regression of earnings regressed on
contemporaneous returns in the years 2000-2006 for CEO characteristics in CS,
FF, and FAM firms. Model 1 (CS), the coefficients of R*F_CEO, R*D_CEO
and R*H_CEO are not significant while the coefficients of R*RD*F_CEO, R*
RD*D_CEO and R* RD*H_CEO are all significantly positive. Model 2
(combined FF and FAM), the coefficients of R*F_CEO, R*D_CEO and
R*H_CEO are also not significant while only the coefficients of R*RD*F_CEO,
and R* RD*H_CEO are significantly positive. Model 2 find no relation between
descendants CEO and asymmetric timeliness. These results suggest that when
the CEOs of FF and FAM firms are founders and hired outsiders and the CEOs
of FF firms are descendent, earnings reports become more asymmetrically
timely in recognizing bad news.
In summary, the results in Table 7 show that FF CEOs (founders,
descendants and hired outsiders) and FAM CEOs (only founders and hired
oustiders) are associated with more conservative earnings reports because they
can enhance firms’ wealth, possess special expertise (Morck et al., 1998) and
have intentions of long-term presence (Anderson and Reeb, 2003). Hired
outsiders as CEOs in FF firms are also associated with more conservative
earnings reports because hired outsider CEOs closely work with the Chairman
(usually the founder or a descendant) and the board of directors who would like
to ensure strategies and policy decisions are followed to achieve goals. Outside
CEOs are often required to justify their actions to shareholder and to the board
of directors, consequently, FF firms initiate numerous formal reporting
procedures to keep a close eye on outside CEOs. Therefore, FF and FAM firms,
29
being more effective monitors can reward their outside CEO based on
information about outside CEOs efforts obtained through direct monitoring.
4.3 ROBUSTNESS TEST
The objective of this section is to check the robustness of the research results
using ownership measure based on the percentage of common stock instead of
scaled decile rank of percentage of shares held by CS, FF and FAM members.
OWN is used to measure CS, FF and FAM ownership based on the percentage of
common stock owned by CS, FF and FAM members, with a larger value
indicating greater family interests in the firm. Table 8 reports the cross-
sectional regression of earnings regressed on contemporaneous returns in the
years 2000-2006. This table reports similar analysis as in the table 5.
Model 1 (CS), the coefficient of R*OWN(rank) is not significant, while the
coefficient of R*RD*OWN(rank) is significantly positive. In model 2 (combined
FF and FAM), the coefficient of R*OWN(rank) is not significant, while the
coefficient of R*RD*OWN(rank) is also significantly positive. These results
suggest that as CS, FF and FAM ownership increase, earnings reports become
more asymmetrically timely in recognizing bad news but earnings report are not
timely in recognizing good news..
5. Conclusion
This study investigates the association between controlling shareholder
characteristics (including FF and FAM firms) and accounting conservatism,
finding that greater ownership by CS, FF and FAM members lead to more
conservative reporting of earnings. The result suggests that CS, FF and FAM
members are more like to forgo short-term benefits from being less conservative

30
in reporting earnings because of the incentive to pass on their business to future
generations and to protect the family’s reputation.
This study also investigates CEO attributes in FF and FAM firms and
conservatism, finding that founder CEOs, descendent CEOs and outsiders as
CEOs in FF firms report more conservative earnings. The results suggest that
founder CEOs in FF and FAM firms and only descendent CEOs in FF firms
posses special expertise and have the intention of long-term presence. Hired
outsiders as CEOs in FF and FAM firms closely work with the Chairman
(usually the founder or a descendant) and the board of directors who would like
to ensure strategies and policy decisions are followed to achieve goals.

31
REFERENCES
Anderson, R., and D.M. Reeb. 2003. Founding-family ownership and firm
performance: Evidence from the S&P 500. The Journal of Finance, 58, 1301-1328.
Anderson, R., S.A. Mansi and D.M. Reeb. 2003a. Founding family ownership and the
agency cost debt. Journal of Financial Economics, 68, 263-285.
Anderson R., and D.M. Reeb, 2004. Board composition: Balancing family influence in
S&P 500 firms. Administrative Science Quarterly, 49, 209-237.
Basu, S. 1997. The conservatism principle and the asymmetric timeliness of earnings.
Journal of Accounting & Economics, 24, 3-37.
Basu, S., L. Hwang and C. Jan. 2001. Auditor conservatism and quarterly earnings.
Working Paper, City University of New York.
Claessens, S., and J.P. Fan. 2002. Corporate Governance in Asia: A survey. Working
paper.
De Angelo, H. and L. DeAngelo. 2000. Controlling stockholders and the disciplinary
role of corporate payout policy: A study of the Times Mirror Company. Journal of
Financial Economics, 56, 153-207.
Demsetz, H. 1983. The structure of ownership and the theory of the firm. Journal of
Law and Economics, 26, 375-390.
Demsetz, H. and K. Lehn. 1985. The structure of corporate ownership: causes and
consequences. Journal of Political Economy, 93, 1155-1177.
Demsetz, H., and B. Villalonga, 2001. Ownership structure and corporate performance.
Journal of Corporate Finance, 7, 209-233.
Givoly, D., C. Hayn and A. Natarajan. 2007. Measuring Reporting Conservatism. The
Accounting Review, 82, 65-106.
Fama, E., and M. Jensen. 1983. Separation of ownership and control. Journal of Law
and Economics, 26, 301-325.

32
Fan, J., and T. Wong. 2002. Corporate ownership structure and the informative of
accounting earnings in East Asia. Journal of Accounting and Economics, 33, 401-
425.
Jensen, M.C., and W. H. Meckling. 1976. Theory of the firm: managerial behavior,
agency costs and ownership structure. Journal of Financial Economics 3, 305-360.
Lafond, R., and S Roychowdhury. 2008. Managerial ownership and accounting
conservatism. Journal of Accounting Research, 46, 101-135.
Maury, B. 2006. Family ownership and firm performance: Empirical evidence from
Western European corporations. Journal of Corporate Finance, 12, 321-341.
Maury, B., and A. Pajuste. 2005. Multiple large shareholders and firm value. Journal of
Banking and Finance, 29, 1813-1834.
McConnell, J., and H. Servaes. 1990. Additional Evidence on Equity Ownership and
Corporate Value. Journal of Financial Economics, 595-612.
Mishra, C., T. Randoy, and J. I. Jenssen. 2001. The effect of founding family influence
on firm value and corporate governance. Journal of International financial
Management and Accounting, 235-259.
Morck, R., A. Shleifer, and R. Vishny 1988. Management of ownership and market
valuation: An empirical analysis. Journal of Financial Economics, 20, 293-315.
Roychowdhury, S. and R.L. Watts, 2007, Asymmetric timeliness of earnings, market-
to-book and conservatism in financial reporting, Journal of Accounting and
Economics, 44, 2-31.
Schack, J. 2001. All in the family. Institutional Investor, 35, 94-95.
Shleifer, A., and R. Vishny. 1997. A survey of Corporate Governance. Journal of
Finance, 52; 737-783.
Sterling, R.R. 1970. The theory of the measurement of enterprise income. Lawrence,
KS: University of Kansas Press.
Villalonga, B., and R. Amit. 2004. How do family ownership, control and management
affect firm value? Journal of Financial Economics, 80, 385-417.
33
Walker, G., and T. Reid. 2002. Upgrading Corporate Governance in East Asia. Journal
of International Banking Law, 17, 59-66.
Wang, D. 2006. Founding family ownership and earnings quality. Journal of
Accounting Research, 44, 619-656.
Watts, R. 2003a. Conservatism in accounting part I: Explanations and implications.
Accounting Horizon, 17, 207-221.
Watts, R. 2003b. Conservatism in accounting part II: Evidence and research
opportunities, 17, 287-301.
Watts, R. L., and J. L. Zimmerman. 1986. Positive Accounting Theory. New Jersey,
Prentice Hall.
Watts, R.L., and J. L. Zimmerman. 1978. Toward a positive theory of the determination
of accounting standards. The Accounting Review, 53, 112-134.
Weber, J., L. Lavelle, T. Lowry, W. Zellner, and A. Barrent. 2003. Family, Inc.
Business week (November 10, 2003), 100-114.

34
Table 1 Sample Description
Panel A: Sample Selection of Stock Exchange of Thailand firms from 2000-2006 N %
Number of firm years in the Stock Exchange of Thailand 2000-2006 2,944
Financial Services and Insurance Firms (430) 2,514 100.0 Rehabilitation companies (295) (11.7) Data are not available (including incomplete data) (486) (19.4) Final Sample 1,733 68.9
Panel B: Final Sample by Industry
Industry Sub-industry Firm-Years
Distinct firms
Agro & Food Industry Agribusiness 112 18
Food and beverage 142 22
Consumer Products Fashion 154 23
Home & Office Products 64 11 Personal Products & Pharmaceuticals 22 4 Industrials Automotive 63 16 Industry Material & Machinery 67 17 Packaging 90 15 Petrochemicals & Chemicals 71 13
Property & Construction Construction Materials 100 24
Property Development 196 42 Resource Energy & Utilities 71 17 Mining 7 1 Services Commerce 75 14 Health Care Services 80 13 Media & Publishing 118 24 Professional Services 8 2 Tourism & Leisure 73 13 Transportation & Logistics 59 10 Technology Electronic Components 56 10
Information & Communication Technology 105 22
Total 1,733 331
35
Table 2Ownership and CEO Characteristics Description
Panel A: Ownership characteristics of controlling shareholder (CS)a), founding family (FF)b) and family firm (FAM)c) by year
Year
Total No. of Firms
No. of CS Firms
% of CS Firms
Avg % of Stock Owned by CS
Median % of Stock Owned by CS
No. of FF Firms
% of FF Firms
Avg % of Stock Owned by FF
Median % of Stock Owned by FF
No. of FAM Firms
% of FAM
Avg % of Stock Owned by FAM
Median % of Stock Owned by FAM
2000 158 119 75.3% 44.5% 42.1% 91 57.6% 44.9% 41.6% 28 17.7% 43.3% 44.0% 2001 221 157 71.0% 46.7% 45.4% 114 51.6% 46.4% 44.9% 43 19.5% 47.5% 46.0% 2002 226 168 74.3% 46.4% 44.0% 118 52.2% 45.9% 43.9% 50 22.1% 47.4% 44.4% 2003 246 185 75.2% 46.7% 44.0% 129 52.4% 46.2% 43.9% 56 22.8% 47.9% 45.2% 2004 263 201 76.4% 46.6% 46.1% 134 50.9% 46.3% 45.4% 67 25.5% 47.3% 46.1% 2005 290 218 75.2% 47.9% 46.5% 143 49.3% 46.9% 46.3% 75 25.9% 49.7% 49.0% 2006 329 246 74.8% 49.0% 47.6% 168 51.1% 48.4% 46.5% 78 23.7% 50.4% 49.4% Total 1,733 1,294 74.7% 47.1% 45.5% 897 51.8% 46.6% 44.9% 397 22.9% 48.2% 46.1%
a) Controlling shareholder (CS) are either controlling shareholder members on the board of directors or in the top management who directly or indirectly own more than 25% of a firm’s total shares at the beginning of the fiscal year.
b) Founding family (FF) are either founding family members on the board of directors or in the top management of the company who directly or indirectly own more than 25% of total shares at a firm’s beginning of the fiscal year.
c) Family firm (FAM) are either family firm members on the board of directors or in the top management of the company who directly or indirectly own more than 25% of total shares at a firm’s beginning of the fiscal year.
36
Table 2 (continued) Panel B: No. of CEO characteristics of controlling shareholder (CS)a), founding family (FF)b) and family firm (FAM)c) by year
Year N
No. of CS Firms
No. of CS with Founders as CEOs
No. of CS with Descendants as CEOs
No. of CS with Hired Outsiders as CEOs
No. of FF Firms
No. of FF with Founders as CEOs
No. of FF with Descendants as CEOs
No. of FF with Hired Outsiders as CEOs
No. of FAM Firms
No. of FAM with Founders as CEOs
No. of FAM with Descendants as CEOs
No. of FAM with Hired Outsiders as CEOs
2000 158 119 38 26 55 91 34 22 35 28 4 4 20 2001 221 157 47 35 75 114 43 29 42 43 4 6 33 2002 226 168 48 33 87 118 44 27 47 50 4 6 40 2003 246 185 54 37 94 129 48 30 51 56 6 7 43 2004 263 201 61 37 103 134 52 29 53 67 9 8 50 2005 290 218 70 38 110 143 60 29 54 75 10 9 56 2006 329 246 86 47 113 168 75 38 55 78 11 9 58 Total 1,733 1,294 404 253 637 897 356 204 337 397 48 49 300
Panel C: % of CEO characteristics of controlling shareholder (CS)a), founding family (FF)b) and family firm (FAM)c) by year
Year N
% of CS with Founders as CEOs
% of CS with Descendants as CEOs
% of CS with Hired Outsiders as CEOs
% of FF with Founders as CEOs
% of FF with Descendants as CEOs
% of FF with Hired Outsiders as CEOs
% of FAM with Founders as CEOs
% of FAM with Descendants as CEOs
% of FAM with Hired Outsiders as CEOs
2000 158 31.9% 21.9% 46.2% 37.4% 24.2% 38.4% 14.2% 14.3% 71.5% 2001 221 29.9% 22.3% 47.8% 37.7% 25.4% 36.9% 9.3% 13.9% 76.8% 2002 226 28.6% 19.6% 51.8% 37.3% 22.9% 39.8% 8.0% 12.0% 80.0% 2003 246 29.2% 20.0% 50.8% 37.2% 23.3% 39.5% 10.7% 12.5% 76.8% 2004 263 30.4% 18.4% 51.2% 38.8% 21.6% 39.6% 13.4% 11.9% 74.7% 2005 290 32.1% 17.4% 50.5% 41.9% 20.2% 37.9% 13.3% 12.0% 74.7% 2006 329 34.9% 19.2% 45.9% 44.6% 22.6% 32.8% 14.1% 11.5% 74.4% Total 1,733 31.2% 19.6% 49.2% 39.7% 22.7% 37.6% 12.1% 12.3% 75.6%

37
Table 3 Descriptive statistics
Panel A: Descriptive Statistics for the Full Sample
Mean MedianStd. Dev. P10 P25 P75 P90
EPS -0.309 0.085 0.924 -1.942 -0.368 0.168 0.318R 0.306 0.086 0.932 -0.383 -0.175 0.442 1.114RD 0.410 0.000 0.492 0.000 0.000 1.000 1.000OWN 0.394 0.371 0.190 0.158 0.250 0.522 0.661DUAL 0.269 0.000 0.444 0.000 0.000 1.000 1.000BRDSIZE 11.310 11.000 3.436 8.000 9.000 13.000 15.000IND 0.273 0.273 0.084 0.188 0.222 0.333 0.375BIG 4 0.609 1.000 0.488 0.000 0.000 1.000 1.000LEV 0.352 0.290 0.752 0.001 0.079 0.521 0.691PINST 0.024 0.000 0.053 0.000 0.000 0.0241 0.082SIZE 1.008 0.533 6.202 0.129 0.277 1.014 1.787RISK 0.139 0.000 0.346 0.000 0.000 0.000 1.000MTB 2.830 1.060 39.455 0.354 0.620 1.810 3.190
EPS is earnings per share before extraordinary items deflected by price at the beginning of the fiscal year.
R is stock return for firm i from 10 months before the financial year-end to 2 months after the financial year-end.
RD is a dummy variable coded 1 if R is negative, zero is otherwise. OWN is equal to the percentage of share held by the controlling shareholder members at the beginning of the fiscal year.
DUAL is a dummy variable equal to one if the CEO is chairman of the boards, zero otherwise.
BRDSIZE is number of directors on the board at the year-end IND is a number of independent audit committee divided by total board size BIG4 is a dummy variable coded 1 if the firm’s auditor is a big-four firm, zero otherwise LEV is long-term debt divided by total assets at the beginning of the fiscal year. PINST is institutional share ownership as a percentage of the total number of outstanding shares at the beginning of the fiscal year.
SIZE is equal to the market value of equity divided by total assets at the beginning of the fiscal year.
RISK is a dummy variable coded 1 if the firm is a technology industry and zero otherwise MTB is the market-to-book ratio at the beginning of the fiscal year.

38
Table 3(continued)
Panel B: Difference of Means Tests CS FF FAM Non-CS
(1) (2) (3) (4) (1)-(4) (2)-(4) (3)-(4) Mean Mean Mean Mean Mean
Difference Mean Difference
Mean Difference
MV (Billion) 9.4 8.1 12.4 4.0 5.4 *** 4.1 *** 8.3 *** SE (Billion) 4.6 4.0 6.1 2.7 1.9 *** 1.3 *** 3.4 *** TD (Billion) 4.5 4.1 5.4 2.7 1.8 *** 1.5 ** 2.7 **TA (Billion) 11.4 10.0 14.6 6.4 5.0 *** 3.6 *** 8.2 *** CFO (Billion) 1.2 1.0 1.7 0.3 0.9 *** 0.7 *** 1.4 *** EPS (Baht) 2.3 2.4 2.2 0.8 1.5 *** 1.6 *** 1.3 *** ROA % 36.6 42.0 24.6 11.4 25.3 30.6 13.2 ROE % (0.7) (1.1) 0.1 0.1 (0.8) (1.2) 0.0
N 1,294 897 397 439
*/**/*** represents significance difference at the 10%, 5% and 1%, respectively.
MV is market value of equity SE is shareholders’ equity. NI is net income for the year. TD is total debts. TA is total assets. CFO is cash flows from operations. EPS is earnings per share before extraordinary items. ROA is return on assets. ROE is return on equity.
39
Table 4
Correlation Pearson (top)/Spearman (bottom)
EPS
R
RD OWN
DUAL
BRD SIZE
BIG 4
LEV
PINST
SIZE
RISK
MTB
EPS 0.40 -0.67 0.03 -0.04 0.11 -0.08 0.01 -0.01 0.08 -0.03 -0.03 -0.04R 0.74 -0.50 0.00 -0.02 0.01 0.02 0.00 0.03 0.08 -0.06 0.03 -0.01RD -0.72 -0.85 0.02 0.04 -0.09 0.07 0.02 0.06 -0.07 0.05 0.02 0.04OWN 0.01 0.00 0.02 0.06 -0.04 0.15 0.05 -0.01 -0.07 -0.01 -0.04 0.03DUAL -0.02 -0.03 0.04 0.05 -0.12 0.12 -0.13 0.02 0.00 0.00 -0.14 0.03BRDSIZE 0.12 0.09 -0.11 -0.13 -0.16 -0.70 0.05 -0.04 0.06 -0.02 -0.03 0.02IND -0.10 -0.08 0.09 0.17 0.17 -0.86 0.00 0.00 -0.08 0.03 0.07 -0.03BIG 4 -0.02 -0.04 0.02 0.06 -0.13 0.02 0.01 0.05 0.09 0.02 0.08 -0.03LEV -0.04 -0.03 0.08 -0.06 -0.02 -0.01 -0.01 0.08 0.01 0.65 0.01 0.02PINST 0.08 0.06 -0.06 -0.04 0.00 0.13 -0.12 0.06 0.03 -0.03 -0.06 0.02SIZE -0.20 -0.19 0.10 0.04 -0.04 -0.02 0.09 0.05 -0.36 -0.16 -0.01 0.01RISK -0.04 0.00 0.02 -0.04 -0.14 -0.07 0.08 0.08 0.06 -0.06 0.03 0.01MTB -0.25 -0.21 0.13 0.03 -0.08 -0.02 0.08 0.07 0.01 -0.14 0.71 0.08
Bold text indicates significant at the .05 level or better, two tailed.
EPS is earnings per share before extraordinary items deflected by price at the beginning of the fiscal year. R is stock return for firm i from 10 months before the financial year-end to 2 months after the financial year-end. RD is a dummy variable coded 1 if R is negative, zero is otherwise. OWN is equal to the percentage of share held by the controlling shareholder members at the beginning of the fiscal year. DUAL is a dummy variable equal to one if the CEO is chairman of the boards, zero otherwise. BRDSIZE is number of directors on the board at the year-end IND is number of independent audit committee divided by total board size BIG4 is a dummy variable coded 1 if the firm’s auditor is a big-four firm, zero otherwise LEV is long-term debt divided by total assets at the beginning of the fiscal year. PINST is institutional share ownership as a percentage of the total number of outstanding shares at the beginning of the fiscal year. SIZE is equal to the market value of equity divided by total assets at the beginning of the fiscal year. RISK is a dummy variable coded 1 if the firm is a technology industry and zero otherwise MTB is the market-to-book ratio at the beginning of the fiscal year.
40
Table 5 Controlling Shareholder (CS), Founding Family (FF) and Family Firm (FAM) Ownership,
Cross-sectional Regression of Earnings Regressed on Contemporaneous Returns (Year 2000-2006) own (rank) Model 1 CS Model 2 FF&FAM
Expected Sign
Parameter Estimate
p-value
Parameter Estimate
p-value
Intercept 0.231 0.193 0.243 0.205 RD -1.666 0.001 *** -2.100 0.000 *** R + -0.060 0.402 -0.101 0.357 R*RD + -1.057 0.227 -1.778 0.128 CS Proxies
OWN (rank) 0.042 0.308 RD*OWN (rank) 0.660 0.000 *** R*OWN (rank) + 0.019 0.392 R*RD*OWN (rank) + 2.472 0.000 ***
FF Proxies OWN(rank) 0.044 0.391 RD*OWN(rank) 1.074 0.000 *** R*OWN(rank) + 0.074 0.292 R*RD*OWN(rank) + 3.561 0.000 ***
FAM Proxies OWN(rank) -0.002 0.495 RD*OWN(rank) 0.839 0.001 *** R*OWN(rank) + 0.053 0.320 R*RD*OWN(rank) + 2.100 0.002 ***
Corporate Governance Control Variables DUAL 0.035 0.286 0.034 0.293 RD*DUAL -0.014 0.452 -0.028 0.408 R*DUAL + 0.011 0.428 0.009 0.436 R*RD*DUAL - 0.506 0.064 * 0.381 0.129 BRDSIZE 0.002 0.420 0.002 0.418 RD*BRDSIZE 0.047 0.025 ** 0.047 0.026 ** R*BRDSIZE - 0.004 0.356 0.004 0.359 R*RD*BRDSIZE + 0.123 0.037 ** 0.103 0.069 * IND 0.143 0.378 0.131 0.389 RD*IND 1.460 0.042 ** 1.461 0.043 ** R*IND - -0.264 0.235 -0.274 0.236 R*RD*IND + 5.163 0.014 ** 4.965 0.018 ** BIG 4 -0.016 0.386 -0.013 0.410 RD*BIG 4 0.250 0.010 ** 0.250 0.010 ** R*BIG 4 - 0.036 0.239 0.034 0.247 R*RD*BIG 4 + 0.512 0.049 ** 0.471 0.064 *
Firm Characteristics Control Variables LEV 0.005 0.479 0.001 0.495 RD*LEV -0.582 0.001 *** -0.581 0.001 *** R*LEV - 0.106 0.103 * 0.111 0.101 * R*RD*LEV + -2.381 0.000 *** -2.432 0.000 *** PINST 0.004 0.179 0.004 0.192 RD*PINST -0.017 0.061 * -0.020 0.037 ** R*PINST - 0.001 0.367 0.001 0.354 R*RD*PINST + -0.052 0.171 -0.064 0.137 SIZE -0.022 0.431 -0.025 0.423 RD*SIZE -0.943 0.000 *** -0.882 0.000 *** R*SIZE + 0.038 0.350 0.047 0.319 R*RD*SIZE - -2.331 0.000 *** -2.031 0.002 ***

41
Table 5 (continued)
own (rank) Model 1 CS Model 2 FF&FAM Expected
Sign Parameter Estimate
p-value
Parameter Estimate
p-value
Firm Characteristics Control Variables RISK 0.029 0.383 0.014 0.443 RD*RISK -0.108 0.240 -0.099 0.258 R*RISK - -0.019 0.362 -0.013 0.404 R*RD*RISK + -0.131 0.378 -0.098 0.408 MTB -0.201 0.042 ** -0.204 0.040 ** RD* MTB 0.413 0.046 ** 0.414 0.046 ** R*MTB + 0.022 0.386 0.020 0.397 R*RD*MTB - 0.912 0.186 0.776 0.125
Year fixed effect Yes Yes Industry fixed effect Yes Yes Adj. R2 0.505 0.503 F-test 0.000 0.000 N 1733 1733
*/**/*** represents significance at the 10%, 5% and 1%, respectively.
The regression being estimated is
EPS = β0 + β1 RD + β2 R + β3 FAM_Proxy + β4 R*RD + β5 R* FAM_Proxy + β6 RD * FAM_Proxy + β7 R*RD* FAM_Proxy + Corporate Governance Control Variables + Firm Characteristics Control Variables + Fixed Effects + εit
All of the control variables in the regression are also interacted with RD and R.
where EPS is earnings per share before extraordinary items deflected by price at the beginning of the fiscal
year. R is stock return for firm i from 10 months before the financial year-end to 2 months after the financial
year-end. RD is a dummy variable coded 1 if R is negative, zero is otherwise.
Family Proxies OWN(rank) is equal to the scaled deciles rank of percentage of shares held by the CS, FF and FAM
members at the beginning of fiscal year.
Corporate Governance Control Variables DUAL is a dummy variable equal to one if the CEO is chairman of the boards, zero otherwise. BRDSIZE is number of directors on the board at the year-end. IND is number of independent audit committee divided by total board size. BIG4 is a dummy variable coded 1 if the firm’s auditor is a big-four firm, zero otherwise.
Firm Characteristics Control Variables LEV is equal to scaled deciles rank of total debts divided by total assets at the beginning of the fiscal
year. PINST is institutional share ownership as a percentage of the total number of outstanding shares at the
beginning of the fiscal year. SIZE is equal to the scaled deciles rank of market value of equity divided by total assets at the beginning
of the fiscal year. RISK is a dummy variable coded 1 if the firm is a technology industry and zero otherwise MTB is equal to the scaled deciles rank of the market-to-book ratio at the beginning of the fiscal year.

42
Table 6
Controlling Shareholder (CS), Founding Family (FF) and Family Firm (FAM) Members Ownership Level, Cross-sectional Regression of Earnings Regressed on Contemporaneous Returns (Year 2000-2006)
OWN Model 1 CS Model 2 FF&FAM Expected
Sign Parameter Estimate
p-value
Parameter Estimate
p-value
Intercept 0.206 0.220 0.206 0.220 RD -1.531 0.001 *** -1.511 0.002 *** R + 0.009 0.484 0.019 0.468 R*RD + -0.755 0.297 -0.366 0.398 CS Proxies
OWN>20-50% 0.012 0.425 RD*OWN>20-50% 0.225 0.041 ** R*OWN>20-50% + -0.056 0.184 R*RD*OWN>20-50% + 1.292 0.000 *** OWN>50% 0.060 0.212 RD*OWN>50% 0.420 0.001 *** R* OWN>50% + -0.047 0.238 R*RD* OWN>50% + 1.625 0.000 ***
FF Proxies OWN>20-50% 0.018 0.397 RD*OWN>20-50% 0.235 0.046 ** R*OWN>20-50% + -0.061 0.174 R*RD*OWN>20-50% + 1.734 0.000 *** OWN>50% 0.079 0.168 RD*OWN>50% 0.427 0.003 *** R* OWN>50% + -0.038 0.302 R*RD* OWN>50% + 1.728 0.000 ***
FAM Proxies OWN>20-50% 0.004 0.482 RD*OWN>20-50% 0.280 0.048 ** R*OWN>20-50% + -0.052 0.255 R*RD*OWN>20-50% + 0.628 0.085 * OWN>50% 0.005 0.482 RD*OWN>50% 0.421 0.013 ** R* OWN>50% + -0.062 0.243 R*RD* OWN>50% + 1.440 0.003 ***
Corporate Governance Control Variables DUAL 0.037 0.276 0.034 0.293 RD*DUAL -0.017 0.442 -0.007 0.476 R*DUAL + 0.010 0.433 0.010 0.433 R*RD*DUAL - 0.496 0.068 * 0.514 0.063 * BRDSIZE 0.004 0.370 0.004 0.374 RD*BRDSIZE 0.047 0.027 ** 0.043 0.039 ** R*BRDSIZE - 0.003 0.387 0.003 0.386 R*RD*BRDSIZE + 0.121 0.040 ** 0.091 0.097 * IND 0.208 0.327 0.207 0.328 RD*IND 1.538 0.035 ** 1.422 0.047 ** R*IND - -0.344 0.174 -0.377 0.156 R*RD*IND + 5.904 0.006 *** 5.068 0.016 ** BIG 4 -0.020 0.361 -0.013 0.404 RD*BIG 4 0.253 0.010 *** 0.256 0.009 ** R*BIG 4 - 0.042 0.201 0.038 0.228 R*RD*BIG 4 + 0.473 0.064 * 0.485 0.059 *

43
Table 6 (continued)
OWN Model 1 CS Model 2 FF&FAM Expected
Sign Parameter Estimate
p-value
Parameter Estimate
p-value
Firm Characteristics Control Variables LEV 0.001 0.495 0.005 0.482 RD*LEV -0.624 0.001 *** -0.607 0.001 *** R*LEV - 0.129 0.073 * 0.127 0.085 * R*RD*LEV + -2.649 0.000 *** -2.654 0.000 *** PINST 0.004 0.176 0.004 0.193 RD*PINST -0.020 0.039 ** -0.019 0.048 ** R*PINST - 0.002 0.339 0.002 0.318 R*RD*PINST + -0.064 0.138 -0.066 0.133 SIZE -0.015 0.453 -0.013 0.461 RD*SIZE -0.960 0.000 *** -0.883 0.000 *** R*SIZE + 0.031 0.379 0.039 0.351 R*RD*SIZE - -2.336 0.000 *** -1.983 0.003 *** RISK 0.025 0.397 0.012 0.453 RD*RISK -0.121 0.214 -0.098 0.262 R*RISK - -0.022 0.341 -0.011 0.425 R*RD*RISK + -0.153 0.359 -0.123 0.386 MTB -0.199 0.043 ** -0.206 0.039 ** RD* MTB 0.383 0.060 * 0.381 0.061 * R*MTB + 0.016 0.419 0.017 0.415 R*RD*MTB - 0.714 0.145 0.649 0.168
Year fixed effect Yes Yes Industry fixed effect Yes Yes Adj. R2 0.502 0.506 F-test 0.000 0.000 N 1,733 1,733
*/**/*** represents significance at the 10%, 5% and 1%, respectively.
The regression being estimated is
EPS = β0 + β1 RD + β2 R + β3 FAM_Proxy + β4 R*RD + β5 R* FAM_Proxy + β6 RD * FAM_Proxy + β7 R*RD* FAM_Proxy + Corporate Governance Control Variables + Firm Characteristics Control Variables + Fixed Effects + εit
All of the control variables in the regression are also interacted with RD and R.
where EPS is earnings per share before extraordinary items deflected by price at the beginning of the fiscal
year. R is stock return for firm i from 10 months before the financial year-end to 2 months after the financial
year-end. RD is a dummy variable coded 1 if R is negative, zero is otherwise.
Family Proxies OWN >25-50%_CS is a dummy variable equal to one if common stock owned by CS, FF and FAM
members between 20%-50% at the beginning of the year. OWN >50%_CS is a dummy variable equal to one if common stock owned by CS, FF and FAM
members more than 50% at the beginning of the year.
See table 5 for Corporate Governance and Firm Characteristics Control Variables definitions.
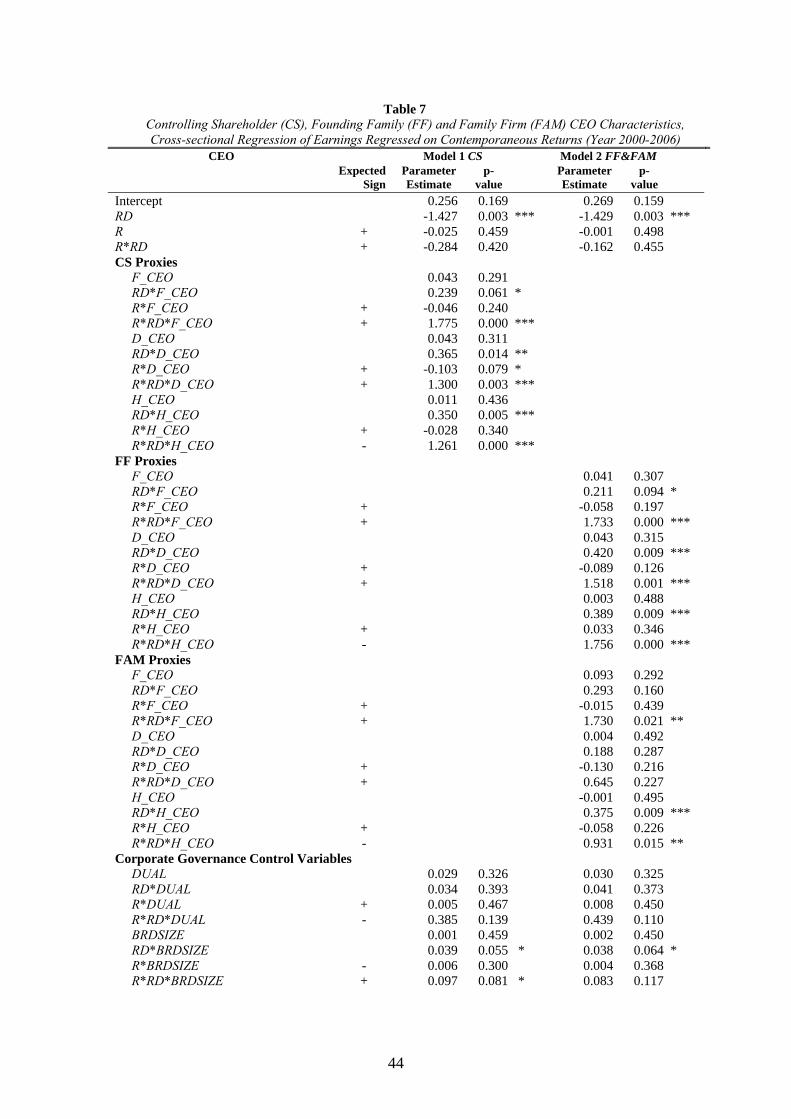
44
Table 7 Controlling Shareholder (CS), Founding Family (FF) and Family Firm (FAM) CEO Characteristics, Cross-sectional Regression of Earnings Regressed on Contemporaneous Returns (Year 2000-2006)
CEO Model 1 CS Model 2 FF&FAM Expected
Sign Parameter Estimate
p-value
Parameter Estimate
p-value
Intercept 0.256 0.169 0.269 0.159 RD -1.427 0.003 *** -1.429 0.003 *** R + -0.025 0.459 -0.001 0.498 R*RD + -0.284 0.420 -0.162 0.455 CS Proxies
F_CEO 0.043 0.291 RD*F_CEO 0.239 0.061 * R*F_CEO + -0.046 0.240 R*RD*F_CEO + 1.775 0.000 *** D_CEO 0.043 0.311 RD*D_CEO 0.365 0.014 ** R*D_CEO + -0.103 0.079 * R*RD*D_CEO + 1.300 0.003 *** H_CEO 0.011 0.436 RD*H_CEO 0.350 0.005 *** R*H_CEO + -0.028 0.340 R*RD*H_CEO - 1.261 0.000 ***
FF Proxies F_CEO 0.041 0.307 RD*F_CEO 0.211 0.094 * R*F_CEO + -0.058 0.197 R*RD*F_CEO + 1.733 0.000 *** D_CEO 0.043 0.315 RD*D_CEO 0.420 0.009 *** R*D_CEO + -0.089 0.126 R*RD*D_CEO + 1.518 0.001 *** H_CEO 0.003 0.488 RD*H_CEO 0.389 0.009 *** R*H_CEO + 0.033 0.346 R*RD*H_CEO - 1.756 0.000 ***
FAM Proxies F_CEO 0.093 0.292 RD*F_CEO 0.293 0.160 R*F_CEO + -0.015 0.439 R*RD*F_CEO + 1.730 0.021 ** D_CEO 0.004 0.492 RD*D_CEO 0.188 0.287 R*D_CEO + -0.130 0.216 R*RD*D_CEO + 0.645 0.227 H_CEO -0.001 0.495 RD*H_CEO 0.375 0.009 *** R*H_CEO + -0.058 0.226 R*RD*H_CEO - 0.931 0.015 **
Corporate Governance Control Variables DUAL 0.029 0.326 0.030 0.325 RD*DUAL 0.034 0.393 0.041 0.373 R*DUAL + 0.005 0.467 0.008 0.450 R*RD*DUAL - 0.385 0.139 0.439 0.110 BRDSIZE 0.001 0.459 0.002 0.450 RD*BRDSIZE 0.039 0.055 * 0.038 0.064 * R*BRDSIZE - 0.006 0.300 0.004 0.368 R*RD*BRDSIZE + 0.097 0.081 * 0.083 0.117

45
Table 7 (continued) CEO Model 1 CS Model 2 FF&FAM
Expected Sign
Parameter Estimate
p-value
Parameter Estimate
p-value
Corporate Governance Control Variables IND 0.157 0.368 0.141 0.383 RD*IND 1.521 0.038 ** 1.510 0.040 ** R*IND - -0.278 0.227 -0.309 0.209 R*RD*IND + 5.136 0.015 ** 4.883 0.021 ** BIG 4 -0.011 0.425 -0.015 0.397 RD*BIG 4 0.223 0.022 ** 0.220 0.024 ** R*BIG 4 - 0.038 0.230 0.046 0.188 R*RD*BIG 4 + 0.486 0.062 * 0.435 0.087 *
Firm Characteristics Control Variables LEV 0.003 0.487 0.005 0.481 RD*LEV -0.649 0.000 *** -0.668 0.000 *** R*LEV - 0.112 0.105 * 0.104 0.138 R*RD*LEV + -2.620 0.000 *** -2.649 0.000 *** PINST 0.003 0.246 0.003 0.280 RD*PINST -0.021 0.032 ** -0.018 0.051 * R*PINST - 0.002 0.320 0.003 0.229 R*RD*PINST + -0.080 0.113 -0.075 0.120 SIZE -0.014 0.456 -0.013 0.461 RD*SIZE -0.949 0.000 *** -0.948 0.000 *** R*SIZE + 0.028 0.392 0.029 0.389 R*RD*SIZE - -2.350 0.000 *** -2.186 0.001 *** RISK 0.010 0.458 0.018 0.428 RD*RISK -0.119 0.219 -0.137 0.187 R*RISK - -0.009 0.433 -0.035 0.281 R*RD*RISK + -0.157 0.356 -0.159 0.356 MTB -0.203 0.041 ** -0.210 0.037 ** RD* MTB 0.383 0.060 * 0.434 0.042 ** R*MTB + 0.012 0.440 0.025 0.375 R*RD*MTB - 0.782 0.122 0.828 0.112
Year fixed effect Yes Yes Industry fixed effect Yes Yes Adj. R2 0.503 0.503 F-test 0.000 0.000 N 1,733 1,733
*/**/*** represents significance at the 10%, 5% and 1%, respectively.
The regression being estimated is
EPS = β0 + β1 RD + β2 R + β3 FAM_Proxy + β4 R*RD + β5 R* FAM_Proxy + β6 RD * FAM_Proxy + β7 R*RD* FAM_Proxy + Corporate Governance Control Variables + Firm Characteristics Control Variables + Fixed Effects + εit
All of the control variables in the regression are also interacted with RD and R.
where EPS is earnings per share before extraordinary items deflected by price at the beginning of the fiscal
year. R is stock return for firm i from 10 months before the financial year-end to 2 months after the financial
year-end. RD is a dummy variable coded 1 if R is negative, zero is otherwise.
CEO Characteristics Proxies F_CEO is a dummy variable equal to one if the CEO is the founder of the CS, FF and FAM firms, zero
otherwise. D_CEO is a dummy variable equal to one if the CEO is the descendant of the CS, FF and FAM firms,
zero otherwise. H_CEO is a dummy variable equal to one if the CEO is the hired outsider as CEOs of the CS, FF and
FAM firms, zero otherwise.
See table 5 for Corporate Governance and Firm Characteristics Control Variables definitions.

46
Table 8
Controlling Shareholder (CS), Founding Family (FF) and Family Firm (FAM), Cross-sectional Regression of Earnings Regressed on Contemporaneous Returns (Year 2000-2006)
Family Model 1 CS Model 2 FF&FAM Expected
Sign Parameter Estimate
p-value
Parameter Estimate
p-value
Intercept 0.216 0.424 0.214 0.429 RD -1.719 0.001 *** -1.716 0.001 *** R + -0.075 0.762 -0.061 0.806 R*RD + -1.336 0.350 -1.154 0.421 CS Proxies
OWN(%) 0.095 0.521 RD*OWN(%) 1.078 0.000 *** R*OWN(%) + 0.044 0.730 R*RD*OWN(%) + 4.114 0.000 ***
FF Proxies OWN(%) 0.102 0.507 RD*OWN(%) 1.107 0.000 *** R*OWN(%) + 0.065 0.646 R*RD*OWN(%) + 4.410 0.000 ***
FAM Proxies OWN(%) 0.037 0.831 RD*OWN(%) 1.049 0.001 *** R*OWN(%) + 0.039 0.776 R*RD*OWN(%) + 3.388 0.000 ***
Corporate Governance Control Variables DUAL 0.035 0.571 0.034 0.587 RD*DUAL -0.013 0.913 -0.025 0.836 R*DUAL + 0.009 0.872 0.011 0.857 R*RD*DUAL - 0.517 0.119 0.427 0.205 BRDSIZE 0.002 0.833 0.003 0.801 RD*BRDSIZE 0.045 0.061 * 0.044 0.067 * R*BRDSIZE - 0.004 0.688 0.003 0.745 R*RD*BRDSIZE + 0.116 0.090 * 0.105 0.127 IND 0.137 0.766 0.148 0.750 RD*IND 1.403 0.097 * 1.388 0.101 * R*IND - -0.250 0.495 -0.293 0.436 R*RD*IND + 4.972 0.034 ** 4.820 0.041 ** BIG 4 -0.016 0.769 -0.013 0.821 RD*BIG 4 0.249 0.021 ** 0.244 0.024 ** R*BIG 4 - 0.035 0.481 0.034 0.493 R*RD*BIG 4 + 0.521 0.092 * 0.502 0.105 *
Firm Characteristics Control Variables LEV 0.007 0.942 0.005 0.955 RD*LEV -0.593 0.002 *** -0.586 0.002 *** R*LEV - 0.105 0.213 0.109 0.210 R*RD*LEV + -2.395 0.000 *** -2.413 0.000 *** PINST 0.004 0.344 0.004 0.357 RD*PINST -0.017 0.127 -0.017 0.124 R*PINST - 0.001 0.724 0.001 0.743 R*RD*PINST + -0.051 0.151 -0.053 0.135 SIZE -0.021 0.867 -0.018 0.888 RD*SIZE -0.966 0.000 *** -0.926 0.001 *** R*SIZE + 0.038 0.702 0.039 0.697 R*RD*SIZE - -2.415 0.001 *** -2.191 0.002 ***

47
Table 8 (continued)
Family Model 1 CS Model 2 FF&FAM Expected
Sign Parameter Estimate
p-value
Parameter Estimate
p-value
Firm Characteristics Control Variables RISK 0.030 0.757 0.024 0.802 RD*RISK -0.095 0.534 -0.090 0.555 R*RISK - -0.019 0.718 -0.016 0.766 R*RD*RISK + -0.094 0.823 -0.069 0.871 MTB -0.202 0.082 * -0.207 0.075 * RD* MTB 0.425 0.083 * 0.413 0.093 * R*MTB + 0.023 0.762 0.026 0.737 R*RD*MTB - 0.967 0.148 0.850 0.206
Year fixed effect Yes Yes Industry fixed effect Yes Yes Adj. R2 0.505 0.505 F-test 0.000 0.000 N 1,733 1,733
*/**/*** represents significance at the 10%, 5% and 1%, respectively.
The regression being estimated is
EPS = β0 + β1 RD + β2 R + β3 R*RD + β4 OWN + β5 R* OWN + β6 RD * OWN + β7 R*RD* OWN + Corporate Governance Control Variables + Firm Characteristics Control Variables + Fixed Effects + εit
All of the control variables in the regression are also interacted with RD and R.
where EPS is earnings per share before extraordinary items deflected by price at the beginning of the fiscal
year. R is stock return for firm i from 10 months before the financial year-end to 2 months after the financial
year-end. RD is a dummy variable coded one if R is negative, zero is otherwise.
Family Proxies OWN is used to measure CS, FF and FAM ownership based on the percentage of common stock owned
by CS, FF and FAM members at the beginning of the fiscal year.
See table 5 for Corporate Governance and Firm Characteristics Control Variables definitions.