Accessibility- vs. Mobility- Enhancing Strategies for Addressing Auto Dependence Susan Handy...
42
Accessibility- vs. Mobility-Enhancing Strategies for Addressing Auto Dependence Susan Handy Susan Handy University of California University of California Davis Davis
-
Upload
elijah-scott -
Category
Documents
-
view
221 -
download
0
Transcript of Accessibility- vs. Mobility- Enhancing Strategies for Addressing Auto Dependence Susan Handy...
Accessibility- vs. Mobility-Enhancing Strategies for
Addressing Auto Dependence
Susan HandySusan Handy
University of California DavisUniversity of California Davis

Figure 1. Vehicle-Kilometers-Traveled per Person in the U.S.
(1936 - 2000)
-
2,000
4,000
6,000
8,000
10,000
12,000
14,000
16,000
18,000
1936
1940
1944
1948
1952
1956
1960
1964
1968
1972
1976
1980
1984
1988
1992
1996
2000
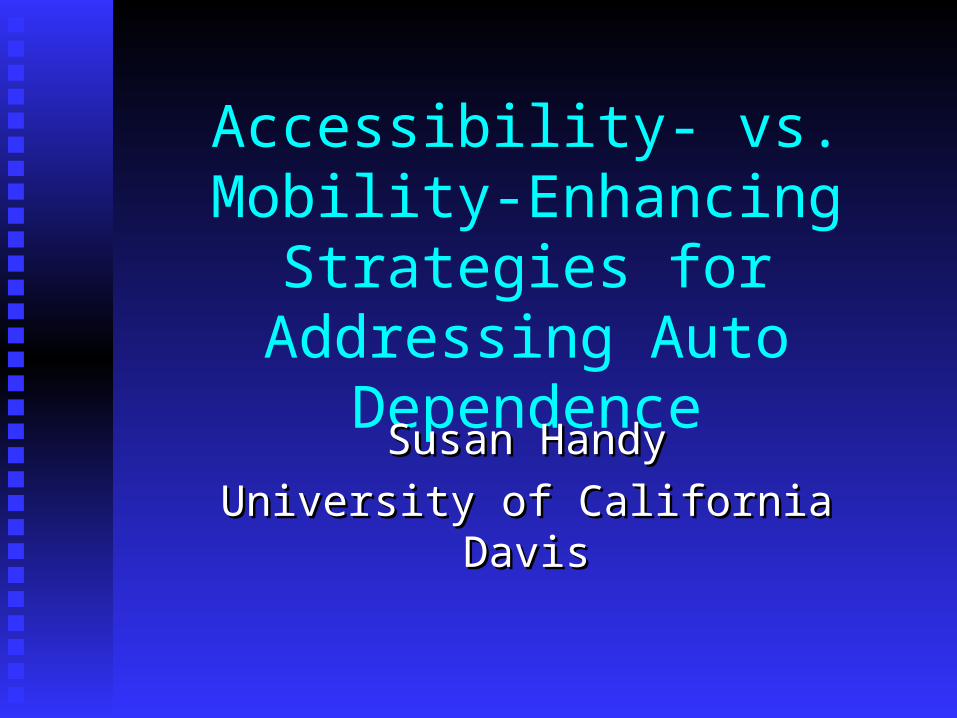
Figure 2. Total Capital Outlays for Roads in the U.S. (1956 - 2000)
$0
$10
$20
$30
$40
$50
$60
$7019
56
1959
1962
1965
1968
1971
1974
1977
1980
1983
1986
1989
1992
1995
1998
Mil
lion
s of
Con
stan
t 200
0 D
olla
rs
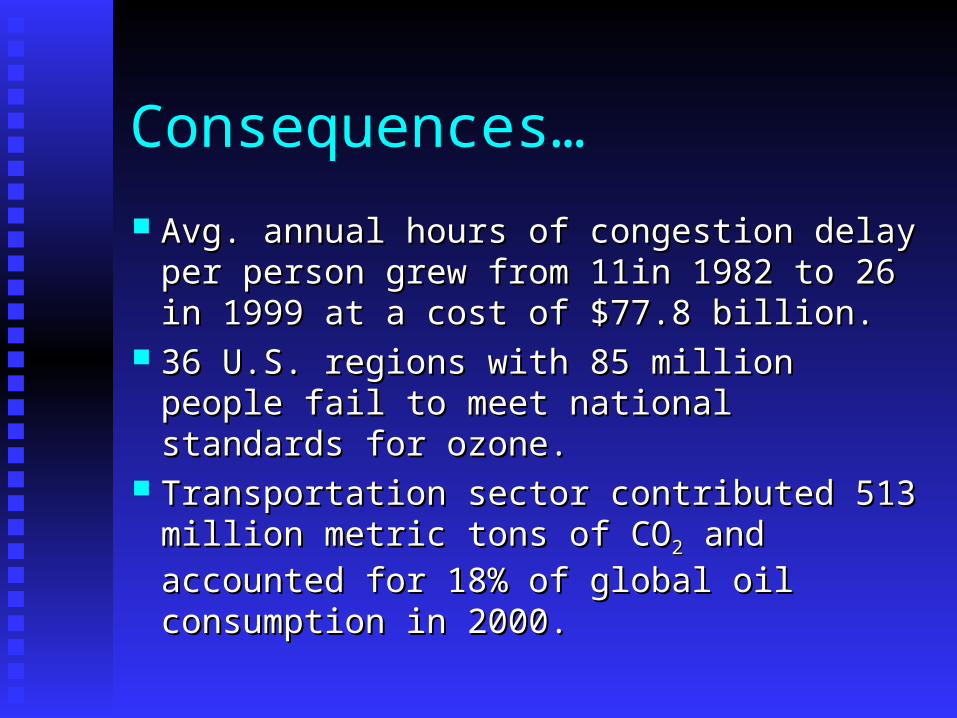
Consequences…
Avg. annual hours of congestion delay per Avg. annual hours of congestion delay per person grew from 11in 1982 to 26 in 1999 person grew from 11in 1982 to 26 in 1999 at a cost of $77.8 billion.at a cost of $77.8 billion.
36 U.S. regions with 85 million people fail 36 U.S. regions with 85 million people fail to meet national standards for ozone.to meet national standards for ozone.
Transportation sector contributed 513 Transportation sector contributed 513 million metric tons of COmillion metric tons of CO22 and accounted and accounted
for 18% of global oil consumption in 2000.for 18% of global oil consumption in 2000.
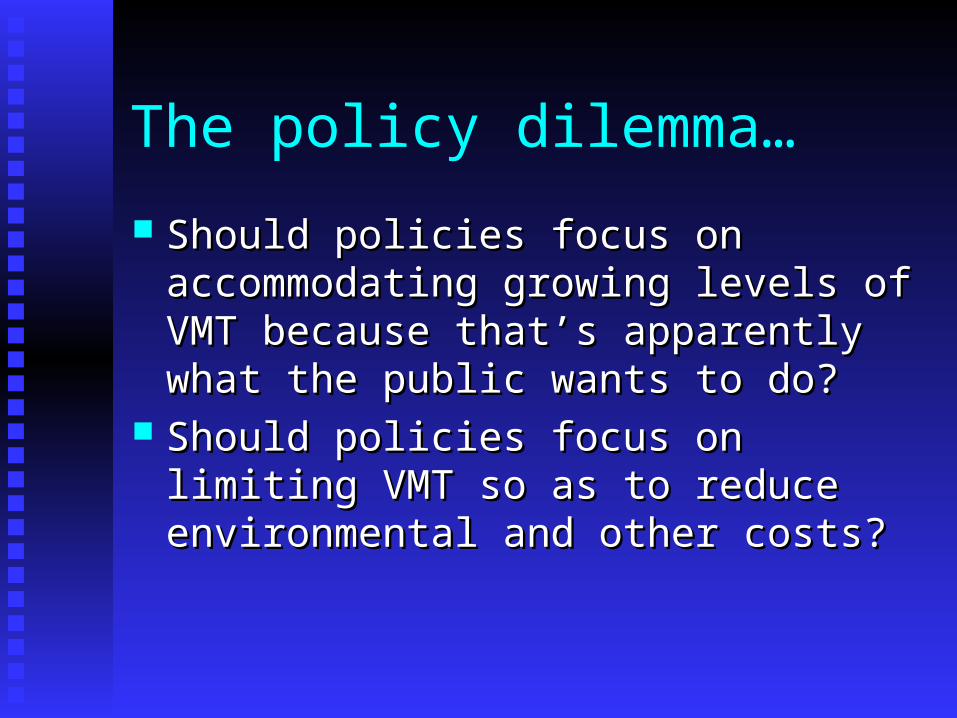
The policy dilemma…
Should policies focus on accommodating Should policies focus on accommodating growing levels of VMT because that’s growing levels of VMT because that’s apparently what the public wants to do?apparently what the public wants to do?
Should policies focus on limiting VMT so Should policies focus on limiting VMT so as to reduce environmental and other costs?as to reduce environmental and other costs?
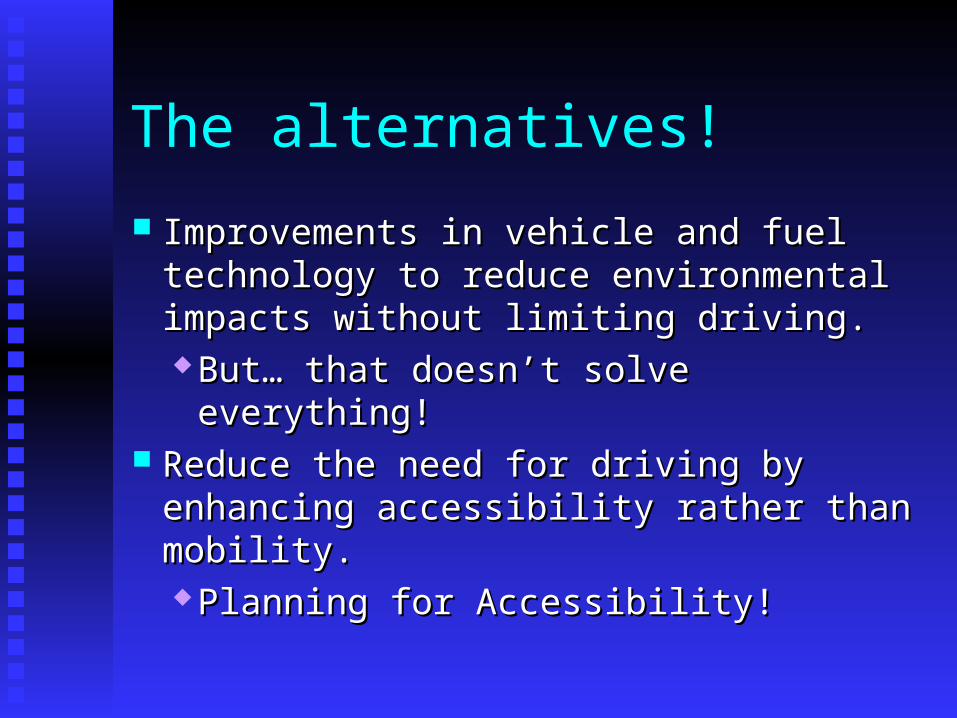
The alternatives!
Improvements in vehicle and fuel Improvements in vehicle and fuel technology to reduce environmental technology to reduce environmental impacts without limiting driving.impacts without limiting driving. But… that doesn’t solve everything!But… that doesn’t solve everything!
Reduce the need for driving by enhancing Reduce the need for driving by enhancing accessibility rather than mobility.accessibility rather than mobility. Planning for Accessibility!Planning for Accessibility!
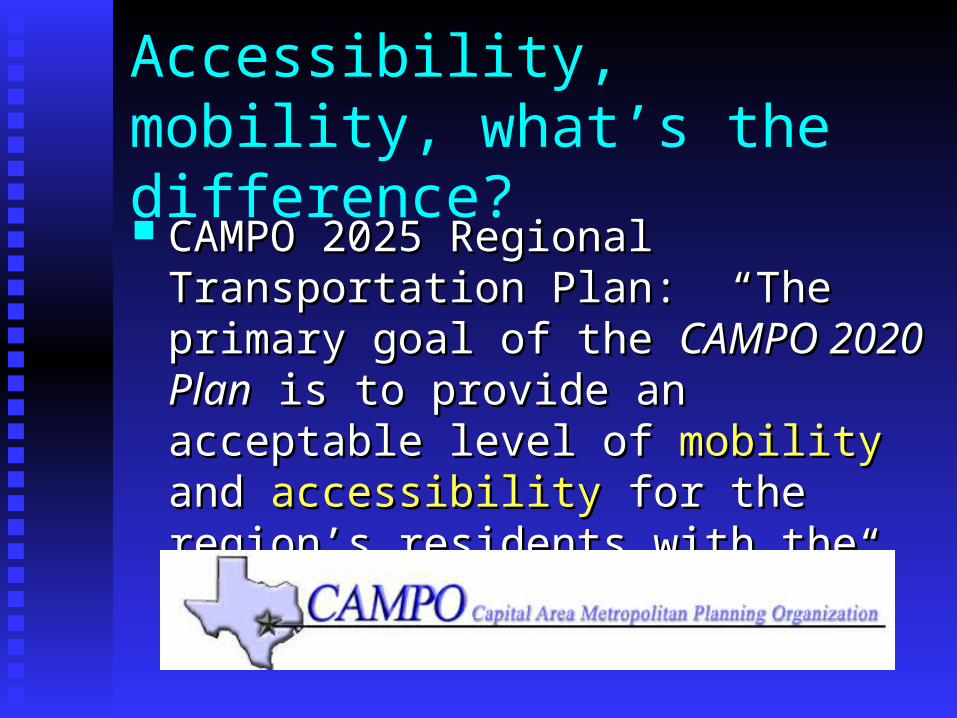
Accessibility, mobility, what’s the difference? CAMPO 2025 Regional Transportation CAMPO 2025 Regional Transportation
Plan: “The primary goal of the Plan: “The primary goal of the CAMPO CAMPO 2020 Plan2020 Plan is to provide an acceptable level is to provide an acceptable level of of mobilitymobility and and accessibilityaccessibility for the region’s for the region’s residents with the least detrimental effects.”residents with the least detrimental effects.”
Accessibility, mobility, what’s the difference? CATS 2020 Regional Transportation Plan: CATS 2020 Regional Transportation Plan:
“Provide an integrated and coordinated “Provide an integrated and coordinated transportation system that maximizes transportation system that maximizes accessibilityaccessibility and includes a variety of and includes a variety of mobilitymobility options that serve the needs of options that serve the needs of residents and businesses in the region.”residents and businesses in the region.”

Accessibility, mobility, what’s the difference? TEA-21: “Increase the TEA-21: “Increase the accessibilityaccessibility and and
mobilitymobility options available to people and for options available to people and for freight”freight”
Accessibility vs. Mobility
Mobility is the potential for movementMobility is the potential for movement Accessibility is the potential for interactionAccessibility is the potential for interaction
Huh?

Good Mobility
Ability to move aroundAbility to move around
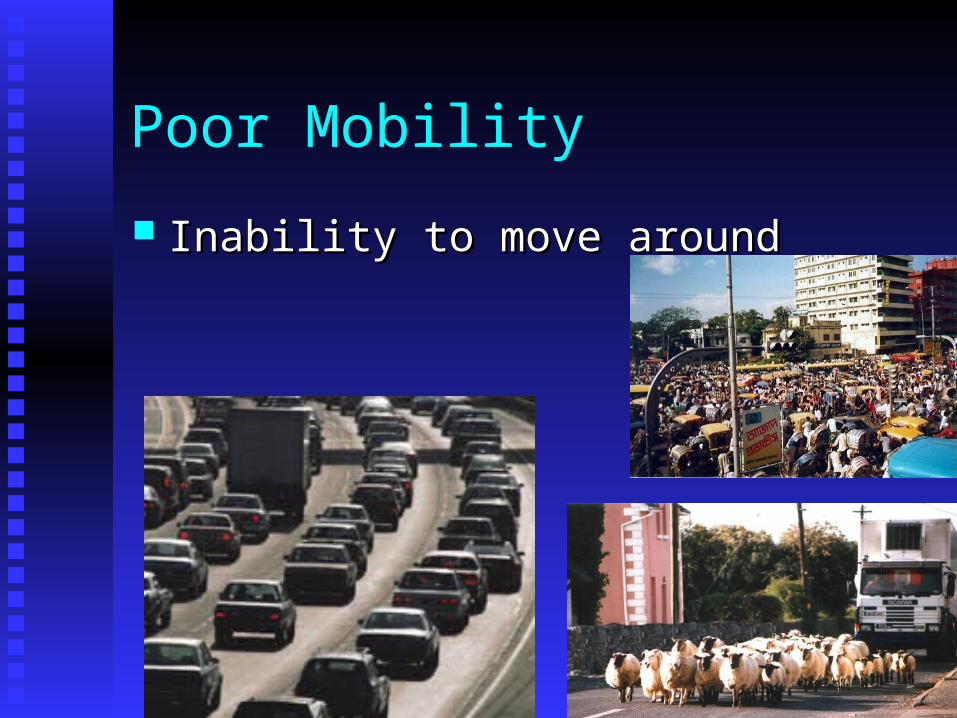
Poor Mobility
Inability to move aroundInability to move around
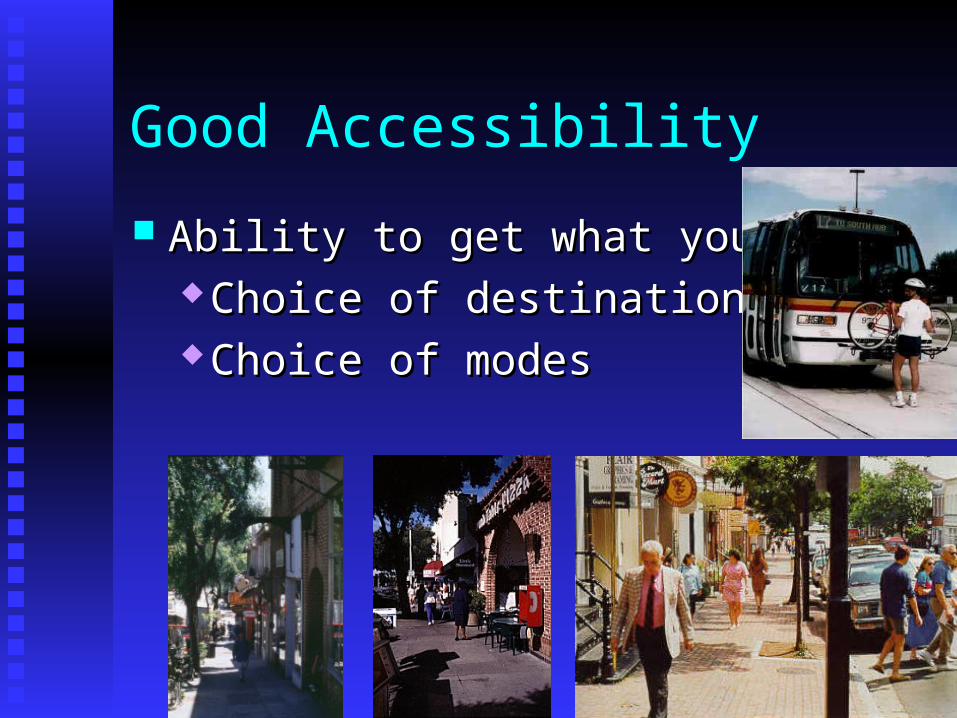
Good Accessibility
Ability to get what you needAbility to get what you need Choice of destinationsChoice of destinations Choice of modesChoice of modes
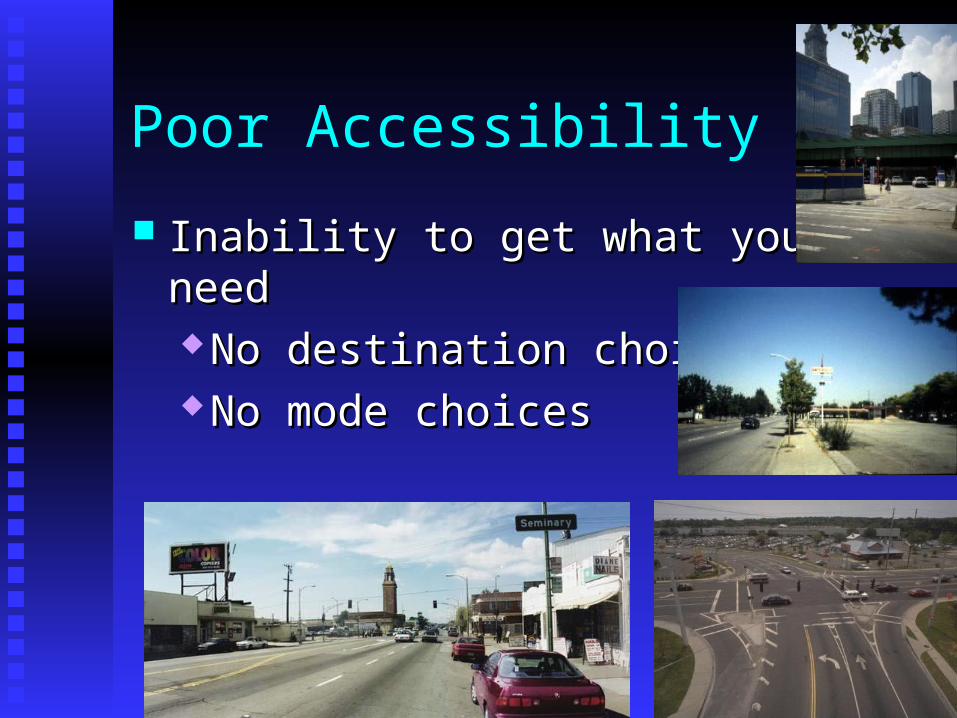
Poor Accessibility
Inability to get what you needInability to get what you need No destination choicesNo destination choices No mode choicesNo mode choices
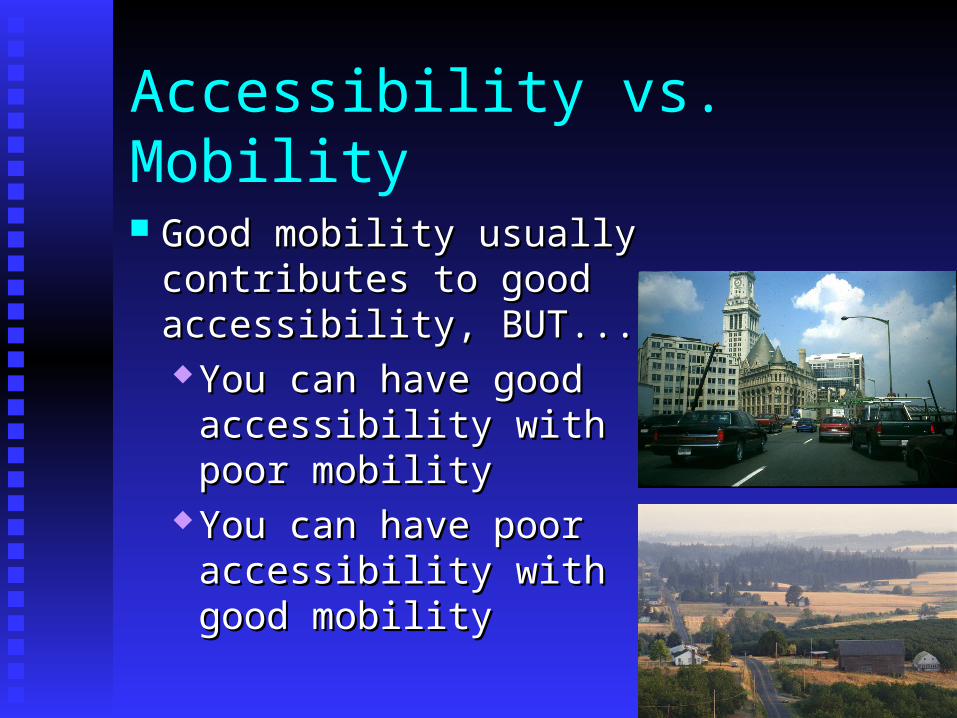
Accessibility vs. Mobility
Good mobility usually Good mobility usually contributes to good contributes to good accessibility, BUT...accessibility, BUT... You can have good You can have good
accessibility with poor accessibility with poor mobilitymobility
You can have poor You can have poor accessibility with good accessibility with good mobilitymobility
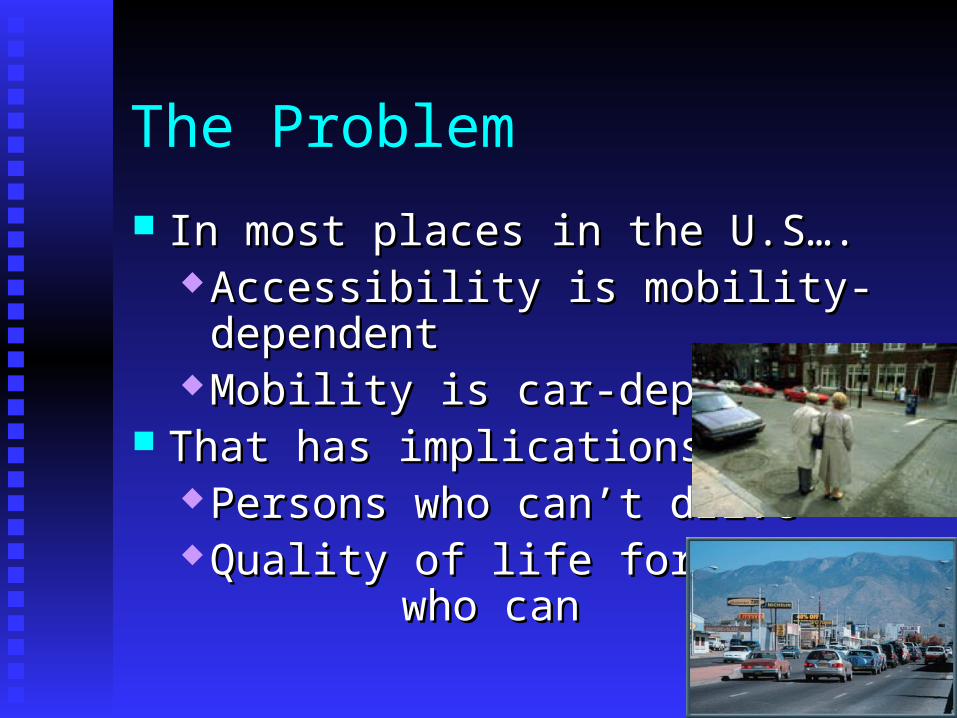
The Problem
In most places in the U.S….In most places in the U.S…. Accessibility is mobility-dependentAccessibility is mobility-dependent Mobility is car-dependentMobility is car-dependent
That has implications for…That has implications for… Persons who can’t drivePersons who can’t drive Quality of life for those Quality of life for those
who canwho can

Planning for Mobility
Focus on the means, not the end:Focus on the means, not the end: Maximize movementMaximize movement Emphasize vehicle needsEmphasize vehicle needs
Implications for communities:Implications for communities: Encourages sprawlEncourages sprawl Limits choicesLimits choices
Built into standard Built into standard performance measuresperformance measures
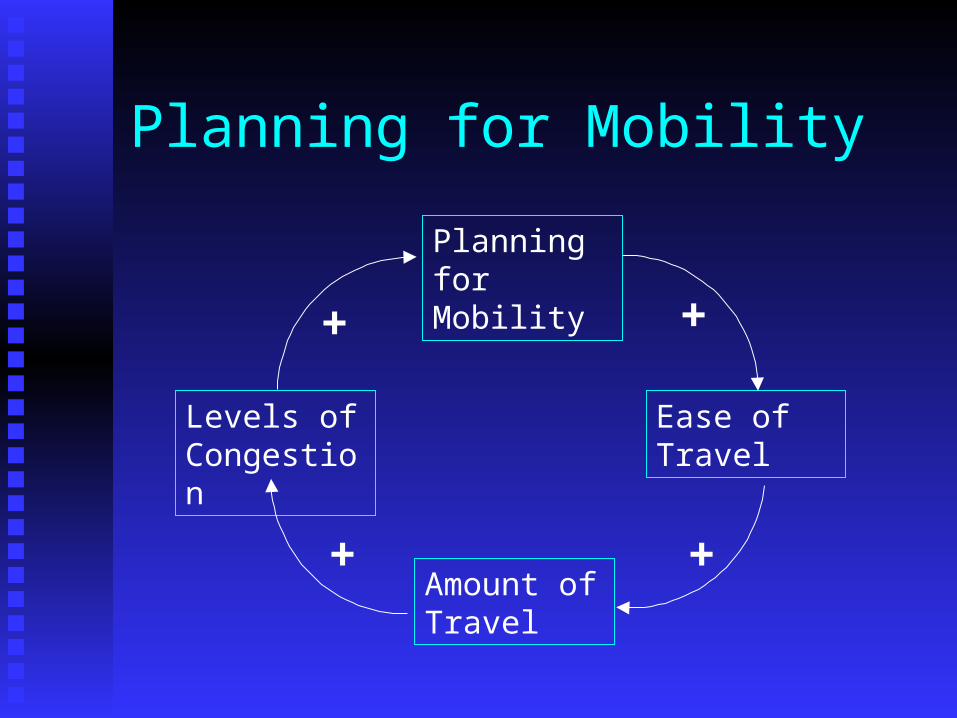
Planning for Mobility
Planning for Mobility
Ease of Travel
Amount of Travel
Levels of Congestion
+ +
+ +
Planning for Accessibility
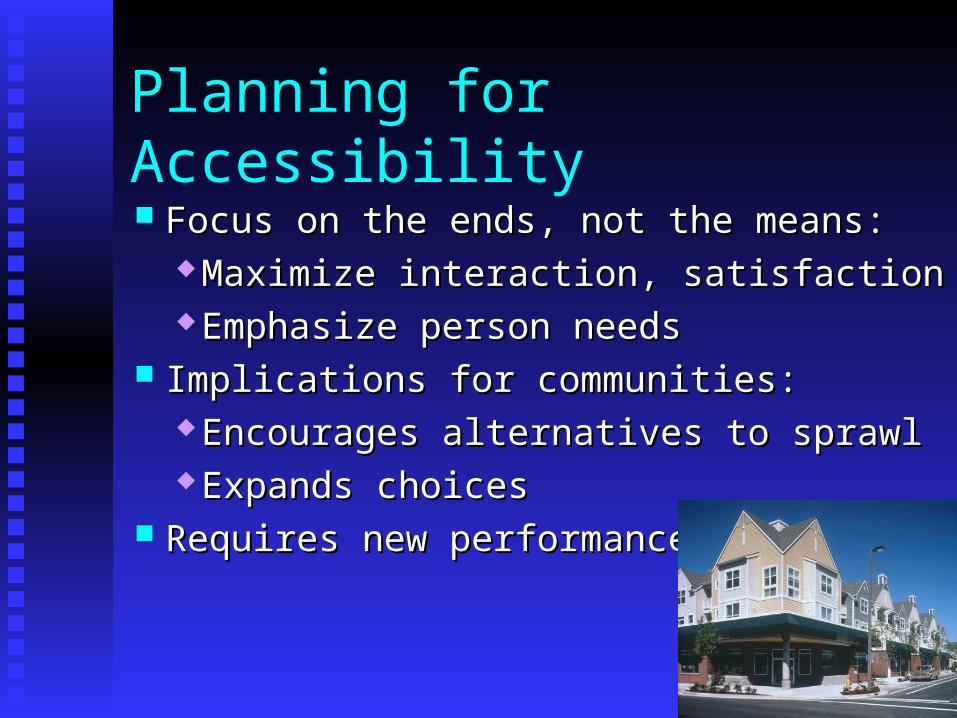
Focus on the ends, not the means:Focus on the ends, not the means: Maximize interaction, satisfactionMaximize interaction, satisfaction Emphasize person needsEmphasize person needs
Implications for communities:Implications for communities: Encourages alternatives to sprawlEncourages alternatives to sprawl Expands choicesExpands choices
Requires new performance Requires new performance measuresmeasures

Planning for Accessibility
Planning for Accessibility
Need for Travel
Amount of Travel
Levels of Congestion
-
? ?
Strategy Options
Mobility-Enhancing StrategiesMobility-Enhancing Strategies Road buildingRoad building ITSITS
Accessibility-Enhancing StrategiesAccessibility-Enhancing Strategies Land use strategiesLand use strategies ICTICT
Mobility-Limiting StrategiesMobility-Limiting Strategies PricingPricing Road restrictionsRoad restrictions

Mobility-Enhancing Philosophy
Metropolitan regions need more highways Metropolitan regions need more highways and freeways to serve growing populationsand freeways to serve growing populations
We should respect the desire of the We should respect the desire of the majority to use their carsmajority to use their cars
Adding capacity will reduce congestion Adding capacity will reduce congestion and its impactsand its impacts
ITS - Intelligent Transportation Systems
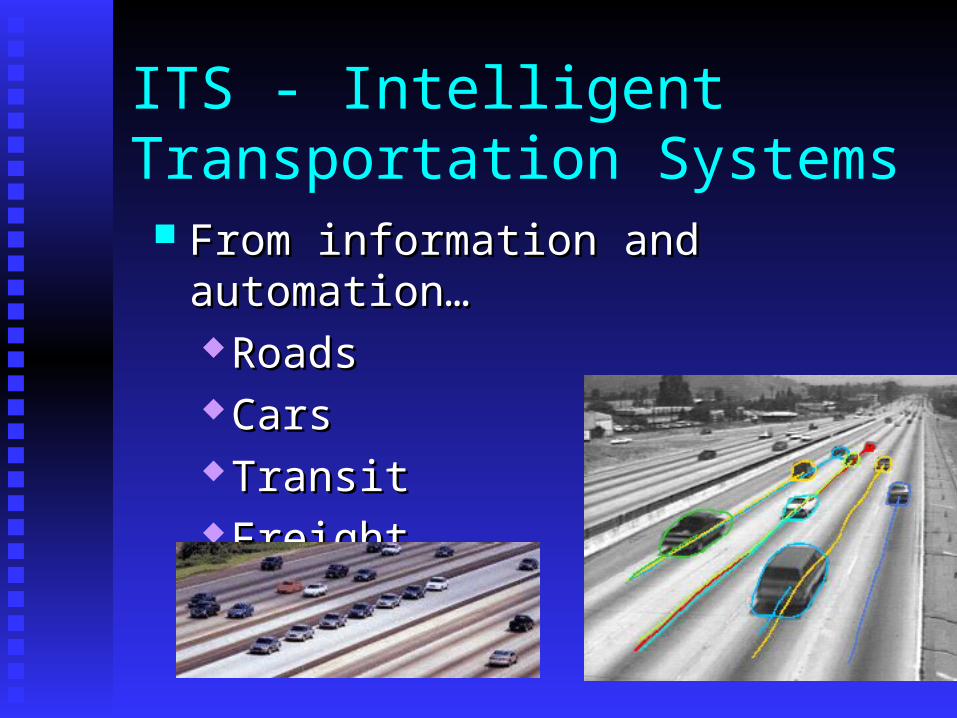
From information and automation…From information and automation… RoadsRoads CarsCars TransitTransit FreightFreight
Evidence on New Capacity
Recent studies on “induced travel”:Recent studies on “induced travel”: UC Berkeley study: 10% increase in capacity UC Berkeley study: 10% increase in capacity
leads to 9% increase in trafficleads to 9% increase in traffic Others: 10% increase in capacity leads to 4.7% Others: 10% increase in capacity leads to 4.7%
to 12.2% increase in trafficto 12.2% increase in traffic Noland and Cowart: capacity increases account Noland and Cowart: capacity increases account
for 15% of VMT growth annuallyfor 15% of VMT growth annually Induced travel offsets improvements in Induced travel offsets improvements in
congestion, air quality, and other impactscongestion, air quality, and other impacts
Evidence on ITS
TransGuide reduced accidents by 15% and TransGuide reduced accidents by 15% and emergency response time by 20% in San Antonio emergency response time by 20% in San Antonio (TxDOT)(TxDOT)
Advanced Traveler Information System led to Advanced Traveler Information System led to changes in route, departure time, confidence in changes in route, departure time, confidence in Seattle (Volpe)Seattle (Volpe)
Smart Ramp for HOVs and buses saved 8.5 - 19.2 Smart Ramp for HOVs and buses saved 8.5 - 19.2 minutes per week per user in Portland (Lall & minutes per week per user in Portland (Lall & Lucas)Lucas)
Long-term effects not yet clear...Long-term effects not yet clear...
Who supports this strategy?
Road building…Road building… Departments of Departments of
TransportationTransportation The “road lobby”The “road lobby” The majority of the The majority of the
public?public? Most of the politicians?Most of the politicians?
Who supports this strategy?
ITS… ITS… Technology believersTechnology believers Many of the leading transportation Many of the leading transportation
engineering researchersengineering researchers Industry, esp. defense-related industryIndustry, esp. defense-related industry Most of the politicians?Most of the politicians?
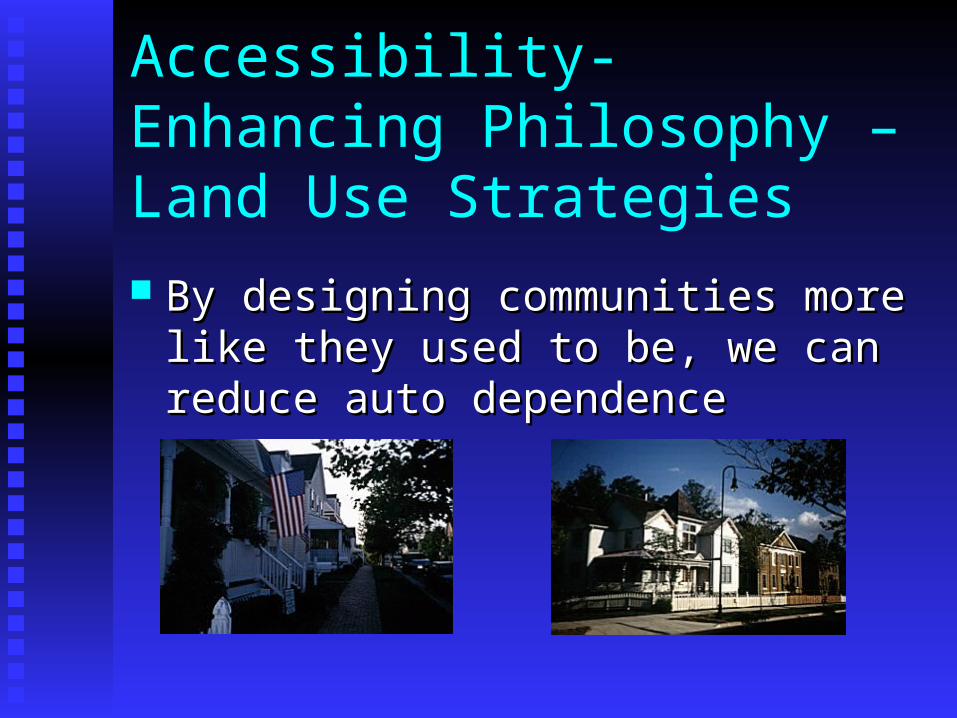
Accessibility-Enhancing Philosophy – Land Use Strategies
By designing communities more like they By designing communities more like they used to be, we can reduce auto dependenceused to be, we can reduce auto dependence
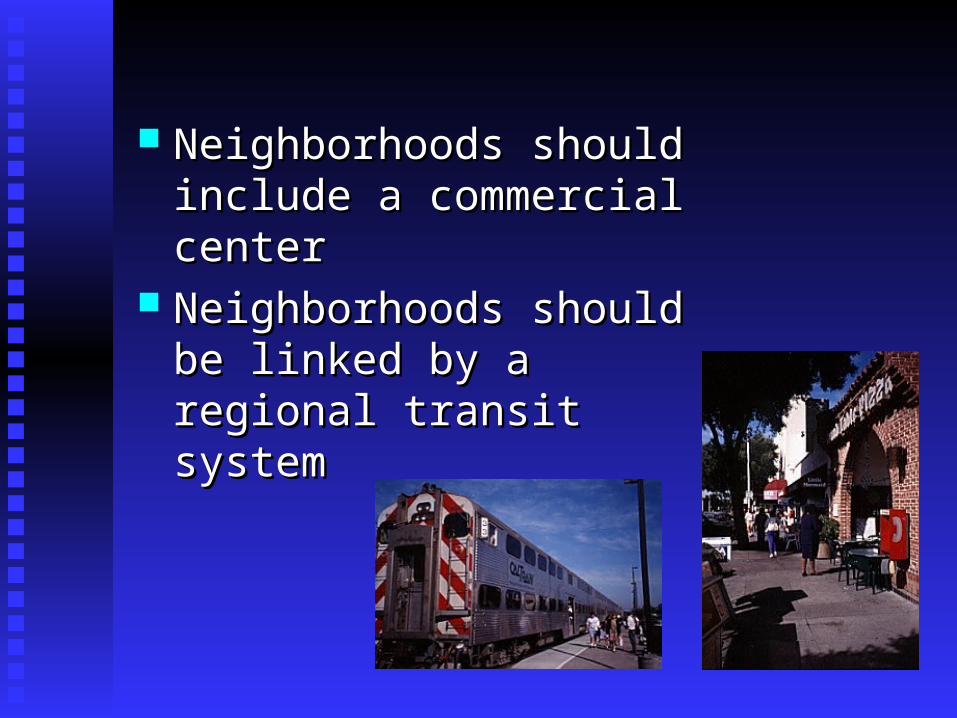
Neighborhoods should include Neighborhoods should include a commercial centera commercial center
Neighborhoods should be Neighborhoods should be linked by a regional transit linked by a regional transit system system
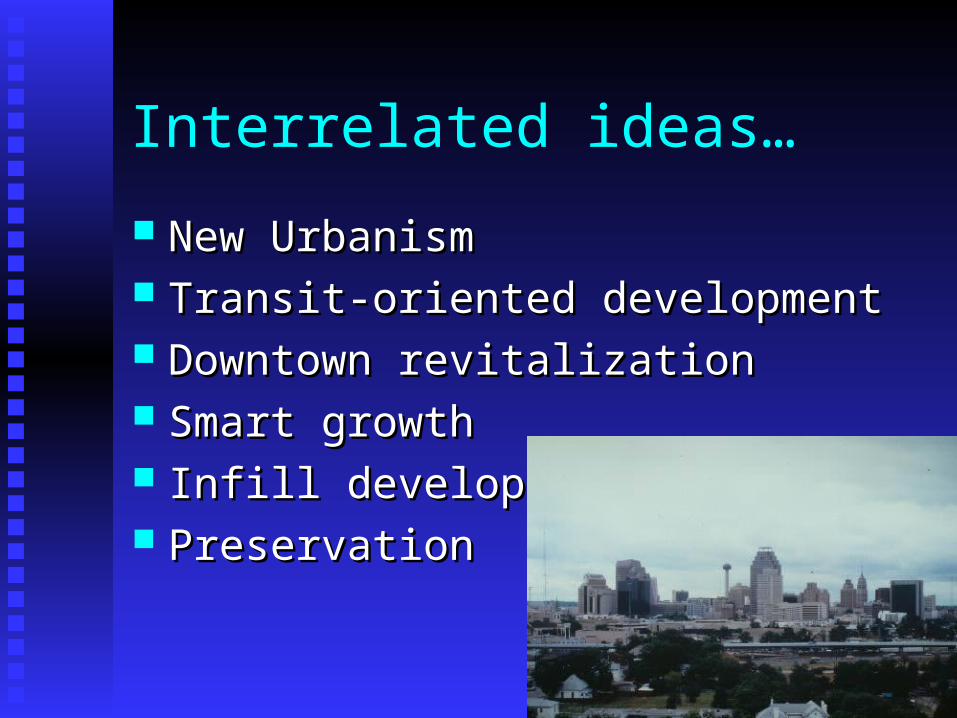
Interrelated ideas…
New UrbanismNew Urbanism Transit-oriented developmentTransit-oriented development Downtown revitalizationDowntown revitalization Smart growthSmart growth Infill developmentInfill development PreservationPreservation
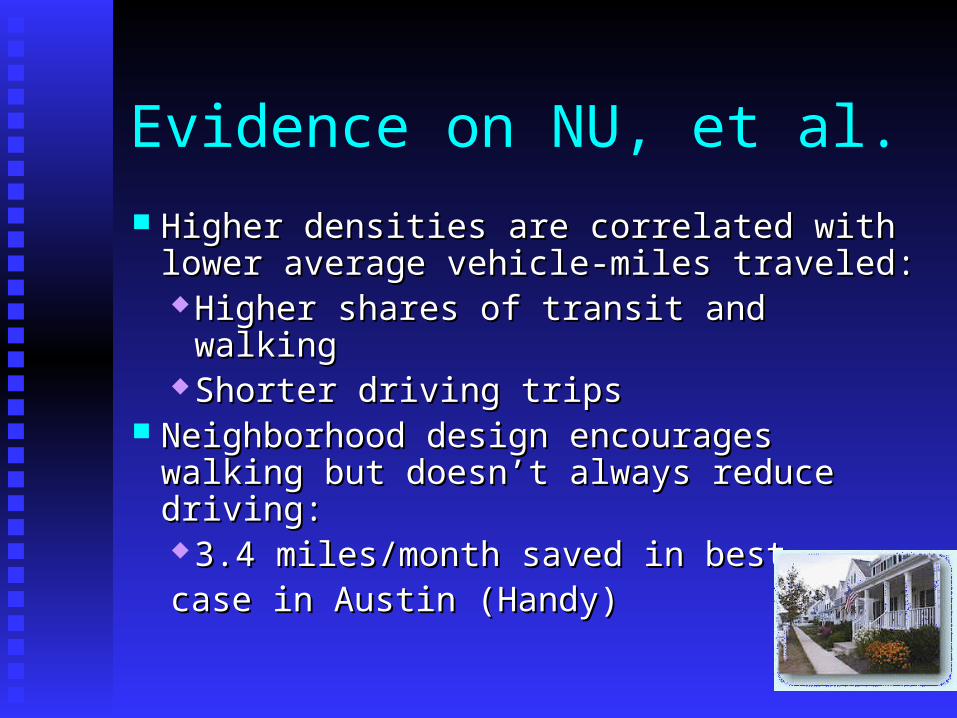
Evidence on NU, et al.
Higher densities are correlated with lower Higher densities are correlated with lower average vehicle-miles traveled:average vehicle-miles traveled: Higher shares of transit and walkingHigher shares of transit and walking Shorter driving tripsShorter driving trips
Neighborhood design encourages walking Neighborhood design encourages walking but doesn’t always reduce driving: but doesn’t always reduce driving: 3.4 miles/month saved in best 3.4 miles/month saved in best case in Austin (Handy)case in Austin (Handy)
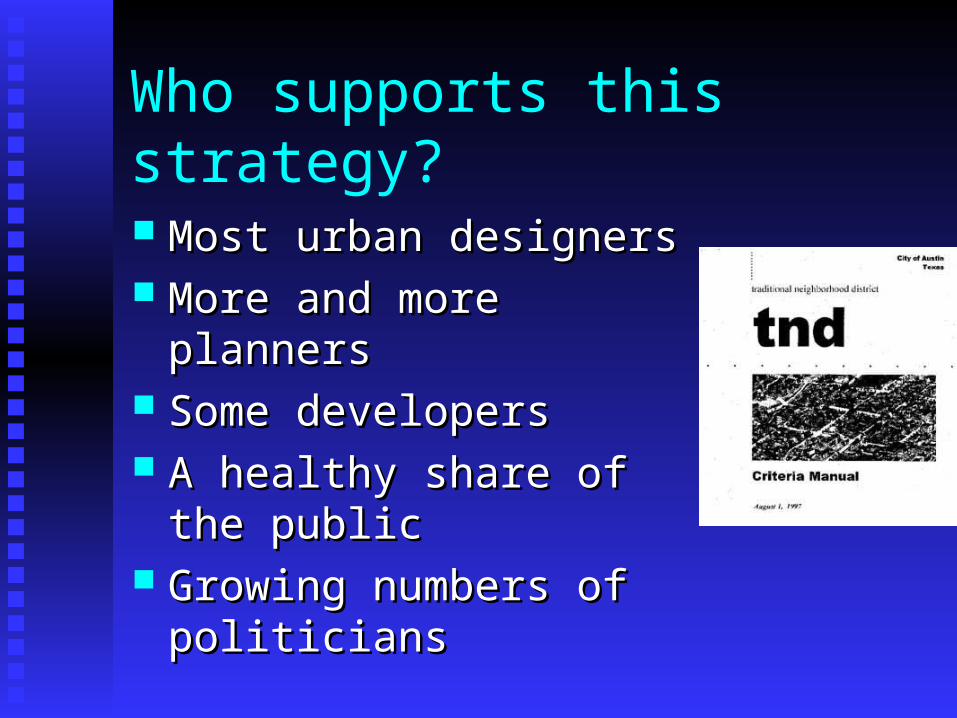
Who supports this strategy?
Most urban designersMost urban designers More and more plannersMore and more planners Some developersSome developers A healthy share of the publicA healthy share of the public Growing numbers of Growing numbers of
politicianspoliticians
Accessibility-Enhancing Philosophy – ICT Information and Communications Information and Communications
Technologies (ICT) provide accessibility Technologies (ICT) provide accessibility without the need for mobility:without the need for mobility: TelecommutingTelecommuting Tele-activitiesTele-activities ““E-commerce”E-commerce”
Evidence on ICT
Telecommuting reduces person-miles Telecommuting reduces person-miles traveled by 75% on telecommuting days but traveled by 75% on telecommuting days but ability and desire to telecommute is limited ability and desire to telecommute is limited (Mokhtarian, et al.)(Mokhtarian, et al.)
Aggregate impact of telecommuting on Aggregate impact of telecommuting on annual VMT is 0.8% or less (Choo, et al.)annual VMT is 0.8% or less (Choo, et al.)
Travel impacts of e-commerce not yet Travel impacts of e-commerce not yet clear…clear…
Who supports this strategy?
Some industry… mixed on telecommuting, Some industry… mixed on telecommuting, high on e-commercehigh on e-commerce
Most regional transportation plannersMost regional transportation planners A growing number of interest groups for the A growing number of interest groups for the
mobility impaired: rural areas, persons with mobility impaired: rural areas, persons with disabilitiesdisabilities
Everyone…?Everyone…?
Mobility-Limiting Philosophy
Drivers pay significantly less for their trips Drivers pay significantly less for their trips than they should:than they should: Out-of-pocket vs. total cost to individualOut-of-pocket vs. total cost to individual Individual vs. societal costsIndividual vs. societal costs
If drivers directly paid the full cost of their If drivers directly paid the full cost of their trip, they would choose to drive lesstrip, they would choose to drive less
Correct pricing leads to economically Correct pricing leads to economically efficient choicesefficient choices
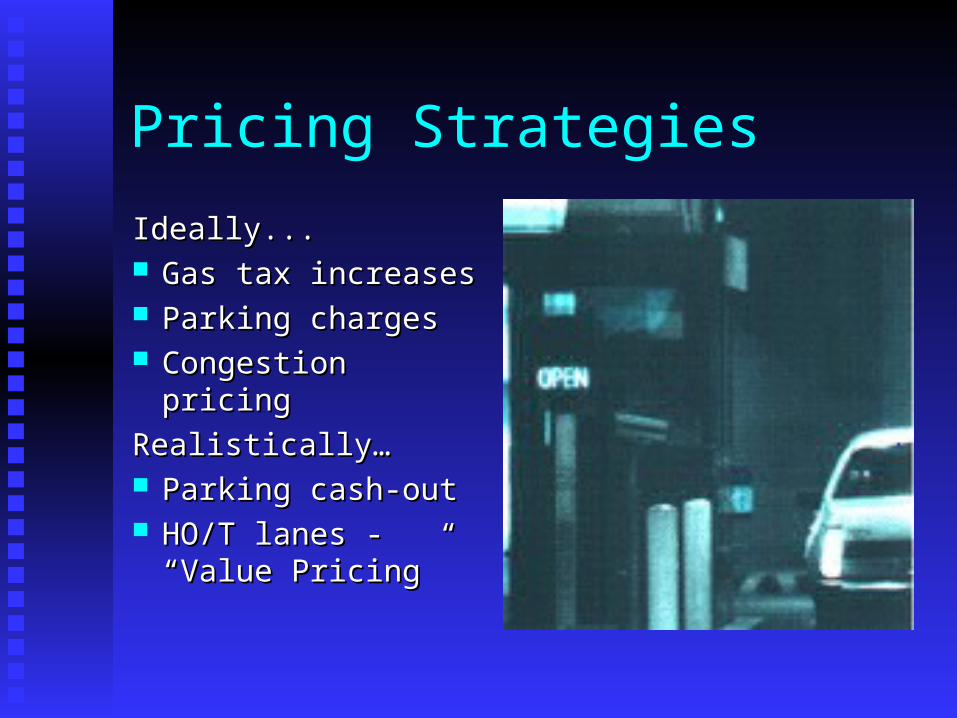
Pricing Strategies
Ideally...Ideally... Gas tax increasesGas tax increases Parking chargesParking charges Congestion pricingCongestion pricing
Realistically…Realistically… Parking cash-outParking cash-out HO/T lanes - “Value HO/T lanes - “Value
Pricing”Pricing”
Evidence on Pricing
Gas Price: 10% increase in price could mean 1% Gas Price: 10% increase in price could mean 1% decrease in driving (Schipper)decrease in driving (Schipper)
Parking Fees: 10% increase in fees could mean Parking Fees: 10% increase in fees could mean 1.6% decrease in driving (Shoup) 1.6% decrease in driving (Shoup)
Congestion Pricing: $0.20 per mile during peak Congestion Pricing: $0.20 per mile during peak could mean 6% decrease in driving (Litman)could mean 6% decrease in driving (Litman)
Parking Cash-Out Programs: Reduced vehicle Parking Cash-Out Programs: Reduced vehicle trips by up to 27% in LA (Wilson)trips by up to 27% in LA (Wilson)
HO/T Lanes: $2 bought 20 minute savings in HO/T Lanes: $2 bought 20 minute savings in Houston (TTI)Houston (TTI)
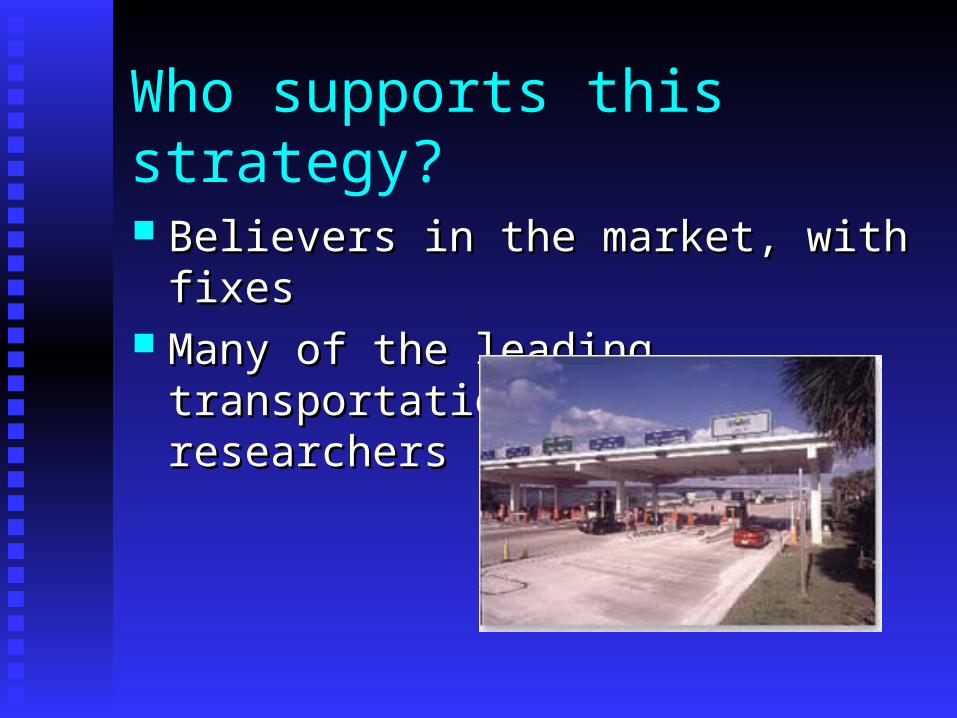
Who supports this strategy?
Believers in the market, with fixesBelievers in the market, with fixes Many of the leading transportation planning Many of the leading transportation planning
researchersresearchers

So to conclude…
Adopt accessibility-enhancing strategies to Adopt accessibility-enhancing strategies to provide choicesprovide choices
Adopt mobility-limiting strategies to Adopt mobility-limiting strategies to encourage choices that reduce VMTencourage choices that reduce VMT
The BIG question…
Just how much mobility can we rightly Just how much mobility can we rightly expect and demand?expect and demand?
The growing Response…
Don’t we have a right to the freedom not Don’t we have a right to the freedom not to drive, too?to drive, too?

![NEMO5 - Purdue University · NEMO5 [1] is intended to be ... • NEMO-1D [2] ... entered for a parameter, something that comes in handy when e.g. a temperature dependence](https://static.fdocuments.net/doc/165x107/5aefd2847f8b9aa9168d21ca/nemo5-purdue-university-1-is-intended-to-be-nemo-1d-2-entered.jpg)