Accepted Manuscript - rua.ua.esrua.ua.es/dspace/bitstream/10045/2643/4/accepted_manuscript.pdf ·...
35
Accepted Manuscript Title: The selective reduction of NO x with propene on Pt-beta catalyst: a transient study Authors: J.M. Garc´ ıa Cort´ es, M.J. Ill´ an G ´ omez, C. Salinas Mart´ ınez de Lecea PII: S0926-3373(07)00080-X DOI: doi:10.1016/j.apcatb.2007.03.004 Reference: APCATB 9936 To appear in: Applied Catalysis B: Environmental Received date: 13-11-2006 Revised date: 8-3-2007 Accepted date: 14-3-2007 Please cite this article as: J.M. Garc´ ıa Cort´ es, M.J. Ill´ an G´ omez, C. Salinas Mart´ ınez de Lecea, The selective reduction of NO x with propene on Pt-beta catalyst: a transient study, Applied Catalysis B, Environmental (2007), doi:10.1016/j.apcatb.2007.03.004 This is a PDF file of an unedited manuscript that has been accepted for publication. As a service to our customers we are providing this early version of the manuscript. The manuscript will undergo copyediting, typesetting, and review of the resulting proof before it is published in its final form. Please note that during the production process errors may be discovered which could affect the content, and all legal disclaimers that apply to the journal pertain.
Transcript of Accepted Manuscript - rua.ua.esrua.ua.es/dspace/bitstream/10045/2643/4/accepted_manuscript.pdf ·...

Accepted Manuscript
Title: The selective reduction of NOx with propene on Pt-betacatalyst: a transient study
Authors: J.M. Garcıa Cortes, M.J. Illan Gomez, C. SalinasMartınez de Lecea
PII: S0926-3373(07)00080-XDOI: doi:10.1016/j.apcatb.2007.03.004Reference: APCATB 9936
To appear in: Applied Catalysis B: Environmental
Received date: 13-11-2006Revised date: 8-3-2007Accepted date: 14-3-2007
Please cite this article as: J.M. Garcıa Cortes, M.J. Illan Gomez, C. Salinas Martınezde Lecea, The selective reduction of NOx with propene on Pt-beta catalyst: a transientstudy, Applied Catalysis B, Environmental (2007), doi:10.1016/j.apcatb.2007.03.004
This is a PDF file of an unedited manuscript that has been accepted for publication.As a service to our customers we are providing this early version of the manuscript.The manuscript will undergo copyediting, typesetting, and review of the resulting proofbefore it is published in its final form. Please note that during the production processerrors may be discovered which could affect the content, and all legal disclaimers thatapply to the journal pertain.

Acce
pted
Man
uscr
ipt
1
The selective reduction of NOx with propene on Pt-beta catalyst: a transient study
J. M. García Cortés, M.J. Illán Gómez and C. Salinas Martínez de Lecea* Department of Inorganic Chemistry, University of Alicante, P.O. Box 99, E-03080
Alicante, Spain
* Corresponding author.
Phone: +34 96 5903976
Fax: +34 96 5903454
E-mail: [email protected]
* Revised Manuscript
Page 1 of 34

Acce
pted
Man
uscr
ipt
2
Abstract
The mechanism of the NO/C3H6/O2 reaction has been studied on a Pt-
beta catalyst using transient analysis techniques. This work has been designed to
provide answers to the volcano-type activity behaviour of the catalytic system, for that
reason, steady state transient switch (C3H6/NO/O2 → C3H6/Ar/O2, C3H6/Ar/O2 →
C3H6/NO/O2; C3H6/NO/O2 → Ar/NO/O2, Ar/NO/O2 → C3H6/NO/O2; C3H6/NO/O2 →
C3H6/NO/Ar and C3H6/NO/Ar → C3H6/NO/O2) and Thermal Programmed Desorption
(TPD) experiments were conducted below and above the temperature of the maximum
activity (Tmax). Below Tmax, at 200ºC, a high proportion of adsorbed hydrocarbon exists
on the catalyst surface. There exists a direct competition between NO and O2 for Pt
free sites which is very much in favour of NO, and therefore NO reduction selectively
takes place over hydrocarbon combustion. NO and C3H6 are involved in the generation
of partially oxidised hydrocarbon species. O2 is essential for the oxidation of these
intermediates closing the catalytic cycle. NO2 is not observed in the gas phase. Above
Tmax, at 230ºC, C3H6ads coverage is negligible and the surface is mainly covered by Oads
produced by the dissociative adsorption of O2. NO2 is observed in gas phase and
carbon deposits are formed at the catalyst surface. From these results, the state of Pt-
beta catalyst at Tmax is inferred. The reaction proceeds through the formation of partially
oxidised active intermediates (CxHyOzNw) from C3H6ads and NOads. The combustion of
the intermediates with O2(g) frees the Pt active sites so the reaction can continue.
Temperature has a positive effect on the surface reaction producing active
intermediates. On the contrary, formation of NOads and C3H6·ads are not favoured by an
increase in temperature. Temperature has also a positive effect on the dissociation of
O2 to form Oads, consequently, the formation of NO2 is favoured by temperature through
the oxygen dissociation. NO2 is very reactive and produces the propene combustion
without NO reduction. These facts will determine the maximum concentration of active
intermediates and consequently the maximum of activity.
Key words: NOx-SCR mechanism, propene, Pt-beta catalyst, transient experiments.
Page 2 of 34

Acce
pted
Man
uscr
ipt
3
1. Introduction
Numerous papers deal with the study of the mechanism of NOx reduction by
hydrocarbon in the presence of excess oxygen on platinum based catalysts. However
there is no evidence that allows defining a single reaction path. Pt/Al2O3 and Pt/SiO2
catalysts have been the most studied catalytic systems and therefore, those about
which more is known. One of the conclusions arising from a detailed study of the
literature is the different reaction paths for different hydrocarbons, as it appears when
comparing propane and propene [1]. The Pt oxidation state is a key issue in
determining the reaction mechanism and this seems to be related to the different
nature of the hydrocarbon-metal bond [2-4]. Much less attention has been paid to the
study of the reaction mechanism over Pt-zeolite based catalysts [5], although the effect
of the hydrocarbon seems to be similar as in non-zeolitic systems. In order to study the
reaction mechanism over Pt-zeolite catalysts a single hydrocarbon must be selected
and propene has been considered to be the model hydrocarbon for this reaction.
In the literature, two types of reaction mechanisms have been proposed:
i) Reaction intermediates from partial hydrocarbon oxidation
This mechanism is based on the active role of certain species derived from the
partial oxidation of the hydrocarbon. Several authors claim that some deposits
appearing on the catalyst during the NO/C3H6/O2 reaction play an important role in the
reaction, because they are the source of very reactive radical species able to take part
as reaction intermediates in some reaction steps [6,7]. Pt phase might catalyze the
formation of these carbonaceous deposits either by cracking or partial oxidation of the
hydrocarbon, thus, generating a large amount of allyl groups [8,9], carbenium ions [10],
groups such as –CN and –NCO [11-17]etc., that will then react with oxidizing species
(NO, NO2, O2) yielding the reaction products (N2, N2O, CO2).
Others authors [12,18-24] propose a path based on the formation of NO2 which
reacts with propene to form different reaction intermediates. Most of them consider
these intermediates to be organo-nitro and organo-nitrite species, although others [23]
propose other partially oxidized intermediates such as γ-hydroxynitropropane.
Recently, Duprez et al [25] investigate the reactivity of several compounds with
different organic functions with the aim to explore their potential role as intermediates in
the NO reduction. They come to the conclusion that oxime species should play a key
role in the NOx reduction by alkenes at temperatures below 250 ºC. Oximes are
tautomeric forms of nitroso compounds. An interesting point of this study is the
explanation of N2O and N2 formation through the Nef and Beckmann reactions,
Page 3 of 34

Acce
pted
Man
uscr
ipt
4
respectively. The oxime route was previously proposed by Garin and co-workers [26-
28].
ii) Catalytic decomposition of NO and regeneration (reduction) of the active sites by
hydrocarbon.
This is basically a redox mechanism in which, after dissociative chemisorption
of NO and desorption of N2 and/or N2O, the hydrocarbon reacts with adsorbed oxygen
(Oads) on the catalyst. This mechanism, initially proposed by the group of Iwamoto [29],
has been deeply investigated by Burch s group [1, 30-33], and several authors support
it as no evident proof has been found to support the other proposed mechanisms
[17,34].
Finally, the possibility of a mixed reaction mechanism, in which some steps of
the previous described mechanism take place, cannot be ruled out. In fact, Burch, in
one of his most recent papers [1], indirectly recognizes that the presence of certain
intermediates coming from the activation of the hydrocarbon can fit into the mechanism
proposed by his group.
Considering the controversial situation described, this work deals with the study
of the NO/C3H6/O2 reaction over Pt-zeolite based catalysts with the objective of finding
evidence of the reaction steps involved. For that, a Pt-beta sample, whose catalytic
behavior has been thoroughly investigated [35], has been selected. Non-isotopic
transient analysis techniques have been used as experimental methodology, as these
techniques have been proved to be a valuable source of information in the study of
Pt/Al2O3 and Pt/SiO2 systems [36]. The experiments have been designed to provide
answers to the volcano-type activity behaviour of the catalytic system.
2. Experimental.
A Pt-beta catalyst (Pt-beta(r-0.5)) has been selected to study the reaction
mechanism of the NO/C3H6/O2 reaction by means of transient analysis techniques.
Details on the preparation and characterization of this catalyst can be found elsewhere
[35]. As a summary, this catalyst has been prepared by aqueous ion-exchange of beta-
zeolite with a 3·10-4 M aqueous solution of the metal precursor ([Pt(NH3)4](NO3)2). After
successive ion-exchange experiments (20ºC during 18 hours) a catalyst with a 1 wt. %
metal content is obtained. The exchanged zeolite is filtered, washed with de-ionized
water and dried at 110ºC for 12 hours. Finally, it is calcined at 400 ºC during 2 hours
and reduced at 350ºC in pure H2 atmosphere during 8 hours, using a heating rate of
0.5ºCmin-1.
Page 4 of 34

Acce
pted
Man
uscr
ipt
5
Figure 1 shows the scheme of the experimental device used in the kinetic
analysis experiments. The gas control panel consists of six mass flow controllers (d)
(0.1 ml/min sensitivity). A four-way electro valve (c) allows automatically switching two
of the gas streams. To avoid altering the total pressure of the system, a high precision
regulation valve (m) has been introduced in the system. The pressure of the gas
streams is controlled by means of two high-sensitivity pressure transducers (j) (0-0.6
mbar). The outlet of the gas control panel is connected to the reaction system, which
consists of a tubular quartz reactor (∅ =5 mm) (e) and a horizontal furnace (f).
Temperature is controlled with a sensitivity of 0.1ºC/min (h) and monitored by two
thermocouples (g). The outlet of the reactor is connected to the gas analysis system, a
mass spectrometer (Pfeiffer OmniStar, sensitivity 0.1 s) (n).
By using this experimental device, two different sets of experiments have been
carried out:
i) Steady State transient switch: The relaxation of the system is analysed when
it is subjected to some selected switches in which a reagent is suddenly eliminated
from the system and an inert gas (Ar) replaces it, avoiding changes in temperature and
pressure. The inverse switch, i.e. reintroducing the reagent, is also a valuable source of
information. Thus, C3H6/NO/O2 → C3H6/Ar/O2, C3H6/Ar/O2 → C3H6/NO/O2; C3H6/NO/O2
→ Ar/NO/O2, Ar/NO/O2 → C3H6/NO/O2; C3H6/NO/O2 → C3H6/NO/Ar and C3H6/NO/Ar →
C3H6/NO/O2 switches have been carried out and analysed. In order to develop a
mechanistic study by means of this technique, it has to be kept in mind that the
conversion levels must be kept lower than 25%, in order to ensure differential reaction
conditions [37]. Therefore, these experiments were not carried out at the temperature
of the maximum of activity (Tmax) but at lower temperatures, usually 20ºC lower. The
kinetic study at temperatures higher than that corresponding to the maximum activity,
even though not yielding precise information about reaction mechanism (hydrocarbon
conversion is always 100%) can be of interest to know more about the state of the
catalyst under those conditions.
All experiments were carried out at atmospheric pressure with a total flow of
150 ml STP/min and 0.13 g of catalyst (space velocity=50000 h-1). The reaction stream
contains 2262 ppm NO, 3400 ppm C3H6 and 5% O2 in He. The inert gas stream is 1%
Ar in He. Data corresponding to the switching experiments have been mathematically
normalised between 0 and 1, in order to make the analysis easier, using the following
equations:
(a) Species that increase its concentration: ssi,ssf,
ssi,xx CC
CCRn
−−
=
Page 5 of 34

Acce
pted
Man
uscr
ipt
6
(b) Species that decrease its concentration: ssf,ssi,
ssf,x'x CC
CCRn
−−
=
where: Rnx y Rn’x: normalizad response of “X”, Cx: absolute concentration of ‘x’,
Ci,ss: initial concentration in the steady state, Cf,ss: final concentration in the steady
state.
ii) Thermal Programmed Desorption (TPD): After reaction, the sample is treated with an
inert gas flow (100 ml STP He/min) while the temperature is gradually increased at a
constant rate (5ºC/min). The evolution of different gases, followed by mass
spectrometry, allows obtaining information about the nature and stability of the species
present on the catalyst surface.
3. Results
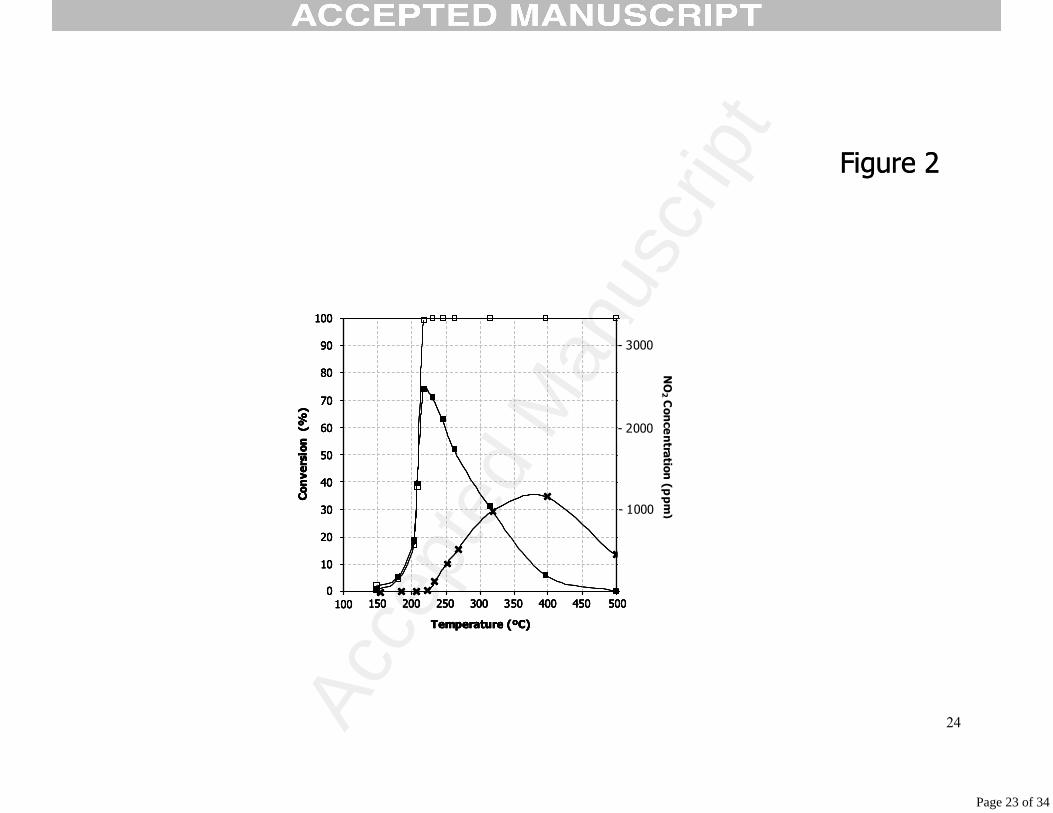
Figure 2 shows the NOx and C3H6 conversion profiles as a function of
temperature as well as the NO2 evolution profile for the Pt-beta catalyst obtained in the
experimental system described in reference [35] but in the same experimental
conditions used in the mechanistic study discussed in this paper. The NOx conversion
curve presents the typical trend observed for Pt catalysts [35], a well defined maximum
of activity at the same temperature where the maximum hydrocarbon conversion is
achieved. The N2 selectivity between 175 to 350 ºC has a constant value of 35%. At
higher temperatures, NO2 evolution is observed but its concentration change with
temperature due to kinetics and thermodynamic limitations. The maximum NOx
conversion level achieved by this catalyst is slightly lower than the previously observed
[35] due to the experimental conditions used in this study (higher space velocity).
The temperatures for the switch experiments have been selected according with
the results shown in Figure 2. Considering that the maximum activity is achieved at
220ºC (Tmax), 200ºC and 230ºC have been used to carry out the experiments below
and above Tmax.
3.1 Transient analysis experiments below Tmax (200ºC) The transient analysis experiments were conducted after the C3H6/NO/O2
reaction steady state conditions were reached at 200 ºC. Under these conditions, the
NO and C3H6 conversions were 19 and 17 %, respectively.
3.1.1. C3H6/NO/O2↔C3H6/Ar/O2 switch.
Page 6 of 34

Acce
pted
Man
uscr
ipt
7
Figure 3 shows normalised response of the Pt-beta catalyst when NO is
replaced by Ar at 200ºC. It can be observed that normalised NO profile is the same as
downstep Ar response (Ar-1 from now) profile, indicating that reversible adsorbed NO
on the Pt surface is practically zero at the studied reaction temperature.
Propene also shows the same profile although it is delayed compared to Ar-1. It
is worth noting that hydrocarbon is only partially consumed at 200ºC (see Figure 2), so
when the switch takes place, the decrease of propene concentration is due to its
combustion by oxygen present in the reaction system. This behaviour reveals that,
under usual reaction conditions and, even though the large excess of oxygen
(O2/C3H6>30), the combustion of propene is disfavoured. To explain this result, the
hypothesis of Xin et al [38] suggesting a direct competition between NO and O2 for Pt
surface sites has been used. This competition is in favour of NO at temperatures below
the temperature of Tmax. Also, Garin [28] support this hypothesis which is in accordance
with the fact that, at low temperature, the sticking coefficient of NO (σNO) is higher than
the oxygen one (σo2) [39,40] and, when temperature increases, σNO decreases and σO2
increases. The delay in the propene profile indicates that there are enough NOads
species on the catalyst surface to ensure that the NO reduction reaction continues, for
a few seconds, even in the absence of NO in the gas phase. When this NO is reduced
(by propene), the adsorption free sites formed, can now be occupied by oxygen that
will dissociate generating Oads species in a slow process. This sequence of events is in
agreement with the mechanism proposed by Burch et al. [2], in which an “induction
time” for hydrocarbon combustion, related to a slow dissociative adsorption of O2
and/or its slow reaction with adsorbed hydrocarbon, is proposed.
The O2 profile also presents a delay with respect to Ar-1. This delay is
approximately of the same magnitude as that observed for propene, confirming that
oxygen is replacing NO on adsorption sites. The oxygen signal shows a minimum. This
is an indication of an extra demand of oxygen with respect to steady state. This
additional demand is due to the fact that not only the hydrocarbon from the reaction
stream is being consumed, but also the hydrocarbon adsorbed on the catalyst surface.
The amount of adsorbed hydrocarbon must be high, as can be deduced from the O2
signal response. The excess of CO2 shown in Figure 3 coincides, in time, with the
minimum in the oxygen signal, supporting the hypothesis of a rich hydrocarbon surface.
Burch et al. [36], using Pt/Al2O3 and Pt/SiO2 catalysts, observed at temperatures below
the maximum of activity, and independent of the support used, that the catalyst surface
is mainly covered by hydrocarbon derived species.
As a summary, the study of the relaxation of the NO/C3H6/O2 system during a
C3H6/NO/O2 → C3H6/Ar/O2 switch, allows inferring that at 200ºC, a high proportion of
Page 7 of 34

Acce
pted
Man
uscr
ipt
8
adsorbed hydrocarbon exists on the catalyst surface. This situation arises as a
consequence of preferential adsorption of NO over O2 on Pt active sites, thus inhibiting
hydrocarbon combustion. All these facts explain why hydrocarbon is consumed by the
reduction of NO, as expected for a highly selective system, and not by its reaction with
oxygen.
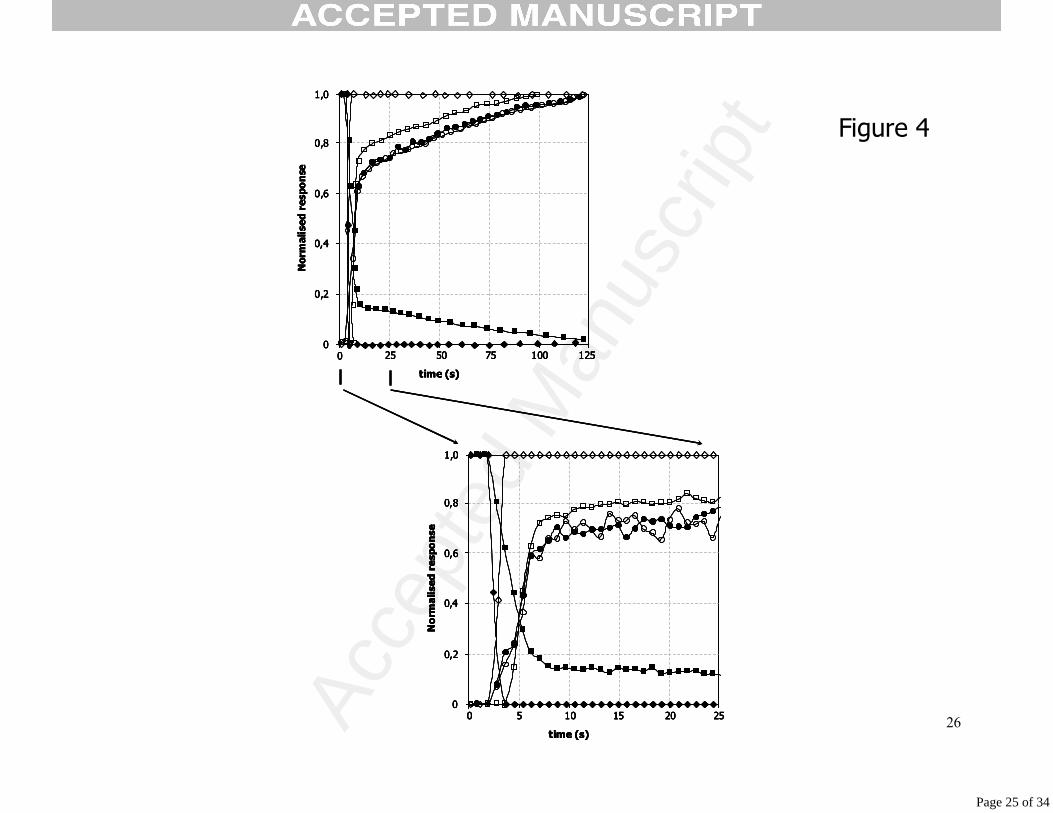
Figure 4 shows the results of the inverse switch (C3H6/Ar/O2→C3H6/NO/O2) at
200ºC for the same catalyst. When steady state is reached, NO reduction is again the
preferential reaction. The recovery of the initial situation necessarily implies that NO
adsorption on Pt is preferential over O2 adsorption on Pt. NO and O2 profiles are
practically identical confirming their relationship: NO adsorbs on sites left free by
oxygen (Oads) when are consumed by combustion of adsorbed hydrocarbon species.
It is important to point out that recovering the initial state the system follows two
different kinetics (see Figure 4 inset). All reactants and products present a profile with
two clearly different slopes. Initially, NO reduction is fast recovered but it slows down 5
seconds after the switch. The system goes back to the initial levels of conversion. This
seems to indicate that two different types of Pt sites are present on the catalyst. This
could be related to the fact that two different Pt particle sizes may exist in the sample.
Considering that the energy of the bond Pt-Oads in small Pt clusters is greater than in
large Pt clusters [38], reduction of Oads species during hydrocarbon combustion must
be more favourable in large Pt particles. In this sense, TEM results reveal that two
different Pt particle sizes are present on Pt-beta catalysts. The main fraction is ca. 2nm
although larger particles are also found (ca. 50 nm) [35]. Thus, when NO is
reintroduced in the system, the first fast kinetics stage would correspond to the
formation of NOads species in large Pt particles, where Oads species are easily reduced.
The second stage, clearly being a slower process, would also correspond to formation
of NOads but in more abundant small Pt particles, where Oads is strongly bound to the Pt
surface. These observations are in direct relation with the structure sensitivity character
of the Pt-catalysed NO/C3H6/O2 reaction demonstrated elsewhere [35]. However the
existence of different sites on the Pt particles (surface heterogeneity) can not be
rejected.
In Figure 4, it is apparent that CO2 signal decreases immediately after the switch
as a consequence of the partial inhibition of hydrocarbon combustion, indicating that
Oads reduction in large Pt particles is a fast process. The propene profile shows a delay
of 2 seconds evidencing a fast covering of the catalyst surface with C3H6 species
(These species cover the surface of the catalyst during NO reduction as previously
discussed in the C3H6/NO/O2 → C3H6/Ar/O2 switch at 200ºC).
Page 8 of 34

Acce
pted
Man
uscr
ipt
9
Finally, it is of interest to note that, in the C3H6/Ar/O2 → C3H6/NO/O2 switch,
no NO2 is released to the gas phase when NO is introduced to the system, even
though the Pt surface is mainly covered by Oads species. The NO2ads could exist in the
surface of Pt particles but it is not release to the gas phase up to higher temperatures
as it will be shown later. This idea is confirmed by a very recent publication [41].
3.1.2. Ar/NO/O2↔C3H6/NO/O2 switch.
Figure 5 shows the response of the system to the elimination of reductant at
200ºC. C3H6 profile is the same as the Ar-1 profile, showing that the surface coverage of
C3H6 reversibly chemisorbed species is practically zero. In the absence of C3H6, the
only reactive species are NO and O2, therefore formation of NO2 should be favoured,
however no NO2 in the gas phase is detected. The fact that the oxygen concentration
does not vary during the switch (not shown in Figure 5) is also in accordance with this.
The NO signal shows a delay of several seconds with respect to Ar-1, showing that NO
reduction continues during this period of time even in the absence of the hydrocarbon.
The C3H6/NO/O2 → C3H6/Ar/O2 switch discussed above has provided enough evidence
of the existence of a hydrocarbon rich surface at 200ºC, and this may account for the
fact that NO reduction continues when propene is not present in the gas phase. The
vacant sites formed when C3H6ads species react, are now being occupied by NOads
accounting for the extra time that NO needs to reach the steady state.
The existence of C3H6ads species on the catalyst surface is also supported by
the CO2 profile (combustion product), which shows two different combustion kinetics.
When C3H6 is eliminated, a rapid consumption of hydrocarbon becomes favoured as
indicated by the CO2 signal profile, which starts to rise immediately after the switch,
reaches a maximum and decreases slowly to zero (not shown in Figure 5). During the
fast combustion stage, C3H6 species located on (or close to) the active phase is
involved. In addition, hydrocarbon species located on the support must exist. These
species have to migrate towards the active phase to reach Pt sites or spillover of
adsorbed NO from Pt to the support, should occur giving rise to a slower combustion
process. These processes are unlikely to occur during steady state reaction conditions
as propene is continuously fed into the system. Related to this, it is apparent from
Figure 5 that NO and CO2 signals take different time to reach the new steady state,
indicating that under reaction conditions, not all propene present on the catalyst
surface (Pt+zeolite) is involved in the reduction of NO, being the active species those
located on the active phase and not on the support.
Page 9 of 34

Acce
pted
Man
uscr
ipt
10
Elimination of C3H6 leaves the surface in an oxidised state. Figure 6 shows the
normalised profiles of the most important species during the Ar/NO/O2 → C3H6/NO/O2
switch performed on the Pt-beta catalyst at 200ºC. The CO2 signal rises immediately
after the introduction of propene to the system. This can only be justified if the surface
was covered with Oads (created by dissociation of NOads in the absence of C3H6ads).
According to Burch et al. [2], the reaction between propene in the gas phase and
adsorbed oxygen is a fast process. This sequence also explains the delay shown in the
propene signal.
The NO profile is reverse to that of CO2. To understand the relationship
between these two species, it must be considered that when hydrocarbon is
reintroduced into the system, it reacts with Oads species, liberating a large amount of Pt
sites which are immediately occupied by NO until the steady state, where NO reduction
recovers its initial values, is achieved. The oxygen level (not shown in the figure)
remains constant during the switch. These results evidence, again, the direct
competition between NO and O2 for Pt free sites. At temperatures lower than Tmax, this
competition is very much in favour of NO, and therefore NO reduction selectively takes
place over hydrocarbon combustion.
3.1.3. C3H6/NO/O2↔ C3H6/NO/Ar switch.
Figure 7 shows the response of the system to a C3H6/NO/O2→ C3H6/NO/Ar
switch. The O2 profile indicates that oxygen is also irreversibly adsorbed on the catalyst
surface or simply that it is not adsorbed at all. When oxygen is eliminated from the
system, CO2 evolution ceases immediately, indicating that O2 is essential for the
reaction to occur and that Oads coverage at this temperature is very low, as the reaction
does not continue in the absence of this gas. This agrees with recent results of Duprez
and co-workers [25].
The fact that propene and NO profiles are identical indicates that the catalyst
surface accepts both species proportionally up to 150 seconds after the switch, when
saturation of the surface occurs. After the switch, both molecules are adsorbing on the
catalyst to the same extent as they did under usual reaction conditions, although
slower kinetics of adsorption are observed. Considering these facts, it can be assumed
that NO and C3H6 are involved in the generation of partially oxidised hydrocarbon
species through a slow reaction. This species may have an important role on the
reaction, as has been put forward by other authors [6,7, 25-28]
From these results, it could be concluded that adsorption of hydrocarbon on Pt
is followed by a reaction in which NOads and C3H6ads would participate to form partially
oxidized hydrocarbon species. In these conditions, the surface is covered by these
Page 10 of 34

Acce
pted
Man
uscr
ipt
11
species that need the action of oxygen gas to react completely to CO2 and liberate Pt
free sites for the reaction to continue. When O2 is not present in the system, the
surface of the catalyst is covered by partially oxidised hydrocarbon species producing
catalyst deactivation.
Figure 8 shows the response of the system when O2 is reintroduced at 200ºC.
This switch also needs longer times to reach steady state. Right before the switch, the
surface is covered by NOads, C3H6 ads and oxidised hydrocarbon species as will be
shown later. The CO2 profile rises immediately after the switch. As O2 adsorption is a
slow process at this temperature [2], the fast CO2 evolution must be the result of the
reaction between gas phase oxygen and partially oxidised hydrocarbon species in a
fast reaction.
NO and C3H6 profiles are again identical as they adsorb in the same proportion
to produce new partially oxidised hydrocarbon species.
The O2 profile presents a maximum right after the switch is performed. The
overshoot means that there is a very short period of time where oxygen cannot
chemisorb or react, and then this situation changes towards an oxygen consumption
that establishes the new steady-state.
3.1.4. Temperature Programmed Desorption of Pt-beta catalyst after reaction at 200ºC.
Figure 9 shows the evolution of different compounds from the catalyst surface
after 10 hours under NO/C3H6/O2 reaction conditions at 200ºC. First of all, a very
important propene evolution can be observed starting at 230ºC and reaching a
maximum at 325ºC. TPD experiments after adsorption of C3H6 on zeolite beta give
similar propene peak. It is believed that these hydrocarbons molecules exists in the
catalyst support, as previously mentioned, but probably are not involved in the NO
reduction reaction.
The absence of NO in Figure 9 indicates the irreversible adsorption of these
species under reaction conditions at 200ºC. This supports the hypothesis of NOads
species react with C3H6 ads species to form partially oxidised hydrocarbon species. The
absence of O2 in Figure 9 indicates that Oads species does not combine to form O2.
CO2, N2, and N2O are desorbed from the surface in a much lower concentration
than propene and the evolution of these gases may be the result of decomposition of
partially oxidised hydrocarbon species. In this line, Praserthdam et al. [24] have
investigated the formation of these intermediates on Pt/Al2O3 catalysts finding TPD
profiles similar to those shown in Figure 9, except that the C3H6 peak is not present in
their experiments due to the low propene adsorption capacity of the Al2O3 support.
Praserthdam et al. suggest that CxHyOzNw and CxHyOz intermediates may be present
Page 11 of 34

Acce
pted
Man
uscr
ipt
12
on the catalyst surface. This study gives no evidences of two types of intermediates
and, it is proposed CxHyOzNw as a general formula.
TPD experiments after reaction at 200ºC seem to agree with the hypothesis of a
step in which adsorbed hydrocarbon reacts with adsorbed NO to form CxHyOzNw during
the reaction of NO with propene under oxidising conditions.
3.2. Transient analysis experiments above Tmax (230ºC) The transient analysis experiments were conducted after the reaction steady
state conditions were reached at 230 ºC. As was previously stated, in order to perform
a non-isotopic switch study, the system must be under differential reaction conditions.
In the NO/C3H6/O2 reaction at temperatures higher that Tmax, these conditions are not
fulfilled, the hydrocarbon conversion is always 100% making these type of studies as
well as the interpretation of the results very difficult. However, it is possible to extract
valid information on how the catalyst behaves under these circumstances. To make
discussion simpler, only those experiments which have provided relevant information
will be presented here.
3.2.1 C3H6/NO/O2↔C3H6/Ar/O2 switch. Figure 10 shows the most relevant profiles of reactants and products during the
relaxation of the Pt/beta system, after NO is eliminated from the feed at 230ºC. Three
main differences are observed when comparing with the situation at 200ºC (Figure 3).
First of all, there is not propene profile. At 230ºC and before the switch,
hydrocarbon conversion is 100% and, the NOx conversion is 65%. According to this,
C3H6ads coverage must be very low. After C3H6/NO/O2 → C3H6/Ar/O2 switch,
hydrocarbon conversion is also 100% indicating that the fraction of hydrocarbon that
participates in the reduction of NO before the switch is immediately burnt with oxygen
after the switch, suggesting that at this temperature the Oads coverage is much higher
than at 200 ºC, as a consequence of the low coverage of C3H6 ads species and the
favoured dissociation of oxygen by the temperature increase, even in the presence of
NO.
Secondly, the NO profile decays slowly after the switch. This behaviour is an
indication that certain equilibrium between NO in the gas phase and adsorbed NO is
being established. Since an increase in temperature would be unfavourable for the NO
adsorption, the process should occur through the formation of different species as will
be described follow on.
The third difference is in the oxygen profile, there is a minimum that occurs at
the same time as the maximum of the CO2 profile. The evolution of CO2 starts
Page 12 of 34

Acce
pted
Man
uscr
ipt
13
immediately after the NO switch. It seems than some species at the surface are burnt
more easily in the absence of NO. However, the O2 signal shows a progressive
increase until it reaches the final level, corresponding to the fraction used to burn the
hydrocarbon in reaction conditions. During the reaction, there must exist another
process of oxygen consumption that ceases when NO is eliminated. The only possible
explanation is that during the reaction at 230ºC, some NO is being oxidised to NO2; in
fact Figure 2 shows that NO2 evolution occurs after the maximum of activity, confirming
this hypothesis. The existence of NO2ads could be the origin of NO in gas phase
following reaction (1).
NO2ads NO (g) + Oads (1)
When NO is introduced back into the system (C3H6/Ar/O2→C3H6/NO/O2), the
previous situation is not recovered, i.e. there is no activity for the NO reduction
reaction. The C3H6/NO/O2↔C3H6/Ar/O2 switch at temperatures higher than Tmax is
therefore an irreversible switch. The reason for this deactivation may be the lack of
reaction between NO (g) and Oads which will cover the active sites under these
conditions. The deactivation also can be produced by the formation of carbonaceous
deposits coming from the incomplete combustion of the hydrocarbon. The formation of
these deposits that do not cause catalyst deactivation at Tmax was already observed
and studied in detail elsewhere [35]. It seems that in the C3H6/NO/O2 → C3H6/Ar/O2
switch, the absence of NO and the high temperature used favours the formation of
these deposits that are stable at 230 º C even in the presence of oxygen. These
deposits block the surface of the catalyst, inhibiting the adsorption of NO and, as a
consequence, its oxidation to NO2 or its reduction with propene. The absence of NO2
evolution during the switch supports this explanation. As NO adsorption does not take
place when this type of deposits are present [36], the re-introduction of NO does not
achieve the recovery of the system to its initial state where NO reduction was the most
important reaction. On the contrary, hydrocarbon combustion is not affected at all.
It seems feasible that one of the roles of NO2 is the elimination of coke deposits
from the active phase preventing catalyst deactivation. In order to check the hypothesis
about the role of NO2, a new switch at 230ºC was carried out, after 10 hours in reaction
conditions (2262 ppm NO, 3400 ppm C3H6 and 5% O2 in He), the NO was eliminated
(C3H6/NO/O2 → C3H6/Ar/O2 switch) and , subsequently, C3H6/Ar/O2 was switched by
C3H6/NO2/O2. The profiles shown in Figure 11 confirm our hypothesis. Note that the
Page 13 of 34

Acce
pted
Man
uscr
ipt
14
NO2 is consumed by reaction with coke deposits as indicates the concomitant evolution
of CO2.
3.2.2. Ar/NO/O2↔C3H6/NO/O2 switch The elimination of the reductant from the system, at 230 ºC, induces an
increase in the NO2 concentration. This is the unique conclusion extracted from the
C3H6/NO/O2→ Ar/NO/O2 switch. In contrast to this, the elimination of the reductant at
temperatures lower than Tmax (200ºC) did not originate NO2 evolution. This difference
can be explained by the high Oads coverage that exists at temperatures higher than
Tmax.
The Ar/NO/O2→ C3H6/NO/O2 switch at 230ºC is shown in Figure 12. This is a
reversible switch, i.e. after the switch the system goes back to its initial situation.
However, in the relaxation time, it can be observed how NO2 concentration increased in
the previous switch (C3H6/NO/O2→ Ar/NO/O2) decreases together with Ar and reaches
a minimum before increasing again until the stationary state. The drop of the NO2
profile after the introduction of propene to the system is an obvious consequence of the
reaction of NO2ads with the hydrocarbon.
CO2 shows a rapid evolution during a few seconds after propene is introduced
and, later the profile presents a change in slope until it slowly reaches the stationary
state. The fast evolution of CO2 after the switch is indicative of a fast reaction between
NO2ads species and C3H6 in either the gas phase or through a fast adsorption leading to
hydrocarbon fragments, i.e. a fast combustion of the first propene molecules. O2 and NO present a similar profile after hydrocarbon is fed back into the
system. The concentration of these reactants decreases with fast kinetics and then the
kinetics slow down. NO and O2 concentrations decrease as they adsorb on free Pt sites
whose are being generated during hydrocarbon combustion.
3.2.3. Temperature Programmed Desorption of Pt-beta catalyst after reaction at 230ºC.
Figure 13 shows the results of temperature programmed desorption experiment
carried out with Pt-beta catalyst after 10 hours under reaction conditions at 230ºC. First
of all, it must be noted that propene evolution is not observed in the whole range of
temperature studied, indicating that molecular propene is not stored in the catalyst
(Pt+zeolite) after the maximum of activity. In Figure 9, desorption of hydrocarbon was
shown to begin at 220ºC, and this justifies the fact that at 230ºC the hydrocarbon
cannot adsorb on the catalyst. This does not imply that hydrocarbon fragments are not
present.
Page 14 of 34

Acce
pted
Man
uscr
ipt
15
Although NO2 has been detected in the gas phase during the reaction at 230ºC
(see Figure 2), no evolution of this gas is observed during the TPD experiment showing
that this molecule is not adsorbed under reaction conditions. Therefore this species as
soon as it forms either reacts (as we have proposed for coke deposits) or evolves
rapidly from the surface.
The profiles of CO2 and N2 are very similar to those shown in Figure 9 (TPD
after reaction at 200ºC). A clear difference is the absence of N2O.
The CO2 signal presents a peak at ca. 260ºC probably arising from the reaction
of carbonaceous deposits, formed during the reaction. The absence of H2O (not shown
in the figure) in this temperature interval, make us think that the carbonaceous deposits
are coke-like deposits instead of species coming from the adsorption of hydrocarbon
on the catalyst surface (C+O2 →CO2), probably produced by the propene cracking.
Considering the area of the peak we deduce that the formation of these deposits is low
although not negligible. Based on the temperature at which this peak appears, the coke
deposits must grow on the surface of the active phase or close to it [42,43].
Oxygen shows an interesting profile. There is an important desorption of oxygen
at the temperature of the reaction, confirming that Oads coverage is very important on
the catalyst surface. Desorption is followed by an oxygen consumption up to 260ºC,
temperature at which coke combustion takes place. This fact supports the hypothesis
of an important amount of oxygen adsorbed on the catalyst surface at temperatures
higher than Tmax, being able to oxidise the coke deposits formed on the catalyst even
during a treatment under inert atmosphere (TPD).
4. Discussion
4.1. The state of Pt-beta catalyst at temperature below Tmax
At temperatures below Tmax, the surface of the Pt-beta catalyst is mainly
covered by adsorbed hydrocarbon species. An important fraction of which is adsorbed
on the zeolite support. On the contrary Oads coverage is very low under these reaction
conditions.
Considering the information on the state of the catalyst surface, it seems that
there exists a direct competition between NO and O2 for Pt adsorption sites, being
favourable to NO. The dissociative chemisorption of oxygen is not favoured, and as a
consequence, the combustion of the hydrocarbon permits the selective reduction of NO
even in an O2/NO>45. These conclusions agree with those obtained by Burch et al.
[32] using Pt/SiO2 and Pt/Al2O3 catalysts. In addition, this study allows us to conclude
Page 15 of 34

Acce
pted
Man
uscr
ipt
16
that the reaction between NO and propene is not a direct reaction, but it goes through a
series of intermediates of composition CxHyOzNw formed from NOads and C3H6ads. These
intermediates could be identified as the “active radicals” that Obuchi et al. [6] and
Ansell et al. [7] described in their works. Jeon et al. [44,45] have also observed the
active role of surface carbon species in the reduction of NO by propene when using
Pt/V/MCM-41 catalysts. The coverage of the active phase by these intermediates is not
high due to their high reaction rate with oxygen in the gas phase. Therefore, the role of
oxygen is the combustion of these intermediates to leave free Pt sites for the
adsorption of NO and C3H6 assuring the course of the reaction. The next reaction
sequence summarises the global process that takes place before the maximum of
activity.
NO (g) + * → NOads Fast (2)
C3H6 (g) + * → C3H6·ads Fast (3)
C3H6·ads + NOads → (CxHyOzNw)ads + * Slow (4)
(CxHyOzNw)ads + O2 (g) → CO2 + H2O + N2 /N2O + * Fast (5)
(*: indicates active Pt sites (free and reduced) for the adsorption of reactants).
The reaction takes place through the adsorption of NO on a free reduced Pt
(reaction (2)), this step seems to be fast at least in some of the Pt particles (see Figure
4).
If only NO exists in the gas phase, the catalyst surface would be progressively covered by NOads species, and the catalyst would completely deactivated. Therefore,
the presence of a reductant is needed in order to eliminate these species. To do so, the
hydrocarbon must, first of all, adsorb on the surface of the catalyst, in a fast reaction
(reaction (3)) [36]. The regeneration of Pt active sites goes through some partially
oxidised hydrocarbon species which form trough reactions (4). This reaction seems to
be slow (see Figure 7). The formation of these intermediates, which can be seen as an
activation of the hydrocarbon, has been put forward by several authors [6,7, 25-28,
44,45]. The complete oxidation of these intermediates with oxygen in the gas phase
(reactions (5)) is a fast process (see Figure 8) which creates, again, active Pt sites
closing the catalytic cycle.
4.2. The state of Pt-beta catalyst at temperature above Tmax.
The surface of the Pt-beta catalyst at temperatures higher than Tmax is mainly
covered by Oads species because, at this temperature, the dissociation of oxygen is
Page 16 of 34
Acce
pted
Man
uscr
ipt
17
faster than at 200 ºC. The concentration of adsorbed hydrocarbon on the active phase
or the zeolite support over the maximum of activity is very low. The higher temperature
also favours the formation of carbonaceous deposits probably by the propene cracking
that nevertheless do not imply the deactivation of the catalyst. NO2 plays a fundamental
role in the reaction. The state of the catalyst surface favours NO2 formation, keeping
the active phase free of coke deposits, that otherwise would deactivate the catalyst.
The next sequence summarises the additional reactions, besides (2), (3), (4), (5)
occurring in the global process at temperatures above Tmax.
O2 (g) + * → 2 Oads Fast (6)
NOads + Oads ↔ NO2ads Fast (7)
NO2ads → NO2 (g) Fast (8)
C3H6 (g) + 2NO2ads → CO2 + H2O + NO Fast (9)
C3H6 (g) → coke* Slow (10)
Coke* + NO2 (g)/ NO2ads → NO + CO2 + * Fast (11)
The net change in the reaction mechanism when temperature is higher than
Tmax is motivated by the fast dissociative adsorption of the oxygen molecule on the
metal surface (reaction (6)) that leads to a high coverage of Oads species on the
catalyst surface facilitated by the absence of C3H6ads and the increase in temperature.
These species react with NOads to yield NO2ads (reaction (7)). NO2ads reacts with the
propene in the gas phase (reaction (9)), or can be desorbed to form NO2(g) (reaction (8)).The high reactivity of NO2 leads to the fast reaction with coke deposits (formed by
reaction (10)) through reaction (11). Reactions (9) and (11) give NO as NO2 reduction
product [46,47], consequently when these reactions become important, the NO
reduction activity decreases
Shen and Kawi [48] found a change in kinetic from surface reaction controlled to
external mass transfer controlled at the temperature of the maximum activity using
Pt/MCM-41 catalyst. Below the maximum, the surface reaction is suggested to be slow
and becomes the controlling step for the overall NO conversion reaction. Above the
maximum, the activation of C3H6 is very fast and reaches complete oxidation. Although
the mass transfer rate is faster at higher temperature, however the rate of surface
reaction may exceed the rate of external mass transfer of reactant. In our system a
similar behaviour was found [49].
4.3. State of the Pt-beta catalyst at the maximum of activ ity.
The NO and C3H6 conversions at the maximum of activity are very high, see
Figure 2. This fact invalidates the use of transient analysis techniques to determine the
Page 17 of 34

Acce
pted
Man
uscr
ipt
18
state of the catalyst and, as consequence, the reaction mechanism. It is reasonable to
think that the situation must be a transition between the two previously described
situations. Before the maximum of activity, the catalyst surface is mainly covered by
C3H6ads species resulting in an essentially reduced metal phase. After the maximum of
activity, the high coverage of Oads species results in a mainly oxidised metal phase.
The oxidation state of Pt during the NO/C3H6/O2 reaction at the maximum of
activity has been previously studied by X-Ray Photoelectron Spectroscopy (XPS) [35].
Results reveal that at the maximum of activity Pt(0) and Pt(II) coexist which is in
agreement with the hypothesis of presenting the situation at the maximum of activity as
a transition between the Pt surface situation before the maximum (Pt(0)) and after the
maximum (Pt(II)).
The transient analysis studies performed at temperatures lower and higher than
the maximum of activity allow to drawn the following scenario for the steps occurring at
the catalyst surface. NO must adsorb on the surface of Pt and form NOads species. The
adsorption of propene also takes place at the catalyst. The reaction proceeds through
the slow formation of partially oxidised active intermediates (CxHyOzNw). The
combustion of the intermediates with O2(g) is the main step cleaning the Pt active sites
so the reaction can continue. Temperature has a positive effect on the surface reaction
producing active intermediates. On the contrary, formation of NOads and C3H6·ads are not
favoured by an increase in temperature. This fact will determine the maximum
concentration of active intermediates and consequently the maximum of activity.
5. Conclusions The transient analysis study of the selective reduction of NOx with propene on
Pt-beta catalyst provides insights to better understand the mechanism of the reaction
and the changes occurring at the maximum of activity.
• A direct competition between NO and O2 for Pt adsorption sites exists, being
favourable to NO. The dissociative chemisorption of oxygen is not favoured,
and as a consequence, the combustion of the hydrocarbon permits the
selective reduction of NO.
• . The reaction proceeds through the slow formation of partially oxidised active
intermediates (CxHyOzNw) formed from NOads and C3H6ads. The combustion of
the intermediates with O2(g) is the main step cleaning the Pt active sites.
• Temperature will determine the maximum concentration of active intermediates
because has a positive effect on the surface reaction producing active
intermediates, but, a negative effect on the formation of NOads and C3H6·ads.
Page 18 of 34

Acce
pted
Man
uscr
ipt
19
• The high reactivity of NO2, favoured at temperatures above Tmax, produces the
consumption of the hydrocarbon without NO reduction and consequently the
decrease in activity.
Acknowledgments
The authors thank the Spanish Ministry of Education and Science (project
CTQ2005-01358) for the financial support.
References
[1] R. Burch, J. P. Breen y F. C. Meunier, Appl. Catal. B, 39 (2002) 283.
[2] R. Burch and T. C. Watling, J. of Catal. 169 (1997) 45.
[3] M. C. Demicheli, L. C. Hoang, J. C. Menézo and J. Barbier y M. Pinabiau-Carlier,
Appl. Catal. A,97 (1993) L1.
[4] R. Burch, P. Fornasiero, T. C. Watling, J. Catal. 176 (1998) 204.
[5] Y. Traa, B. Burger y J. Weitkamp, Micropor. Mesopor. Mater. 30 (1999) 3.
[6] A. Obuchi, A. Ogata, K. Mizuno, A. Ohi, M. Nakamura, H. Obuchi, J. Chem. Soc.
Chem. Commun. (1992) 247.
[7] G. P. Ansell, A. F. Diwell, S. E. Golunski, J. W. Hayes, R. R. Rajaram, T. J. Truex,
A. P. Walker, Appl. Catal. B, 2 (1993) 81.
[8] G. J. Buckles, G. J. Hutchings, J. Catal. 151 (1995) 33.
[9] N. W. Hayes, R. W. Joyner, E. S. Shpiro, Appl. Catal. B, 8 (1996) 343.
[10] G. A. Somorjai, Introduction to Surface Chemistry and catalysis, John Wiley &
Sons Eds, New York, 1994 p. 459.
[11] L. J. Lobree, A. W. Aylor, J. A. Reimer, A. T. Bell, J. Catal. 169 (1997) 188.
[12] Y. Li, T. L. Slager, J. N. Armor, J. Catal. 150 (1994) 388.
[13] G. R. Bamwenda, A. Ogata, A. Obuchi, J. Oi, K. Mizuno y J. Skrzypek, App. Catal.
B, 6 (1995) 311.
[14] D. K. Captain, M. Amiridis, J. Catal. 184 (1999) 377 ; and J. Catal. 194 (2000) 222.
[15] D. K. Captain, C.Mihut, J.A. Dumesic, M. Amiridis, Catal. Lett. 83 (2002) 109.
[16] K. Acke, M. Skoglundh, Appl. Catal. B, 20 (1999) 235.
[17] F. Acke, B. Westerberg, M. Skoglundh, J. Catal. 179 (1998) 528.
[18] C. Rottländer, R. Andorf, C. Plog, B. Krutzsh and M. Baerns, App. Catal. B, 11
(1996) 49.
[19] V. Pitchon y A. Fritz, J. Catal. 186 (1999) 64.
[20] M. Sasaki, H. Hamada, Y. Kintaichi. T. Ito, Catal. Lett. 15 (1992) 297.
[21] B. J. Adelman, T. Beutel, G. D. Lei, W. M. H. Sachtler, J. Catal. 158 (1996) 327.
[22] Y. Li, J. N. Armor, J. Catal. 150 (1994) 376.
Page 19 of 34

Acce
pted
Man
uscr
ipt
20
[23] F. Jayat, C. Lembarcher, U. Schubert, J. A. Martens, Appl. Catal. B, 21 (1999)
221.
[24] P. Praserthdam, Ch. Chaisuk, A. Panit y K. Kraiwattanawong, Appl. Catal. B, 38
(2002) 227.
[25] E. Joubert, X. Courtois, P. Marecot. C. Canaff, D. Duprez, J. Catal 243 (2006) 252.
[26] F. Garin, P. Girard, S. Ringler, G. Maire, N. Davias, App. Catal B, Env. 20 (1999)
205.
[27] S. Ringler, P. Girard, G. Maire, S. Hilaire, G. Roussy, F. Garin, Appl. Catal. B 20
(1999) 219.
[28] F. Garin. Catal. Today, 89 (2004) 255.
[29]. T. Inui, S, Iwamoto, S. Shimizu, Proc. Ninth Int. Zeolite Conf., Vol. II, R. Von
Balmoos, J.B. Higgins, M.M. T. Treacy (Eds) 1993 p.405.
[30] R. Burch, J. A. Sullivan and T. C. Watling, Catal. Today,42 (1998) 13.
[31] R. Burch, P. J. Millington and A. P. Walker, App. Catal. B, 4 (1994) 65.
[32] R. Burch, P. J. Millington, Catal. Today, 26 (1995) 185.
[33] R. Burch and T. C. Watling, Catal. Lett. 37 (1996) 51.
[34] B. K. Cho and J. E. Yie, App. Catal. B, 1 (1996) 263.
[35] J.M. García-Cortés, J. Pérez-Ramírez, J.N 21. Rouzaud, A.R. Vaccaro, M.J. Illán-Gómez, C. Salinas-Martínez de Lecea, J. Catal. 8 (2003), 111. [36] R. Burch, J. A. Sullivan, J. Catal. 182 (1999) 489.
[37] John Happel, Isotopic Assessment of Heterogeneous Catalysis, Academic Press,
Inc. 1986, New York.
[38] M. Xin, I. C. Hwang, D. H. Kim, S. I. Cho, S. I. Woo, Appl. Catal. B, 21 (1999) 183.
[39] J.K. Brown, A.C. Lunzt, Chem. Phys. Lett. 204 (1993) 451.
[40] A.T. Pasteur, X.C. Guo, T. Ali, M. Gruyters, D.A. King, Surf. Sci. 366 (1997) 564.
[41] A. Kotsifa, D. I. Kondarides, X. E. Verykios, Appl. Catal. B, 72 (2007) 136.
[42] R.A. Comelli, S.A. Canavese, C.A. Querini, N.S. Fígoli, Appl. Catal. A. 182 (1999)
275.
[43] D. Duprez, M. Hajd-Aissa, J. Barbier, Appl. Catal. 49 (1989) 67.
[44] J.Y. Jeon, H.Y. Kim and S.I. Woo, Appl. Catal. B, 44 (2003) 301.
[45] J.Y. Jeon, H.Y. Kim and S.I. Woo, Appl. Catal. B, 44 (2003) 311.
[46] A. Setiabudi, M. Makkee, J.A, Moulijn, Appl. Catal. B, 50 (2004) 185.
[47] O. Gorce, F. Baudin, C, Thomas, P. da Costa, G. Djéga-Mariadassou, Appl. Catal.
B, 54 (2004) 69.
[48] S. C. Shen and S. Kawi. Catalysis Today 68 (2001) 245.
[49] A. Bueno-López, M.J. Illán-Gómez, C. Salinas-Martínez, Appl. Catal. A. 302 (2006) 144
Page 20 of 34
Acce
pted
Man
uscr
ipt
21
Figure captions
Figure 1. Scheme of the experimental device for the kinetic analysis. (a) Two-way
valve, (b) three-way valve, (c) four-way electro-valve (switch), (d) mass flow controllers,
(e) tubular quartz reactor, (f) horizontal furnace, (g) thermocoupler, (h) temperature
controller, (i) filters (7µm), (j) high-sensitivity pressure transducers (0 – 0,6 mbar), (k)
loop (50 µl), (m) high precision regulation valve and (n) mass spectrometer.
Figure 2. Conversion of ( ) NOx and ( ) C3H6 and NO2 evolution ( ) on sample Pt-
beta (r-0.5). Experimental conditions: 2262 ppm NO, 3400 ppm C3H6, 5 vol% O2,
balance He; P= 1 bar; GHSV = 50,000 h-1 (experimental system described in ref. 35).
Figure 3. Switch C3H6/NO/O2 → C3H6/Ar/O2 over Pt-beta catalyst at 200ºC. ( ) Ar,
( ) Ar-1, ( ) NO, ( ) C3H6, ( ) O2, ( ) CO2.
Figure 4. Switch C3H6/Ar/O2 → C3H6/NO/O2 over Pt-beta catalyst at 200ºC. ( ) Ar, ( )
Ar-1, ( ) NO, ( ) C3H6, ( ) O2, ( ) CO2.
Figure 5. Switch C3H6/NO/O2 → Ar/NO/O2 over Pt-beta catalyst at 200ºC. ( ) Ar,
( )Ar-1,( )NO,( ) C3H6, ( ) CO2.
Figure 6. Switch Ar/NO/O2 → C3H6/NO/O2 over Pt-beta catalyst at 200ºC. ( ) Ar, ( )
Ar-1,( )NO, ( ) C3H6, ( ) CO2.
Figure 7. Switch C3H6/NO/O2 → C3H6/NO/Ar over Pt-beta catalyst at 200ºC. ( ) Ar, ( )
Ar-1,( )NO, ( ) C3H6, ( ) CO2, ( ) O2.
Figure 8. Switch C3H6/NO/Ar → C3H6/NO/O2 over Pt-beta catalyst at 200ºC. ( ) Ar, ( )
Ar-1, ( ) NO, ( ) C3H6, ( ) CO2, ( ) O2.
Figure 9. Temperature Programmed Desorption of sample Pt-beta after reaction at
200ºC during 10 hours.
Figure 10. Switch C3H6/NO/O2 → C3H6/Ar/O2 over Pt-beta catalyst at 230ºC. ( ) Ar, ( ) Ar-1, ( ) NO, ( ) O2, ( ) CO2. Figure 11. Switch C3H6/Ar/O2 → C3H6/NO2/O2 over Pt-beta catalyst at 230ºC. ( ) Ar, ( ) Ar-1, ( ) NO2, ( ) CO2. Figure 12. (a) Switch Ar/NO/O2 → C3H6/NO/O2 over Pt-beta catalyst at 230ºC ( ) Ar,
( ) Ar-1, ( ) NO, ( ) O2, ( ) CO2, ( ) NO2;
Figure 13. Temperature Programmed Desorption of sample Pt-beta after reaction at
230ºC during 10 hours.
Page 21 of 34

Acce
pted
Man
uscr
ipt
23
He
bypass
0
2 0 0
4 0 0
6 0 0
8 0 0
1 0 0 0
1 2 0 0
1 00 2 0 0 3 0 0 4 0 0 5 0 0
T ª ( ºC )
ppm
NO NOx NO2
H2
C H3 6NO
O2
a
b
c
d
e
f
g
h
i
jk
m
n
Figure 1
He
bypass
0
2 0 0
4 0 0
6 0 0
8 0 0
1 0 0 0
1 2 0 0
1 00 2 0 0 3 0 0 4 0 0 5 0 0
T ª ( ºC )
ppm
NO NOx NO2
H2
C H3 6NO
O2
a
b
c
d
e
f
g
h
i
jk
m
n
Figure 1
Page 22 of 34
Acce
pted
Man
uscr
ipt
24
Figure 2
100 150 200 250 300 350 400 450 5000
10
20
30
40
50
60
70
80
100
90
Temperature (ºC)
Con
vers
ion
(%)
NO
2co
ncen
tration(u
.a.)
Figure 2
100 150 200 250 300 350 400 450 5000
10
20
30
40
50
60
70
80
100
90
Temperature (ºC)
Con
vers
ion
(%)
NO
2co
ncen
tration(u
.a.)
100 150 200 250 300 350 400 450 5000
10
20
30
40
50
60
70
80
100
90
Temperature (ºC)
Con
vers
ion
(%)
100 150 200 250 300 350 400 450 5000
10
20
30
40
50
60
70
80
100
90
Temperature (ºC)
Con
vers
ion
(%)
NO
2co
ncen
tration(u
.a.)N
O2
con
centration
(u.a.)
NO
2 Con
cen
tration (p
pm
)
- 3000
- 2000
- 1000
Page 23 of 34

Acce
pted
Man
uscr
ipt
25
Figure 3
0 5 10 15 20 25-0,4
-0.2
0,0
0,2
0,4
0,6
0,8
1,0
1,4
1,2
time (s)
Nor
ma
lised
resp
ons
e
0 2 4 6 8 10-0,4
-0.2
0,0
0,2
0,4
0,6
0,8
1,0
1,4
1,2
time (s)
Nor
mal
ise
dre
spo
nse
0 5 10 15 20 25-0,4
-0.2
0,0
0,2
0,4
0,6
0,8
1,0
1,4
1,2
time (s)
Nor
ma
lised
resp
ons
e
0 5 10 15 20 25-0,4
-0.2
0,0
0,2
0,4
0,6
0,8
1,0
1,4
1,2
time (s)
Nor
ma
lised
resp
ons
e
0 2 4 6 8 10-0,4
-0.2
0,0
0,2
0,4
0,6
0,8
1,0
1,4
1,2
time (s)
Nor
mal
ise
dre
spo
nse
0 2 4 6 8 10-0,4
-0.2
0,0
0,2
0,4
0,6
0,8
1,0
1,4
1,2
time (s)
Nor
mal
ise
dre
spo
nse
Page 24 of 34
Acce
pted
Man
uscr
ipt
26
Figure 4
0,4
0,6
0,8
1,0
0,2
0 25 50 75 100 1250
time (s)
Nor
mal
ised
resp
on
se
0 5 10 15 20 25
1,0
time (s)
No
rmal
ised
resp
on
se
0,4
0,6
0,8
0
0,2
0,4
0,6
0,8
1,0
0,2
0 25 50 75 100 1250
time (s)
Nor
mal
ised
resp
on
se
0,4
0,6
0,8
1,0
0,2
0 25 50 75 100 1250
time (s)
Nor
mal
ised
resp
on
se
0,4
0,6
0,8
1,0
0,2
0 25 50 75 100 1250
time (s)
Nor
mal
ised
resp
on
se
0 5 10 15 20 25
1,0
time (s)
No
rmal
ised
resp
on
se
0,4
0,6
0,8
0
0,2
0 5 10 15 20 25
1,0
time (s)
No
rmal
ised
resp
on
se
0,4
0,6
0,8
0
0,2
0 5 10 15 20 25
1,0
time (s)
No
rmal
ised
resp
on
se
0,4
0,6
0,8
0
0,2
Page 25 of 34

Acce
pted
Man
uscr
ipt
27
Figure 5
0 10 20 30 40 500
0,2
0,4
0,6
0,8
1,0
1,8
2,0
time (s)
No
rmal
ise
dre
spo
nse
1,2
1,4
1,6
0 10 20 30 40 500
0,2
0,4
0,6
0,8
1,0
1,8
2,0
time (s)
No
rmal
ise
dre
spo
nse
1,2
1,4
1,6
0 10 20 30 40 500
0,2
0,4
0,6
0,8
1,0
1,8
2,0
time (s)
No
rmal
ise
dre
spo
nse
1,2
1,4
1,6
Page 26 of 34

Acce
pted
Man
uscr
ipt
28
Figure 6
0 5 10 15 20 25-1,5
-1,0
-0,5
0,0
0,5
1,0
1,5
2,0
time (s)
No
rmal
ise
dre
spo
nse
0 5 10 15 20 25-1,5
-1,0
-0,5
0,0
0,5
1,0
1,5
2,0
time (s)
No
rmal
ise
dre
spo
nse
0 5 10 15 20 25-1,5
-1,0
-0,5
0,0
0,5
1,0
1,5
2,0
time (s)
No
rmal
ise
dre
spo
nse
Page 27 of 34

Acce
pted
Man
uscr
ipt
29
Figure 7
0 30 60 90 120 150
time (s)
No
rma
lised
resp
on
se
0,4
0,6
0,8
1,0
0,2
00 30 60 90 120 150
time (s)
No
rma
lised
resp
on
se
0,4
0,6
0,8
1,0
0,2
00 30 60 90 120 150
time (s)
No
rma
lised
resp
on
se
0,4
0,6
0,8
1,0
0,2
0
0,4
0,6
0,8
1,0
0,2
0
Page 28 of 34

Acce
pted
Man
uscr
ipt
30
Figure 8
0 20 40 60 80 100
time (s)
No
rma
lised
resp
ons
e
0,4
0,6
0,8
1,0
0,2
0
1,2
0 20 40 60 80 100
time (s)
No
rma
lised
resp
ons
e
0,4
0,6
0,8
1,0
0,2
0
1,2
0 20 40 60 80 100
time (s)
No
rma
lised
resp
ons
e
0,4
0,6
0,8
1,0
0,2
0
1,2
Page 29 of 34

Acce
pted
Man
uscr
ipt
31
Figure 9
Mas
ses
pe
ctro
met
erre
spo
nse
(a
.u.)
450250 300 500350 400
Temperature (ºC)
200
CO
N2O
N2
CO2
C3H6
Mas
ses
pe
ctro
met
erre
spo
nse
(a
.u.)
450250 300 500350 400
Temperature (ºC)
200
CO
N2O
N2
CO2
C3H6
Mas
ses
pe
ctro
met
erre
spo
nse
(a
.u.)
450250 300 500350 400
Temperature (ºC)
200
CO
N2O
N2
CO2
C3H6
Page 30 of 34

Acce
pted
Man
uscr
ipt
32
Figure 10
0 5 10 15 20 25-0,50
-0.25
0,00
0,25
0,50
0,75
1,00
1,50
1,25
time (s)
Nor
ma
lised
resp
onse
0 5 10 15 20 25-0,50
-0.25
0,00
0,25
0,50
0,75
1,00
1,50
1,25
time (s)
Nor
ma
lised
resp
onse
0 5 10 15 20 25-0,50
-0.25
0,00
0,25
0,50
0,75
1,00
1,50
1,25
time (s)
Nor
ma
lised
resp
onse
Page 31 of 34

Acce
pted
Man
uscr
ipt
33
Figure 11
0 20 40 60 80 1000,0
0,5
1,0
1,5
2,0
2,5
3,0
3,5
time (s)
No
rmal
ised
resp
onse
0 20 40 60 80 1000,0
0,5
1,0
1,5
2,0
2,5
3,0
3,5
time (s)
No
rmal
ised
resp
onse
Page 32 of 34

Acce
pted
Man
uscr
ipt
34
Figure 12
-0,6
-0.4
-0,2
0,0
0,2
0,4
0,6
1,0
0,8N
orm
alis
edre
spon
se
0
20
40
60
80
100
120
160
140
C3H
6ev
olu
tion
(pp
m)
-0,6
-0.4
-0,2
0,0
0,2
0,4
0,6
1,0
0,8N
orm
alis
edre
spon
se
0
20
40
60
80
100
120
160
140
C3H
6ev
olu
tion
(pp
m)
Page 33 of 34

Acce
pted
Man
uscr
ipt
35
Figure 13
Mas
ses
pect
rom
ete
rre
spo
nse
(a.u
.)
450250 300 500350 400
Temperature (ºC)
200
CO
NO2
N2
CO2
C3H6
O2
Mas
ses
pect
rom
ete
rre
spo
nse
(a.u
.)
450250 300 500350 400
Temperature (ºC)
200
CO
NO2
N2
CO2
C3H6
O2
Mas
ses
pect
rom
ete
rre
spo
nse
(a.u
.)
450250 300 500350 400
Temperature (ºC)
200
CO
NO2
N2
CO2
C3H6
O2
Page 34 of 34