ABSTRACT Title of Dissertation: PROTEOMIC ANALYSIS - DRUM
146
ABSTRACT Title of Dissertation: PROTEOMIC ANALYSIS OF PLASMA MEMBRANE PROTEINS FROM DRUG SUSCEPTIBLE AND DRUG RESISTANT BREAST CANCER CELL LINES Amir Mikel Rahbar, Doctor of Philosophy, 2004 Dissertation Directed by: Professor Catherine Fenselau Department of Chemistry and Biochemistry Drug discovery is an important field of research in the biotechnology and pharmaceutical industries. Plasma membranes are rich in drug targets and other proteins responsible for cell signaling, transport, signal transduction, and other cellular functions. Information obtained about these proteins, and the pathways they participate in, helps to facilitate the drug discovery process. Although these plasma membrane proteins play important roles in cellular function, they are usually expressed in very low abundance and are therefore hard to identify and analyze. Comparative proteomic analysis of plasma membranes in different types of cells or different disease states of the same cell or tissue type can help to design targeted therapies specific to particular cell or tissue types and can be used in the identification of biomarkers for early disease detection. In order to be able to identify proteins in the
Transcript of ABSTRACT Title of Dissertation: PROTEOMIC ANALYSIS - DRUM

ABSTRACT
Title of Dissertation: PROTEOMIC ANALYSIS OF PLASMA
MEMBRANE PROTEINS FROM DRUG
SUSCEPTIBLE AND DRUG RESISTANT BREAST
CANCER CELL LINES
Amir Mikel Rahbar, Doctor of Philosophy, 2004
Dissertation Directed by: Professor Catherine Fenselau
Department of Chemistry and Biochemistry
Drug discovery is an important field of research in the biotechnology and
pharmaceutical industries. Plasma membranes are rich in drug targets and other
proteins responsible for cell signaling, transport, signal transduction, and other
cellular functions. Information obtained about these proteins, and the pathways they
participate in, helps to facilitate the drug discovery process. Although these plasma
membrane proteins play important roles in cellular function, they are usually
expressed in very low abundance and are therefore hard to identify and analyze.
Comparative proteomic analysis of plasma membranes in different types of cells or
different disease states of the same cell or tissue type can help to design targeted
therapies specific to particular cell or tissue types and can be used in the identification
of biomarkers for early disease detection. In order to be able to identify proteins in the

plasma membrane it is important to start out with a plasma membrane fraction that is
free of contamination from other more abundant proteins from other portions of the
cell. 2D gel electrophoresis is the primary protein separation tool for use with
proteomics and drug discovery, however, the inability of membrane proteins to be
separated using isoelectric focusing, which is the first step in the 2D gel protocol,
excludes 2D gel electrophoresis as a viable technique for the separation of membrane
proteins.
This thesis develops and evaluates a method to identify proteins found in the plasma
membranes of mammalian cells using a modified form of the cationic colloidal silica
technique for plasma membrane isolation combined with analysis of these proteins
using mass spectrometry. This method is then used in combination with metabolic
stable isotope labeling to identify protein expression changes between the
mitoxantrone drug susceptible and drug resistant MCF-7 breast cancer cell lines.
PROTEOMIC ANALYSIS OF PLASMA MEMBRANE PROTEINS FROM DRUG
SUSCEPTIBLE AND DRUG RESISTANT BREAST CANCER CELL LINES
by
Amir Mikel Rahbar
Dissertation submitted to the Faculty of the Graduate School of the University of Maryland, College Park in partial fulfillment
of the requirements for the degree of Doctor of Philosophy
2004
Advisory Committee:
Professor Catherine Fenselau, Chair/AdvisorAssociate Professor David FushmanAssociate Professor Jason KahnProfessor George LorimerProfessor Neil Blough

ii
ACKNOWLEDGEMENTS
I would like to Dr. Catherine Fenselau for her financial and intellectual support
throughout my graduate career.
I would like to thank all of the past and present members of the Fenselau lab,
especially Dr. Yetrib Hathout, for all of the help over the years.
I would like to thank Dr. Fran Ligler and Dr. Michael Lassman at the Naval Research
Lab for allowing me to use their instrument while ours was being upgraded.
I would like to thank my thesis committee members for guiding my work over the
years and for taking the time to read my thesis and taking part in my defense.
The work presented in this dissertation was funded by grants from the National
Science Foundation (NSF Grant CHE-9634238) and the National Institutes of Health
(GM 21248).
Finally I would like to thank my family, especially my wife, without whose support
this would not have been possible. Thank you.

iii
TABLE OF CONTENTS
LIST OF TABLES....................................................................................................... ivLIST OF FIGURES ...................................................................................................... vChapter 1: Introduction and Overview ......................................................................... 1
A. Cancer and Drug Resistance................................................................................. 1B. Proteomics and Mass Spectrometry...................................................................... 5C. Protein/Peptide Separation and Enzymatic Digestion ........................................ 18
Chapter 2: Plasma Membrane Isolation Technique .................................................... 23A. Membrane Protein Overview ............................................................................. 23B. Materials and Methods ....................................................................................... 28C. Results and Discussion ....................................................................................... 38
Chapter 3: Proteomic Analysis of Plasma Membrane Proteins .................................. 44A. Membrane Protein Analysis Overview .............................................................. 44B. Materials and Methods ....................................................................................... 46C. Results and Discussion ....................................................................................... 50
Chapter 4: Comparison of Plasma Membrane Proteins from Drug Resistant and Drug Susceptible MCF-7 Breast Cancer Cell Lines ............................................................ 98
A. Comparative Proteomics Techniques ................................................................. 98B. Materials and Methods ..................................................................................... 103C. Results and Discussion ..................................................................................... 107
Conclusions and Prospectus...................................................................................... 127

iv
LIST OF TABLES
Table 1: Breakdown of the subcellular components of an epithelial cell .................... 7Table 2: Densitometry data from Western analysis. .................................................. 41Table 3: Plasma membrane proteins identified from RPMI 8226 cells..................... 54Table 4: Plasma membrane proteins identified from MXR MCF-7 cells.................. 59Table 5: Proteins identified from MXR MCF-7 cells using LC-MS ......................... 87Table 6: Quantitation data for the 4F2 cell surface antigen ........................................... 115Table 7: Protein abundance changes........................................................................ 116

v
LIST OF FIGURES
Figure 1: Mechanisms of chemoresistance.................................................................. 3Figure 2: Schematic of the MALDI ionization method............................................. 10Figure 3: Schematic of the electrospray ionization method ...................................... 11Figure 4: Fragmentation pattern of a theoretical tri-peptide...................................... 15Figure 5: Tandem mass spectrum of a peptide with an m/z of 713.36. ..................... 16Figure 6: Different types of membrane proteins........................................................ 25Figure 7. Scheme of the plasma membrane coating process. .................................... 30Figure 8. Scheme for the plasma membrane isolation for suspension cells. ............. 32Figure 9. Scheme for the plasma membrane isolation for adherent cells. ................. 35Figure 10: Western analysis of RPMI 8226 cells. ..................................................... 39Figure 11: Western analysis of MCF7 cells............................................................... 40Figure 12: Identification scheme for proteins isolated from plasma membranes...... 49Figure 13: SDS-PAGE gel of proteins isolated from RPMI 8226 cell cultures. ....... 51Figure 14: Mass spectrometry of peptides from band 14 from RPMI 8226 cells. .... 52Figure 15: Pie chart of plasma membrane proteins from RPMI 8226 cells. ............. 55Figure 16: SDS-PAGE gel of proteins isolated from MXR MCF-7 cell cultures. .... 57Figure 17: Mass spectrometry of peptides from band 19 from MXR MCF-7 cells. . 58Figure 18: Pie chart of plasma membrane proteins from MXR MCF-7 cells. .......... 60Figure 19: SDS-PAGE gel of proteins from basolateral plasma membranes............ 62Figure 20: Total ion current (TIC) of peptides from band 17.................................... 63Figure 21: Survey scans of the band 17 LC-MS........................................................ 65Figure 22: Automated sequence identifications from band 17. ................................. 68Figure 23: Automated sequence identifications from band 19. ................................. 69Figure 24: Manual sequence identifications from bands 17 and 19 .......................... 71Figure 25: Subcellular distribution of proteins identified.......................................... 88Figure 26: Subcellular distribution of the 100 proteins most reliably identified....... 89Figure 27: Sequence coverage of the 4F2 cell surface antigen.................................. 92Figure 28: Sequence coverage of the transferring receptor protein 1........................ 93Figure 29: Structure of the 13C labeled amino acids arginine and lysine ............... 102Figure 30: Incorporation of the labeled amino acids. .............................................. 108Figure 31: Quantitation scheme............................................................................... 111Figure 32: Labeled and unlabeled peptide pairs extracted from band 22. ............... 112Figure 33: Peptide pairs from the 4F2 cell surface antigen. .................................... 114Figure 34: Graph showing the relative changes in abundance of protein levels. .... 117

1
Chapter 1: Introduction and OverviewReproduced in part with permission from: Rahbar, A., Fenselau, C. (2004). Integration of Jacobson's Pellicle Method into Proteomic Strategies for Plasma Membrane Proteins. J Proteome Res. Web Release Date: 13-Oct-2004. Copyright 2004 American Chemical Society.
A. Cancer and Drug Resistance
According to the National Vital Statistics Report, in the United States, cancer has
become the second leading cause of death among all ages, and was found to be the
leading cause of death for those between the ages of 44 and 65.1 As individuals
increase in age, their chances of developing some form of cancer increases. Despite
new therapies and lower death rates for cancer sufferers, the incidence of cancer is
predicted to increase in the coming years due to the rise in average expected human
lifespan and subsequent increasing aging population, and this is predicted to increase
the burden of cancer on our country.2
Common cancer treatments are chemotherapy, radiation therapy, and surgery, and
these treatments are often used in combination with one another depending upon the
progression and type of cancer diagnosed.3; 4; 5 Drugs that target DNA are among the
most common type used in chemotherapy. Some of the more common drug classes
are alkylating agents and antitumor antibiotics. The mechanisms these drugs use
include crosslinking DNA, inducing DNA double strand breaks, intercalating into
DNA, and inhibiting topoisomerases I and II. 6 The overall desired effect of these
actions is to damage the DNA, interfere with the cell cycle, and ultimately induce cell
death. In recent years, innovative therapies which are more specific, such as agents
that target DNA secondary structures, agents that target protein-D NA complexes, and

2
sequence specific DNA agents have been in development in order to more
specifically target tumor cells.6
Drug resistance in cancer patients is becoming an increasingly common problem. A
patient who may have responded favorably to initial treatment with a particular anti-
cancer agent may have little or no response to a secondary treatment with not only the
previous drug used, but also to other drugs not yet administered which can be
structurally unrelated and need not have common mechanisms of action to the drug
used at the onset of the illness.7 This phenomenon is called acquired drug resistance
or multi-drug resistance.7 This multi-drug resistance is usually attributed to protein
abundance changes of several classes of proteins.7
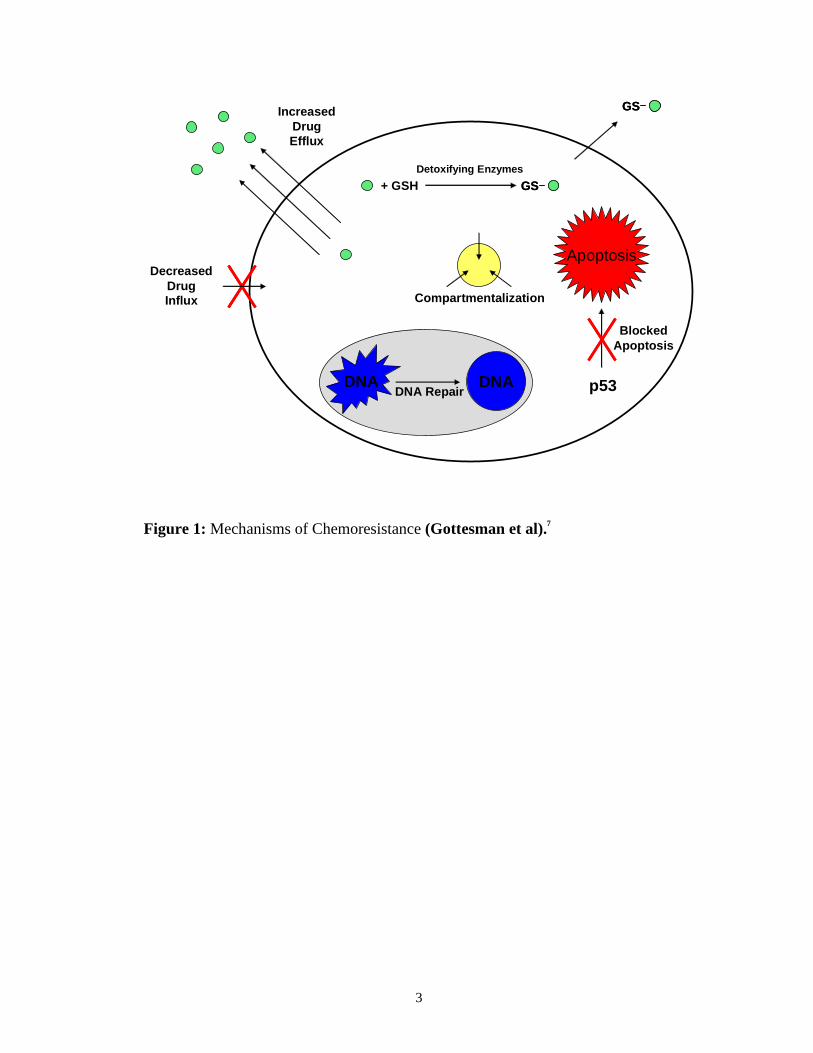
Figure 1 shows a representation of some of the general mechanisms of drug
resistance used by the cell.7 One way resistance is achieved is by decreasing the
effective concentration of the drug in the cell. This is facilitated by decreased influx
or increased efflux of chemotherapeutic agents by transporters in the plasma
membrane of the cell. One method of increased efflux is to overexpress
efflux transporters such as P-glycoprotein (Pgp) or Multidrug Resistance Proteins
(MRP), which pump agents out of the cell.8; 9; 10 Another method of decreasing the
effective concentration in the cell is to compartmentalize the agent for later
processing or removal from the cell. These mechanisms of drug resistance work well
because if the drug cannot reach its target, it cannot kill the tumor cell. If the drug is
3
DNA DNADNA Repair p53
Apoptosis
Compartmentalization
BlockedApoptosis
DecreasedDrugInflux
IncreasedDrugEfflux
Detoxifying Enzymes
+ GSH GSGS
GSGS
Figure 1: Mechanisms of Chemoresistance (Gottesman et al).7

4
allowed to accumulate in the cell, another mechanism of drug resistance is to increase
the expression of phase I and phase II detoxifying enzymes such as Glutathione-S-
transferase (GST) and Cytochrome P450.11; 12; 13; 14 The cell can also increase
expression of proteins which block apoptosis and allow the cell to proliferate in its
mutated state. If the DNA damaging agent happens to elude all of the above
mentioned mechanisms, the DNA damage done by the drug can be repaired by an
increase in the expression of DNA repair proteins and the apoptotic pathway will not
be activated.7 So there are many possible cellular mechanisms working individually
or in concert with one another using naturally occurring proteins and pathways which
can be induced or overexpressed in order to achieve drug resistance.

5
B. Proteomics and Mass Spectrometry
Where a genome is the ensemble of genes possessed by an organism, a proteome can
be described as the protein complement to the genome of that particular organism, or
put simply, the proteome is the inventory of proteins which are being expressed by an
organism under a particular set of conditions at a particular moment in time. Genomic
data has a wide variety of uses and is both versatile and robust. Even before the
sequencing of the human genome, genomic information could be used for
identification using DNA fingerprinting. With the recent completion of the human
genome sequence, we have more information available to us that can potentially help
in the prevention and treatment of diseases. DNA microarrays are currently being
used to study mRNA expression in different disease states, and this technique may
one day be used by physicians to make quick diagnoses of genetic disorders and
diseases.15 However, post translational modifications, protein half-lives, and other
protein processing events make it difficult to correlate mRNA expression with protein
expression.15; 16 For this reason determining protein expression levels directly can be
a more accurate way to compare relative protein abundances.16 Unfortunately, unlike
DNA, which can be amplified by PCR,proteins cannot be amplified and detection is
limited by their in vivo abundance, and unlike the genome, which is static, the
proteome is dynamic and is dependant on various factors such as environmental
stimulation and life cycle. It has been estimated that there are approximately 30,000
predicted genes in the human genome.17 Taking into account RNA splice variants,

6
post translational modifications, and other post processing events, these genes are
estimated to produce over 200,000 distinct proteins.18
The information made available by this genomic data can help in the field of
proteomics. Experimental data may be compared to theoretical data calculated from
an organism’s genome to identify hypothetical proteins which have not been
previously identified or characterized. Databases searched using bioinformatics
programs often incorporate both genomic and proteomic data from previously
characterized proteins.
When conducting any proteomic analysis, one is more likely to observe proteins
expressed in low abundances if one minimizes the complexity of the sample. This is
especially true if the target is a minor component of the sample source. For this
reason, often one of the first steps in a proteomic analysis of a eukaryotic system is
sub-cellular fractionation of the cells, whereby the components of the cell are
separated into their individual organelles or compartments. This type of proteomic
study has been called organelle-based proteomics.18 Table 1 shows a list of the
subcellular components of an epithelial cell and what percentage each component
comprises of the total cell volume.18 By separating organelles, chances are maximized
for identification of proteins from organelles which make up a very small fraction of
the cell, such as the golgi body or the plasma membrane. Without this sub-cellular
fractionation, identification and analysis of proteins from whole cell lysates would
only give information on the group of proteins which were the most abundant.

7
Organelle % of Cell VolumePlasma Membrane 2
Golgi 1Endoplasmic Reticulum 15
Peroxisome 1Lysosome 4
Mitochondria 12Nucleus 10Cytosol 55
Table 1: Breakdown of the subcellular components of an epithelial cell.18

8
Sometimes, as with the cytosolic sub-cellular fraction, the sample is still too complex
to analyze some of the lower abundance proteins. Further separation may be required
using an HPLC method such as reverse phase, size exclusion, or ion exchange
chromatography. Another example of further fractionation would be to separate the
soluble and insoluble fractions of a closed organelle such as the nucleus or
mitochondria, which both have insoluble proteins in their membranes and soluble
proteins in their aqueous interiors. Because of the limited dynamic range of proteomic
techniques, sub-cellular fractionation can help to improve the number of proteins
identified and characterized in samples of interest.19; 20
Mass spectrometry was first conceptualized in 1897 by Sir Joseph J. Thomson.21
Since then mass spectrometry has become a versatile tool of critical importance in the
field of biological research. Mass spectrometry does not actually measure the
molecular mass of a molecule. It measures the mass/charge ratio of that species. In
order for the molecular species to be observed it must first be ionized. Some common
ionization techniques used are chemical ionization, fast atom bombardment, and
electron ionization, but for the purposes of proteomics and the analysis of most
biological samples, matrix-assisted laser desorption/ionization (MALDI) and
electrospray ionization are the most common ionization techniques used.22; 23; 24; 25; 26
These techniques are soft ionization techniques which allow the molecular species to
become charged without much non-facilitated fragmentation of the parent species.
These techniques also work well with biological samples of higher molecular masses.

9
MALDI ionization is a technique that uses a molecular matrix that can absorb energy
from a laser. A laser is directed at a cocrystallized mixture of peptides or proteins and
matrix, and the matrix absorbs the energy from the laser, causing both the matrix and
the sample to be transferred to the gas phase. The mechanism of ionization by
MALDI is not clearly understood, but the result is that the sample is ionized by H+
transfer in the plume resulting from the absorbance of the laser energy by the
matrix.22; 23; 27; 28 Once the sample is ionized in this manner it is moved through a
strong electric field to a mass analyzer (Figure 2).27; 28 Most of the ions created using
this technique are singly charged.
Unlike MADLI, in electrospray ionization the sample starts in the liquid phase rather
than the solid phase. The sample is usually placed in a denaturing acidic
aqueous/organic solution before ionization, typically in a ratio of 50:50:2 of methanol,
deionized water, and acetic acid respectively. The acetic acid aids in protonation of
the sample while the methanol aids in the evaporation of the liquid phase. If the
sample of interest is to be observed in its non-denatured state then an aqueous
solution such as ammonium bicarbonate can be used in place of the denaturing
methanol/water/acetic acid solution. Producing a fine spray of this sample
of highly charged droplets in the presence of a strong electric field creates ions of the
sample in the gas phase. A curtain of nitrogen gas helps to facilitate the evaporation
of the liquid and once the samples are ionized, the sample is moved into the mass

10
Sample Stage UV Laser
Sample Co-Crystallized
with MatrixTo MassAnalyzer
Ejected Ions
Vaporized Matrix and Sample
Figure 2: Schematic of the MALDI ionization method

11
N2 GasN2 Gas
4kV To MassAnalyzer
Ions
Evaporation of Fine Spray of Charged Droplets
Using Heat and Dry Gas
High Voltage
SampleSolution
AtmosphericPressure
LowPressure
CounterElectrode
Figure 3: Schematic of the electrospray ionization method

12
analyzer.25; 26; 29; 30 Electrospray ionization creates predominantly multiply charged
species, which allows the analysis of high molecular weight compounds normally
beyond the range of detection of the mass spectrometer.
There are two proteomic approaches that are used for the analysis of pr oteins using
mass spectrometry. The “top-down” approach involves the measurement of intact
protein masses using advanced mass spectrometers. The information obtained from
this type of analysis is often useful in the determination of post-translational
modifications of proteins. The intact proteins can then be fragmented and the peptides
resulting from this fragmentation can be analyzed to obtain sequence information
which can aid in the identification of the protein. This fragmentation is achieved by
collisional induced dissociation (CID), which will be discussed later.
The second proteomic approach used for the analysis of proteins is sometimes called
the “bottom-up” approach. In this method, intact proteins are subjected to enzymatic
digestion and/or chemical cleavage, and the resulting peptides are then characterized
using mass spectrometry. The information obtained from the analysis of these
peptides using mass spectrometry is then used for protein identification and analysis.
While the “bottom-up” technique is by far the more commonly used of the two
techniques, experiments have been performed using them in combination with one
another, integrating the strengths of each into the proteomic analysis.31
One of the more common ways to analyze proteins using the “bottom-up” method is
to digest the protein with a proteolytic enzyme and determine the molecular masses of

13
the resulting peptides using mass spectrometry. The set of peptide masses, along with
other information such as the enzyme used and the species of origin if known, is
searched against a protein database. The proteins are theoretically digested in silico
(by the computer) and the resulting sets of molecular masses are compared to the
experimental sets. From this comparison a list of possible proteins is generated with
scores and probabilities to determine the confidence of the identification.32; 33
Proteins may undergo many post-transcript processing and posttranslational
modifications, which make it difficult to predict molecular protein masses from its
corresponding genomic DNA sequences. Obtaining a peptide mass fingerprint from
proteins with post-translational modifications is still possible due to the fact that the
intact protein is cleaved into small segments that may not contain these post
translational modifications and there are usually enough unmodified peptides to
obtain an identification.
A high percentage of sequence coverage is needed to obtain a reliable peptide mass
fingerprint. In a situation where a positive identification cannot be obtained,
microsequences from a few peptides can be provided by tandem mass spectrometry
(MS/MS) for protein identification. An initial survey scan is obtained to determine
the masses of the peptides introduced into the mass spectrometer and the intensities of
their ions.

14
A peptide ion is selected from this set of peptides and allowed to pass through a mass
filter and into a collision cell while all other masses are excluded. This peptide is then
allowed to collide with an inert gas such as nitrogen or argon to confer vibrational
excitation and induce fragmentation. This procedure is called collision induced
dissociation or CID. Typically, ions are moving with low kinetic energy and the low
energy collisions produce limited fragmentation along the polyamide backbone. Most
of the fragmentation occurs at the amide bonds, with the predominant species from
this fragmentation being b ions, where the charge is retained on the N-terminal
portion of the peptide after fragmentation, and y ions, where the charge is retained on
the C-terminal portion of the peptide after fragmentation (Figure 4).
The masses of fragment ions obtained by tandem mass spectrometry provides
information about the amino acid sequence of the peptide in question. By determining
the mass difference between adjacent y or b ions, the specific amino acids which
make up the peptide can be determined (Figure 5).

15
NH2 C
H
R1
C
O
N C
H
R2
C
O
H
N C
H
R3
C
O
H
OH
x2 y2 z2 x1 y1 z1
a1 b1 c1 a2 b2 c2
NH2 C
H
R1
C
O
N C
H
R2
C
O
H
N C
H
R3
C
O
H
OHNH2 C
H
R1
C
O
N C
H
R2
C
O
H
N C
H
R3
C
O
H
OH
x2 y2 z2 x1 y1 z1
a1 b1 c1 a2 b2 c2
Figure 4: Fragmentation pattern of a theoretical tri-peptide.

16
SPDQL
y10
y9
y8y7
y6y5
y10y9y8y7y6y5
1149.6
1062.6
965.5850.5722.4609.3
m/z
Rel
ativ
e In
tens
ity
Figure 5: Tandem mass spectrum of a doubly charged peptide with an m/z of 713.36.

17
Protein identification can be obtained using this sequence information in two ways.
An amino acid sequence tag may be obtained by identifying 4 or more amino acids in
the observed peptide that are in sequence. This information, along the mass of the
parent ion, the mass of the peptide on the N-term and C-term sides of the sequence
tag, and the enzyme used for cleavage is then entered into a protein database and a list
of probable protein identifications is generated by comparison against known peptides
from this protein database. The identifications are then given with individual scores
and probabilities.33 Protein identification can also be obtained by comparing the
MS/MS fragmentation spectrum directly with theoretical MS/MS spectra generated
for peptides in a protein database. Protein identifications are then generated with
scores and probabilities as before.33 For organisms with genomes which have been
sequenced, this mass spectrometry data may be used to compare with theoretical
proteins predicted from the DNA sequence information.

18
C. Protein/Peptide Separation and Enzymatic Digestion
As protein mixtures increase in complexity, the analysis of proteins in the sample
becomes more difficult, and the likelihood of identifying or analyzing less abundant
components of these mixtures decreases. One way to overcome this obstacle is to use
some protein separation technique upstream from the mass spectrometry analysis.
Separation in this manner is based on the physical properties of individual proteins
such as size, charge, or affinity.
Historically, one of the most common ways to separate proteins is to perform an
SDS-PAGE analysis. Proteins are placed in a buffer containing 2% SDS. The SDS
both denatures the proteins and associates tightly with them and therefore gives each
protein a large negative charge. They are then loaded into wells on a polyacrylamide
gel. The gel is placed in a buffer containing SDS, and an electric current is applied to
the gel. Because all of the proteins have a net negative charge, the electric current
will separate the proteins based on their size or Stokes radii.34 By changing the
percentage of the polyacrylamide in the gel, separations may be optimized to increase
the resolution for proteins of either low, medium, or high molecular weights. A good
way to look at all protein mass ranges without sacrificing the resolution of a particular
mass range is to use a gel with a continuous or discontinuous polyacrylamide
percentage gradient such as 4-15%.
There are some drawbacks to this technique. The resolution of proteins from
complex mixtures is poor and only rudimentary separation is obtained. Proteins can

19
aggregate in the sample wells and subsequently not migrate into the gel. Membrane
proteins sometimes smear due to incomplete or heterogeneous incorporation of
SDS.35; 36; 37 Having mentioned these limitations, there are also some advantages to
this technique. The technique is well established and widely used. SDS-PAGE also
has a high loading capacity. Although membrane proteins do not migrate in well
behaved tight bands as their soluble counterparts do, separation of membrane proteins
is still attained using this technique.
Another gel-based technique is 2 dimensional gel electrophoresis (2DGE). 2DGE
separates proteins not only by their size but by their charge, or isoelectric point (pI).
The pI of a protein is the pH at which the net charge of the protein is zero. The
technique of separating proteins by their pI is called isoelectric focusing (IEF).
Membrane proteins are poorly represented when separated by 2D gel
electrophoresis.38; 39; 40 This is predominantly due to their incompatibility with the IEF
step. Membrane proteins require high concentrations of detergents to remain soluble
in solution and detergents interfere with the IEF step. Membrane proteins also tend to
precipitate at their pI and do not enter the 2nd dimension SDS-PAGE step.
Another way to separate mixtures of proteins and peptides is to use high performance
liquid chromatography (HPLC). This is a non-gel based method that can separate
proteins based on their size, charge, hydrophobicity or other physical properties.
There are two phases in HPLC; a stationary phase, and a mobile phase. The stationary
phase is made up of material that has an affinity for a particular physical or chemical

20
property of proteins. The mobile phase is made up of organic or aqueous solvents,
which flows through the stationary phase. The mobile phase is changed during the
course of the chromatographic experiment to increase or decrease the affinity of the
sample for the stationary phase. Using this technique one can separate complex
mixtures of proteins and peptides into pure components or smaller subsets that can be
more easily analyzed. Some of the more common forms of chromatography used for
the separation of proteins and peptides are size exclusion chromatography (SEC),
which separates components based on their size, ion exchange chromatography (IEC),
which separates components based on their charged state, and reverse phase
chromatography (RPC), which separates components based on their polarity.
As stated earlier, the vast majority of proteomic analyses are done using the “bottom-
up” approach. Therefore, the protein or proteins of interest must be cleaved with an
enzyme or chemical in order to obtain peptides for the mass spectrometry analysis.
One of the ways this is achieved is to first separate the proteins using some gel- based
method such as SDS-PAGE. Following protein separation, the protein or proteins are
excised from the gel using a scalpel or a robot to segment the desired area of the gel.
This can be a protein gel spot, such as one obtained from a 2D gel, or a protein gel
band, such as the type obtained from an SDS-PAGE experiment. Because of the high
resolution obtained from 2DGE, the protein gel spots usually contain only 1 protein.
Unfortunately, due to the low resolving power of SDS-PAGE, protein gel bands
obtained from SDS-PAGE gels rarely contain only 1 protein and may often contain
more than 10 depending on the size of the band excised from the gel.

21
Following the excision of the protein from the gel, the excised gel piece is then
washed several times with aqueous and organic solvents to remove any excess salts or
detergents from the gel that would interfere with the digestion process. Following this,
the gel piece is placed in a solution containing dithiothreitol to reduce disulfide bonds.
Next the gel piece is placed in a solution of iodoacetamide to alkylate the reduced
cysteines so they do not reform disulfide bonds. Following this, the gel piece is
dehydrated, and rehydrated in a solution containing the proteolytic enzyme trypsin
and allowed to incubate overnight at 37ºC. By performing this procedure, the trypsin
can enter the gel piece, bind the protein of interest and cleave the protein while it is
still embedded in the gel matrix. Peptides are recovered from the gel pieces using
acidified water and organic solvents and the extracted peptides are then analyzed by
mass spectrometry.
Another “bottom-up” strategy for the analysis of proteins using mass spectrometry is
to digest the proteins in-solution before analysis by mass spectrometry. This can be
done in two different ways. Intact proteins can be fractionated using one or more of
the chromatographic techniques mentioned earlier. These fractions can then be
digested in a buffered enzymatic solution and analyzed by mass spectrometry using
one of the previously describes methods. Complex mixtures of proteins can also be
digested without any pre-fractionation and the resulting peptides can then be
separated using one or more of the previously described chromatographic techniques.
Most commonly a 2 dimensional separation of a peptide mixture consists of an initial

22
separation by ion exchange chromatography. After that each of the fractions obtained
is then separated by reverse phase chromatography and analyzed by mass
spectrometry.41 This technique is often called “shotgun” proteomics. By using this 2
dimensional separation technique, which is sometimes automated, complex mixtures
of peptides can be resolved and many proteins identified, including some of the less
abundant ones.
Multidimensional chromatographic separation steps and analysis using mass
spectrometry can be performed separately or the liquid chromatography steps can be
coupled directly to a mass spectrometer (LC-MS). The peptides or proteins elute
directly from the liquid chromatography instrument into the mass spectrometer for
analysis and sophisticated software is used to analyze the samples in real time. This
type of analysis can be done both with proteins digested in-solution or with proteins
that have been previously separated by any gel-based method and subjected to in-gel
digestion to recover the peptides. Using LC-MS to analyze peptides recovered from
SDS-PAGE gels can allow the characterization of hundreds of proteins from a single
gel, making this a very powerful tool for analysis.

23
Chapter 2: Plasma Membrane Isolation TechniqueReproduced in part with permission from: Rahbar, A., Fenselau, C. (2004). Integration of Jacobson's Pellicle Method into Proteomic Strategies for Plasma Membrane Proteins. J Proteome Res. Web Release Date: 13-Oct-2004. Copyright 2004 American Chemical Society.
A. Membrane Protein Overview
Biological membranes are made up of lipids and proteins. These lipids form a
bilayer, with polar head groups associated with the aqueous cellular environments
and non-polar tail groups associated with each other creating a hydrophobic
environment within the membrane. There are different types of membrane proteins
associated with biological membranes. Figure 6 shows some of these: 42
• Single pass transmembrane proteins – proteins which pass from one side of
the membrane to the other once.
• Multiple pass transmembrane proteins – proteins which pass from one side
of the membrane to the other more than once.
• Lipid linked membrane proteins – proteins which have lipids covalently
linked to them which anchor the protein to the membrane.
• Peripheral membrane proteins – Proteins which are associated with the
membrane or other proteins in the membrane but are not inserted into it or
covalently bound to it.
Membrane proteins can also be combinations of these types, such as a protein
which is both lipid linked and transmembrane spanning, or proteins partially
inserted into the membrane without passing completely through to the other side.

24
Biological membranes are fluid, and membrane proteins are free to move about the
membrane.42 Membranes act as a two dimensional solvent for membrane
proteins the way the cytoplasm acts as a three dimensional solvent for soluble
proteins. In prokaryotes, the only membrane is the plasma membrane so they
contain no internal membrane organelles. Eukaryotes, on the other hand, contain
internal organelles with membranes. These internal membranes serve to
compartmentalize these structures in the cell, which have their own functions.
This dissertation outlines a method for the identification and characterization of
proteins found in the plasma membranes of cell cultures. The first step in this
analysis is the subcellular fractionation of a plasma membrane fraction. As is stated
in the previous chapter, the plasma membrane makes up only a small percentage of
the cell and its isolation can be difficult. In eukaryotes there are internal membranes
present in much higher abundances than the plasma membrane and these need to be
separated.
Subcellular fractionation before proteomic analysis can greatly increase the number
of protein identifications by simplifying the complexity of the sample used for
analysis. The cytosol is the easiest of these fractions to isolate and also the most
abundant.18 Other organelles such as the nuclei and mitochondria are easily isolated
because they comprise individual units, each of a particular size and enclosed in

25
Single PassTransmembrane
Protein
Multiple PassTransmembrane
Protein
Lipid Linked Membrane Protein
Peripheral Membrane Protein
A B
C D
Figure 6: Different types of membrane proteins

26
their own membrane and they are readily separated by centrifugation.43 Other
organelles such as the endoplasmic reticulum, the Golgi apparatus, and the plasma
membrane are more amorphous and harder to separate. Some membrane isolation
techniques recover all internal membranes together after cell lysis.44; 45 Since the
total membrane fraction constitutes a large portion of the cell volume, and the
plasma membrane makes up only a small portion of that, isolation of total
membranes will produce significant contamination of the plasma membrane by
proteins from other membranes.18
The most common ways to isolate these internal membrane structures separately is
to use density gradient centrifugation using some non-ionic gradient material such
as sucrose.43 The problem with this method is that the plasma membrane does not
always remain intact. It can take the form of open sheets and vesicles of different
sizes and may be present in many different gradient fractions recovered during the
isolation procedure.43
With the objective of obtaining a good plasma membrane sample for proteomic
analysis, we have evaluated a rarely used literature technique for the isolation of
plasma membranes, in which a pellicle is formed from cationic colloidal silica.46; 47
This technique uses a suspension of positively charged silica micro beads to coat
the exterior of cells in culture. These silica beads are electrostatically attracted to
the exterior of the plasma membranes.46 Once the cells have been covered with
silica beads, the pellicle is stabilized with long polymers of acrylic acid. This also
shields the positive charges exposed on the surface of the silica beads. After cells

27
are coated in this manner, they can be lysed and the plasma membranes are easily
isolated from the rest of the internal membranes because of the increase in their
density facilitated by the silica. We have modified the published method by addition
of washing steps after the plasma membranes have been recovered by
centrifugation.43; 48
This technique works with both suspension cells and cells which require a surface
or solid support for growth. For cells grown on surfaces, the apical and basolateral
plasma membrane domains can be isolated separately. By coating the cells still
adhered to the cell culture flask only the apical plasma membrane is exposed to the
coating solution and coated. The cells are then lysed while still attached to the
flasks. Once the cell lysate is removed, the basolateral domains remain attached to
the cell culture flask, facilitated by the structural proteins which anchor the cells to
the flask during growth. This can then be cleaned up with a series of stringent
washes, scraped off of the culture flask, and isolated by centrifugation.48

28
B. Materials and Methods
Materials
Criterion precast gels (13.3 x 8.7 cm, 12.5%, 8-16%, and 4-15%), Biosafe Coomassie
stain, 10x PBS, 10x Tris/Glycine/SDS Buffer, 10x Tris/Glycine Buffer, pre-stained
protein broad range standards, Laemmli sample buffer, nitrocellulose, and filter paper
were purchased from Bio-Rad (Hercules, CA) . MgCl2, MES, NaCl, LUDOX-CL
cationic colloidal silica, polyacrylic acid (100,000 typical molecular weight),
imidazole, Nycodenz, Na2CO3, EDTA disodium salt, protease inhibitor cocktail,
ProteoQwest Colorimetric Western Blotting Kit, mouse α-human Na/K ATPase
primary antibody, DTT, fetal calf serum, and Penicillin-Streptomycin solution were
purchased from Sigma Aldrich (St. Louis, MO). Improved Minimal Essential
Medium was purchased from American Type Culture Collection (Manassas, VA).
RPMI 1640 medium was purchased from Invitrogen (Carlsbad, CA).
Equipment
The Criterion precast gel system, Mini-PROTEAN 3 electrophoresis system, Mini
trans-blot cell, and GS-800 densitometer were purchased from Bio-Rad (Hercules,
CA).

29
Cell Culture
The human breast cancer mitoxantrone resistant cell line MCF-7 (MXR MCF-7) was
a gift from Dr. K. H. Cowan (The Eppley Institute, University of Nebraska Medical
Center, Omaha, Nebraska) and the human multiple myeloma cell line RPMI 8226
was a gift from Dr. R. Fenton (The Greenebaum Cancer Center, University of
Maryland School of Medicine, Baltimore Maryland). MXR MCF-7 cells were grown
in 150 cm2 cell culture flasks using Improved Minimal Essential Medium containing
5% fetal calf serum and antibiotics at 37°C and 5% CO2.49 RPMI 8226 cells were
grown in the same fashion but using RPMI 1640 media and heat inactivated fetal calf
serum.50
Preparation of the Plasma Membrane Fraction from Suspension Cell Cultures
Plasma membranes from RPMI 8226 were isolated using a modification of the
cationic colloidal silica plasma membrane isolation procedure used for suspension
cells.43; 46 About 1.5g wet weight RPMI 8226 cells were washed in plasma membrane
coating buffer A (PMCBA – 20 mM MES, 150 mM NaCl, 800 mM sorbitol, pH 5.3)
and placed drop-wise using a syringe and needle into a 10% suspension of cationic
colloidal silica in PMCBA. The suspension was rocked gently on ice for 15 minutes.
The silica-coated cells were then sedimented at 900g for 5 minutes to remove them
from the silica solution.

30
The silica-coated cells were then washed with PMCBA and sedimented once more at
900g for 5 minutes to remove any excess silica. The cells were then placed drop-wise,
using a syringe and needle, into a solution of 10mg/ml polyacrylic acid in PMCBA
pH 6-6.5 and placed on ice for 15 min with gentle rocking (Figure 7).
Cell Cell Cell
A B C
Figure 7. Scheme of the coating process using suspension cells. A) Uncoated suspension cell. B) Suspension cell coated with cationic silica. C) Suspension cells coated with cationic silica, followed by polyacrylic acid.

31
The cells were then washed with PMCBA, and placed in lysis buffer with protease
inhibitors (2.5mM imidazole with Sigma protease inhibitor cocktail) and left on ice
for 30 minutes to swell the cells. Cells were then lysed using nitrogen cavitation at
1500 psi. The cell lysate was spun at 900g for 30 min to sediment nuclei and silica
coated plasma membranes. The pellet was resuspended in lysis buffer, diluted with an
equal amount of 100% Nycodenz to make a 50% Nycodenz solution and layered over
70% Nycodenz. Lysis buffer was then layered onto each tube and filled to the top.
The tubes were spun at 60,000g in an SW60Ti rotor for 23 min. The silica coated
plasma membranes pellet to the bottom of the tube leaving the nuclei at the 50%/70%
Nycodenz interface (Figure 8).
The supernatant was drawn off and the silica coated plasma membrane pellets were
resuspended in lysis buffer (2.5 mM imidazole pH 7). The pellet was resuspended in
lysis buffer and centrifuged at top speed on a bench top microfuge to remove the
excess Nycodenz . The pellet was washed in this same way 2 additional times with
lysis buffer and 3 times with 100 mM Na2CO3 pH 11.4, for a total of 6 washes. The
purified plasma membrane proteins were then recovered from their silica coating by
solubilization directly in Laemmli loading buffer (Bio-Rad), incubation in a 60ºC
water bath for 30 min, sonication 5 times for 10 seconds at max setting, and
incubation in a 60ºC water bath for an additional 30 minutes. The suspension was
then spun at max speed in a bench top centrifuge for 15 min to pellet the silica
coating from the solubilized plasma membrane proteins. The supernatant, which now

32
Cell lysis Low g Spin High g Spin Over Nycodenz
Purified Plasma Membrane
Nuclei and Plasma Membrane
Nuclei
Figure 8. Scheme for the isolation of the coated plasma membranes from other cellular organelles.
33
contained the solubilized plasma membrane proteins in the Laemmli buffer, was
drawn off and stored at -80ºC and the pellet was discarded.
Preparation of the Plasma Membrane Fraction from Cell Culture Monolayers
Plasma membranes from MXR MCF-7 cells growing as monolayers were isolated
using another modified cationic colloidal silica plasma membrane isolation
procedure.43; 47 In this case the cells were coated with the silica and polyacrylic acid
while still attached to the cell culture flasks, so that all washes and cell coating
solutions were added directly to the flasks with the cells still attached and decanted
from the flasks to remove. MXR MCF-7 cells were grown to confluence in 150 cm2
cell culture flasks. The media was removed and the cells were washed twice with
PBS containing 1 mM MgCl2, and 1 mM CaCl2 and then washed with plasma
membrane coating buffer B (PMCBB - 0.5 mM CaCl2, 1 mM MgCl2, 20 mM MES,
135 mM NaCl, pH 5.3). The cells were then coated with a 5% suspension of cationic
colloidal silica in PMCBB and left on ice or on a metal surface in the cold room for 1
minute. The silica suspension was removed, followed by a wash with PMCBB to
remove excess silica. The cells were then coated with a 10mg/ml solution of
polyacrylic acid in PMCBB pH 6-6.5 and left on ice or on a metal surface in the cold
room for 1 minute. The polyacrylic acid solution was removed, followed by a wash
with PMCBB to remove any excess polyacrylic acid. The cells were washed once
quickly with lysis buffer (2.5 mM imidazole pH 7) and then lysis buffer with Sigma
protease inhibitor cocktail was added to the cell culture flasks, which are left on ice or

34
in the cold room for 30 min to swell the cells. The flasks were then placed on a bench
top and allowed to reach room temp (~15-30 min). The apical part of the plasma
membranes (the part of the plasma membrane coated by the silica and polyacrylic
acid) was sheared from rest of the cell by pipetting the lysis buffer in each flask up
and down over the cells, or by using a syringe with a long needle to spray the lysis
buffer directly onto the cells in order to apply enough shearing force to rip off the top
part of the plasma membranes (Figure 9).
At this point the apical membranes were drawn off with the pipette-aid and were
treated as described in the previous section. Following the removal of the nuclei using
the Nycodenz gradient, the silica coated plasma membrane pellet was washed 3 times
with lysis buffer. The silica coated plasma membrane sheets were then resuspended in
30 ml of 100 mM Na2CO3 pH 11.4 in a 50 ml centrifuge tube and placed in a
sonication bath for 30 minutes with vortexing every 5 minutes. The silica coated
plasma membrane sheets were pelleted at 16000g in an SW28 rotor for 30 min. The
pellet was resuspended in 30 ml of 100 mM Na2CO3 pH 11.4 in a 50 ml centrifuge
tube, sonicated as before and pelleted again in the same fashion. The pellet was then
resuspended in 1.5 ml of Na2CO3 and spun at maximum speed for 30 min in a
tabletop microfuge. The apical plasma membrane pellet was solubilized in 2% SDS,
or directly in Laemmli loading buffer and the plasma membrane proteins were
solubilized using sonication and a 60ºC water bath as described in the previous
section.

35
Cell Lysis
Wash away cell debris
Basolateral MembranesStill Attached to Cell
Culture Flask
Figure 9. Scheme for the isolation of apical and basolateral plasma membranes from cells which require a solid surface for growth.

36
At this point the basolateral plasma membranes were still attached to the cell culture
flasks. Following cell lysis, the cell culture flasks were washed once quickly with
lysis buffer and then lysis buffer with protease inhibitors was added to each flask and
left at 4ºC until the previous steps involving the isolation of the apical plasma
membrane proteins was finished. The flasks were then removed from the cold room
and incubated for 5 min at room temperature with rocking. The lysis buffer was
poured off and 5M NaCl was added to each flask and incubated for 5 min at room
temperature with rocking. The 5M NaCl was poured off and PBS containing 10 mM
EDTA was added to each flask and incubated for 5 min at room temperature with
rocking. The PBS/EDTA solution was poured off and washed once quickly with 100
mM Na2CO3, pH 11.4 to remove any excess PBS/EDTA. One hundred mM Na2CO3,
pH 11.4 was added to each flask and incubated for 5 min at room temperature with
rocking. The Na2CO3 was poured off and replaced with fresh 100 mM Na2CO3, pH
11.4 in each flask. The basolateral plasma membranes were then scraped from the
bottom of the cell culture flask using a cell scraper and spun at 14,000g in an SW28
rotor for 20 min. The purified basolateral plasma membranes pellet to the bottom of
the ultracentrifuge tubes and are then resuspended in a minimal amount of 100 mM
Na2CO3 and transferred to a 1.5 ml microfuge tube and spun at max speed in a
microfuge for 20 min to pellet the plasma membranes. The basolateral plasma
membrane pellet can then be solubilized in 2% SDS or directly in Laemmli loading
buffer and the plasma membrane proteins were further solubilized using sonication
and a 60ºC water bath as described above.

37
One Dimensional SDS-PAGE and Western Blot Analysis
For Western analysis, 25 µg of protein was loaded onto 12.5% gels and run according
to specifications using the Bio-Rad Criterion precast gel system. Following
electrophoresis, the gels were either stained using Bio-Rad Biosafe Coomassie stain
for protein visualization or left unstained. Following electrophoresis, the proteins on
the unstained gels were transferred to a nitrocellulose membrane according to
specifications using the Bio-Rad Mini-PROTEAN 3 electrophoresis system and Mini
trans-blot cell. Western blotting was done according to specifications using the Sigma
ProteoQwest Colorimetric Western Blotting Kit and an antibody against the human
Na/K ATPase was used as the primary antibody. Following electrophoresis and
western blotting, the stained gels and nitrocellulose were scanned using the Bio-Rad
GS-800 densitometer. Enrichment of the plasma membrane fractions were quantitated
from the western blot images using the ImageQuant image analysis software by
Amersham Biosciences.

38
C. Results and Discussion
Western blot experiments were performed to determine the enrichment of the plasma
membrane fractions isolated with this method using a mouse antibody against human
Na+/K+ ATPase which is a commonly used plasma membrane marker.43 The relative
enrichments of each plasma membrane fraction were determined based on the
densitometry measurement compared to that of the whole cell lysate. By this method,
plasma membranes were determined to be enriched from RPMI 8226 suspension cells
18-fold (Figure 10), from the surface bound MXR MCF-7 cells by 8 fold and 20 fold
for the apical and basolateral domains, respectively (Figure 11). Table 2 shows the
densitometry data obtained from the Image Quant program. The peak area from the
densitometry data was used to determine plasma membrane enrichment.
The addition of the wash steps following the plasma membrane isolation increased
the relative enrichment of plasma membranes when compared to the original method.
The authors of the earlier paper describing the originally published method used a cell
suspension of Dictyostelium discoideum, which is a soil living amoeba, and reported
plasma membrane enrichment levels of 15-17 fold.46 The present method
reproducibly provides enrichment levels of 18 fold from human myeloma cells
cultured in suspension.48
The enrichment of the basolateral plasma membrane was greatly increased by the
present method. The enrichment for this domain was increased 20 fold after the

39
Na+/K+ ATPase
MWLadder
WholeCell
Lysate
PlasmaMembraneFraction
Figure 10: Western analysis of RPMI 8226 whole cell lysate and the isolated plasma membrane fraction using an antibody against the Na+/K+ ATPase to determine the plasma membrane enrichment.

40
Na+/K+ ATPase
BPMFraction
MWLadder
APMFraction
1
APMFraction
2
WholeCell
Lysate
Figure 11: Western analysis of MCF7 whole cell lysate and the different isolated plasma membrane fractions using an antibody against the Na+/K+ ATPase to determine the plasma membrane enrichment.

41
A
Peak Area Height
Whole Cell Lysate 218 5
RPMI 8226 Plasma Membranes 4019 88
B
Peak Area Height
Whole Cell Lysate 138 7
Apical Plasma Membrane Fraction 2 1132 76
Basolateral Plasma Membranes 2750 115
Table 2: Densitometry data used to determine the enrichment of the isolated plasma membrane fractions relative to an unfractionated whole cell lysate. A) Data from the Multiple Myeloma cell line. B) Data from the MCF-7 cell line.

42
additional wash steps, a factor of 5 over the previously reported method. It has been
suggested that the basolateral domains, which are not covered with the silica and
polyacrylic acid, may not attract as much cytoplasmic contamination as their coated
apical counterparts do due to the electrostatic attraction to the charged silica and
polyacrylic acid.46 In addition, the basolateral plasma membrane domains are also still
bound to the cell culture flasks after cell lysis. This enables a series of stringent
washes to remove most of the unbound cytoplasmic and membrane domain
contaminants without washing away the sample. After the contaminants are removed,
the isolated basolateral plasma membrane domains are recovered from the cell culture
flasks for further analysis.
Recently a novel method for the isolation of plasma membranes has been developed,
which uses a special reagent containing a biotin subunit linked to a functional group
that reacts with primary amine groups such as those in the amino acid side chains of
arginine and lysine.51; 52 Using this technique, cell surface proteins are biotinylated
before cell lysis. After the cells have been lysed, the plasma membranes are isolated
using streptavidin immobilized on beads to capture the biotinylated proteins while
they are still embedded in the plasma membrane. Since this is done in an aqueous
environment, the membranes remain intact and the plasma membrane can be
isolated using the biotinylated proteins as anchors for the rest of the membrane.
This allows plasma membrane proteins, such as those which are only exposed to the
cytoplasmic face of the plasma membrane, to be isolated even if they were not
biotinylated as long as they are held firmly in the plasma membrane.

43
This method, termed Biotin Directed Affinity Purification (BDAP), achieved a
comparable level of enrichment as our own, based on the analysis of the proteins
identified.51 However, there are some potential drawbacks. Our method for the
isolation of plasma membranes yields both apical and basolateral domains of
adherent cell cultures, while the BDAP method only isolates the apical plasma
membrane domains. The BDAP method chemically modifies the lysine and
arginine amino acid residues of the proteins tagged with this biotin reagent. Since
these are the trypsin cleavage sites required for proteolytic digestion, there is the
possibility that this chemical modification may inhibit proteolytic cleavage at these
sites and reduce the amount of peptides recovered from tryptic digestions. Our
method involves no covalent modification of the proteins themselves. Only
electrostatic forces are used and the proteins are eventually recovered unaltered.
Although the silica method was designed for the isolation of plasma membranes from
cell culture, it should also be effective using fresh tissue samples. After dissociating
the tissue into individual cells using collagenases and other enzymes to cleave the
connective proteins between the cells one can isolate their plasma membranes by
performing the procedure as if they were suspension cell cultures.43; 53 With recent
advances in primary cell culturing techniques it is possible to isolate and culture
primary cells directly from a patient and grow them on monolayers and therefore
isolate the distinct apical and basolateral domains.15; 43; 54
44
Chapter 3: Proteomic Analysis of Plasma Membrane ProteinsReproduced in part with permission from: Rahbar, A., Fenselau, C. (2004). Integration of Jacobson's Pellicle Method into Proteomic Strategies for Plasma Membrane Proteins. J Proteome Res. Web Release Date: 13-Oct-2004. Copyright 2004 American Chemical Society.
A. Membrane Protein Analysis Overview
The objective of this portion of the experiment was to perform a “bottom-up”
proteomic analysis on the purified plasma membrane protein samples isolated from
cell cultures in the previous section. The mass spectrometry data collected in this
experiment was then used for the identification of the proteins present in that
sample. In order to achieve these results we had to devise a strategy for the
digestion of the plasma membrane proteins isolated from this fraction into
individual peptides that can subsequently be analyzed by mass spectrometry.
Although it is theoretically possible to do a “ top-down” style of analysis for the
analysis of proteins, that type of proteomic strategy has yet to be applied to the
identification of membrane proteins.38; 39 The reasons for this include the
requirement for detergents to keep the membrane proteins in solution, which
interferes with chromatographic separations and mass spectrometry ionization, and
extensive and heterogeneous carbohydrate modifications found on membrane
proteins which can significantly alter protein chemistry and diversify molecular
masses used for identification.55; 56

45
There are not as many techniques available for the use in the analysis of membrane
proteins as there are for soluble proteins. The “shotgun” approach to proteomic
analysis has had only a minimal amount of success with the analysis of membrane
proteins. This is primarily due to the fact that the solution digestion of membrane
proteins is difficult because of the incompatibility of the conditions used for
enzymatic digestions with the conditions necessary for the solubilization of
membrane proteins.57 2DGE has obtained only limited success in the separation of
membrane proteins. This is predominantly due to the inability of the IEF process to
separate membrane proteins under the conditions used to keep membrane proteins
in solution.58
Recently there has been a reappearance of the use of 1D SDS-PAGE for protein
separation and analysis, and this has been especially true in relation to the
separation of membrane proteins.59; 60 Membrane proteins can be solubilized in SDS
or Laemmli loading buffer and can subsequently be loaded directly onto SDS-
PAGE gels.48 Although the resolution of this technique is lower than 2DGE, it can
provide a basic separation of proteins by molecular weight. Once separated, the gel
bands can be excised from the gel using a razor and subjected to in-gel digestion
using some digestive enzyme such as trypsin.61 These peptides can then be
analyzed by MALDI mass spectrometry, with or without LC separations, or
electrospray mass spectrometry either by direct infusion or coupled to a liquid
chromatography delivery system. By separating the peptides by liquid
chromatography before introduction into the mass spectrometer, more peptides can

46
be analyzed from samples of complex peptide mixtures then without separation
using static infusion experiments.48
B. Materials and Methods
Materials
The Criterion precast gel system, Criterion precast gels (13.3 x 8.7 cm 4-15%),
Biosafe Coomassie stain, 10x Tris/Glycine/SDS Buffer, pre-stained protein broad
range standards, and Laemmli sample buffer were purchased from Bio-Rad (Hercules,
CA) . DTT, iodoacetamide, and TFA were purchased from Sigma Aldrich (St. Louis,
MO). NH4HCO3, formic acid, acetonitrile, acetic acid, methanol, and CaCl2 were
purchased from Fisher (Pittsburg, PA). C18 ZipTips were purchased from Millipore
(Billerica, MA). Modified porcine trypsin was purchased from Promega (Madison,
WI).
Equipment
Mass spectra were obtained using an Applied Biosystems Qstar Pulsar i (Foster City,
CA) with a nanospray ion source from Protana (Odense, Denmark). NanoLC-MS was
performed online with the LC Packings Ultimate Nano LC System (Sunnyvale, CA).
NanoES Spray capillaries and an LC-MS head with Liquid Junction were purchased
from Proxeon (Odense, Denmark). Nanospray emitters were purchased from New
Objectives (Woburn, MA).

47
One Dimensional SDS-PAGE Analysis
Between 40 and 80 µg of plasma membrane protein was loaded onto 4-15% gels and
run according to manufacturer’s specifications using the Bio-Rad Criterion precast
gel system. Following electrophoresis, the gels were stained using Bio-Rad Biosafe
Coomassie stain and the stained gels were scanned using a GS-800 densitometer from
Bio-Rad (Hercules, CA) .
Mass Spectrometry
The SDS-PAGE gel was excised into 28 gel bands and tryptic digestion was
performed on the gel slices.61 After extraction from the gel bands, the tryptic peptides
were desalted using ZipTip C18 pipette tips. The acetonitrile/TFA was removed using
a speed vac and the peptides were resuspended in electrospray ionization solution
(methanol/water/acetic acid - 50/50/2) in preparation for static infusion nanospray
MS/MS analysis, or placed in 0.1% formic acid (FA) in preparation for nanoLC-
MS/MS analysis. The tryptic peptides were analyzed by static infusion using NanoES
spray capillaries, and by online nanoLC-MS/MS. Reverse phase conditions were A:
97.5% H2O/2.5% ACN/0.1%FA, B: 97.5% ACN/2.5% H2O/0.1%FA with a 60 minute
gradient from 5%-35%B on a PepMap 75µm I.D., 15cm, 3µm, 100Å column from
LC Packings (Sunnyvale, CA).

48
Protein Identification
Each protein was identified based on sequences from two or more peptides using the
integrated Qstar software Analyst QS with Bioanalyst and ProID for the LC-MS
experiments, and the MASCOT search engine from Matrix Science for the offline
static infusion nanospray experiments.33 The peptides from the static infusion
experiments were identified with a minimum confidence level of 95%. The peptides
from the LC-MS experiments were identified with a minimum confidence level of
99.4% and were also manually sequenced from the tandem mass spectrometry data.
Figure 12 shows a scheme of the strategy used for the identification of proteins from
the plasma membrane fractions.

49
1D SDS-PAGE
Excise GelBands
In-Gel Tryptic Digest
Peptides
Tandem MassSpectrometry
Bioinformatics
MS/MSData
Protein Identification
Protein
Figure 12: Strategy for the identification of proteins isolated from the plasma membranes of cell cultures.

50
C. Results and Discussion
Proteins Identified from RPMI 8226 Multiple Myeloma Cells using Static Infusion nanospray Mass Spectrometry
Seventy five µg of plasma membrane proteins isolated from the multiple myeloma
cell line was loaded onto 4-15% polyacrylamide gels and subjected to SDS-PAGE
(Figure 13). After protein separation, the gels were stained with Coomassie blue
stain and cut horizontally into slices 3 mm wide. A total of 28 slices were excised
from the gel and subjected to in-gel tryptic digestion. The peptides were recovered
from the gel bands and placed in nanospray ionization solution and analyzed by
electrospray ionization mass spectrometry without further separation.
Figure 14 shows mass spectra obtained from the analysis of the peptides recovered
from band 14. Figure 14 A shows a survey scan of the total peptide mixture
observed from this experiment. When analyzing a complex mixture of peptides
without any type of separation it is hard to differentiate them from one another.
Even in the inset it is hard to pick out the doubly charged peptide with a m/z of
639.3. However when this peptide is selected for tandem mass spectrometry it gives
excellent fragmentation data and clear sequence tag of “FSDL” can be obtained
(Figure 14 B). The peptide was found to originate from the neutral amino acid
transporter B(0) protein (sp|Q15758).

51
Plasma Membrane Proteins Whole Cell Lysate MW(kDa)
75µg 50µg 25µg 12.5µg 25µg
250
150
100
75
50
37
25
20
15
1 2 3 4 5 6
Figure 13: SDS-PAGE gel of proteins isolated from RPMI 8226 cell cultures. Lanes 1-4 contain 75 µg - 12.5 µg of plasma membrane proteins isolated using the previously described isolation method for suspension cell cultures. The lane containing 75 µg of protein was used for protein identification experiments. Lane 5 is 25 µg of total proteins isolated from RPMI 8226 without any fractionation, and lane 6 is molecular weight standards.

52
639.3A
R A L D L F S D L V Ey8y7y6y5 y9
1049.6y9
936.5y8
821.5y7
734.4y6
587.4y5
B
Figure 14: A. Survey scan of band 14 excised from an SDS-PAGE gel containing 75 µg of plasma membrane proteins from RPMI 8226 cells. The inset is an expanded view of the 639.3 doubly charged peptide. B. MS/MS scan of the 639.3 doubly charged peptide selected for tandem mass spectrometry with the y-ions used to obtain the sequence tag labeled above each peak.
53
Each of the 28 gel bands excised from the gel was analyzed in the same manner as
described above. A total of 47 unique proteins were identified from the 28 gel bands
with a minimum of 2 peptides identified from each protein. Table 3 shows a list of
the proteins identified from these experiments that have been previously characterized
as plasma membrane proteins in the literature.
In the previous chapter we showed by Western blot analysis that the plasma
membranes from RPMI 8226 cell cultures were enriched by 18 fold when compared
to the abundance levels in the unfractionated whole cell lysate. Here we show that 20
of the 47 proteins identified from this fraction were identified as plasma membrane
proteins corresponding to 43% (Figure 15).
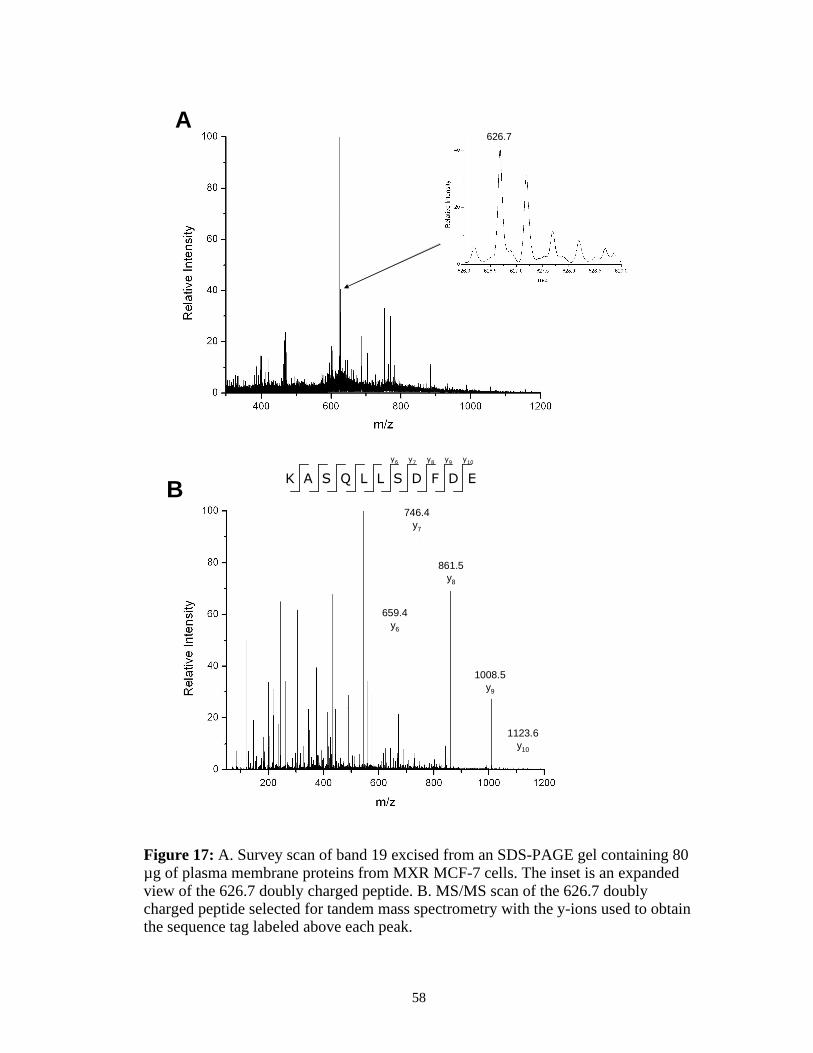
Proteins Identified from MXR MCF-7 Breast Cancer Cells using Static Infusion nanospray Mass Spectrometry
Eighty µg of plasma membrane proteins isolated from the basolateral plasma
membranes of MXR MCF-7 cell line was loaded onto 4-15% polyacrylamide gels
and subjected to SDS-PAGE and analyzed in the same manner as the myeloma cell
line (Figure 16). The basolateral plasma membrane fraction was used because the
enrichment levels were much higher than the apical plasma membrane fraction.
Figure 17 shows mass spectra obtained from the analysis of the peptides recovered

54
Accession # Protein Name
sp|P05023 Sodium/potassium-transporting ATPase alpha-1 chain precursor
sp|P08195 4F2 cell-surface antigen heavy chain
sp|Q15758 Neutral amino acid transporter B(0)
sp|P43007 Neutral amino acid transporter A (SATT)
sp|Q01650 Large neutral amino acids transporter small subunit 1
sp|Q99808 Equilibrative nucleoside transporter 1
sp|Q14242 P-selectin glycoprotein ligand 1 precursor
sp|P01891 HLA class I histocompatibility antigen, A-68 alpha chain precursor
sp|P04898 Guanine nucleotide-binding protein G(i), (Adenylate cyclase-inhibiting G alpha protein)
sp|P30685 HLA class I histocompatibility antigen, B-35 B*3505 alpha chain precursor
sp|P18827 Syndecan-1 precursor
sp|P54709 Sodium/potassium-transporting ATPase beta-3 chain
sp|P27105 Erythrocyte band 7 integral membrane protein (Stomatin)
sp|P13761 HLA class II histocompatibility antigen, DR-7 beta chain precursor
sp|P35613 Basigin precursor
sp|P01903 HLA class II histocompatibility antigen, DR alpha chain precursor
sp|P25507 Ras-related protein Rab-8
sp|P01911 HLA class II histocompatibility antigen, DW2.2/DR2.2 beta chain
sp|O88386 Ras-related protein Rab-10
sp|Q04941 Intestinal membrane A4 protein
Table 3: Plasma membrane proteins identified from RPMI 8226 multiple myeloma cells using offline static infusion nanospray mass spectrometry.

55
Plasma Membrane
Proteins, 20, 43%
All Other Proteins, 27,
57%
Figure 15: Pie chart representing the amount and percentage of plasma membrane proteins identified in comparison to the total number of proteins positively identified from the plasma membrane fraction isolated from RPMI 8226 cells.

56
from band 19. A survey scan of the peptides recovered from band 19 is shown in
Figure 17 A. The doubly charged peptide with a m/z of 626.7 was manually picked
for analysis by tandem mass spectrometry and the spectrum is shown in Figure 17 B.
The amino acid sequence tag “SDFD” can be determined from the fragmented y-ions
observed. This peptide was found to be from the plasma membrane protein 4F2 cell
surface antigen (sp|P08195).
A list of the proteins identified from the basolateral plasma membrane fraction from
the MXR MCF-7 cell cultures is shown in Table 4. Out of a total of 40 proteins
identified from this fraction, 20 were found to be plasma membrane proteins (Figure
18). Although half of the proteins identified were not localized to the plasma
membrane, this method for the isolation and analysis of plasma membrane proteins
for both suspension cells and adherent cells worked well enough to identify a
significant percentage of proteins from the plasma membrane, a subcellular fraction
which makes up only a tiny portion of the total cell content.
Proteins Identified from Mitoxantrone Resistant MCF-7 Breast Cancer Cells
using nanoLC-MS
Our objective for this portion of the experiments was to identify as many proteins as
possible that were present in the basolateral plasma membrane fraction isolated from
MXR MCF-7 cells. Inspection of the SDS-PAGE gel experiment used in the static
nanospray experiments (Figure 16), indicates more than 42 proteins present in the
sample. A strategy was developed using a liquid chromatography delivery

57
200
119
99
57
38
29
20
7
Molecular Weight(KDa)
1 2
Figure 16: SDS-PAGE gel of proteins isolated from basolateral plasma membranes from MXR MCF-7 cell cultures. Lane 1, molecular weight standards. Lane 2, 80 µg of plasma membrane proteins isolated using the previously described isolation method for adherent cell cultures.
58
626.7A
1123.6y10
1008.5y9
861.5y8
746.4y7
659.4y6
K A S Q L L S D F D Ey8y7y6 y10y9
B
Figure 17: A. Survey scan of band 19 excised from an SDS-PAGE gel containing 80 µg of plasma membrane proteins from MXR MCF-7 cells. The inset is an expanded view of the 626.7 doubly charged peptide. B. MS/MS scan of the 626.7 doubly charged peptide selected for tandem mass spectrometry with the y-ions used to obtain the sequence tag labeled above each peak.

59
Accession # Protein
sp|P17301 Integrin alpha-2 precursor (Platelet membrane glycoprotein Ia
sp|P06756 Integrin alpha-V precursor (Vitronectin receptor alpha subunit)
sp|P05023 Sodium/potassium-transporting ATPase alpha-1 chain precursor
sp|P02786 Transferrin receptor protein 2
sp|Q9UNQ0 BCRP, ATP-binding cassette, sub-family G, member 2,
sp|P08195 4F2 cell-surface antigen heavy chain
sp|Q03113 Guanine nucleotide-binding protein, alpha-12 subunit (G alpha 12) - Homo sapiens (Human).
sp|P11016 Guanine nucleotide-binding protein G(I)
sp|Q01650 Large neutral amino acids transporter small subunit 3
sp|Q00325 Phosphate carrier protein
sp|P16422 Tumor-associated calcium signal transducer 1 precursor
sp|P21796 Voltage-dependent anion-selective channel protein 1 (VDAC-1)
sp|P60033 CD81 antigen (26 kDa cell surface protein TAPA-1)
sp|P21926 CD9 antigen (P24)
sp|O15551 Claudin-3 (Clostridium perfringens enterotoxin receptor 2)
sp|P51148 Ras-related protein Rab-5C
sp|P51149 Ras-related protein Rab-7
sp|Q15286 Ras-related protein Rab-36
sp|O88386 Ras-related protein Rab-10
sp|Q9H0U4 Ras-related protein Rab-1B
sp|P09526 Ras-related protein Rap-1b
Table 4: Plasma membrane proteins identified from the basolateral region of MXR MCF-7 breast cancer cells using offline static infusion nanospray mass spectrometry.
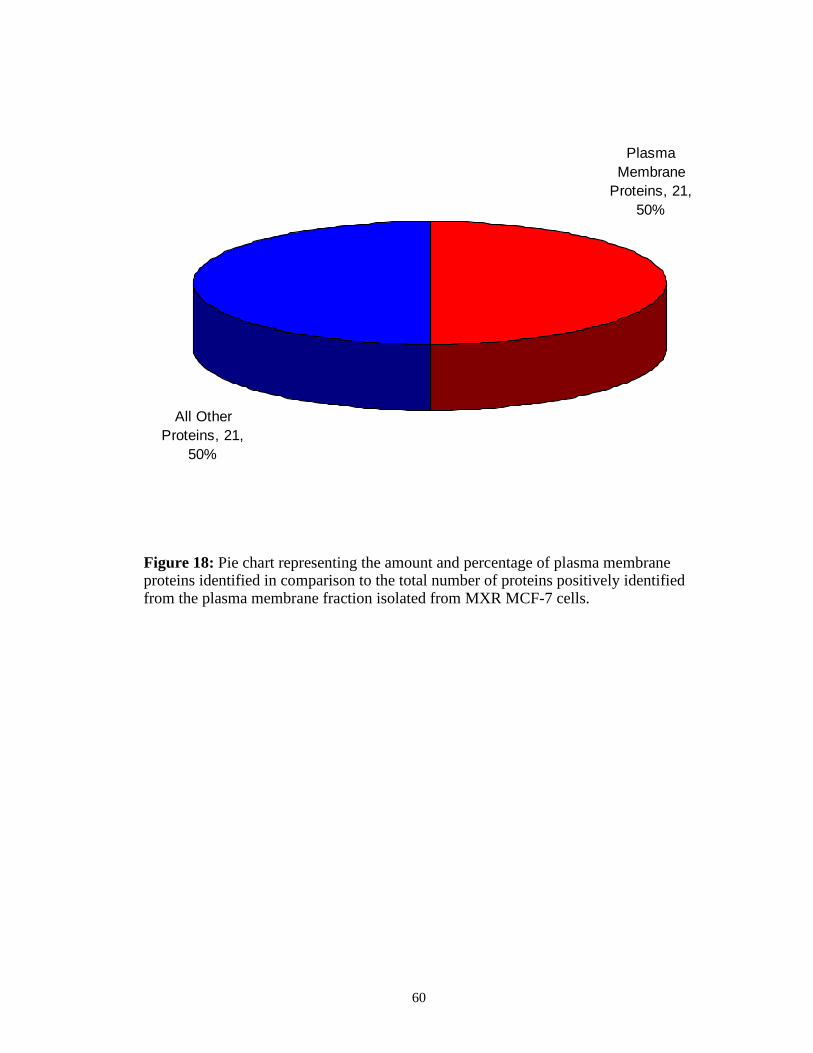
60
Plasma Membrane
Proteins, 21, 50%
All Other Proteins, 21,
50%
Figure 18: Pie chart representing the amount and percentage of plasma membrane proteins identified in comparison to the total number of proteins positively identified from the plasma membrane fraction isolated from MXR MCF-7 cells.

61
system coupled to a mass spectrometer to improve the number of protein
identifications obtained and do so in a high throughput automated way.
Forty µg of plasma membrane proteins isolated from the basolateral plasma
membranes of MXR MCF-7 cell line was loaded onto 4-15% polyacrylamide gels
and subjected to SDS-PAGE (Figure 19). Protein gel bands were digested in-gel and
the peptides were recovered as before. The proteins were then analyzed by nanoLC-
MS in the information dependent acquisition mode.
Figure 20 shows the total ion current (TIC) chromatograms from the LC-MS analysis
of bands 17 and 19. The gradient profile is from 5 to 35% solvent B over the course
of 60 min. This allows each of the peptides to be scanned individually without
interference from other ions of similar m/z values. The gradient does not begin until
10 min into the analysis and there is approximately 7 min of dead volume between
the column and the mass spectrometer. The spike in the TIC at 17 min shows the
switch in solvent flow from the desalting pre-column to the reverse phase nano-
column and represents the beginning of the 60 min gradient (10 min of sample
equilibration and desalting + 7 min of dead volume). The gradient is then finished at
77 min on the TIC. At 77 min, only a few of the extremely large hydrophobic
peptides have yet to be released from the column and they eluted during the period of
time after this where the solvent B concentration is ramped to 95 %. Most of the
peptides have eluted from the column at 35% solvent B and it is not necessary to run
the gradient to 50% solvent B or higher.

62
A B
200
119
99
57
38
2920
7
Molecular Weight(KDa)
1 2 3
Figure 19: SDS-PAGE gel of proteins isolated from basolateral plasma membranes from MXR and drug susceptible MCF-7 cell cultures. Lane 1 – Molecular weight standards. Lane 2 – 40 µg plasma membrane proteins from MXR MCF-7 cells. Lane 3 – mixture of 20 µg plasma membrane proteins from MXR MCF-7 cells and 20 µg plasma membrane proteins from the drug susceptible MCF-7 cells

63
A
B
Figure 20: Total ion current (TIC) of the LC-MS experiment using A. peptides extracted from band 17 of the MXR MCF-7 SDS-PSGE gel and B. peptides extracted from band 19 of the MXR MCF-7 SDS-PSGE gel.

64
The chromatography performed using the LC-Packing system has excellent resolving
capability with peak widths of 1 min or less. This provides good signal intensity,
however the tandem mass spectrometry data must be collected as fast as possible to
obtain multiple peptide mass measurements. The computer performs a 1 second
survey scan to identify the m/z and charge states of the peptides to be analyzed,
followed by 3 MS/MS scans of 3 seconds/scan on the 3 most intense doubly or triply
charged peptides present. Therefore 1 cycle of this process spans 10 seconds. Once a
MS/MS mass measurement is made on a peptide of a particular m/z value, that
particular mass is ignored for 1 minute to make sure that the same 3 most intense
peaks do not get picked repeatedly while some of the less intense peaks get ignored.
This process is commonly called dynamic exclusion.
Figure 21 shows 1 min survey scans from bands 17 and 19. In each of these cases
the peaks are well resolved with little overlap due to the chromatographic
separation upstream from the mass spectrometry analysis. The doubly and triply
charged peptides are selected from these survey scans for 3 second MS/MS scans
with minimal repetition as explained above. The insets of Figure 21 A and B show
the expanded views of these survey scans focusing on the 585.8 and 644.8 doubly
charged peptides.
Due to the limited time window in which peptides eluting from columns can be
analyzed by the mass spectrometer in LC-MS experiments, computer automation has
become a major factor in the data collection during these types of experiments.

65
585.8
A
644.8
B
Figure 21: A. Survey scan of the band 17 LC-MS experiment from 53 to 54 min with expanded view if the doubly charged 644.8 peptide in the inset spectrum. B. Survey scan of the band 19 LCMS experiment from 47.5 to 48.5 min with expanded view if the doubly charged 644.8 peptide in the inset spectrum.

66
The software used can quickly differentiate between the doubly and triply charged
peptides, which generate MS/MS spectrum useful for protein identification, and the
peptides of higher charges, which generate less information rich spectrum and are
harder to analyze. These programs can also exclude peaks corresponding to non-
peptide species. This ability to differentiate between these types of molecular ions
allows the mass spectrometer to collect data more efficiently and therefore increase
the chances for protein identifications.
Computer software is not only critical for the acquisition of data during LC-MS
experiments but computer algorithms are also indispensable for the analysis of the
data acquired. Liquid chromatography mass spectrometry experiments can generate
enormous amounts of data, and especially in the case of a shotgun analysis where
proteins are digested before any protein separation is performed, many peptides
from the same protein can be separated across many different fractions.
Commercial programs can analyze the LC-MS data and recompile it into a list of
proteins identified from several different experiments.
These automated analyses use sophisticated computer algorithms to obtain protein
identifications by comparing the experimental MS/MS fragmentation data with the
theoretical MS/MS fragmentation data of peptides generated from proteins in a
protein database. This MS/MS ion search combined with any additional information,
such as the parent peptide molecular weight, the particular enzyme used for the

67
digestion, and species information, if available, is then used to identify which
protein the peptide originated from.
Another factor which helps in the automated identification process is the
identification of immonium ions in the spectrum. Immonium ions are formed by the
multiple cleavages within the peptide. Each contains an amino group and a side
chain from an amino acid residue in the peptide. While this information does not
help in identifying the primary sequence of the peptide, each immonium ion reveals
the presence of its parent amino acid and consequently aids in the peptide
identifications by corroborating the presence of the amino acid in the sequence of
the peptide.
About 10,000 MS/MS scans were performed on peptides automatically selected in
the LC-MS experiments on the peptides recovered from the in-gel digestion on the
28 gel bands. Figures 22 and 23 show the results of the automated identification
from the 585.8 and 644.8 doubly charged peptides shown in Figures 21 A and B
from bands 17 and 19 respectively.
The upper panes of Figures 22 and 23 show the actual MS/MS fragmentation data
while the lower panes show theoretical fragmentation data from the peptide
tentatively identified using the seven ions that occur most frequently when activated
by low energy multiple collisions. The numbered values are the expected ions
present based on the identification assigned by the program and the numbers

68
Figure 22: Automated sequence identification of the doubly charged peptide 585.8 from band 17 using the integrated Analyst QS software with ProID. Fragment ions matching the theoretical fragmentation data are highlighted in yellow.

69
Figure 23: Automated sequence identification of the doubly charged peptide 644.8 from band 19 using the integrated Analyst QS software with ProID. Fragment ions matching the theoretical fragmentation data are highlighted in yellow.

70
highlighted in yellow denote experimental values which correspond to theoretical
values. The predominant species present in the fragmentation data of most of these
experiments are the b- and y-ions. The resulting peptide identities are assigned
probability scores in the form of confidence percentages.
The practical application of this technology still requires human interpretation of
the resulting automated data analysis. This automated analysis of LC-MS data can
propose multiple protein identifications and a set of parameter restrictions must be
set to filter out the lower probability hits. All low scoring peptide sequences and
proteins identified from only 1 peptide identification were excluded from the list of
proteins identified, no mater what the peptide confidence score. By including only
peptide identifications of high confidence and only counting protein identifications
based on 2 or more peptides we can greatly reduce the number of false positives.
In addition, each protein identification was manually checked. Peptide sequence
tags were used to manually validate the identity of each of the proteins identified.
An example of this procedure is shown in Figure 24 A and B. The same peptides
analyzed using the m/z 585.8 and 644.8 doubly charged ions from bands 17 and 19
were sequenced manually as is shown in the Figure. The amino acid sequence tags
“SLLL” and “VSNQ” were identified from the y-ion sequence information and this
data, along with the name of the enzyme used in the protein cleavage and the parent
peptide mass, were used to identify the peptides, and subsequently the proteins they
came from. The m/z 585.8 peptide was found to be from the 4F2 cell-surface

71
984.5y9
871.5y8
758.4y7
645.2y6
558.3y5
R G P Q T S L L L D Ay8y7y6y5 y9
A
K D V I I V S N Q A S Dy8y7y6y5 y9
1015.5y9
887.4y8
773.4y7
686.4y6
587.3y5
B
Figure 24: A. Amino acid sequence tag “SLLL” obtained manually by sequencing the y5 to y9 fragment ions from the 585.8 peptide from band 17. B. Amino acid sequence tag “VSNQ” obtained manually by sequencing the y5 to y9 fragment ions from the 644.8 peptide from band 19.
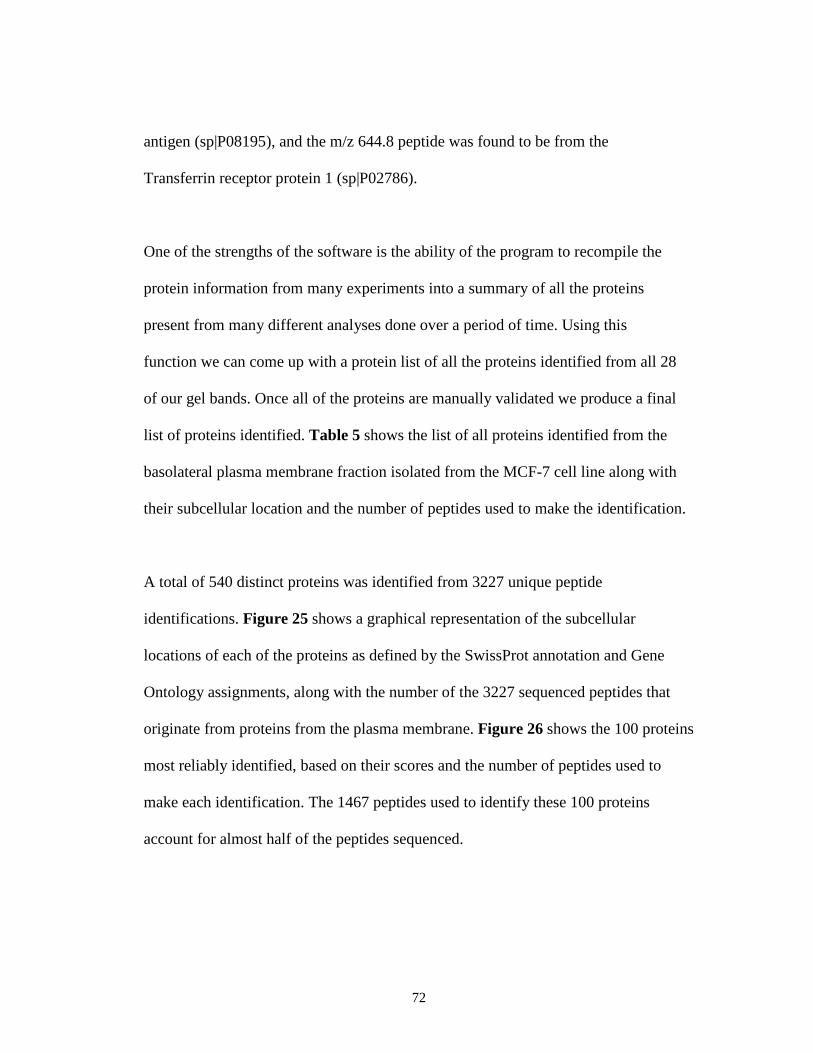
72
antigen (sp|P08195), and the m/z 644.8 peptide was found to be from the
Transferrin receptor protein 1 (sp|P02786).
One of the strengths of the software is the ability of the program to recompile the
protein information from many experiments into a summary of all the proteins
present from many different analyses done over a period of time. Using this
function we can come up with a protein list of all the proteins identified from all 28
of our gel bands. Once all of the proteins are manually validated we produce a final
list of proteins identified. Table 5 shows the list of all proteins identified from the
basolateral plasma membrane fraction isolated from the MCF-7 cell line along with
their subcellular location and the number of peptides used to make the identification.
A total of 540 distinct proteins was identified from 3227 unique peptide
identifications. Figure 25 shows a graphical representation of the subcellular
locations of each of the proteins as defined by the SwissProt annotation and Gene
Ontology assignments, along with the number of the 3227 sequenced peptides that
originate from proteins from the plasma membrane. Figure 26 shows the 100 proteins
most reliably identified, based on their scores and the number of peptides used to
make each identification. The 1467 peptides used to identify these 100 proteins
account for almost half of the peptides sequenced.

73
Accession # Protein Name Location # of Peptidessp|Q00610 Clathrin heavy chain 1 PM 54sp|P06756 Integrin alpha-V precursor PM 40sp|P05023 Sodium/potassium-transporting
ATPase alpha-1 chainPM 38
sp|P08195 4F2 cell-surface antigen heavy chain PM 33tr|O75054 Hypothetical protein KIAA0466 Hypo Memb 32sp|P02786 Transferrin receptor protein 1 PM 31sp|P20020 Plasma membrane calcium-
transporting ATPase 1PM 31
sp|P17301 Integrin alpha-2 precursor PM 29sp|P05787 Keratin, type II cytoskeletal 8 Cytoskeleton 27sp|P18084 Integrin beta-5 precursor PM 27tr|Q9UIU0 Dihydropyridine receptor alpha 2
subunitPM 25
sp|P13639 Elongation factor 2 (EF-2) Cytoplasm 23tr|Q8IX16 ATP-binding cassette protein ABCG2 PM 23sp|P54760 Ephrin type-B receptor 4 precursor PM 21sp|P10586 LAR protein precursor PM 20sp|Q9P2B2 Prostaglandin F2 receptor negative
regulator precursorPM 20
sp|P05218 Tubulin beta-5 chain Cytoskeleton 19sp|Q9NZM1 Myoferlin PM 19sp|O95782 Adapter-related protein complex 2
alpha 1 subunitPM 18
sp|P05141 ADP,ATP carrier protein, fibroblast isoform
PM 18
sp|Q14254 Flotillin-2 PM 18tr|Q7Z3V1 Hypothetical protein DKFZp686D0452 Hypo Memb 17sp|P01031 Complement C5 precursor Secreted 16sp|P05217 Tubulin beta-2 chain Cytoskeleton 16sp|P08069 Insulin-like growth factor I receptor
precursorPM 16
sp|P12236 ADP,ATP carrier protein, liver isoform T2
Mitochondria 16
sp|P13645 Keratin, type I cytoskeletal 10 Cytoskeleton 16sp|P55011 Solute carrier family 12 member 2 PM 16sp|O15394 Neural cell adhesion molecule 2
precursorPM 15
sp|P04843 Dolichyl-diphosphooligosaccharide--protein glycosyltransferase 67 kDa subunit
ER 15
sp|P05783 Keratin, type I cytoskeletal 18 Cytoskeleton 15sp|P14618 Pyruvate kinase, M1 isozyme Cytoplasm 15sp|P21851 Adapter-related protein complex 2
beta 1 subunit PM 15
sp|P04626 Receptor protein-tyrosine kinase erbB-2 precursor
PM 14
sp|P04895 Guanine nucleotide-binding protein PM 14

74
Accession # Protein Name Location # of PeptidesG(S), alpha subunit
sp|P04899 Guanine nucleotide-binding protein G(i), alpha-2 subunit
PM 14
sp|P50993 Sodium/potassium-transporting ATPase alpha-2 chain
PM 14
sp|Q16720 Plasma membrane calcium-transporting ATPase 3
PM 14
tr|Q14433 Guanine nucleotide-binding protein G-s-alpha-3
PM 14
tr|Q8TBC0 Similar to GNAS complex locus PM 14sp|O00159 Myosin Ic Cytoplasm 13sp|P04264 Keratin, type II cytoskeletal 1 Cytoskeleton 13sp|P07900 Heat shock protein HSP 90-alpha Cytoplasm 13sp|P27105 Erythrocyte band 7 integral membrane
proteinPM 13
sp|P35908 Keratin, type II cytoskeletal 2 epidermal
Cytoskeleton 13
tr|Q8IWA5 CTL2 protein PM 13tr|Q9UIW2 NOV/plexin-A1 protein PM 13sp|O94973 Adapter-related protein complex 2
alpha 2 subunitPM 12
sp|P01024 Complement C3 precursor Secreted 12sp|P05209 Tubulin alpha-1 chain Cytoskeleton 12sp|P12235 ADP,ATP carrier protein, heart PM 12sp|P24539 ATP synthase B chain, mitochondrial
precursorMitochondria 12
sp|P27824 Calnexin precursor ER 12sp|P51148 Ras-related protein Rab-5C PM 12sp|Q13740 CD166 antigen precursor PM 12sp|Q9BQE3 Tubulin alpha-6 chain Cytoskeleton 12sp|Q9UL26 Ras-related protein Rab-22A PM 12sp|Q92508 Hypothetical protein KIAA0233 Hypo Memb 12tr|Q8WWI5 Choline transporter-like protein 1,
splice variant aPM 12
sp|P02304 Histone H4 Nuclei 11sp|P06576 ATP synthase beta chain,
mitochondrial precursorMitochondria 11
sp|P08238 Heat shock protein HSP 90-beta Cytoplasm 11sp|P08727 Keratin, type I cytoskeletal 19 Cytoskeleton 11sp|P20172 Clathrin coat assembly protein AP50 PM 11sp|P51149 Ras-related protein Rab-7 PM 11tr|Q9ULH0 Hypothetical protein KIAA1250 Hypo Memb 11sp|O88386 Ras-related protein Rab-10 PM 10sp|P02570 Actin, cytoplasmic 1 Cytoskeleton 10sp|P21796 Voltage-dependent anion-selective
channel protein 1PM 10
sp|P35287 Ras-related protein Rab-14 PM 10sp|Q9H0U4 Ras-related protein Rab-1B PM 10tr|Q16702 Fatty acid synthase Cytoplasm 10tr|Q8TD43 Cation channel TRPM4B PM 10

75
Accession # Protein Name Location # of Peptidestr|Q99623 B-cell receptor associated protein Cytoplasm 10sp|O00161 Synaptosomal-associated protein 23 PM 9sp|P01111 Transforming protein N-Ras PM 9sp|P01112 Transforming protein p21 PM 9sp|P04844 Dolichyl-diphosphooligosaccharide--
protein glycosyltransferase 63 kDa subunit
ER 9
sp|P05026 Sodium/potassium-transporting ATPase beta-1 chain
PM 9
sp|P05215 Tubulin alpha-4 chain Cytoskeleton 9sp|P06733 Alpha enolase Cytoplasm 9sp|P08754 Guanine nucleotide-binding protein
G(k), alpha subunit (G(i) alpha-3)PM 9
sp|P20339 Ras-related protein Rab-5A PM 9sp|P25705 ATP synthase alpha chain,
mitochondrial precursorMitochondria 9
sp|P35527 Keratin, type I cytoskeletal 9 Cytoskeleton 9sp|Q15758 Neutral amino acid transporter B(0)
(ATB(0))PM 9
sp|Q8TAA9 Vang-like protein 1 PM 9sp|Q9UJS0 Calcium-binding mitochondrial carrier
protein Aralar2PM 9
sp|P17082 Ras-related protein R-Ras2 PM 9sp|P11717 Cation-independent mannose-6-
phosphate receptor precursor PM 8
sp|O75955 Flotillin-1 PM 8sp|P04406 Glyceraldehyde 3-phosphate
dehydrogenase, liverCytoplasm 8
sp|P08886 Ras-related protein Rab-2A PM 8sp|P11142 Heat shock cognate 71 kDa protein Cytoplasm 8sp|P15154 Ras-related C3 botulinum toxin
substrate 1PM 8
sp|P16422 Tumor-associated calcium signal transducer 1 precursor
PM 8
sp|P16587 ADP-ribosylation factor 3 PM 8sp|P22392 Nucleoside diphosphate kinase B Nuclei 8sp|P24410 Ras-related protein Rab-11A PM 8sp|P26438 ADP-ribosylation factor 6 PM 8sp|P29316 60S ribosomal protein L23a Ribosome 8sp|P35232 Prohibitin Cytoplasm 8sp|P48669 Keratin, type II cytoskeletal 6F Cytoskeleton 8sp|P54709 Sodium/potassium-transporting
ATPase beta-3 chainPM 8
sp|Q00325 Phosphate carrier protein, mitochondrial precursor
PM 8
sp|Q02978 Mitochondrial 2-oxoglutarate PM 8sp|Q8WTV0 Scavenger receptor class B member 1 PM 8sp|Q9NP72 Ras-related protein Rab-18 PM 8sp|Q9UIQ6 Leucyl-cystinyl aminopeptidase PM 8tr|Q14160 Hypothetical protein KIAA0147 Hypothetical 8

76
Accession # Protein Name Location # of Peptidestr|Q86X29 Similar to liver-specific bHLH-Zip
transcription factorHypo Memb 8
tr|Q8NE01 Cyclin M3 Membrane 8tr|Q96AG4 Hypothetical protein (Similar to
expressed sequence AA959742)Hypo Memb 8
tr|Q9HCI0 Hypothetical protein KIAA1592 Hypo Memb 8sp|Q9Y5L3 Ectonucleoside triphosphate
diphosphohydrolase 2PM 8
sp|P07947 Proto-oncogene tyrosine-protein kinase YES
PM 8
sp|Q14204 Dynein heavy chain, cytosolic Cytoplasm 8sp|P21333 Filamin A Cytoskeleton 7sp|O14672 ADAM 10 precursor PM 7sp|P02278 Histone H2B.a Nuclei 7sp|P02568 Actin, alpha skeletal muscle Cytoskeleton 7sp|P04765 Eukaryotic initiation factor 4A-I Cytoplasm 7sp|P04920 Anion exchange protein 2 PM 7sp|P06749 Transforming protein RhoA PM 7sp|P06899 Histone H2B.r Nuclei 7sp|P08107 Heat shock 70 kDa protein 1 Cytoplasm 7sp|P08133 Annexin A6 Cytoplasm 7sp|P09525 Annexin A4 Cytoplasm 7sp|P17964 Ras-related protein Rap-2b PM 7sp|P18085 ADP-ribosylation factor 4 PM 7sp|P20340 Ras-related protein Rab-6A PM 7sp|P20648 Potassium-transporting ATPase alpha
chain 1PM 7
sp|P23396 40S ribosomal protein S3 Ribosome 7sp|P29312 14-3-3 protein zeta Cytoplasm 7sp|P33527 Multidrug resistance-associated
protein 1PM 7
sp|P35239 Ras-related protein Rab-5B PM 7sp|P42167 Thymopoietin, isoforms beta Nuclei 7sp|P50895 Lutheran blood group glycoprotein
precursorPM 7
sp|P54753 Ephrin type-B receptor 3 precursor PM 7sp|P56159 GDNF family receptor alpha 1
precursorPM 7
sp|Q01650 Large neutral amino acids transporter small subunit 1
PM 7
sp|Q13308 Tyrosine-protein kinase-like 7 precursor
PM 7
sp|Q14126 Desmoglein 2 precursor PM 7sp|Q15907 Ras-related protein Rab-11B PM 7sp|Q9H9B4 Sideroflexin 1 Mitochondria 7sp|Q9Y277 Voltage-dependent anion-selective
channel protein 3Mitochondria 7
sp|Q9Y5M8 Signal recognition particle receptor beta subunit
ER 7
tr|O00648 Protein tyrosine phosphatase Hypothetical 7

77
Accession # Protein Name Location # of PeptidesPTPCAAX1
tr|O94980 Hypothetical protein KIAA0906 Hypo Memb 7tr|Q07065 P63 protein Membrane 7tr|Q7Z7Q4 Tumor-associated calcium signal
transducer 2PM 7
tr|Q8NFA6 Transmembrane receptor PTK7-4 PM 7tr|Q96QB2 Sodium-independent neutral amino
acid transporter LAT1PM 7
tr|Q9Y6C9 HSPC032 (Mitochondrial carrier homolog 2)
Membrane 7
sp|P02649 Apolipoprotein E precursor Secreted 7sp|P10643 Complement component C7 precursor Secreted 7sp|P10113 Ras-related protein Rap-1A PM 7sp|Q06830 Peroxiredoxin 1 Cytoplasm 7sp|P07358 Complement component C8 beta
chain precursorSecreted 7
sp|O43570 Carbonic anhydrase XII precursor PM 6sp|O60716 Catenin delta-1 Cytoplasm 6sp|O75947 ATP synthase D chain, mitochondrial Mitochondria 6sp|O95858 Tetraspan NET-7 PM 6sp|P00403 Cytochrome c oxidase polypeptide II Mitochondria 6sp|P04075 Fructose-bisphosphate aldolase A Cytoplasm 6sp|P06744 Glucose-6-phosphate isomerase Cytoplasm 6sp|P07355 Annexin A2 PM 6sp|P11016 Guanine nucleotide-binding protein
G(I)PM 6
sp|P11476 Ras-related protein Rab-1A PM 6sp|P12259 Coagulation factor V precursor Secreted 6sp|P23528 Cofilin, non-muscle isoform Cytoskeleton 6sp|P39656 Dolichyl-diphosphooligosaccharide--
protein glycosyltransferase 48 kDa subunit
ER 6
sp|P45880 Voltage-dependent anion-selective channel protein 2
Mitochondria 6
sp|P49411 Elongation factor Tu, mitochondrial precursor
Mitochondria 6
sp|P49755 Transmembrane protein Tmp21 precursor
PM 6
sp|P50395 Rab GDP dissociation inhibitor beta PM 6sp|Q07020 60S ribosomal protein L18 Ribosome 6sp|Q12907 Vesicular integral-membrane protein
VIP36 precursorER 6
sp|Q14344 Guanine nucleotide-binding protein, alpha-13 subunit
PM 6
sp|Q92542 Nicastrin precursor PM 6sp|Q9UL25 Ras-related protein Rab-21 PM 6sp|Q9Y4D1 Disheveled associated activator of
morphogenesis 1Cytoplasm 6
tr|Q8NBN5 Thioredoxin domain containing protein 1
PM 6

78
Accession # Protein Name Location # of Peptidestr|Q9BTT5 Similar to NADH dehydrogenase Mitochondria 6tr|Q9Y639 Stromal cell-derived receptor-1 alpha PM 6sp|P54707 Potassium-transporting ATPase alpha
chain 2PM 6
sp|Q08211 ATP-dependent RNA helicase A Nuclei 6sp|P08758 Annexin A5 PM 6sp|O43278 Kunitz-type protease inhibitor 1
precursorSecreted 6
sp|P09526 Ras-related protein Rap-1b PM 6sp|P23284 Peptidyl-prolyl cis-trans isomerase B
precursorER 6
sp|Q9Y4W6 AFG3-like protein 2 Mitochondria 6sp|P26006 Integrin alpha-3 precursor PM 6sp|P07339 Cathepsin D precursor Cytoplasm 6tr|Q7Z341 Hypothetical protein
DKFZp686J08113Hypo Memb 5
sp|O14662 Syntaxin 16 (Syn16) Golgi 5sp|O95292 Vesicle-associated membrane protein-
associated proteinPM 5
sp|O95716 Ras-related protein Rab-3D PM 5sp|P04901 Guanine nucleotide-binding protein
G(I)PM 5
sp|P07996 Thrombospondin 1 precursor PM 5sp|P10301 Ras-related protein R-Ras PM 5sp|P10809 60 kDa heat shock protein,
mitochondrial precursorMitochondria 5
sp|P15880 40S ribosomal protein S2 Ribosome 5sp|P18124 60S ribosomal protein L7 Ribosome 5sp|P21926 CD9 antigen PM 5sp|P24407 Ras-related protein Rab-8 PM 5sp|P25388 Guanine nucleotide-binding protein
beta subunit-like protein 12.3PM 5
sp|P26641 Elongation factor 1-gamma Cytoplasm 5sp|P29992 Guanine nucleotide-binding protein
G(Y), alpha subunitPM 5
sp|P35221 Alpha-1 catenin Cytoskeleton 5sp|P35238 Rho-related GTP-binding protein
RhoGPM 5
sp|P35613 Basigin precursor PM 5sp|P50148 Guanine nucleotide-binding protein
G(q), alpha subunitPM 5
sp|P50443 Sulfate transporter PM 5sp|P51153 Ras-related protein Rab-13 PM 5sp|P51571 Translocon-associated protein, delta
subunit precursorER 5
sp|P51805 Plexin A3 precursor PM 5sp|P60033 CD81 antigen PM 5sp|Q99808 Equilibrative nucleoside transporter 1 PM 5sp|Q9UBM7 7-dehydrocholesterol reductase ER 5sp|Q9Y512 SAM50-like protein CGI-51 Mitochondria 5

79
Accession # Protein Name Location # of Peptidessp|Q9Y5Y6 Suppressor of tumorigenicity 14 PM 5sp|Q9Y624 Junctional adhesion molecule 1
precursorPM 5
sp|Q9Y666 Solute carrier family 12 member 7 PM 5tr|O75396 Vesicle trafficking protein SEC22B ER 5tr|O75870 PTPsigma Cytoplasm 5tr|Q7Z5X0 Semaphorin 4C PM 5tr|Q8IXI1 Rho 2 Mitochondria 5tr|Q8N271 Hypothetical protein FLJ33856 Hypo Memb 5tr|Q8NC51 Hypothetical protein FLJ90489 Hypothetical 5tr|Q8NCB6 Hypothetical protein FLJ90368 Hypo Memb 5tr|Q8NI87 Phosphoglycerete kinase 1 Cytoplasm 5tr|Q9BTZ7 Hypothetical protein Hypothetical 5tr|Q9NX63 Hypothetical protein FLJ20420 Hypothetical 5tr|Q9UEI6 Polio virus related protein 2, alpha
isoformPM 5
sp|O15440 Multidrug resistance-associated protein 5
PM 5
sp|P09058 40S ribosomal protein S8 Ribosome 5sp|P11413 Glucose-6-phosphate 1-
dehydrogenaseCytoplasm 5
sp|P26373 60S ribosomal protein L13 (Breast basic conserved protein 1)
Ribosome 5
sp|P27348 14-3-3 protein tau Cytoplasm 5sp|P46781 40S ribosomal protein S9 Ribosome 5sp|Q08722 Leukocyte surface antigen CD47
precursorPM 5
sp|Q8WXE9 Stonin 2 PM 5tr|Q8TE01 DERP12 Cytoplasm 5tr|Q9BSY2 C9orf89 protein Hypo Memb 5tr|Q9NVJ2 Hypothetical protein FLJ10702 Hypo Memb 5sp|P07360 Complement component C8 gamma
chain precursorSecreted 5
sp|P12931 Proto-oncogene tyrosine-protein kinase Src
PM 5
sp|P42655 14-3-3 protein epsilon Cytoplasm 5sp|Q86UP2 Kinectin ER 5sp|Q9NRW1 Ras-related protein Rab-6B PM 5tr|Q7YCE6 Cytochromec oxidase subunit II Mitochondria 5sp|P00354 Glyceraldehyde 3-phosphate
dehydrogenase, muscleCytoplasm 5
sp|P04720 Elongation factor 1-alpha 1 Cytoplasm 5sp|P21378 Microsomal signal peptidase 18 kDa
subunitPM 5
sp|P29317 Ephrin type-A receptor 2 precursor PM 5sp|Q05639 Elongation factor 1-alpha 2 Nuclei 5tr|Q9BTS0 Hypothetical protein Hypo Memb 5sp|P00338 L-lactate dehydrogenase A chain Cytoplasm 5sp|P51531 Possible global transcription activator
SNF2L2Nuclei 5

80
Accession # Protein Name Location # of Peptidessp|O00264 Membrane associated progesterone
receptor component 1PM 4
sp|O15439 Multidrug resistance-associated protein 4
PM 4
sp|O15551 Claudin-3 PM 4sp|O95471 Claudin-7 PM 4sp|P01121 Transforming protein RhoB PM 4sp|P02261 Histone H2A.c Nuclei 4sp|P02748 Complement component C9 precursor PM 4sp|P02768 Serum albumin precursor Secreted 4sp|P04792 Heat shock 27 kDa protein Cytoplasm 4sp|P11021 78 kDa glucose-regulated protein
precursorER 4
sp|P11166 Solute carrier family 2, facilitated glucose transporter, member 1
PM 4
sp|P13671 Complement component C6 precursor Secreted 4sp|P15559 NAD(P)H dehydrogenase 1 Cytoplasm 4sp|P20337 Ras-related protein Rab-3B PM 4sp|P20700 Lamin B1 Nuclei 4sp|P22087 Fibrillarin Nuclei 4sp|P22102 Trifunctional purine biosynthetic
protein adenosine-3 Cytoplasm 4
sp|P30050 60S ribosomal protein L12 Ribosome 4sp|P31930 Ubiquinol-cytochrome C reductase
complex core protein IMitochondria 4
sp|P34897 Serine hydroxymethyltransferase, mitochondrial precursor
Mitochondria 4
sp|P48735 Isocitrate dehydrogenase [NADP], mitochondrial precursor
Mitochondria 4
sp|P50991 T-complex protein 1, delta subunit Cytoplasm 4sp|P57088 DB83 protein Hypo Memb 4sp|Q04721 Neurogenic locus notch homolog
protein 2 precursorPM 4
sp|Q13724 Mannosyl-oligosaccharide glucosidase ER 4sp|Q14118 Dystroglycan precursor PM 4sp|Q14165 Hypothetical protein KIAA0152 Hypo Memb 4sp|Q15005 Microsomal signal peptidase 25 kDa
subunitPM 4
sp|Q15836 Vesicle-associated membrane protein 3
PM 4
sp|Q16625 Occludin - Homo sapiens (Human). PM 4sp|Q8NB49 Potential phospholipid-transporting
ATPase IGPM 4
sp|Q9HDC9 Adipocyte plasma membrane-associated protein
PM 4
tr|O15498 SNARE protein Ykt6 PM 4tr|O60376 P1.11659_4 Hypo Memb 4tr|Q14980 Nuclear mitotic apparatus protein 1 Nuclei 4tr|Q7Z3X1 Hypothetical protein
DKFZp686A18156Hypo Memb 4

81
Accession # Protein Name Location # of Peptidestr|Q7Z7A6 PPR motif-containing protein Mitochondria 4tr|Q8IUI5 Similar to butyrate-induced transcript 1 Hypo Memb 4tr|Q96E39 Similar to RNA binding motif protein, X
chromosomeNuclei 4
tr|Q96FY2 Stomatin-like 2 PM 4tr|Q9H8M5 Hypothetical protein FLJ13417 Hypo Memb 4sp|O75695 XRP2 protein Cytoplasm 4sp|P01118 Transforming protein p21b PM 4sp|P06213 Insulin receptor precursor PM 4sp|P35214 14-3-3 protein gamma Cytoplasm 4sp|Q12846 Syntaxin 4 PM 4sp|Q15286 Ras-related protein Rab-35 PM 4sp|Q92896 Golgi apparatus protein 1 precursor PM 4sp|Q9NS69 Mitochondrial import receptor subunit
TOM22 homologMitochondria 4
sp|O43760 Synaptogyrin 2 PM 4sp|P04643 40S ribosomal protein S11 Ribosome 4sp|P05092 Peptidyl-prolyl cis-trans isomerase A Cytoplasm 4sp|P18621 60S ribosomal protein L17 Ribosome 4sp|P25232 40S ribosomal protein S18 Ribosome 4sp|P31946 14-3-3 protein beta Cytoplasm 4sp|Q04917 14-3-3 protein eta Cytoplasm 4sp|Q14964 Ras-related protein Rab-39A PM 4sp|Q9NX76 Chemokine-like factor super family
member 6PM 4
tr|O75592 Protein associated with Myc Cytoplasm 4tr|Q9P134 PRO3078 Cytoplasm 4sp|P13646 Keratin, type I cytoskeletal 13 Cytoskeleton 4sp|P29401 Transketolase Cytoplasm 4sp|P78371 T-complex protein 1, beta subunit Cytoplasm 4sp|Q14152 Eukaryotic translation initiation factor 3
subunit 10Cytoplasm 4
sp|Q92982 Ninjurin 1 PM 4sp|P12750 40S ribosomal protein S4, X isoform Ribosome 4sp|P51587 Breast cancer type 2 susceptibility
proteinNuclei 4
tr|Q8IWE4 Hypothetical protein MGC48972 Hypothetical 4tr|Q8NBN2 Hypothetical protein NT2RP2002695 Hypo Memb 4sp|O75369 Filamin B Cytoskeleton 3sp|P04114 Apolipoprotein B-100 precursor Secreted 3tr|Q7Z5D9 Transient receptor potential cation
channel subfamily M member 4 splice variant C
PM 3
sp|O43143 Putative pre-mRNA splicing factor RNA helicase
Nuclei 3
sp|O75390 Citrate synthase, mitochondrial precursor
Mitochondria 3
sp|O95169 NADH-ubiquinone oxidoreductase ASHI subunit, mitochondrial precursor
Mitochondria 3

82
Accession # Protein Name Location # of Peptidessp|P02383 40S ribosomal protein S26 Ribosome 3sp|P05388 60S acidic ribosomal protein P0 Ribosome 3sp|P08574 Cytochrome c1, heme protein,
mitochondrial precursorMitochondria 3
sp|P10620 Microsomal glutathione S-transferase 1
PM 3
sp|P11233 Ras-related protein Ral-A PM 3sp|P16435 NADPH-cytochrome P450 reductase ER 3sp|P16991 Nuclease sensitive element binding
protein 1Nuclei 3
sp|P17008 40S ribosomal protein S16 Ribosome 3sp|P25111 40S ribosomal protein S25 Ribosome 3sp|P32119 Peroxiredoxin 2 Cytoplasm 3sp|P36578 60S ribosomal protein L4 Ribosome 3sp|P46776 60S ribosomal protein L27a Ribosome 3sp|P48047 ATP synthase oligomycin sensitivity
conferral proteinMitochondria 3
sp|P50990 T-complex protein 1, theta subunit Cytoplasm 3sp|P51151 Ras-related protein Rab-9A PM 3sp|P51659 Peroxisomal multifunctional enzyme
type 2 Cytoplasm 3
sp|P53985 Monocarboxylate transporter 1 PM 3sp|P60174 Triosephosphate isomerase Cytoplasm 3sp|Q02546 40S ribosomal protein S13 Ribosome 3sp|Q12931 Heat shock protein 75 kDa,
mitochondrial precursorMitochondria 3
sp|Q14156 Hypothetical protein KIAA0143 Hypo Memb 3sp|Q14157 Hypothetical protein KIAA0144 Hypothetical 3sp|Q15365 Poly(rC)-binding protein 1 Nuclei 3sp|Q15738 NAD(P)-dependent steroid
dehydrogenaseCytoplasm 3
sp|Q99714 3-hydroxyacyl-CoA dehydrogenase type II
Mitochondria 3
sp|Q9BQE4 Selenoprotein S PM 3sp|Q9P0L0 Vesicle-associated membrane protein-
associated protein APM 3
sp|Q9Y289 Sodium-dependent multivitamin transporter
PM 3
tr|O60625 Endobrevin PM 3tr|O94848 Hypothetical protein KIAA0747 Hypo Memb 3tr|O94963 Hypothetical protein KIAA0887 Hypothetical 3tr|O95202 Leucine zipper-EF-hand containing
transmembrane protein 1PM 3
tr|O95564 Syntaxin 12 protein PM 3tr|Q7Z770 Hypothetical protein Hypothetical 3tr|Q8IUW5 Similar to expressed sequence
AA536743Hypo Memb 3
tr|Q8N275 Hypothetical protein FLJ33825 Hypo Memb 3tr|Q8N2K3 Hypothetical protein FLJ90162 Hypo Memb 3tr|Q8N4S9 Similar to hypothetical protein Hypo Memb 3

83
Accession # Protein Name Location # of PeptidesFLJ30532
tr|Q8N5I2 Similar to hypothetical protein CLONE24945
Hypothetical 3
tr|Q8WU20 Suc1-associated neurotrophic factor target
PM 3
tr|Q96EQ4 Similar to hypothetical protein, MNCb-1213
Hypothetical 3
tr|Q96H09 Similar to hypothetical protein FLJ10856
Hypo Memb 3
tr|Q96S30 Hypothetical protein gene +108 Hypo Memb 3tr|Q9NX40 Hypothetical protein FLJ20455 Hypothetical 3sp|O75131 Copine III Cytoplasm 3sp|O76062 Delta(14)-sterol reductase PM 3sp|P00734 Prothrombin precursor Secreted 3sp|P07741 Adenine phosphoribosyltransferase Cytoplasm 3sp|P17080 GTP-binding nuclear protein RAN Nuclei 3sp|P32322 Pyrroline-5-carboxylate reductase Cytoplasm 3sp|P40616 ADP-ribosylation factor-like protein 1 PM 3sp|P52907 F-actin capping protein alpha-1
subunitCytoskeleton 3
sp|P53007 Tricarboxylate transport protein, mitochondrial precursor
Mitochondria 3
sp|Q13045 Flightless-I protein homolog Cytoskeleton 3tr|Q9NWS8 Hypothetical protein FLJ20627 Hypothetical 3sp|P02593 Calmodulin PM 3sp|P36957 Dihydrolipoamide succinyltransferase
component of 2-oxoglutarate dehydrogenase complex
Mitochondria 3
sp|P49757 Numb protein homolog PM 3sp|Q8IWT6 Leucine-rich repeat-containing protein
8 precursorHypo Memb 3
sp|Q96S97 Myeloid-associated differentiation marker (SB135)
PM 3
sp|Q9NR30 Nucleolar RNA helicase II Nuclei 3tr|Q9BVV7 Hypothetical protein Hypo Memb 3sp|P02533 Keratin, type I cytoskeletal 14 Cytoskeleton 3sp|P06493 Cell division control protein 2 homolog Nuclei 3sp|P08779 Keratin, type I cytoskeletal 16 Cytoskeleton 3sp|P10114 Ras-related protein Rap-2a PM 3sp|P13073 Cytochrome c oxidase subunit IV
isoform 1, mitochondrial precursorMitochondria 3
sp|P16632 40S ribosomal protein S24 Ribosome 3sp|P17987 T-complex protein 1, alpha subunit Cytoplasm 3sp|P30519 Heme oxygenase 2 PM 3sp|Q15375 Ephrin type-A receptor 7 precursor PM 3sp|Q9NR31 GTP-binding protein SAR1a PM 3sp|Q9Y6B6 GTP-binding protein SAR1b PM 3tr|Q86X10 Hypothetical protein KIAA1219 Hypothetical 3sp|P43250 G protein-coupled receptor kinase
GRK6PM 3

84
Accession # Protein Name Location # of Peptidestr|O75050 Hypothetical protein KIAA0462 Hypothetical 3tr|Q7Z794 Keratin 1b Cytoskeleton 3tr|Q8NBP9 Hypothetical protein NT2RP1001023 Hypo Memb 3sp|O94826 Mitochondrial precursor proteins
import receptorMitochondria 3
sp|P15822 Zinc finger protein 40 Nuclei 3sp|P18433 Protein-tyrosine phosphatase alpha
precursorPM 3
sp|P22455 Fibroblast growth factor receptor 4 precursor
PM 3
sp|Q02543 60S ribosomal protein L18a Ribosome 3sp|Q02877 60S ribosomal protein L26 Ribosome 3sp|Q9BVK6 Glycoprotein 25L2 precursor ER 3tr|Q86UK0 ABCA12 transporter subfamily A PM 3sp|O14493 Claudin-4 PM 2sp|O15126 Secretory carrier-associated
membrane protein 1PM 2
sp|O15269 Serine palmitoyltransferase 1 ER 2sp|O43752 Syntaxin 6 PM 2sp|O96000 NADH-ubiquinone oxidoreductase
PDSW subunitMitochondria 2
sp|O96008 Probable mitochondrial import receptor subunit TOM40 homolog
Mitochondria 2
sp|P00533 Epidermal growth factor receptor precursor
PM 2
sp|P00966 Argininosuccinate synthase Cytoplasm 2sp|P02248 Ubiquitin Cytoplasm 2sp|P04004 Vitronectin precursor Secreted 2sp|P07478 Trypsin II precursor Secreted 2sp|P07737 Profilin I Cytoskeleton 2sp|P10515 Dihydrolipoamide acetyltransferase
component of pyruvate dehydrogenase complex
Mitochondria 2
sp|P11234 Ras-related protein Ral-B PM 2sp|P12280 Microsomal signal peptidase 23 kDa
subunitER 2
sp|P13641 Small nuclear ribonucleoprotein Sm D1
Nuclei 2
sp|P14625 Endoplasmin precursor ER 2sp|P17858 6-phosphofructokinase, liver type Cytoplasm 2sp|P19367 Hexokinase, type I Mitochondria 2sp|P20674 Cytochrome c oxidase polypeptide Va,
mitochondrial precursorMitochondria 2
sp|P21860 Receptor protein-tyrosine kinase erbB-3 precursor
PM 2
sp|P22695 Ubiquinol-cytochrome C reductase complex core protein 2
Mitochondria 2
sp|P23526 Adenosylhomocysteinase Cytoplasm 2sp|P25120 60S ribosomal protein L8 Ribosome 2sp|P31943 Heterogeneous nuclear Nuclei 2

85
Accession # Protein Name Location # of Peptidesribonucleoprotein H
sp|P35222 Beta-catenin Cytoplasm 2sp|P36542 ATP synthase gamma chain,
mitochondrial precursor.Mitochondria 2
sp|P38646 Stress-70 protein, mitochondrial precursor
Mitochondria 2
sp|P39026 60S ribosomal protein L11 Ribosome 2sp|P39030 60S ribosomal protein L15 Ribosome 2sp|P40926 Malate dehydrogenase, mitochondrial
precursorMitochondria 2
sp|P43307 Translocon-associated protein, alpha subunit
ER 2
sp|P48643 T-complex protein 1, epsilon subunit Cytoplasm 2sp|P49768 Presenilin 1 PM 2sp|P50402 Emerin Nuclei 2sp|P50416 Carnitine O-palmitoyltransferase I,
mitochondrial liver isoformMitochondria 2
sp|P51809 Synaptobrevin-like protein 1 PM 2sp|P57721 Poly(rC)-binding protein 3 Cytoplasm 2sp|P80723 Brain acid soluble protein 1 PM 2sp|Q04941 Intestinal membrane A4 protein ER 2sp|Q07812 Apoptosis regulator BAX, membrane
isoform alphaMitochondria 2
sp|Q10589 Bone marrow stromal antigen 2 PM 2sp|Q14108 Lysosome membrane protein II PM 2sp|Q15223 Poliovirus receptor related protein 1
precursorPM 2
sp|Q15363 Cop-coated vesicle membrane protein p24 precursor
PM 2
sp|Q15366 Poly(rC)-binding protein 2 Nuclei 2sp|Q15382 GTP-binding protein Rheb PM 2sp|Q16563 Pantophysin PM 2sp|Q96HY6 Protein C20orf116 Secreted 2sp|Q9C0B5 Zinc finger DHHC domain containing
protein 5Membrane 2
sp|Q9GZN8 Protein C20orf27 Hypothetical 2sp|Q9H223 EH-domain containing protein 4 Cytoplasm 2sp|Q9NRW7 Vacuolar protein sorting-associated
protein 45Golgi 2
sp|Q9NUE0 Zinc finger DHHC domain containing protein 18
Membrane 2
sp|Q9NY35 Protein C3orf4 Membrane 2sp|Q9Y282 Serologically defined breast cancer
antigen NY-BR-84Membrane 2
sp|Q9Y3E5 Protein CGI-147 Mitochondria 2tr|O75545 Hypothetical protein Hypo Memb 2tr|O94843 Hypothetical protein KIAA0739 Hypo Memb 2tr|O94918 Hypothetical protein KIAA0829 Hypothetical 2tr|O95164 Hypothetical protein Hypothetical 2tr|O95297 ZERO related protein PM 2
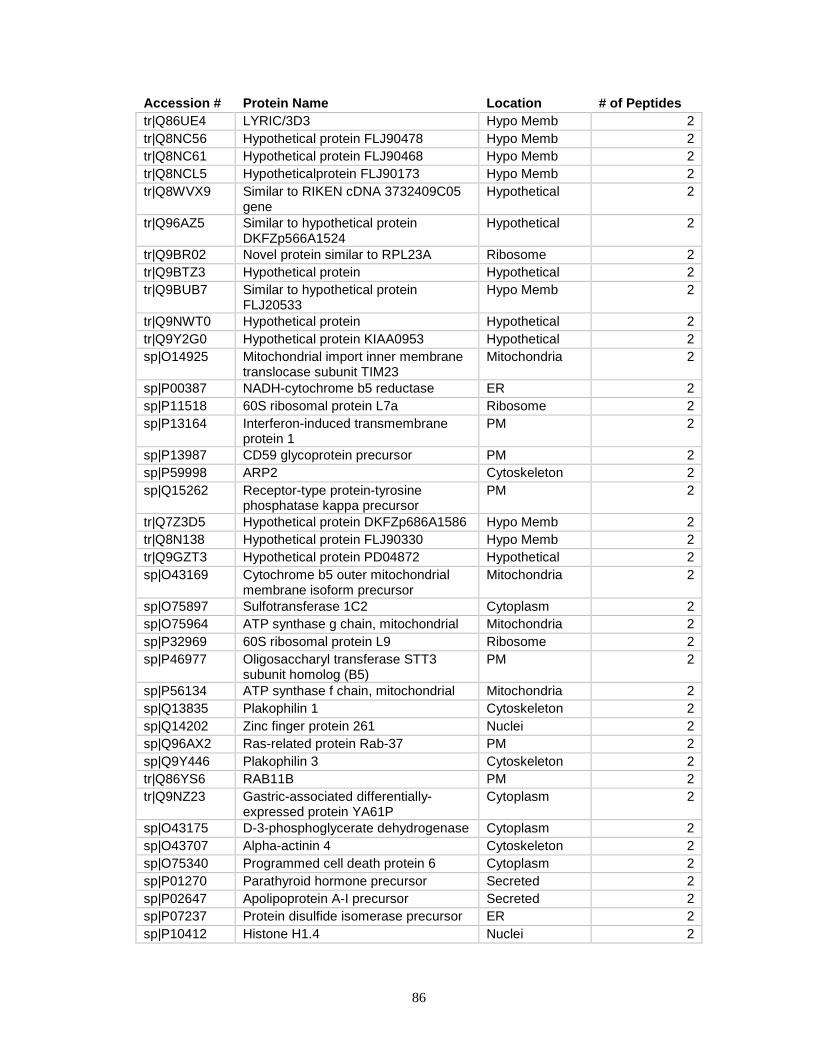
86
Accession # Protein Name Location # of Peptidestr|Q86UE4 LYRIC/3D3 Hypo Memb 2tr|Q8NC56 Hypothetical protein FLJ90478 Hypo Memb 2tr|Q8NC61 Hypothetical protein FLJ90468 Hypo Memb 2tr|Q8NCL5 Hypotheticalprotein FLJ90173 Hypo Memb 2tr|Q8WVX9 Similar to RIKEN cDNA 3732409C05
geneHypothetical 2
tr|Q96AZ5 Similar to hypothetical protein DKFZp566A1524
Hypothetical 2
tr|Q9BR02 Novel protein similar to RPL23A Ribosome 2tr|Q9BTZ3 Hypothetical protein Hypothetical 2tr|Q9BUB7 Similar to hypothetical protein
FLJ20533Hypo Memb 2
tr|Q9NWT0 Hypothetical protein Hypothetical 2tr|Q9Y2G0 Hypothetical protein KIAA0953 Hypothetical 2sp|O14925 Mitochondrial import inner membrane
translocase subunit TIM23Mitochondria 2
sp|P00387 NADH-cytochrome b5 reductase ER 2sp|P11518 60S ribosomal protein L7a Ribosome 2sp|P13164 Interferon-induced transmembrane
protein 1PM 2
sp|P13987 CD59 glycoprotein precursor PM 2sp|P59998 ARP2 Cytoskeleton 2sp|Q15262 Receptor-type protein-tyrosine
phosphatase kappa precursorPM 2
tr|Q7Z3D5 Hypothetical protein DKFZp686A1586 Hypo Memb 2tr|Q8N138 Hypothetical protein FLJ90330 Hypo Memb 2tr|Q9GZT3 Hypothetical protein PD04872 Hypothetical 2sp|O43169 Cytochrome b5 outer mitochondrial
membrane isoform precursorMitochondria 2
sp|O75897 Sulfotransferase 1C2 Cytoplasm 2sp|O75964 ATP synthase g chain, mitochondrial Mitochondria 2sp|P32969 60S ribosomal protein L9 Ribosome 2sp|P46977 Oligosaccharyl transferase STT3
subunit homolog (B5)PM 2
sp|P56134 ATP synthase f chain, mitochondrial Mitochondria 2sp|Q13835 Plakophilin 1 Cytoskeleton 2sp|Q14202 Zinc finger protein 261 Nuclei 2sp|Q96AX2 Ras-related protein Rab-37 PM 2sp|Q9Y446 Plakophilin 3 Cytoskeleton 2tr|Q86YS6 RAB11B PM 2tr|Q9NZ23 Gastric-associated differentially-
expressed protein YA61PCytoplasm 2
sp|O43175 D-3-phosphoglycerate dehydrogenase Cytoplasm 2sp|O43707 Alpha-actinin 4 Cytoskeleton 2sp|O75340 Programmed cell death protein 6 Cytoplasm 2sp|P01270 Parathyroid hormone precursor Secreted 2sp|P02647 Apolipoprotein A-I precursor Secreted 2sp|P07237 Protein disulfide isomerase precursor ER 2sp|P10412 Histone H1.4 Nuclei 2

87
Accession # Protein Name Location # of Peptidessp|P19634 Sodium/hydrogen exchanger 1 PM 2sp|P21181 Cell division control protein 42
homologPM 2
sp|P54764 Ephrin type-A receptor 4 precursor PM 2sp|Q13277 Syntaxin 3 PM 2tr|O14787 Transportin 2 Nuclei 2tr|Q8N789 Hypothetical protein FLJ25911 Hypo Memb 2tr|Q9P0N6 Hypothetical protein Hypo Memb 2sp|P39027 40S ribosomal protein S15a Ribosome 2tr|Q15290 RB protein binding protein Cytoplasm 2tr|Q7RTP1 Hypothetical protein Hypothetical 2tr|Q7Z392 Hypothetical protein
DKFZp686B15150Hypothetical 2
tr|Q96F25 Similar to RIKEN cDNA 5430428G01 gene
Hypo Memb 2
tr|Q9H652 Hypothetical protein FLJ22603 Hypo Memb 2tr|Q9H6C8 Hypothetical protein FLJ22389 Hypothetical 2tr|Q9HCF4 Hypothetical protein KIAA1618 Hypothetical 2tr|O60350 Sodium bicarbonate cotransporter2 Membrane 2sp|P78504 Jagged 1 precursor PM 2
Table 5: List of protein identified from the basolateral plasma membrane fraction isolated from MXR MCF-7 cells. The SwissProt and Trembl accession numbers are indicated for each protein. Subcellular Location Abbreviations: PM – plasma membrane; Hypo Memb – hypothetical membrane protein; Hypothetical -hypothetical protein; ER – endoplasmic reticulum; Membrane – membrane protein of unspecified location.

88
Figure 25: A. Subcellular distribution of proteins identified in the MXR MCF-7 basolateral plasma membrane fraction. B. The percentage of peptides used for these protein identifications that originated from plasma membrane proteins.
Peptides from All Other
Proteins, 1584, 49%
Peptides from Plasma
Membrane Proteins, 1643,
51%

89
Peptides from Plasma
MembraneProteins, 962, 66%
Peptides from all Other Proteins,
505, 34%
Figure 26: A. Subcellular distribution of the 100 proteins most reliably identified in the MXR MCF-7 basolateral plasma membrane fraction based, on the number of peptides used to make the identifications and their scores. B. The percentage of peptides used for these top 100 protein identifications which originated from plasma membrane proteins.

90
Membrane proteins represent a subset of proteins that are harder to analyze than other
proteins. Isolation, separation, and digestion are all problematic, especially with
subcellular fractions such as the plasma membrane which make up so little of the total
cell content. Designing strategies for the proteomic analysis of membrane
subfractions often requires non-traditional techniques and procedures.
Recently there have been some advances in the techniques and procedures of 2DGE
for the separation of complex protein mixtures, including hydrophobic and membrane
proteins.62 Although 2DGE can be modified or optimized to resolve and separate
specific membrane proteins, there does not seem to be one technique that works
universally for them and so 2DGE is usually excluded as a viable option.38; 39; 58 The
chemical cleavage agent CNBr has had some success in the cleavage of membrane
proteins in situ and has also been used in combination with trypsin to increase the
efficiency of protein digestion. Unfortunately CNBr is dangerous to work with and
many scientists have tried to find alternatives to using this substance.57
The strength of the method we developed for the proteomic analysis of plasma
membrane is the improvement in the isolation method. This improved enrichment
allows for the use of SDS-PAGE for the separation of the proteins.48 Although this
technique has a much lower resolution than 2DGE, it provides a rudimentary
separation of membrane proteins by their molecular weight. Once the proteins are
separated, the gel then provides an environment in which the proteins can be digested.
The real separation is performed in the LC-MS experiments

91
after the peptides are extracted. This method can also provide excellent sequence
coverage of the membrane proteins as is shown in Figures 27 and 28.
Of the 540 proteins identified, 214, or 40% of these, have been previously categorized
as plasma membrane proteins in the literature (Figure 25). There were also many
plasma membrane associated proteins identified, such as secreted proteins associated
with the exterior of the plasma membrane (17 proteins, 3%), or cytoskeletal structural
proteins (30 proteins, 6%) which are strongly associated with the interior of the
plasma membrane. There were also 73 proteins identified that had not been
previously identified or reported, and were identified using predicted amino acid
sequences from human genes. Of these hypothetical proteins, 45 were predicted to
have transmembrane spanning regions according to the TMHMM program which is
used to predict transmembrane helices in proteins.63 There was also a small subset of
proteins that are classified as “Membrane” which were categorized as membrane
proteins in the literature, but with no subcellular location defined. As shown in
Figure 26, of the top 100 proteins identified, based on the confidence scores and the
number of peptides identified from each protein, the majority are from the plasma
membrane.

92
Figure 27: The total sequence coverage of the 4F2 cell surface antigen is 59.9%.
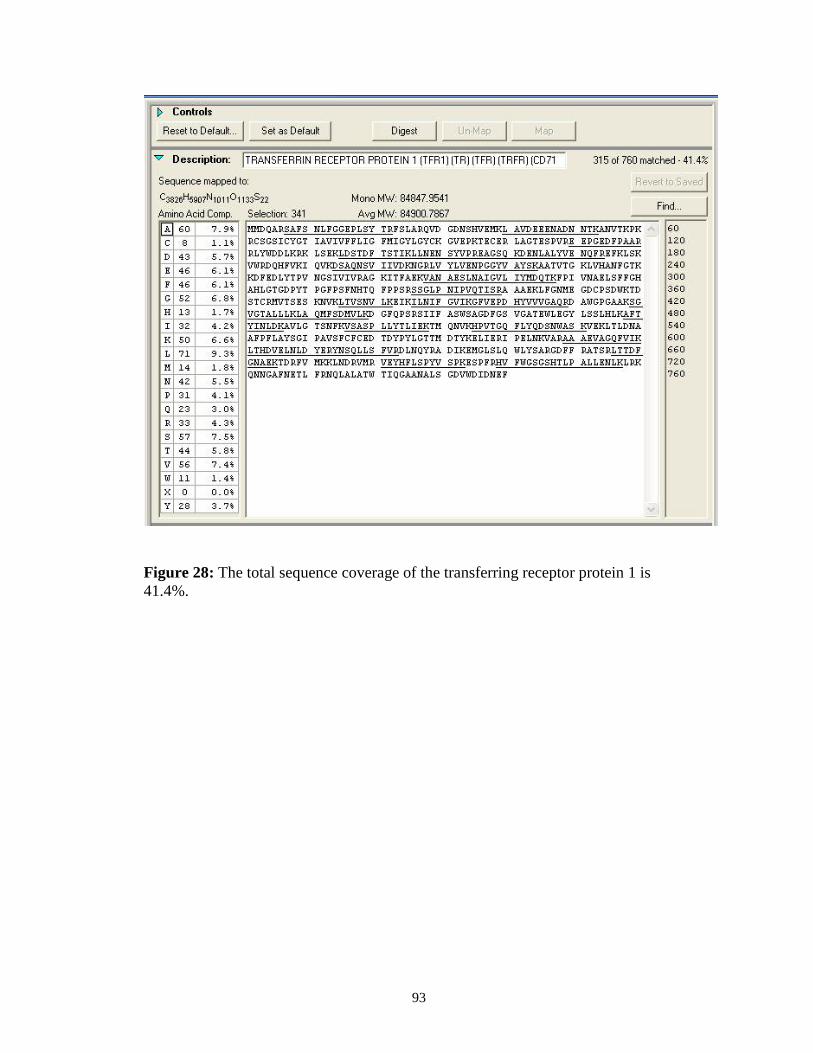
93
Figure 28: The total sequence coverage of the transferring receptor protein 1 is 41.4%.

94
The protein assignments we use to determine subcellular location were based on the
information from the databases. Other researchers have reported a higher percentage
of plasma proteins identified from their isolation, using the Biotin Directed Affinity
Purification (BDAP) plasma membrane isolation method followed by the same
technique of SDS-PAGE, in-gel digestion and LC-MS of the recovered peptides.51 A
closer look at the supplementary results provided by the authors show that they assign
every membrane protein they encounter as a plasma membrane protein, even proteins
found exclusively in other organelles such as the ATP synthase protein complex
found in the mitochondria. Using their criteria, our method would yield a much
higher enrichment then reported here, but assignments would not be correct.
Because we provide no experimental results for the assignment of protein subcellular
locations, we adhere strictly to protein locations reported in the literature. This,
combined with our requirement for 2 high scoring peptides/protein for identifications,
and our subsequent manual sequencing provides a very low probability for false
positives or false assignments of plasma membrane proteins.
Because the plasma membrane sample is highly enriched in relation to the whole cell
lysate, the low resolution separation technique of SDS-PAGE is sufficiently effective
to permit the identification of so many plasma membrane proteins. Since we are
isolating the plasma membranes as large sheets with the plasma membrane proteins
still embedded, we do not have to worry about losing protein due to precipitation in
protein solubilization steps during the isolation itself. Once the plasma membranes

95
are isolated and washed, they are solubilized directly in SDS solution, followed by
SDS-PAGE analysis, and this offers minimal opportunity for protein loss.
Protein and peptide sequencing, along with the antibody analysis, suggest that the
plasma membrane isolation technique is quite effective, and we estimate that of the
total protein loaded on the gels, over 50% of proteins by mass originate from the
plasma membrane. Estimating that the plasma membrane makes up about 2-3% of the
cell mass, and assuming a 20 fold enrichment, the estimated amount of plasma
membrane protein loaded in the SDS-PAGE experiment would be 40-60% of the total
protein loaded. This figure, along with the fact that 51% of the peptides sequenced
originated from plasma membrane proteins, agrees with our estimation that over 50%
of our isolated proteins originate from the plasma membrane.
By performing online nanoLC coupled with mass spectrometry we were able to
obtain many more protein identifications than by using static infusion nanospray.
Each of the gel slices contained many proteins so when the peptides were analyzed
using static infusion nanospray, many of the less abundant peptides that were of
similar mass to some of the more abundant peptides were not observed. Adding the
chromatographic separation step allowed the complex peptide mixture to be separated
and introduced into the mass spectrometer at a slower pace instead of all at once. This
allowed for the identification of many of the lesser abundant peptides which would
not normally be observed.

96
Not all of the peptides from the proteins identified are observed during a proteomic
analysis.64 Peptides containing post translational modifications are more difficult to
identify then their unmodified counterparts. Identifying these peptides is often tedious
and typically in a quantitative or qualitative proteomic analysis, these peptides which
contain post-translational modifications are overlooked.65 This is because 100%
sequence coverage is not necessary for the identification or relative quantitation of
proteins in different samples.66; 67; 68; 69; 70
Another reason 100% sequence coverage of proteins is not obtained during proteomic
analysis is that not all peptides get picked for tandem mass spectrometry during an
LC-MS experiment. These experiments tend to pick ions with the highest signal
intensities and if there are many proteins eluting from the column and entering the
mass spectrometer at the same time, ions with lower intensities from peptides
abundant in lower levels or from peptides which do not ionize well will often be
overlooked.71
As was stated previously, we estimate that greater than 50% of the total protein
loaded onto the SDS-PAGE gels are plasma membrane proteins. Enrichment levels of
greater than 50% are difficult to obtain when enriching isolating plasma membranes.
Reasons for this could be that upon cell lysis, membrane components mix with one
another, thereby increasing the number of membrane proteins identified which are not
associated with the plasma membrane such as proteins from the ER or Golgi complex.
Another possible reason for the lower enrichment levels of plasma membranes are

97
that membranes form small vesicles and can capture many of the cytoplasmic proteins
present during cell lysis. These soluble proteins are then identified and analyzed
along with the membrane proteins and contribute to the lower enrichment levels.

98
Chapter 4: Comparison of Plasma Membrane Proteins from Drug Resistant and Drug Susceptible MCF-7 Breast Cancer Cell LinesReproduced in part with permission from: Rahbar, A., Fenselau, C. (2004). Integration of Jacobson's Pellicle Method into Proteomic Strategies for Plasma Membrane Proteins. J Proteome Res. Web Release Date: 13-Oct-2004. Copyright 2004 American Chemical Society.
A. Comparative Proteomics Techniques
In the previous chapter, we designed a qualitative “bottom-up” proteomic analysis for
the analysis of plasma membrane proteins from cell cultures. While this information
is useful for identifying what proteins are present in a particular sample, it does not
give information on the protein abundance levels of the individual proteins identified.
Comparative proteomic experiments can be used to obtain information about the
relative abundance levels of proteins from cells or tissues in different states, such as
diseased and healthy, treated and untreated, or from different samples altogether. This
chapter will outline a method developed for comparing the differences in protein
abundances from proteins from a mitoxantrone resistant (MXR) MCF-7 cell line and
from a mitoxantrone susceptible, non-resistant parental cell line.
Historically, the first comparative experiments were performed using 2DGE.
Initially, proteins from 2 different samples would be separated on 2D gels. The 2D
gel arrays are scanned and the images compared by differential densitometry.
Protein abundance changes are observes as increased or decreases in gel spot
densities.49; 72; 73

99
Reproducibility among 2D gels from samples originating from the same source is
usually reasonable and has been improved over time, but becomes more
problematic when performing comparative studies. Small differences in the way
proteins are separated on 2D gels can be interpreted as changes in protein
abundances in comparative studies. This can usually be overcome by running
multiple gels and averaging the scanned images together. These averaged images
can then be compared to the averaged images from another sample and these
averages compared.74 The results from this type of experiment can be dramatic and
differences in protein abundances can be quickly ascertained.
A common misconception in the analysis of mass spectrometry data is that there
exists a relation between the peak intensities and the concentrations of different
peptides. This is not the case. The ionization efficiencies of peptides differ from one
peptide to another and are dependent upon the primary structure of individual
peptides and the chemical properties of the amino acid side chains which make up
these peptides. Therefore there is no relation between the peptide signal intensities
from differing peptides.71 That having been said, there is a correlation between the
peptide signal intensities and the concentrations of identical peptides.
Recently, alternatives to the gel-based method of comparative analysis have been
developed using chemical labeling using stable isotopes such as 2H, 13C, 15N, and
18O.72; 75; 76; 77 Chemical species made up of these stable isotopes contain the same

100
chemical properties as their lighter counterparts but have an increased mass.
Therefore, if separate peptide mixtures are chemically modified with either light or
heavy labels, the relative intensities and isotope ratios of each of these species can
be determined and since the peptides have the same ionization efficiencies, the
relative abundances of these peptides and therefore the concentrations of the
proteins they originate from can be measured.
In this study we introduced isotope labels by metabolic labeling, which labels
proteins during cell growth. Cell cultures are grown in cell culture media containing
13C6 labeled arginine and lysine residues as the predominant source of these amino
acids (Figure 29). These amino acids are then incorporated into all newly
synthesized proteins and all tryptic peptides containing 1 labeled amino acid will
have masses of 6 Da higher then their unlabeled counterparts. A comparative
proteomic analysis of proteins from two different cell lines can therefore be
performed by growing one cell line in normal growth conditions, and growing the
other cell line in the cell culture media containing the labeled amino acids. The cells
can then be harvested and the proteins isolated, followed by analysis using mass
spectrometry. Using this metabolic labeling technique we labeled the proteins from
a drug susceptible MCF-7 parental cell line using the metabolic labeling technique
described here and compared the protein abundance changes between it and an
MCF-7 cell line selected for resistance to mitoxantrone (MXR MCF-7).

101
The role of plasma membrane proteins in drug resistance has been previously studied
in the mitoxantrone resistant MCF-7 breast cancer cell line.78; 79 It has been shown
that this cell line does not overexpress P-glycoprotein or any of the proteins from the
multidrug resistance associated protein family, which are the plasma membrane
proteins usually associated with multidrug resistance, when compared to the parental
drug susceptible MCF-7 cell line.80; 81 mRNA analysis and Western immunoassay
experiments have shown that this cell line overexpresses the ATP-binding cassette
protein ABCG2 commonly known as breast cancer resistance protein (BCRP), and
the mechanisms of drug resistance used by this cell line has been shown to be
independent of the P-glycoprotein and multidrug resistance associated protein
mediated drug resistance pathways.78; 81; 82

102
NH213C
OH
O13C
H
H
13C
H
H
13C
H
H
13C
H
H
13C
H
NH2
NH213C
OH
O13C
H
H
13C
H
H
13C
H
H
13C
H
H
13C
H
NH2
13COH
O
N
H
13C
H
H
13C
H
H
13C
H
H
13C
H
NH2
13C
NH2
NH
13COH
O
N
H
13C
H
H
13C
H
H
13C
H
H
13C
H
NH2
13C
NH2
NH
13C Labeled Lysine
13C Labeled Arginine
Figure 29: Structure of the 13C labeled amino acids arginine and lysine

103
B. Materials and Methods
Materials
The Criterion precast gel system, Criterion precast gels (13.3 x 8.7 cm 4-15%),
Biosafe Coomassie stain, 10x Tris/Glycine/SDS Buffer, pre-stained protein broad
range standards, and Laemmli sample buffer were purchased from Bio-Rad (Hercules,
CA) . DTT, iodoacetamide, fetal calf serum, Penicillin-Streptomycin solution, and
TFA were purchased from Sigma Aldrich (St. Louis, MO). NH4HCO3, formic acid,
acetonitrile, acetic acid, methanol, and CaCl2 were purchased from Fisher (Pittsburg,
PA). Modified porcine trypsin was purchased from Promega (Madison, WI).
Improved Minimal Essential Medium was purchased from American Type Culture
Collection (Manassas, VA). MEM (Eagle) Media with Earle's Salts without L-lysine
or L-arginine, and Dialyzed Fetal Bovine Serum was purchased from Atlanta
Biologicals (Lawrenceville, GA). Carbon-13 (13C) labeled L-lysine and L-arginine
isotopes at 98% purity was purchased from Cambridge Isotope Laboratories
(Andover, MA).
Equipment
Mass spectra were obtained using an Applied Biosystems Qstar Pulsar i (Foster City,
CA) with a nanospray ion source from Protana (Odense, Denmark). NanoLC-MS was
performed online with the LC Packings Ultimate Nano LC System (Sunnyvale, CA).

104
LC-MS head with Liquid Junction were purchased from Proxeon (Odense, Denmark).
Nanospray emitters were purchased from New Objectives (Woburn, MA).
Metabolic labeling of the MCF-7 Breast Cancer Cell Line
Metabolically labeled drug susceptible MCF-7 cells were grown using specially
prepared media. Isotopically labeled L-lysine and L-arginine amino acids were added
to Minimal Essential Medium lacking the amino acids L-lysine and L-arginine, so
that the predominant source of biologically usable lysine and arginine are labeled
with the 13C isotopes. The fetal bovine serum used was made from 25% of the normal
serum and 75% of the dialyzed serum to minimize the introduction of unlabeled
lysine and arginine. The labeled MCF-7 cells were grown to confluence using the
same protocol and growth conditions as the MXR MCF-7 cells, but using the
modified media and fetal bovine serum specified in place of the normal recipes.
Unlabeled MXR MCF-7 cells were grown using the same conditions as the labeled
cells but using unlabeled L-arginine and L-lysine in the cell culture media.
One Dimensional SDS-PAGE Analysis
Twenty µg of plasma membrane protein from MXR MCF-7 cells and twenty µg of
plasma membrane protein from metabolically labeled drug susceptible MCF-7 cells
were mixed together and loaded onto 4-15% gels and run according to manufacturer’s
specifications using the Bio-Rad Criterion precast gel system. Following

105
electrophoresis, the gels were stained using Bio-Rad Biosafe Coomassie stain and the
stained gels were scanned using a GS-800 densitometer from Bio-Rad (Hercules,
CA) .
Mass Spectrometry
The SDS-PAGE gel was excised into 28 gel bands and tryptic digestion was
performed on the gel slices as before.61 After extraction from the gel bands, the
tryptic peptides were placed in 0.1% formic acid (FA) in preparation for nanoLC-
MS/MS analysis. The tryptic peptides were analyzed by online nanoLC-MS/MS.
Reverse phase conditions were A: 97.5% H2O/2.5% ACN/0.1%FA, B: 97.5%
ACN/2.5% H2O/0.1%FA with a 60 minute gradient from 5%-35%B on a PepMap
75µm I.D., 15cm, 3µm, 100Å column from LC Packings (Sunnyvale, CA).
Protein Identification
Each protein was identified based on sequences from two or more peptides using the
integrated Qstar software Analyst QS with Bioanalyst and ProID with a minimum
confidence level of 99.4% and were also manually sequenced from the tandem mass
spectrometry data.

106
Protein Quantitation
Ratios of unlabeled/labeled monoisotopic peak areas were calculated to determine
protein abundance changes between the two cell lines. Corrections were made in the
final ratios to compensate for the extent of incorporation determined for the label
(90%). Ratios ≥ 2 or ≤ 0.5, which correspond to a 100% abundance difference
between the 2 cell lines, were considered biologically significant and subsequently
reported. Replicate experiments were performed using mixtures from 4 different
plasma membrane protein isolations from both unlabeled MXR MCF-7 cells and
labeled drug susceptible MCF-7 cells.

107
C. Results and Discussion
The technique of metabolic stable isotope labeling involves the incorporation of
stable isotopes into cells during cell growth so that all newly synthesized
biomolecules incorporate these isotopes into their chemical structure. Initially this
was done with single celled organisms such as yeast and bacteria but more recently
this technique has been successful with cell culture and multicellular organisms such
as Caenorhabditis elegans, and Drosophila melanogaster. 83; 84; 85; 86; 87; 88
Our lab has developed a technique for the labeling of proteins with both 13C arginine
and 13C lysine.72 Standard growth conditions for mammalian cell culture uses 90%
cell culture media and 10% fetal bovine serum. Commercially available cell culture
media deficient in the amino acids arginine and lysine was mixed with labeled 13C
arginine and lysine to ensure that the only source of these amino acids is the 13C
variety. In the initial growth conditions used, dialyzed fetal bovine serum was used to
minimize the addition of unlabeled 12C arginine and lysine from other proteins or
peptides in the serum. These conditions resulted in poor cell growth and it was
subsequently found that cells would grow normally by using 2.5% of the standard
fetal bovine serum with 7.5% of the dialyzed serum. It is hypothesized that the serum
contains growth factors necessary for normal growth of these estrogen-positive cells,
and that the dialyzed serum was most probably deficient in these factors. The

108
700.0 702.5 705.0 707.5 710.0 712.5 715.0 717.5 720.00
10
20
30
40
50re
lativ
e in
tens
ity (%
)
mass/charge
UnincorporatedLabel
UnincorporatedLabel
IncorporatedLabel
IncorporatedLabel
Figure 30: 90% incorporation of the labeled amino acids is achieved in the drug susceptible MCF-7 breast cancer cell line using the metabolic labeling technique developed.

109
percentage of incorporation of the labeled amino acids into all newly synthesized
proteins was determined by the analysis of the mass spectra of the labeled proteins
alone, along with 1:1 mixtures of labeled and unlabeled proteins from the same MCF-
7 drug susceptible cell line.72 Using this modified recipe, we were able to
metabolically label the drug susceptible MCF-7 parental cell line with a 90%
incorporation rate of the 13C amino acids (Figure 30).
The objective of this portion of the study was to determine the differences in the
abundance levels of proteins from the plasma membranes of mitoxantrone drug
resistant and drug susceptible MCF-7 cells. Plasma membranes from the two cell
lines were isolated and the proteins extracted as described in the previous section.
The protein concentrations of these fractions were determined and the plasma
membrane proteins from the 2 samples were mixed at a 1:1 ratio.
SDS-PAGE separation of the protein mixture was performed and the gel was
stained and excised into 28 gel bands. The gel bands were subjected to in-gel
tryptic digestion and the peptides were recovered and analyzed by LC-MS. Peptide
pairs resulting from the in-gel digestions co-eluted and protein quantitation was
performed using the data obtained. Figure 31 shows a scheme for the procedure
used for this analysis.
LC-MS was performed on the peptides extracted from the SDS-PAGE gel bands.
The peptides co-eluted from the reverse phase column and the area under the

110
monoisotopic peaks from the mass spectra of matching labeled and unlabeled
peptides were compared to each other to determine differences in relative
abundances of the proteins from the two cell lines. Figure 32 shows an LC-MS
survey scan of peptides extracted from band 22.

111
Plasma Membrane Protein Isolation
Plasma Membrane Protein Isolation
12C Arg and LysMXR MCF-7 Cells
13C Arg and LysMCF-7 Cells
Mix Proteins in1:1 Ratio
SDS-PAGE
In-gel Digestion
LC-MS
Protein Quantitation
Increased Abundance in MXR MCF-7 Cell Line
Increased Abundance in Drug Susceptible MCF-7 Cell Line
No Change in Abundance
Figure 31: Scheme for the quantitation of protein from the plasma membranes from a MXR MCF-7 cell line and a drug susceptible MCF-7 cell line.

112
Figure 32: Labeled and unlabeled peptide pairs extracted from band 22 and analyzed by LC-MS. The inset shows an expanded view of the doubly charged peptide AGTQLLAGLR from the plasma membrane protein Integrin alpha-V.

113
Pairs of labeled and unlabeled peptides were compared for all proteins identified.
Abundance ratios were determined and the proteins for which changes in abundance
were more than 100% were reported. Multiple peptides were used for protein
identification and for calculations for the abundance changes.
Figure 33 shows the labeled and unlabeled peptide pairs used to calculate the relative
abundances of the 4F2 cell-surface antigen from susceptible and drug resistantMCF-7
cells. The ratio was calculated for each individual peptide pair and the values are
averaged in the final results. Table 6 shows the experimental data used to make these
calculations for the quantitation of the 4F2 cell-surface antigen, a known amino acid
transporter.
Changes in the ratios of the intensities of unlabeled/labeled peptides >2 or <0.5 are
considered significant. Table 7 lists all of the proteins whose relative abundance
changes were over 100%. The proteins whose names are in red have higher
abundances in the MXR MCR-7 cell line, while proteins listed in blue have higher
abundances in the drug susceptible MCR-7 parental cell line. Figure 34 is a graph
summarizing the relative abundance changes of the proteins listed in Table 7.
All of the proteins showing abundance changes have been previously identified in the
literature except for the Hypothetical protein DKFZp686D0452. This protein is
predicted to be in the integrin family of proteins and has 96% sequence homology

114
DLLLTSSYLSDSGSTGEHTK704.3 Da (+3)
EDFDSLLQSAK626.8 (+2)
IGDLQAFQGHGAGNLAGLK623.0 (+3)
LDYLSSLK469.7 (+2)
WCSWSLSQAR640.8 (+2)
Figure 33: Peptide pairs from the 4F2 cell surface antigen protein analyzed from the labeling experiments.

115
Peptide Area Unlabeled Peptide
Area Labeled Peptide
Ratio of Unlabeled/Labeled Areas
Average Ratio
DLLLTSSYLSDSGSTGEHTK 55569 11347 4.3 4.4 ± 0.3
EDFDSLLQSAK 55125 10589 4.6
IGDLQAFQGHGAGNLAGLK 266680 55646 4.2
LDYLSSLK 232940 43462 4.7
WCSWSLSQAR 45220 9689 4.1
Table 6: Data used to calculate the abundance changes between the plasmamembrane protein 4F2 cell surface antigen isolated from the unlabeled MXR MCF-7 cell line and the 13C labeled drug susceptible MCF-7 cell line using the areas of the monoisotopic peaks from each peptide.

116
Accession # Protein Name Ratio MXR MCF-7 /MCF-7
tr|Q8IX16ATP- binding cassette protein ABCG2(BCRP) Not Detected in MCF-7 Cells
sp|P02786 Transferrin receptor protein 1 Not Detected in MCF-7 Cells
sp|Q01650Large neutral amino acids transporter small subunit 1 7.9 ± 0.6
tr|Q9UIU0Dihydropyridine receptor alpha 2 subunit 6.8 ± 0.4
sp|P08195 4F2 cell-surface antigen heavy chain 4.4 ± 0.3
sp|Q00610 Clathrin heavy chain 1 3.7 ± 0.4
sp|P04895Guanine nucleotide-binding protein G(S), alpha subunit 3.5 ± 0.3
sp|P27105Erythrocyte band 7 integral membrane protein 2.6 ± 0.3
sp|P54760 Ephrin type-B receptor 4 2.3 ± 0.3
sp|P17301 Integrin alpha-2 0.33 ± 0.03
tr|Q7Z3V1 Hypothetical protein DKFZp686D0452 0.3 ± 0.02
sp|P11166Solute carrier family 2, facilitated glucose transporter, member 1 0.25 ± 0.02
tr|Q7Z7Q4Tumor-associated calcium signal transducer 2 0.24 ± 0.08
sp|Q14344Guanine nucleotide-binding protein, alpha-13 subunit 0.085 ± 0.01
sp|P26006 Integrin alpha-3 0.073 ± 0.006
Table 7: Protein abundance changes found when comparing the plasma membrane sub-proteomes of the unlabeled MXR MCF-7 breast cancer cell line and the 13C labeled drug susceptible MCF-7 parental cell line.

117
7.96.8
4.43.73.5
2.62.3
-3-3.3-4
-4.2-11.8
-13.7
Not Detectedin Drug
Susceptible Cell Line
-20 -10 0 10 20 30 40
Pro
tein
Difference in Abundance
sp|P26006 Integrin alpha-3
sp|Q14344 Guanine nucleotide-binding protein, alpha-13 subunit
tr|Q7Z7Q4 Tumor-associated calcium signal transducer 2
sp|P11166 Solute carrier family 2, facilitated glucose transporter, member 1
tr|Q7Z3V1 Hypothetical protein DKFZp686D0452
sp|P17301 Integrin alpha-2
sp|P54760 Ephrin type-B receptor 4
sp|P27105 Erythrocyte band 7 integral membrane protein
sp|P04895 Guanine nucleotide-binding protein G(S), alpha subunit
sp|Q00610 Clathrin heavy chain 1
sp|P08195 4F2 cell-surface antigen heavy chain
tr|Q9UIU0 Dihydropyridine receptor alpha 2 subunit
sp|Q01650 Large neutral amino acids transporter small subunit 1
sp|P02786 Transferrin receptor protein 1
tr|Q8IX16 ATP-binding cassette protein ABCG2 (BCRP)
Figure 34: Graph showing the relative changes in abundance of protein levels. The numbers represent relative fold increases in abundance levels with respect to the ratios of MXR MCF-7 protein abundance/ drug susceptible MCF-7 protein abundances. Positive values represent proteins whose abundance is higher in MXR MCF-7 cells and negative abundances represent proteins whose abundance is higher in the drug susceptible MCF-7 cell line.

118
with the integrin beta-1 subunit. The proteins summarized in Table 7 can be
classified into 4 different groups:
1. Cell Adhesion Proteins
• Integrin alpha-2
• Integrin alpha-2
• Hypothetical protein DKFZp686D0452 (beta integrin)
2. Transport Proteins
• ATP-binding cassette protein ABCG2 (BCRP)
• Solute carrier family 2, facilitated glucose transporter, member 1
• 4F2 cell-surface antigen heavy chain
• Large neutral amino acids transporter small subunit 1
3. Proteins involved in Receptor Mediated Endocytosis
• Transferrin receptor protein 1
• Clathrin heavy chain 1
4. Signal Transduction Proteins and Receptors
• Guanine nucleotide-binding protein, alpha-13 subunit
• Guanine nucleotide-binding protein G(S), alpha subunit
• Erythrocyte band 7 integral membrane protein

119
• Ephrin type-B receptor 4
• Dihydropyridine receptor alpha 2 subunit
• Tumor-associated calcium signal transducer 2
The goal of this study was to identify the differences in protein abundances between
the 2 cell lines and to use this data to elucidate the possible mechanisms of drug
resistance for the MXR MCF-7 cell line. At first glance, the proteins listed in Table
7 seem unrelated. The protein functions range from structural to the transport of
materials and information.
The most well known contributor to drug resistance is the drug efflux protein P-
glycoprotein (P-gp).7 This protein is localized in the plasma membrane of cells and
its mechanism involves ATP-dependant transport of materials out of the cell. This
results in the reduction of intracellular accumulation of many types of anticancer
drugs.7; 8; 9 Although this is one of the most common causes of multidrug resistance,
this protein was not detected in either cell line studied.
One of the major differences observed in the present study is the presence of the
breast cancer resistance protein (BCRP), also called the ATP-binding cassette
protein ABCG2. This protein is present in the MXR MCF-7 cell line but was not
detected in the drug susceptible cell line. BCRP was first discovered in the

120
multidrug resistant breast cancer cell line MCF-7/AdrVp.78 This cell line was
selected by culturing MCF-7 cells in the presence of increasing amounts of
adriamycin and verapamil.89 Cells in which drug resistance is induced using
doxorubicin have been found to overexpress the protein P-gp.72; 73; 90; 91 Verapamil
is an inhibitor of P-gp and by growing MCF-7 cells in the presence of both
doxorubicin and verapamil, a different mechanism of resistance is achieved, which
includes the overexpression of BCRP.
Like P-gp, BCRP is an ATP-driven efflux pump found in the plasma membrane. It
has some substrates in common with P-gp and therefore can also facilitate multidrug
resistance. Transfection of the drug susceptible MCF-7 cell line with an expression
vector containing the full length BCRP cDNA clone resulted in cells which were
resistant to mitoxantrone, daunorubicin, and doxorubicin, indicating that the
overexpression of BCRP alone was enough to confer drug resistance.78
Like BCRP, transferrin receptor protein 1 was found in the MXR MCF-7 cell line but
not detected in the drug susceptible cell line. Transferrin receptor protein 1 is
responsible for the receptor mediated endocytosis of transferrin into the cell.92; 93
Each transferrin protein binds 2 molecules of iron. Iron bound transferrin binds to
transferrin receptor protein 1 and initiates uptake into the cell. This is the major
mechanism for iron uptake by cells.92

121
Although an increase in transferrin receptor protein 1 or intracellular transferrin has
not been associated with drug resistance, perhaps the increase in iron uptake by the
cell is useful in an indirect way. Many proteins in the cell require iron in order to
function properly. Proteins from the cytochrome P450 class of proteins contain a
heme group and require iron for proper substrate binding. This class of proteins are
classified as phase I detoxifying enzymes and have been previously shown to be a
common mechanism of drug resistance.7; 13; 14; 94 An increase in the intracellular
expression of these enzymes would explain the benefit of increased uptake of iron.
Clathrin abundance was increased by almost 4 fold in the MXR MCF-7 cell line.
Clathrin is a protein used in the receptor mediated endocytosis process, and an
increase in the abundance of this protein at the plasma membrane could be associated
with an increase in the endocytosis process.
Guanine nucleotide-binding proteins, or G-proteins, are heterotrimeric proteins made
up of 3 different subunits, called alpha, beta, and gamma. These proteins are located
on the cytoplasmic face of the plasma membrane. The Guanine nucleotide-binding
protein, alpha-13 subunit, was found to have almost a 12 fold decrease in abundance
in the MXR MCF- 7 cell line. This protein has not been previously associated with
drug resistance, however it has been previously identified as an activator of
apoptosis.95; 96 Blocking of the apoptotic pathway is one way that drug resistance can
be achieved, so this may be another mechanism used to achieve drug resistance by the
MXR MCF-7 cell line.

122
The 4F2 cell-surface antigen heavy chain and large neutral amino acid transporter
small subunit 1 proteins were both shown to be present in higher abundance in the
MXR MCF-7 cell line. These proteins form heterodimers in the plasma membrane
and are responsible for the uptake of amino acids into the cell. Since these proteins
require both subunits for proper function, it makes sense that if there was an increase
in the abundance of one of these proteins, the other would be increased also.
Although the increase in these proteins has not yet been shown to confer drug
resistance, it has been suggested that an increase in the expression of these 2 proteins
would provide a selection advantage over other cells in the body because the cell
would be able to survive in a nutrient restricted environment.97
Out of the six proteins whose abundances are lower in the MXR MCF-7 cell line, 3
of them are classified as integrins. Integrins are transmembrane spanning proteins
which are responsible for the attachment of cells to extracellular matrix and cell-to-
cell adhesion.98; 99 They have a single transmembrane region and a large
extracellular domain. They form heterodimers made up of alpha and beta subunits,
both of which are required for proper function. Although there has been no data
suggesting that a change in the abundance of integrins has any effect on drug
resistance, there is data suggesting that changes in the expression of integrins can be
responsible for metastasis and the spreading of tumor cells to other parts of the
body through the circulatory system.100; 101

123
The erythrocyte band 7 integral membrane protein, also know as stomatin, showed
an increase in abundance in the resistant cell line. Although the function of this
protein is not known, it has been shown to associate with the glucose transporter
solute carrier family 2, facilitated glucose transporter, member 1, also known as
GLUT-1. 102; 103These proteins co-immunoprecipitated with one another, suggesting
that they physically interact in a complex.102; 103 An increase in the expression of
stomatin has also been associated with a decrease in the levels of glucose transport
into the cell, without a decrease in the levels of GLUT-1 protein.102; 103 In our
experiments, we observed an increase in stomatin levels, but also a decrease in
GLUT-1 levels. So here we have two different processes that potentially decrease
intracellular levels of glucose. A decreased glucose level has not been associated
with drug resistance, and is surprising in view of the energy needs of cancer cells.
Tumor-associated calcium signal transducer 2 is a cell surface receptor, which is
widely expressed in human cancers.104; 105 Its abundance was 4 fold lower in the
MXR MCF-7 cell line, but its function and ligand are unknown. The
dihydropyridine receptor alpha 2 subunit is a voltage gated calcium channel protein
which had an increase in abundance in the MXR MCF-7 cell line. Both of these
proteins appear to be involved in intracellular calcium signaling, but no link
between these proteins has been reported and their function in relation to drug
resistance is not immediately apparent.

124
The ephrin type-B receptor 4 and the guanine nucleotide-binding protein G(S),
alpha subunit both have increased abundances in the MXR MCF-7 cell line. These
proteins are both involved in signal transduction and other downstream signaling
events. Unfortunately, without information on changes in protein concentrations in
the interior of the cell, e.g., for the tumor-associated calcium signal transducer 2,
and the dihydropyridine receptor alpha 2 subunit, the role of these membrane
proteins is too general to determine their purpose in drug resistance.
Although the role played in drug resistance by the last four proteins discussed could
not be surmised, functions of 11 of the 15 proteins of interest have been reasonably
proposed. Nine of these have been reported by others to be related to drug
resistance, metastasis, or increased resistance to harsh environments provided by
the increase in the efficiency in nutrient uptake.
Of the 15 proteins exhibiting significant abundance changes, only BCRP has been
previously reported as being associated with drug resistance.106 It is suggested in this
dissertation that by decreasing the abundance of guanine nucleotide-binding protein
alpha-13 subunit, perhaps the tumor cell can increase its chances for survival while
being treated with an anti-cancer agent by blocking one of the pathways leading to
apoptosis and therefore achieving drug resistance. It is also suggested here that the
purpose of increasing the abundance of transferrin receptor protein 1, and therefore
increasing the intercellular concentration of iron, is to supply iron containing
detoxifying enzymes, such as the cytochrome P450 family of proteins, with the iron

125
needed for proper function. The increase in detoxification enzymes has been linked
with an increase in drug resistance.7
This dissertation suggests that at least one, and as many as three, mechanisms of drug
resistance are achieved by the mitoxantrone drug resistant MCF-7 breast cancer cell
line. As was stated earlier, the overexpression of BCRP alone is enough to confer
drug resistance.78 In the absence of further information on protein abundances within
the cell, there is no way to determine whether guanine nucleotide-binding protein
alpha-13 subunit, or transferrin receptor protein 1 are involved in drug resistance or
some other process altogether. However, information about protein abundance
differences can still be of use.
The overexpression of transferrin receptor protein 1 has been used for several
different types of therapies. Researchers have been able to introduce reagents into
cells by exploiting the transferrin receptor mediated endocytosis pathway. Transferrin
binds many other metals besides iron and by complexing metals with therapeutic
agents, these agents can be brought into the cell in this manner.107 Anticancer agents
have also been introduced into tumor cells by conjugating them to transferrin and the
agents are therefore brought into the cell along with transferrin during Endocytosis.107
The overexpression of transferrin receptor protein 1 has also been used in gene
therapy. Transferrin proteins can be synthesized containing long polylysine tails.
These polylysine tails bind to plasmid DNA and this plasmid DNA is then brought

126
into the cell during the endocytosis of transferrin. Using this technique, researchers
can introduce foreign genes into different systems.108

127
Conclusions and Prospectus
Mass spectrometry has established itself as an important analytical tool with many
functions. It is used for the rapid detection and characterization of microorganisms
and this use may someday be a vital tool in the defense against bio-terrorism and
important for national security.109 It is commonly used for the identification and
analysis of proteins from complex biological systems.41; 110 It can be used in
combination with stable isotope labeling and differential densitometry techniques to
determine relative protein abundance changes between separate samples.73; 75 It can
also be used (in combination with HPLC) in metabolic profiling experiments to
determine the products formed from the breakdown of molecules through metabolic
pathways.111
The methods improved upon and developed in this dissertation can be used to
increase the understanding of the mechanisms and biological processes which occur
in the plasma membrane. The plasma membrane is a major focal point for research in
the area of drug design and targeted therapies, and although there is a significant
amount of interest by biotechnology and pharmaceutical companies in the proteins
found in the plasma membrane, relatively little is known about it due to the analytical
challenges in isolation and separation.

128
Proteins identified can be used for identifying protein markers for early disease
detection.112 The information gained can also be used to design targeted therapies for
the treatment of cancer and other diseases.113 Information about protein expression in
different disease states can help to elucidate the mechanisms of disease progression
along with the causes of disease.
With the increases in the technology and advances in automation and bioinformatics,
mass spectrometry may some day be used in doctors’ offices for routine diagnostics
and health examinations. Miniaturization of mass spectrometers and the decreases in
instrument cost may allow routine screening of blood samples using the proteins from
blood plasma or tissue biopsies taken from patients and this information could be
critical for early diagnosis.
The improved method we developed for the isolation of plasma membranes in
combination with mass spectrometry and proteomics allowed us to identify many
proteins found in the plasma membrane.48 The high level of plasma membrane
enrichment achieved on the front end of the experiments allows for a much more
detailed downstream analysis. This isolation method can almost be thought of as a
first dimension of separation. Over 95% of the cellular components are separated,
creating a fraction which is much less complex then the whole cell lysate. Combining
this sub-cellular fractionation along with separation by SDS-PAGE and LC-MS
provided a detailed analysis of the proteins from the plasma membrane.

129
Our experiments have shown that this technique works with both suspension cell
culture and adherent cell cultures. The technique should also be transferable to tissue
sample analysis and primary cell lines.53; 54 Information obtained from this type of
analysis may eventually be used to diagnose the presence and type of cancer in
individual patients and can also be used to determine the mechanisms involved in
drug resistance as is discussed in this dissertation.
The technique of in vivo metabolic labeling of cells in culture using stable isotopes
allows proteins to be labeled prior to cell lysis.72 Typically, proteins or peptides are
labeled after cell lysis and the isolation of the desired protein fraction. By labeling
during cell growth, as described in this dissertation, sample loss can be reduced due to
the decrease in sample handling.
In closing, this dissertation outlines a method for the isolation, identification, and
quantitation of plasma membrane proteins isolated from cell cultures. The
information obtained from these types of comparative proteomic analyses can help to
elucidate the mechanisms involved in drug resistance.

130
References
1. Kochanek, K. D. & Smith, B. L. (2004). Deaths: preliminary data for 2002. Natl Vital Stat Rep 52, 1-47.
2. Edwards, B. K., Howe, H. L., Ries, L. A., Thun, M. J., Rosenberg, H. M., Yancik, R., Wingo, P. A., Jemal, A. & Feigal, E. G. (2002). Annual report to the nation on the status of cancer, 1973-1999, featuring implications of age and aging on U.S. cancer burden. Cancer 94, 2766-92.
3. Brenner, B., Ilson, D. H. & Minsky, B. D. (2004). Treatment of localized esophageal cancer. Semin Oncol 31, 554-65.
4. Chagpar, A. B. (2004). Advances in the management of localized breast cancer: an overview. J Ky Med Assoc 102, 202-8.
5. Hurria, A. & Kris, M. G. (2003). Management of lung cancer in older adults. CA Cancer J Clin 53, 325-41.
6. Hurley, L. H. (2002). DNA and its associated processes as targets for cancer therapy. Nat Rev Cancer 2, 188-200.
7. Gottesman, M. M., Fojo, T. & Bates, S. E. (2002). Multidrug resistance in cancer: role of ATP-dependent transporters. Nat Rev Cancer 2, 48-58.
8. Ling, V., Gerlach, J. & Kartner, N. (1984). Multidrug resistance. Breast Cancer Res Treat 4, 89-94.
9. Scotto, K. W. & Johnson, R. A. (2001). Transcription of the multidrug resistance gene MDR1: a therapeutic target. Mol Interv 1, 117-25.
10. Karwatsky, J. M. & Georges, E. (2004). Drug binding domains of MRP1 (ABCC1) as revealed by photoaffinity labeling. Curr Med Chem Anti-Canc Agents 4, 19-30.
11. Donnelly, J. G. (2004). Pharmacogenetics in cancer chemotherapy: balancing toxicity and response. Ther Drug Monit 26, 231-5.
12. Townsend, D. M. & Tew, K. D. (2003). The role of glutathione-S-transferase in anti-cancer drug resistance. Oncogene 22, 7369-75.
13. McFadyen, M. C., McLeod, H. L., Jackson, F. C., Melvin, W. T., Doehmer, J. & Murray, G. I. (2001). Cytochrome P450 CYP1B1 protein expression: a

131
novel mechanism of anticancer drug resistance. Biochem Pharmacol 62, 207-12.
14. McFadyen, M. C., Melvin, W. T. & Murray, G. I. (2004). Cytochrome P450 CYP1B1 activity in renal cell carcinoma. Br J Cancer 91, 966-71.
15. Howbrook, D. N., van der Valk, A. M., O'Shaughnessy, M. C., Sarker, D. K., Baker, S. C. & Lloyd, A. W. (2003). Developments in microarray technologies. Drug Discov Today 8, 642-51.
16. Templin, M. F., Stoll, D., Schrenk, M., Traub, P. C., Vohringer, C. F. & Joos, T. O. (2002). Protein microarray technology. Trends Biotechnol 20, 160-6.
17. Ashurst, J. L. & Collins, J. E. (2003). Gene annotation: prediction and testing. Annu Rev Genomics Hum Genet 4, 69-88.
18. Kearney, P. & Thibault, P. (2003). Bioinformatics meets proteomics--bridging the gap between mass spectrometry data analysis and cell biology. J Bioinform Comput Biol 1, 183-200.
19. Dreger, M. (2003). Subcellular proteomics. Mass Spectrom Rev 22, 27-56.
20. Srinivas, K. S., Chandrasekar, G., Srivastava, R. & Puvanakrishnan, R. (2004). A novel protocol for the subcellular fractionation of C3A hepatoma cells using sucrose density gradient centrifugation. J Biochem Biophys Methods 60, 23-7.
21. Thomson, J. J. (1897). Cathode Rays. Philos Mag 44, 293.
22. Karas, M. & Hillenkamp, F. (1988). Laser desorption ionization of proteins with molecular masses exceeding 10,000 daltons. Anal Chem 60, 2299-301.
23. Karas, M. & Kruger, R. (2003). Ion formation in MALDI: the cluster ionization mechanism. Chem Rev 103, 427-40.
24. Tanaka, K. W., H.; Ido, Y.; Akita, S.; Yoshida, Y.; Yoshida, T.,. (1988). Protein and Polymer Analyses up to m/z 100 000 by Laser Ionization Time-of flight Mass Spectrometry. Rapid Commun. Mass Spectrom 2, 151-153.
25. Fenn, J. B., Mann, M., Meng, C. K., Wong, S. F. & Whitehouse, C. M. (1989). Electrospray ionization for mass spectrometry of large biomolecules. Science246, 64-71.
26. Whitehouse, C. M., Dreyer, R. N., Yamashita, M. & Fenn, J. B. (1985). Electrospray interface for liquid chromatographs and mass spectrometers. Anal Chem 57, 675-9.

132
27. Vertes, A. (1991). Laser desorption of large molecules: mechanisms and models. In Methods and mechanisms for producing ions from large molecules(Ens, K. G. S. a. W., ed.), pp. 275-286. Plenum Press, New York.
28. Vertes, A. I., G. Gijbels, R. (1993). Hydrodynamic model of matrix assisted laser desorption mass spectrometry. Anal Chem 65, 2389-2393.
29. Yamashita, M. F., J. (1984). J Phys Chem 88, 4451-4459.
30. Alexandrov, M. G., L. Krasnov, V. Nikolaev, V. Pavlenko, V. Shkurov, V. (1984). Dokl Akad Nauk SSSR 227, 379-383.
31. VerBerkmoes, N. C., Bundy, J. L., Hauser, L., Asano, K. G., Razumovskaya, J., Larimer, F., Hettich, R. L. & Stephenson, J. L., Jr. (2002). Integrating "top-down" and "bottom-up" mass spectrometric approaches for proteomic analysis of Shewanella oneidensis. J Proteome Res 1, 239-52.
32. Cottrell, J. S. (1994). Protein identification by peptide mass fingerprinting. Pept Res 7, 115-24.
33. Perkins, D. N., Pappin, D. J., Creasy, D. M. & Cottrell, J. S. (1999). Probability-based protein identification by searching sequence databases using mass spectrometry data. Electrophoresis 20, 3551-67.
34. Laemmli, U. K. (1970). Cleavage of structural proteins during the assembly of the head of bacteriophage T4. Nature 227, 680-5.
35. Williams, S. D. & David, S. S. (1998). Evidence that MutY is a monofunctional glycosylase capable of forming a covalent Schiff base intermediate with substrate DNA. Nucleic Acids Res 26, 5123-33.
36. Segrest, J. J., R. (1972). Molecular weight determination of glycoproteins by polyacrylamide gel electrophoresis in sodium dodecyl sulfate. In Methods Enzymol, Vol. 28B, pp. 54-63.
37. Hames, B. (1990). One-dimensional polyacrylamide gel electrophoresis. In Gel electrophoresis of Proteins: A practical approach 2nd Edition edit. (Hames, B. a. R., D., ed.). Oxford University Press, New York.
38. Wu, C. C. & Yates, J. R., 3rd. (2003). The application of mass spectrometry to membrane proteomics. Nat Biotechnol 21, 262-7.
39. Wu, C. C., MacCoss, M. J., Howell, K. E. & Yates, J. R., 3rd. (2003). A method for the comprehensive proteomic analysis of membrane proteins. Nat Biotechnol 21, 532-8.

133
40. Santoni, V., Molloy, M. & Rabilloud, T. (2000). Membrane proteins and proteomics: un amour impossible? Electrophoresis 21, 1054-70.
41. Washburn, M. P., Wolters, D. & Yates, J. R., 3rd. (2001). Large-scale analysis of the yeast proteome by multidimensional protein identification technology. Nat Biotechnol 19, 242-7.
42. Alberts, B. B., D. Lewis, J. Raff, M. Roberts, K. Watson, J. (1994). Membrane Structure. In Molecular Biology of the Cell, pp. 446-506. Garland Publishing, New York.
43. Spector, D. L. G., R.D.; Leinwand, L.A. (1998). Cells : A Laboratory Manual. Culture and Biochemical Analysis of Cells (Spector, D. L. G., R.D.; Leinwand, L.A, Ed.), 1. 3 vols, Cold Spring Harbor Laboratory Press, Cold Spring Harbor.
44. Ramsby, M. L. & Makowski, G. S. (1999). Differential detergent fractionation of eukaryotic cells. Analysis by two-dimensional gel electrophoresis. Methods Mol Biol 112, 53-66.
45. Molloy, M. P., Herbert, B. R., Walsh, B. J., Tyler, M. I., Traini, M., Sanchez, J. C., Hochstrasser, D. F., Williams, K. L. & Gooley, A. A. (1998). Extraction of membrane proteins by differential solubilization for separation using two-dimensional gel electrophoresis. Electrophoresis 19, 837-44.
46. Chaney, L. K. & Jacobson, B. S. (1983). Coating cells with colloidal silica for high yield isolation of plasma membrane sheets and identification of transmembrane proteins. J Biol Chem 258, 10062-72.
47. Stolz, D. B. & Jacobson, B. S. (1992). Examination of transcellular membrane protein polarity of bovine aortic endothelial cells in vitro using the cationic colloidal silica microbead membrane-isolation procedure. J Cell Sci 103 ( Pt 1), 39-51.
48. Rahbar, A. Fenselau, C. (2004). Integration of Jacobson's Pellicle Method into Proteomic Strategies for Plasma Membrane Proteins. J Proteome Res in press.
49. Hathout, Y., Riordan, K., Gehrmann, M. & Fenselau, C. (2002). Differential protein expression in the cytosol fraction of an MCF-7 breast cancer cell line selected for resistance toward melphalan. J Proteome Res 1, 435-42.
50. Dvorakova, K., Waltmire, C. N., Payne, C. M., Tome, M. E., Briehl, M. M. & Dorr, R. T. (2001). Induction of mitochondrial changes in myeloma cells by imexon. Blood 97, 3544-51.
134
51. Zhao, Y., Zhang, W. & Kho, Y. (2004). Proteomic analysis of integral plasma membrane proteins. Anal Chem 76, 1817-23.
52. Shin, B. K., Wang, H., Yim, A. M., Le Naour, F., Brichory, F., Jang, J. H., Zhao, R., Puravs, E., Tra, J., Michael, C. W., Misek, D. E. & Hanash, S. M. (2003). Global profiling of the cell surface proteome of cancer cells uncovers an abundance of proteins with chaperone function. J Biol Chem 278, 7607-16.
53. Schuurman, B., Beelen, R. H., Heuff, G., Scheper, R. J., Claessen, A. M. & Meyer, S. (1995). Fresh colorectal tumor cells isolated from individual patients differ in their susceptibility to monocyte mediated cytotoxicity. J Surg Oncol 60, 18-23.
54. Dunfield, L. D., Shepherd, T. G. & Nachtigal, M. W. (2002). Primary culture and mRNA analysis of human ovarian cells. Biol Proced Online 4, 55-61.
55. Kellam, B., De Bank, P. A. & Shakesheff, K. M. (2003). Chemical modification of mammalian cell surfaces. Chem Soc Rev 32, 327-37.
56. Martin-Rendon, E. & Blake, D. J. (2003). Protein glycosylation in disease: new insights into the congenital muscular dystrophies. Trends Pharmacol Sci24, 178-83.
57. Blonder, J., Conrads, T. P., Yu, L. R., Terunuma, A., Janini, G. M., Issaq, H. J., Vogel, J. C. & Veenstra, T. D. (2004). A detergent- and cyanogen bromide-free method for integral membrane proteomics: application to Halobacterium purple membranes and the human epidermal membrane proteome. Proteomics4, 31-45.
58. Rabilloud, T. (2003). Membrane proteins ride shotgun. Nat Biotechnol 21, 508-10.
59. Simpson, R. J., Connolly, L. M., Eddes, J. S., Pereira, J. J., Moritz, R. L. & Reid, G. E. (2000). Proteomic analysis of the human colon carcinoma cell line (LIM 1215): development of a membrane protein database. Electrophoresis21, 1707-32.
60. Adam, P. J., Boyd, R., Tyson, K. L., Fletcher, G. C., Stamps, A., Hudson, L., Poyser, H. R., Redpath, N., Griffiths, M., Steers, G., Harris, A. L., Patel, S., Berry, J., Loader, J. A., Townsend, R. R., Daviet, L., Legrain, P., Parekh, R. & Terrett, J. A. (2003). Comprehensive proteomic analysis of breast cancer cell membranes reveals unique proteins with potential roles in clinical cancer. J Biol Chem 278, 6482-9.

135
61. Jensen, O. N., Wilm, M., Shevchenko, A. & Mann, M. (1999). Sample preparation methods for mass spectrometric peptide mapping directly from 2-DE gels. Methods Mol Biol 112, 513-30.
62. Luche, S., Santoni, V. & Rabilloud, T. (2003). Evaluation of nonionic and zwitterionic detergents as membrane protein solubilizers in two-dimensional electrophoresis. Proteomics 3, 249-53.
63. Krogh, A., Larsson, B., von Heijne, G. & Sonnhammer, E. L. (2001). Predicting transmembrane protein topology with a hidden Markov model: application to complete genomes. J Mol Biol 305, 567-80.
64. Blonder, J., Terunuma, A., Conrads, T. P., Chan, K. C., Yee, C., Lucas, D. A., Schaefer, C. F., Yu, L. R., Issaq, H. J., Veenstra, T. D. & Vogel, J. C. (2004). A proteomic characterization of the plasma membrane of human epidermis by high-throughput mass spectrometry. J Invest Dermatol 123, 691-9.
65. Blonder, J., Rodriguez-Galan, M. C., Chan, K. C., Lucas, D. A., Yu, L. R., Conrads, T. P., Issaq, H. J., Young, H. A. & Veenstra, T. D. (2004). Analysis of murine natural killer cell microsomal proteins using two-dimensional liquid chromatography coupled to tandem electrospray ionization mass spectrometry. J Proteome Res 3, 862-70.
66. Blonder, J., Hale, M. L., Lucas, D. A., Schaefer, C. F., Yu, L. R., Conrads, T. P., Issaq, H. J., Stiles, B. G. & Veenstra, T. D. (2004). Proteomic analysis of detergent-resistant membrane rafts. Electrophoresis 25, 1307-18.
67. Brown, K. J. & Fenselau, C. (2004). Investigation of doxorubicin resistance in MCF-7 breast cancer cells using shot-gun comparative proteomics with proteolytic 18O labeling. J Proteome Res 3, 455-62.
68. Turecek, F. (2002). Mass spectrometry in coupling with affinity capture-release and isotope-coded affinity tags for quantitative protein analysis. J Mass Spectrom 37, 1-14.
69. Gygi, S. P., Rist, B., Gerber, S. A., Turecek, F., Gelb, M. H. & Aebersold, R. (1999). Quantitative analysis of complex protein mixtures using isotope-coded affinity tags. Nat Biotechnol 17, 994-9.
70. Schmidt, F., Donahoe, S., Hagens, K., Mattow, J., Schaible, U. E., Kaufmann, S. H., Aebersold, R. & Jungblut, P. R. (2004). Complementary analysis of the Mycobacterium tuberculosis proteome by two-dimensional electrophoresis and isotope-coded affinity tag technology. Mol Cell Proteomics 3, 24-42.

136
71. Krause, E., Wenschuh, H. & Jungblut, P. R. (1999). The dominance of arginine-containing peptides in MALDI-derived tryptic mass fingerprints of proteins. Anal Chem 71, 4160-5.
72. Gehrmann, M. H., Y. Fenselau, C. (2004). Evaluation of Metabolic Labeling for Comparative Proteomics in Breast Cancer Cells. J Proteome Res In press.
73. Gehrmann, M. L., Fenselau, C. & Hathout, Y. (2004). Highly altered proteinexpression profile in the adriamycin resistant MCF-7 cell line. J Proteome Res3, 403-9.
74. Shefcheck, K., Yao, X. & Fenselau, C. (2003). Fractionation of cytosolic proteins on an immobilized heparin column. Anal Chem 75, 1691-8.
75. Yao, X., Freas, A., Ramirez, J., Demirev, P. A. & Fenselau, C. (2001). Proteolytic 18O labeling for comparative proteomics: model studies with two serotypes of adenovirus. Anal Chem 73, 2836-42.
76. Jiang, H. & English, A. M. (2002). Quantitative analysis of the yeast proteome by incorporation of isotopically labeled leucine. J Proteome Res 1, 345-50.
77. Vogt, J. A., Schroer, K., Holzer, K., Hunzinger, C., Klemm, M., Biefang-Arndt, K., Schillo, S., Cahill, M. A., Schrattenholz, A., Matthies, H. & Stegmann, W. (2003). Protein abundance quantification in embryonic stem cells using incomplete metabolic labelling with 15N amino acids, matrix-assisted laser desorption/ionisation time-of-flight mass spectrometry, and analysis of relative isotopologue abundances of peptides. Rapid Commun Mass Spectrom 17, 1273-82.
78. Doyle, L. A., Yang, W., Abruzzo, L. V., Krogmann, T., Gao, Y., Rishi, A. K. & Ross, D. D. (1998). A multidrug resistance transporter from human MCF-7 breast cancer cells. Proc Natl Acad Sci U S A 95, 15665-70.
79. Zhang, S., Yang, X. & Morris, M. E. (2004). Flavonoids are inhibitors of breast cancer resistance protein (ABCG2)-mediated transport. Mol Pharmacol65, 1208-16.
80. Doyle, L. A. & Ross, D. D. (2003). Multidrug resistance mediated by the breast cancer resistance protein BCRP (ABCG2). Oncogene 22, 7340-58.
81. Lee, J. S., Scala, S., Matsumoto, Y., Dickstein, B., Robey, R., Zhan, Z., Altenberg, G. & Bates, S. E. (1997). Reduced drug accumulation and multidrug resistance in human breast cancer cells without associated P-glycoprotein or MRP overexpression. J Cell Biochem 65, 513-26.

137
82. Robey, R. W., Medina-Perez, W. Y., Nishiyama, K., Lahusen, T., Miyake, K., Litman, T., Senderowicz, A. M., Ross, D. D. & Bates, S. E. (2001). Overexpression of the ATP-binding cassette half-transporter, ABCG2 (Mxr/BCrp/ABCP1), in flavopiridol-resistant human breast cancer cells. Clin Cancer Res 7, 145-52.
83. Oda, Y., Huang, K., Cross, F. R., Cowburn, D. & Chait, B. T. (1999). Accurate quantitation of protein expression and site-specific phosphorylation. Proc Natl Acad Sci U S A 96, 6591-6.
84. Conrads, T. P., Alving, K., Veenstra, T. D., Belov, M. E., Anderson, G. A., Anderson, D. J., Lipton, M. S., Pasa-Tolic, L., Udseth, H. R., Chrisler, W. B., Thrall, B. D. & Smith, R. D. (2001). Quantitative analysis of bacterial and mammalian proteomes using a combination of cysteine affinity tags and 15N-metabolic labeling. Anal Chem 73, 2132-9.
85. Ong, S. E., Blagoev, B., Kratchmarova, I., Kristensen, D. B., Steen, H., Pandey, A. & Mann, M. (2002). Stable isotope labeling by amino acids in cell culture, SILAC, as a simple and accurate approach to expression proteomics. Mol Cell Proteomics 1, 376-86.
86. Ong, S. E., Kratchmarova, I. & Mann, M. (2003). Properties of 13C-substituted arginine in stable isotope labeling by amino acids in cell culture (SILAC). J Proteome Res 2, 173-81.
87. Everley, P. A., Krijgsveld, J., Zetter, B. R. & Gygi, S. P. (2004). Quantitative cancer proteomics: stable isotope labeling with amino acids in cell culture (SILAC) as a tool for prostate cancer research. Mol Cell Proteomics 3, 729-35.
88. Krijgsveld, J., Ketting, R. F., Mahmoudi, T., Johansen, J., Artal-Sanz, M., Verrijzer, C. P., Plasterk, R. H. & Heck, A. J. (2003). Metabolic labeling of C. elegans and D. melanogaster for quantitative proteomics. Nat Biotechnol 21, 927-31.
89. Chen, Y. N., Mickley, L. A., Schwartz, A. M., Acton, E. M., Hwang, J. L. & Fojo, A. T. (1990). Characterization of adriamycin-resistant human breast cancer cells which display overexpression of a novel resistance-related membrane protein. J Biol Chem 265, 10073-80.
90. Mealey, K. L., Barhoumi, R., Burghardt, R. C., Safe, S. & Kochevar, D. T. (2002). Doxycycline induces expression of P glycoprotein in MCF-7 breast carcinoma cells. Antimicrob Agents Chemother 46, 755-61.
91. Hall, J. G., Cory, A. H. & Cory, J. G. (1999). Lack of competition of substrates for P-glycoprotein in MCF-7 breast cancer cells overexpressing MDR1. Adv Enzyme Regul 39, 113-28.

138
92. Qian, Z. M., Li, H., Sun, H. & Ho, K. (2002). Targeted drug delivery via the transferrin receptor-mediated endocytosis pathway. Pharmacol Rev 54, 561-87.
93. Aisen, P. (2004). Transferrin receptor 1. Int J Biochem Cell Biol 36, 2137-43.
94. Lewis, D. F. (2004). 57 varieties: the human cytochromes P450. Pharmacogenomics 5, 305-18.
95. Berestetskaya, Y. V., Faure, M. P., Ichijo, H. & Voyno-Yasenetskaya, T. A. (1998). Regulation of apoptosis by alpha-subunits of G12 and G13 proteins via apoptosis signal-regulating kinase-1. J Biol Chem 273, 27816-23.
96. Althoefer, H., Eversole-Cire, P. & Simon, M. I. (1997). Constitutively active Galphaq and Galpha13 trigger apoptosis through different pathways. J Biol Chem 272, 24380-6.
97. Campbell, W. A. & Thompson, N. L. (2001). Overexpression of LAT1/CD98 light chain is sufficient to increase system L-amino acid transport activity in mouse hepatocytes but not fibroblasts. J Biol Chem 276, 16877-84.
98. Lee, J. W. & Juliano, R. (2004). Mitogenic signal transduction by integrin-and growth factor receptor-mediated pathways. Mol Cells 17, 188-202.
99. Jin, H. & Varner, J. (2004). Integrins: roles in cancer development and as treatment targets. Br J Cancer 90, 561-5.
100. Felding-Habermann, B., O'Toole, T. E., Smith, J. W., Fransvea, E., Ruggeri, Z. M., Ginsberg, M. H., Hughes, P. E., Pampori, N., Shattil, S. J., Saven, A. & Mueller, B. M. (2001). Integrin activation controls metastasis in human breast cancer. Proc Natl Acad Sci U S A 98, 1853-8.
101. Meyer, A., van Golen, C. M., Kim, B., van Golen, K. L. & Feldman, E. L. (2004). Integrin expression regulates neuroblastoma attachment and migration. Neoplasia 6, 332-42.
102. Zhang, J. Z., Hayashi, H., Ebina, Y., Prohaska, R. & Ismail-Beigi, F. (1999). Association of stomatin (band 7.2b) with Glut1 glucose transporter. Arch Biochem Biophys 372, 173-8.
103. Zhang, J. Z., Abbud, W., Prohaska, R. & Ismail-Beigi, F. (2001). Overexpression of stomatin depresses GLUT-1 glucose transporter activity. Am J Physiol Cell Physiol 280, C1277-83.

139
104. Mangino, G., Grazia Capri, M., Barnaba, V. & Alberti, S. (2002). Presentation of native TROP-2 tumor antigens to human cytotoxic T lymphocytes by engineered antigen-presenting cells. Int J Cancer 101, 353-9.
105. Ripani, E., Sacchetti, A., Corda, D. & Alberti, S. (1998). Human Trop-2 is a tumor-associated calcium signal transducer. Int J Cancer 76, 671-6.
106. Yanase, K., Tsukahara, S., Asada, S., Ishikawa, E., Imai, Y. & Sugimoto, Y. (2004). Gefitinib reverses breast cancer resistance protein-mediated drug resistance. Mol Cancer Ther 3, 1119-25.
107. Lodish, H. B., Arnold; Zipursky, S. Lawrence; Matsudaira, Paul; Baltimore, David; Darnell, James E. (1999). Protein Sorting: Organelle Biogenesis and Protein Secretion. In Molecular Biology of the Cell 4th ed. edit., Vol. Chapter 17. W. H. Freeman & Co, New York.
108. Strachan, T. a. R. & P., A. (1999). Gene therapy and other molecular genetic-based therapeutic approaches. In Human Molecular Genetics 2 2nd ed. edit., Vol. Chapter 22. BIOS Scientific Publishers Ltd, Oxford, UK.
109. Yao, Z. P., Afonso, C. & Fenselau, C. (2002). Rapid microorganism identification with on-slide proteolytic digestion followed by matrix-assisted laser desorption/ionization tandem mass spectrometry and database searching. Rapid Commun Mass Spectrom 16, 1953-6.
110. Cargile, B. J., Bundy, J. L., Freeman, T. W. & Stephenson, J. L., Jr. (2004). Gel based isoelectric focusing of peptides and the utility of isoelectric point in protein identification. J Proteome Res 3, 112-9.
111. Guttman, A., Varoglu, M. & Khandurina, J. (2004). Multidimensional separations in the pharmaceutical arena. Drug Discov Today 9, 136-44.
112. Rai, A. J. & Chan, D. W. (2004). Cancer proteomics: Serum diagnostics for tumor marker discovery. Ann N Y Acad Sci 1022, 286-94.
113. Dyba, M., Tarasova, N. I. & Michejda, C. J. (2004). Small molecule toxins targeting tumor receptors. Curr Pharm Des 10, 2311-34.