Abstract Proceedings ICOSCM 2016 - RCOSCM | … · 2016-08-19 · Moderating the effects of Lean...
145
Abstract Proceedings ICOSCM 2016
Transcript of Abstract Proceedings ICOSCM 2016 - RCOSCM | … · 2016-08-19 · Moderating the effects of Lean...

Abstract Proceedings
ICOSCM 2016
2 Page
Contents
Symbiosis International University (SIU) ....................................................................................................... 6
Symbiosis Institute of Operations Management (SIOM) .............................................................................. 6
Patron’s Message .......................................................................................................................................... 8
Convener’s Message ..................................................................................................................................... 9
Co‐Convener’s Message .............................................................................................................................. 10
Key Note Speakers ....................................................................................................................................... 11
Prof. S.G. Deshmukh......................................................................................................................... 11
Prof. Nyoman Pujawan .................................................................................................................... 11
Prof. S. Rangnekar ............................................................................................................................ 12
Prof. Padmanav Acharya .................................................................................................................. 12
Prof Jitesh J Thakkar ......................................................................................................................... 13
Prof. Kamapan Mukherjee ............................................................................................................... 13
Prof. Jaideep Motwani ..................................................................................................................... 14
Prof. Manoj Dash .............................................................................................................................. 14
Mr. Ashish Tanwar ............................................................................................................................ 15
Mrs. Ramya Mishra ........................................................................................................................... 15
Schedule: 11th Aug. 2016 (Day 1) ............................................................................................................... 16
Schedule: 12th Aug. 2016 (Day 2) ............................................................................................................... 17
Schedule: 13th Aug. 2016 (Day 3) ............................................................................................................... 18
Technical Sessions: Day 1 ............................................................................................................................ 19
Technical Sessions: Day 1 ............................................................................................................................ 20
Technical Sessions: Day 2 ............................................................................................................................ 21
Technical Sessions: Day 2 ............................................................................................................................ 22
List of Accepted Abstracts ........................................................................................................................... 23
1. Green Evolution in Hospitality Management.......................................................................................... 23
2. Deciding the Vendor Selection Criteria for Capital Procurement ........................................................... 24
3. Utilization of Big Data to Enhance Speed of Idea Generation ................................................................ 24
4. A framework for locating and equipping marine oil‐response facilities ................................................. 25
5. An analytical approach to rail‐truck intermodal transportation of hazardous materials with
capacity selection & terminal congestion ................................................................................................... 28
6. Idea for a Lean‐Agile supply chain for the Armed Forces. ...................................................................... 30
7. Synchronizing Electrical Energy Generation and Distribution Supply Chains ......................................... 31
3 Page
8. Greener Supply Chains towards Environmental Protection in Food Processing Industries ................... 31
9. A review on the experimental usage of classical, Shanin and Taguchi design of experiment (DOE)
with Data Mining approach using six sigma DMAIC. .................................................................................. 32
10. Performance Measurement of supply chain: a changing paradigm ..................................................... 34
11. Optimal replenishment policy and preservation technology investment for a non‐instantaneous
deteriorating item with stock‐dependent demand .................................................................................... 38
12. Role of HR in Lean Manufacturing Implementation – a Comprehensive Study ................................... 40
13. Coordinating a Three‐echelon Supply Chain with Uncertain Demand and Random Yield ................... 41
14. Investigations on Raw Material Supplier Selection Methodology Using Fuzzy Logic ........................... 43
15. A Hybrid Model Based On SWARA And WASPAS MCDM Methods For Supplier Selection. ................. 43
16. Routing Alternative Fuel‐powered Vehicles for Garbage Collection .................................................... 43
17. Role of Big Data in Decision Making ..................................................................................................... 44
18. Service Quality in Selected Hospitals in Indore City: An Empirical Study ............................................. 44
19. Reverse logistics network design and re manufacturing using new module supplier.......................... 45
20. A taboo search heuristic with discrete‐event simulation for scheduling staff in call centers .............. 46
21. ISM Based modeling of supply chain management enablers ............................................................... 48
22. Price and credit period sensitive competitive supply chain model ...................................................... 50
23. Ergonomics Enhancing Agricultural Systems Productivity .................................................................... 51
24. Application of TQM in Resolving E‐Commerce Challenges in Rural Markets ....................................... 51
25. Mobile Computing, Cloud & Internet of Things in SCM ........................................................................ 52
26. An Examination of Supply Chain Performance Factors based on the Quality of Relationships ........... 55
27. Moderating the effects of Lean manufacturing: A contextual framework with respect to process
industry ....................................................................................................................................................... 59
28. Logistics Management: Opportunities and Challenges with Reference to Selected Organizations ..... 59
29. Does magnitude of penalties matter? An empirical investigation in the healthcare context .............. 60
30. Category Management: Enriching Customers private label purchase ................................................. 61
31. Assessing Risk by the High Net worth Investors of India in Financial Decision .................................... 62
32. Application of Behavioral Finance and econometrics to understand the High Net worth
Individuals investors during Uncertainties and Risk in India ...................................................................... 63
33. Application of Optimizing Techniques in Indian Auto Ancillary Industries for SCM. ............................ 64
34. Building the foundation for Supply Chain Costing by identifying and prioritizing the elements
involved using TOPSIS. ................................................................................................................................ 65
35. Military Aircraft LRUs with MRO Supply chain improvement: Self Reliance in Aircraft MRO
business and Sustainability for future ........................................................................................................ 68
36. Redesign of Supply Chain Network of Footwear Manufacturing Company and impact of GST using
Sensitivity Analysis tool ............................................................................................................................... 69
4 Page
37. Energy efficient reconfigurable architecture for motion estimation in video coding .......................... 72
38. Lot‐Sizing for Forecasted Demand at Metal Finishing Industry ............................................................ 72
39. Vendor Rating & Inventory Management in an Indian Start‐up: A combined AHP‐TOPSIS
approach ..................................................................................................................................................... 75
40. Demand forecasting, Economic Order Quantity and Reorder point calculation of a hypothetical
company producing solar panels ................................................................................................................ 78
41. Research on Procurement Management of MSE using system dynamics methodology ..................... 80
42. Approaches for combining operational decisions for maintenance and quality control: A review ..... 82
43. Multicommodity Network Design under Congestion ........................................................................... 84
44. Stepping on the Scale: SOLAS’ Container Weight Amendment ............................................................ 84
45. Benefits & Scope of GPS in Logistics and in Different Works of Life .................................................... 85
46. Interdependence among dimensions of Sustainable Supply Chain: evidence from Indian leather
industry ....................................................................................................................................................... 87
47. Integrating SME’s of Indian Switchgear and Transformer Industry using Lean Supply Chain
Management Practices ............................................................................................................................... 89
48. Supplier Selection Using Combined SWARA and WASPAS – A Case study of Indian Cement
Industry ....................................................................................................................................................... 90
49. Extending Green Practices in Supply Chain Management .................................................................... 90
50. Lean Production Supply Chain Management as Driver towards Enhancing Product Quality and
Business Performance ................................................................................................................................. 91
51. Lean Supply Chain in Manufacturing Unit using Value Stream Mapping. ............................................ 92
52. Supply chain performance measurement framework for small and medium scale enterprises ......... 92
53. Lean assessment parameters and roadblocks in implementation of Lean Management in Indian
Auto component Industry: A combined AHP & MICMAC approach ........................................................... 94
54. Benefits, Challenges and Bridges to Effective Supply Chain Management. ......................................... 95
55. Prioritization of Antecedents for the Adoption and Execution of Supply Chain Management using
TOPSIS ......................................................................................................................................................... 96
56. Digital Retail: A Sustainable Opportunity ............................................................................................. 96
57. A Comparative Study on Automation Feasibility across Two Tools and Report Benefit Assessment .. 97
58. New product development through quality function deployment ...................................................... 99
59. Interpretive Structural Modeling of Supply Chain Risks in a Manufacturing Firm ............................. 100
60. Evaluation of Supplier(s) for an Automobile Firm. ............................................................................. 101
61. A case on Business Process management........................................................................................... 102
62. Overall Equipment Effectiveness (OEE) to increase productivity of work centre. ............................. 103
63. Risk Analysis in Global Supply Chain Management: Application of AHP and DEMATEL .................... 105
64. Process development using ISM in Ecommerce business. ................................................................. 106
5 Page
65. Identification and evaluation of parameters affecting ERP System Implementation in a
manufacturing firm ................................................................................................................................... 106
66. Interpretive Structural modelling of Supply Chain Risk Management ............................................... 107
67. Kumbh Mela: Nasik City Logistics study of the state shuttle‐bus transportation system using
simulation approach ................................................................................................................................. 108
68. Customer Roll out ‐ Operationalization of Customer Contract .......................................................... 110
69. Supply Chain Management: Asset Control and its impact on the value of firm ................................. 110
70. Sector analysis‐An automotive supply chain model for demand driven environment ...................... 111
71. Performance Issues in Supply Chain Management Using SAP‐LAP Framework: A Case Study
Evidence from Manufacturing Industry .................................................................................................... 113
72. Strategic Alignment of future supply chain with existing supply chain of LNG distributing
organization in India ................................................................................................................................. 114
73. Transporter selection using AHP analysis & Central warehouse Planning ......................................... 115
74. Strategic Initiative for Supply Chain Management in Different Sectors. ............................................ 116
75. Extending Green Practices across supply chain: an empirical study .................................................. 117
76. Performance Measurement of supply chain: A Balance Score Card (BSC) approach ......................... 121
77. Modeling Supply Chain Network Design and Product Recovery Planning Under Demand
Uncertainty ............................................................................................................................................... 122
78. A Comparative Study between AHP and TOPSIS to Prioritize Supply Chain Flexibility Dimensions:
A Case Study of Indian FMCG Sector ........................................................................................................ 125
79. A combined AHP‐ANP approach to evaluate supply chain of electronic business ............................. 126
80. Identifying dimensions of Student Support Systems in eLearning courses and their causal
relationship using AHP and DEMATEL ...................................................................................................... 126
81. The Role of Information Uncertainty on Cement Industry‐ (Using Combined AHP‐DEMATEL
Analysis) .................................................................................................................................................... 128
Authors’ Index ........................................................................................................................................... 132
Leadership ................................................................................................................................................. 144
Organizing Team ....................................................................................................................................... 144
6 Page
Symbiosis International University (SIU)
Padma Bhushan, Dr. S.B Mujumdar established Symbiosis on the principles of Vedic thought of “World as One Family” and is resplendent of the activities and students of several countries. With changes sweeping across India's higher education environment, SIU has established need based institutes across the 7 faculties of Law, Management, Computer studies, Health & Bio‐medical Sciences, Media, Communication & Design, Humanities & Social Sciences and Engineering. Symbiosis International University continues to grow, evolving by benchmarking itself against the best in the world. The University also has MOU'S of collaboration with several renowned universities of the world and encourages students & faculty to participate in its programmes. The University is re‐accredited by NAAC with Grade 'A'. Symbiosis International University has 28 academic institutions spread over ten locations in Pune, Noida, Bangalore, Hyderabad and Nashik.
Research at SIU
Symbiosis International University offers a Ph.D. programme under the guidelines prescribed by the University Grants Commission (2009). The programme is offered in the 7 faculties of Law, Management, Computer Studies, Health & Biomedical Sciences, Media, Communication & Design, Humanities & Social Sciences and Engineering. Main focus:
Development of institutional research agenda and formulation of policy to reflect a
conscious effort for creating a congenial climate to nurture a research culture in the University.
Setting up a systematic procedure for administration of research programmes.
Research capacity building and mentoring to translate our efforts into high quality
research outcome.
Symbiosis Institute of Operations Management (SIOM)
Symbiosis Institute of Operations Management (SIOM) is born out of the conviction that ENGINEERS, if forged and chiseled in an exclusive B ‐School environment can be outstanding ''Techno ‐Business'' leaders. SIOM is India's only Institute dedicated to Operations Management, constituted with a vision of Empowering and Leading Operations Excellence. The curriculum includes SAP ERP training, Six Sigma Certification by KPMG, and facilitates CPIM, CSCP Certification. SIOM has been awarded the title of ''Institute with Best Industry Related Curriculum in Operations Management'' by the Dewang Mehta B ‐School Awards (2009), Dainik Bhaskar B ‐School Awards (2010) & Star News B –School Awards (2011), ABP news National School awards (2012), ET Now Awards (2013). SIOM bagged 3 prestigious awards at the 2nd Asia's Best Emerging B School Awards held in Singapore, viz., B School with Best Industry interface. Recently it is also the recipient of ''Education Excellence award at the 2nd CPO forum for its best education in SCM.
7 Page
Over the years the thirst to achieve operational excellence has led Symbiosis Institute of Operations Management to set newer benchmark every year for propelling the pedagogy provided in this institution. In its ambitious mission to create techno business leaders, capable of excelling in the field of operations, the institution throws in a perfect milieu of good academic curriculum and industry interface for students to learn and grow as operations professionals. In that spirit, Symbiosis Institute of Operations Management is organizing the “International Conference on Operations and Supply Chain Management” which solely focuses on the broader aspect of operations and supply chain management. This conference aims to bring together management professionals from industry and academics, research scholars, students, business leaders and entrepreneurs. The main theme of this conference is “Contemporary Trends in Operations and Supply Chain Management”. The conference intends to initiate discussions and create a platform to share knowledge and current trends in the field of Supply Chain Management and related topics like Risk Management, Global Business Operations, and Procurement Management etc. Each is of great importance to the current and possible future trends in Operations and Supply Chain Management. In a span of just three days (11‐13th August, 2016) many research papers will be presented by people from across the globe, exploring potentials of this field in today’s world. It will be a great opportunity for everyone in broadening their horizon of knowledge by being a part of ICOSCM.
8 Page
Patron’s Message
Dr. Vandana Sonwaney
Director, Symbiosis Institute of Operations Management Patron, ICOSCM 16
SIOM has always proven itself in the field of operations. It has evolved over years achieving laurels and recognitions for attaining operational excellence. SIOM, with a vision to lead in the field of operations has laid a strong foothold in academics especially through perseverance, adherent commitment and dedication. A way forward in this scenario is ICOSCM‐ International conference on operations and supply chain management. This would serve a rostrum for students, research scholars, business leaders, management professional from industries and many academicians to share their views, ideas and insights on particular theme. The theme chosen for this discussion is “Contemporary research trends in operations and supply chain management”. There are other areas put forth for discussion such as lean, agile manufacturing, procurement management etc., that will provide a comprehensive analysis of operations world. This would not only enable paper presentations, but also act as an estuary wherein young, vibrant innovators meet distinguished, imminent leaders from academics and business world. More than just a conference, it is a catalyst for pure and efficient knowledge transfer. For such an initiative which will serve a greater significance in chiseling a sustainable future, I cordially invite all for being a vital link in this supply chain network. Looking forward to a greater participation.

9 Page
Convener’s Message
Dr. Rohit Singh
Convener and Organizing Secretary, ICOSCM 16
This is the first one of a new series of annual academic international conferences Organized by Symbiosis Institute of Operations Management exploring on the theme “Contemporary research trends in operations and supply chain management”. Over the years SIOM has proved its mettle in academia and research. It is one of the pioneers in the field of operations and is now emerging as a center for excellence in operations management. This conference is the next big step to its glory which would witness many academic and industry stalwarts sharing their views on the recent trends in operations and supply chain management on a single platform. As the business progresses towards a new revolution, focus on operations and supply chain management is essential as they form the major factors for an organization’s profit. Hence it is imperative that strong and innovative ideas are put forth to realize the true potential for sustainable operational environment. I assure that the three days will keep you busy and productive.
10 Page
Co‐Convener’s Message
Dr. Ratna Paluri
Co‐Convener, ICOSCM 16
Symbiosis Institute of Operations Management (SIOM) has been contributing extensively to research in Operations Management. With increasing emphasis on sustainable operations, agility, digitalization and innovation, the field of operations and supply chain management is becoming more challenging and competitive. Against this backdrop the three‐day International Conference on Operations and Supply Chain Management at SIOM, is a confluence of the best of the brains from across the globe throwing light on the various aspects of Operations and SCM. Given the core theme of the conference being “Contemporary research trends in operations and supply chain management”, the conference provides a platform for knowledge sharing, deliberating and networking, thereby offering a lot on the platter for the participants.

11 Page
Key Note Speakers
Prof. S.G. Deshmukh DIRECTOR, IIIT GWALIOR
Prof. S. G. Deshmukh is currently associated as the director of IIIT, Gwalior. Post
obtaining his B.Tech and M.Tech degrees from I.I.T., Bombay in the years 1982 and
1984, he completed his Ph.D from the same institute in 1990. He has received
certificate of Appreciation as Proctor by American Society for Quality (2001).
Prof. Nyoman Pujawan ITS INDONESIA
Prof. Nyoman Pujawan is a renowned personality in Supply Chain Engineering and the
Head of Graduate Program at the Department of Industrial Engineering, Sepuluh
Nopember Institute of Technology (ITS), and Surabaya, Indonesia. He received a
bachelor degree in Industrial Engineering from ITS, Indonesia, Master of Engineering
in Industrial Engineering from Asian Institute of Technology (AIT) Bangkok, Thailand,
and PhD in Management Science from Lancaster University, UK. He is the CSCP
(Certified Supply Chain Professional) holder from APICS (USA).

12 Page
Prof. S. Rangnekar IIT ROORKEE
Prof. Santosh Rangnekar is associated with Indian Institute of Technology, Roorkee.
Dr.Santosh Rangnekar studied at Indore and obtained Ph.D., M.B.A. (H.R.M.) from
Devi Ahilya Viswavidyalay, Indore. He has also studied LL.B. (Hons) from Indore and
Post – Graduate Diploma in Personnel Management and Industrial Relations from
Vikram University of Ujjain.
Prof. Padmanav Acharya NITIE MUMBAI
Prof. Padmanav Acharya is currently working at NITIE Mumbai. A Bachelor of
Engineering (Hon’s) in Mechanical, he has done his M.Tech and Ph.D in the area of
Industrial Engineering from I.I.T. Kharagpur. He continues his pursuit of research at
the highest level in aforementioned areas of interest in collaboration with other
institutes and industry.

13 Page
Prof Jitesh J Thakkar IIT KHARAGPUR
Prof. Jitesh Thakkar is associated with the department of Industrial and Systems
Engineering in IIT Kharagpur. He has done his Ph.D. from IIT Delhi. He is a member of
Indian Institute of Industrial Engineering, The Institution of Engineers (India),
Operational Research Society of India and POMS, USA.
Prof. Kamapan Mukherjee DEAN, IIM KASHIPUR
As an established management educator with rich experience of teaching (21 years
as Professor) Dr Kampan Mukherjee established the Department of Management
Studies and became University Dean (Academic) at Indian School of Mines. He has
joined IIM Kashipur as a Professor in August 2014. He earned PhD from Moscow
Institute of Economics and Statistics as government sponsored research scholar in
1988 and subsequently was associated with LAMSADE, University Paris Dauphine as
Senior Visiting Fellow of Government of France in 1998. Prof Mukherjee pioneered
research activities in India on management of Remanufacturing/ Reverse Logistics.
He was conferred Life Time Achievement award in Operations Management by
Society of Operations Management in 2012.
14 Page
Prof. Jaideep Motwani SEIDMAN COLLEGE OF BUSINESS, USA
Prof. Jaideep Motwani currently acting as the chair and Professor of Management,
Seidman college of business is an award winning and highly accomplished scholar,
administrator, and consultant with 25 years of experience in the field of supply chain
management and process improvement. He has published 17 books and more than
225 articles in prestigious journals such as Operations Research, European Journal of
Operations Research, IEEE Transactions of Engineering Management etc., Dr.
Motwani was ranked among the Top 1% Researcher in the field of Technology
Management and the recipient of the Michigan Outstanding Educator’s Award
granted by the Governor of Michigan. He works with professionals in the area of
lean, customer services excellence, supply chain management, performance
measurement, leadership, teambuilding, and service operations. He also serves on
the advisory board of a dozen international journals.
Prof. Manoj Dash IIIT GWALIOR
Professor Manoj Dash is currently associated with IIIT Gwalior. Manoj Kumar Dash
has earned his M.A. with specialization in Econometrics, M.Phil. with specialization in
Econometrics, Ph.D. in Economics on topic ‘Econometrics of Complete Demand
System’ and M.B.A. in Marketing from Berhampur University, Berhampur (Orissa). He
has published more than 67 research paper in various journals of International and
National repute.

15 Page
Mr. Ashish Tanwar UNIVERSITY RELATIONS COUNTRY MANAGER – DELL INDIA
Mr. Ashish Tanwar is a HR professional with 8 years of experience. Having completed
his post‐graduation in Xavier Institute of Social Service, Ranchi he has worked as a HR
professional in TCS for 6 years. He is a strong analytical person who is an expert in
relation building. He is currently employed in Dell as University Relations Country
Manager – India and is responsible for heading University hiring & relations for all of
Dell’s businesses in India. He has been awarded the dell championship award for
2015.His areas of expertise include campus recruitment / relations, employer
branding, lateral recruitment, strategic planning, orientation, grievance handling,
r&r, employee engagement, retention and high potential development. He is Dell
brand certified and Social media & community professional of dell. He is also a
certified advanced internet recruiter from OS2i.
Mrs. Ramya Mishra Director, PR365, New Delhi
Ramya Mishra carries over 14 years of experience in Brand and Product
Development. She is today's leading communication expert especially in the field of
hospitality. In her work experience, she has served both agency and client. She has
designed communication strategy for corporate and human brands at National and
International level. Due to her crucial strategic input many brands gained immense
popularity. She is an expert in Content Development, Media Management, Crisis
Management, Digital PR, Internal Communication and External Communication. Few
of the clients who have benefited from her experience are Marico, Raddison, Hyatt,
Claridges, Park Plaza, Godrej etc.
16 Page
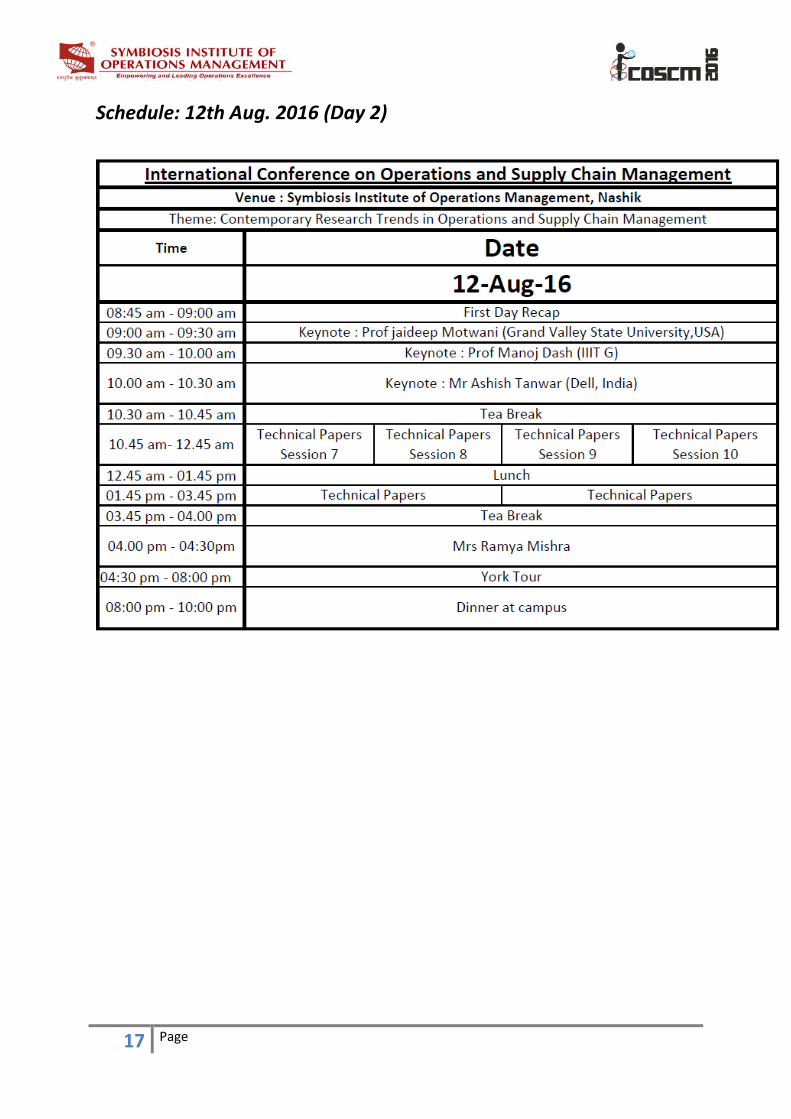
Schedule: 11th Aug. 2016 (Day 1)
17 Page
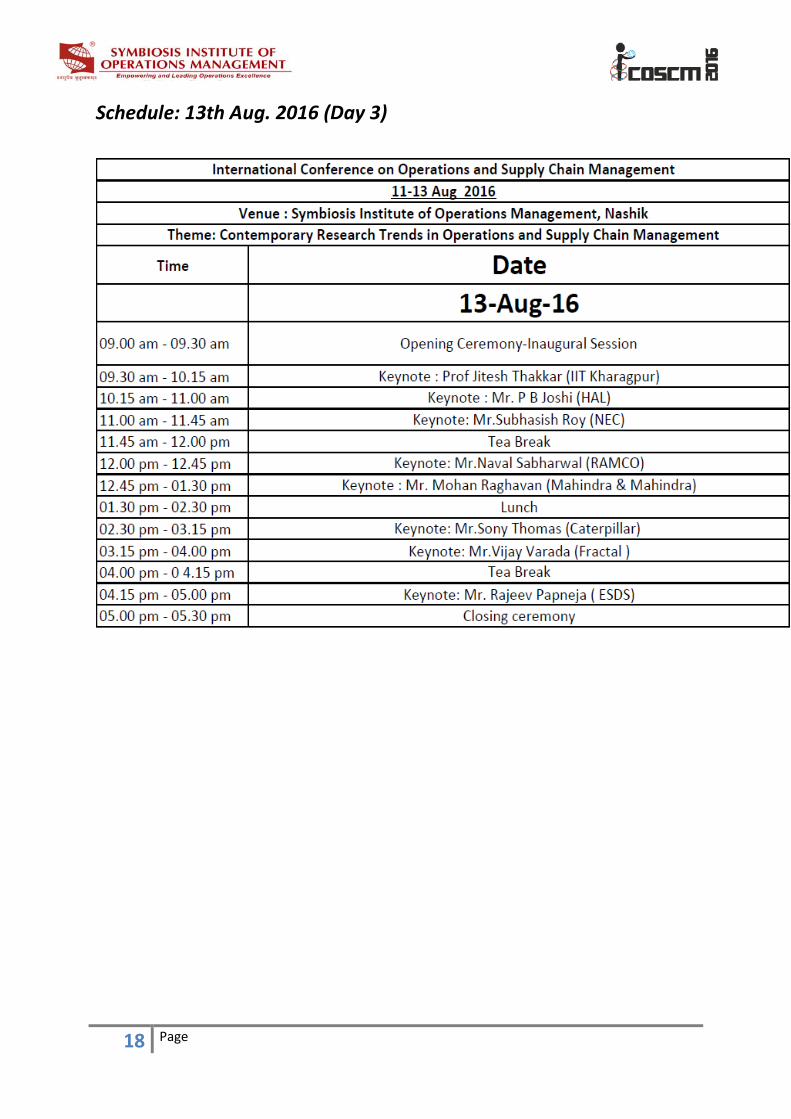
Schedule: 12th Aug. 2016 (Day 2)
18 Page
Schedule: 13th Aug. 2016 (Day 3)
19 Page
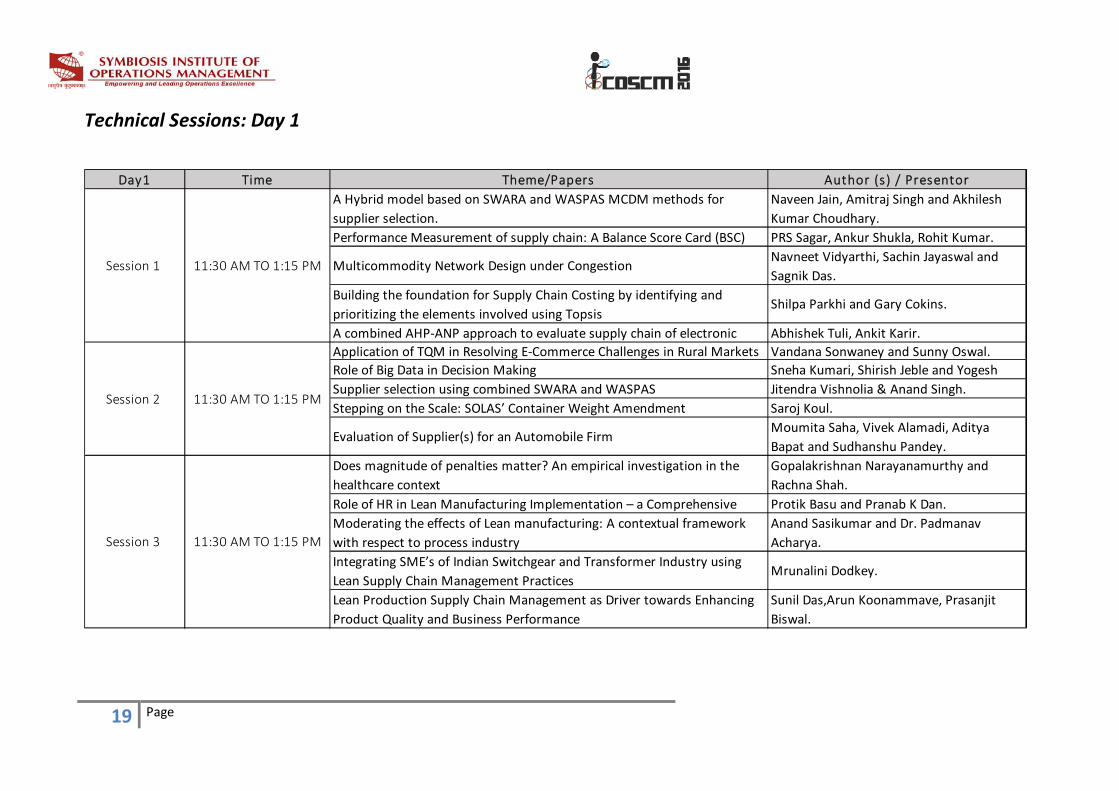
Technical Sessions: Day 1
Day1 Time Theme/Papers Author (s) / PresentorA Hybrid model based on SWARA and WASPAS MCDM methods for
supplier selection.
Naveen Jain, Amitraj Singh and Akhilesh
Kumar Choudhary.
Performance Measurement of supply chain: A Balance Score Card (BSC) PRS Sagar, Ankur Shukla, Rohit Kumar.
Multicommodity Network Design under CongestionNavneet Vidyarthi, Sachin Jayaswal and
Sagnik Das.
Building the foundation for Supply Chain Costing by identifying and
prioritizing the elements involved using TopsisShilpa Parkhi and Gary Cokins.
A combined AHP‐ANP approach to evaluate supply chain of electronic Abhishek Tuli, Ankit Karir.
Application of TQM in Resolving E‐Commerce Challenges in Rural Markets Vandana Sonwaney and Sunny Oswal.
Role of Big Data in Decision Making Sneha Kumari, Shirish Jeble and Yogesh
Supplier selection using combined SWARA and WASPAS Jitendra Vishnolia & Anand Singh.
Stepping on the Scale: SOLAS’ Container Weight Amendment Saroj Koul.
Evaluation of Supplier(s) for an Automobile FirmMoumita Saha, Vivek Alamadi, Aditya
Bapat and Sudhanshu Pandey.
Does magnitude of penalties matter? An empirical investigation in the
healthcare context
Gopalakrishnan Narayanamurthy and
Rachna Shah.
Role of HR in Lean Manufacturing Implementation – a Comprehensive Protik Basu and Pranab K Dan.
Moderating the effects of Lean manufacturing: A contextual framework
with respect to process industry
Anand Sasikumar and Dr. Padmanav
Acharya.
Integrating SME’s of Indian Switchgear and Transformer Industry using
Lean Supply Chain Management PracticesMrunalini Dodkey.
Lean Production Supply Chain Management as Driver towards Enhancing
Product Quality and Business Performance
Sunil Das,Arun Koonammave, Prasanjit
Biswal.
11:30 AM TO 1:15 PMSession 3
11:30 AM TO 1:15 PM
11:30 AM TO 1:15 PM
Session 1
Session 2
20 Page
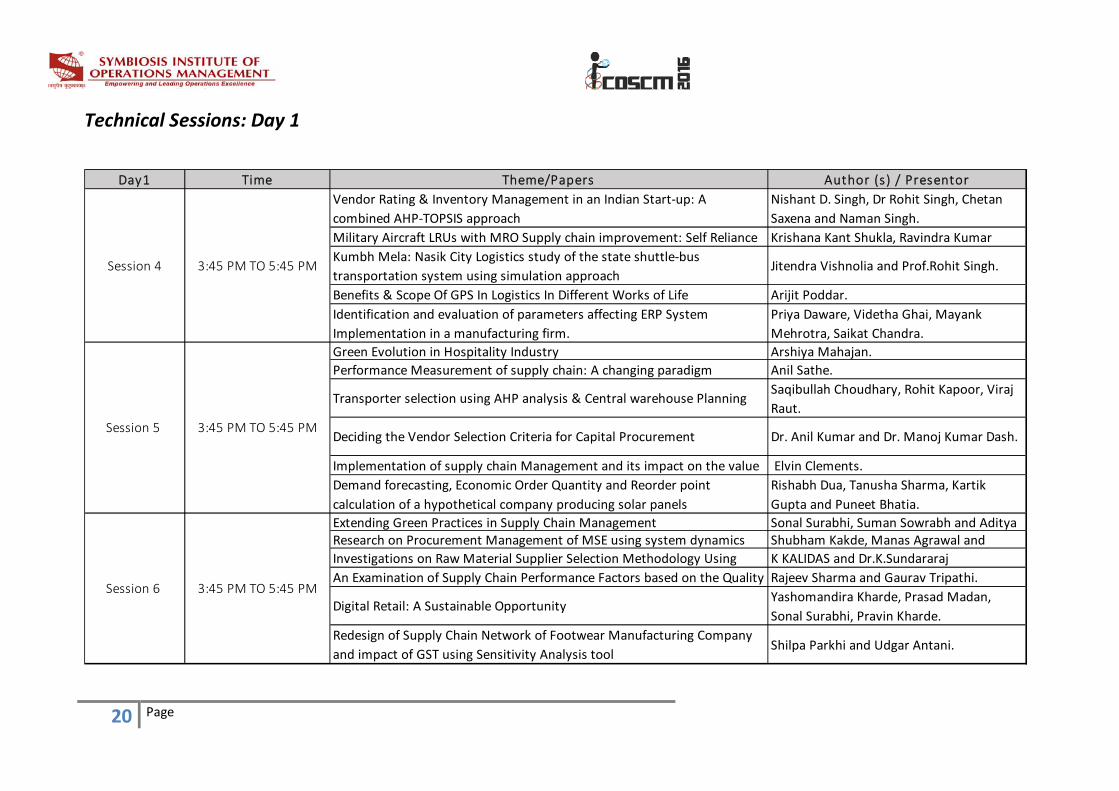
Technical Sessions: Day 1
Day1 Time Theme/Papers Author (s) / PresentorVendor Rating & Inventory Management in an Indian Start‐up: A
combined AHP‐TOPSIS approach
Nishant D. Singh, Dr Rohit Singh, Chetan
Saxena and Naman Singh.
Military Aircraft LRUs with MRO Supply chain improvement: Self Reliance Krishana Kant Shukla, Ravindra Kumar
Kumbh Mela: Nasik City Logistics study of the state shuttle‐bus
transportation system using simulation approachJitendra Vishnolia and Prof.Rohit Singh.
Benefits & Scope Of GPS In Logistics In Different Works of Life Arijit Poddar.
Identification and evaluation of parameters affecting ERP System
Implementation in a manufacturing firm.
Priya Daware, Videtha Ghai, Mayank
Mehrotra, Saikat Chandra.
Green Evolution in Hospitality Industry Arshiya Mahajan.
Performance Measurement of supply chain: A changing paradigm Anil Sathe.
Transporter selection using AHP analysis & Central warehouse PlanningSaqibullah Choudhary, Rohit Kapoor, Viraj
Raut.
Deciding the Vendor Selection Criteria for Capital Procurement Dr. Anil Kumar and Dr. Manoj Kumar Dash.
Implementation of supply chain Management and its impact on the value Elvin Clements.
Demand forecasting, Economic Order Quantity and Reorder point
calculation of a hypothetical company producing solar panels
Rishabh Dua, Tanusha Sharma, Kartik
Gupta and Puneet Bhatia.
Extending Green Practices in Supply Chain Management Sonal Surabhi, Suman Sowrabh and Aditya Research on Procurement Management of MSE using system dynamics Shubham Kakde, Manas Agrawal and
Investigations on Raw Material Supplier Selection Methodology Using K KALIDAS and Dr.K.Sundararaj
An Examination of Supply Chain Performance Factors based on the Quality Rajeev Sharma and Gaurav Tripathi.
Digital Retail: A Sustainable OpportunityYashomandira Kharde, Prasad Madan,
Sonal Surabhi, Pravin Kharde.
Redesign of Supply Chain Network of Footwear Manufacturing Company
and impact of GST using Sensitivity Analysis toolShilpa Parkhi and Udgar Antani.
Session 5
Session 6 3:45 PM TO 5:45 PM
3:45 PM TO 5:45 PM
3:45 PM TO 5:45 PM
Session 4
21 Page
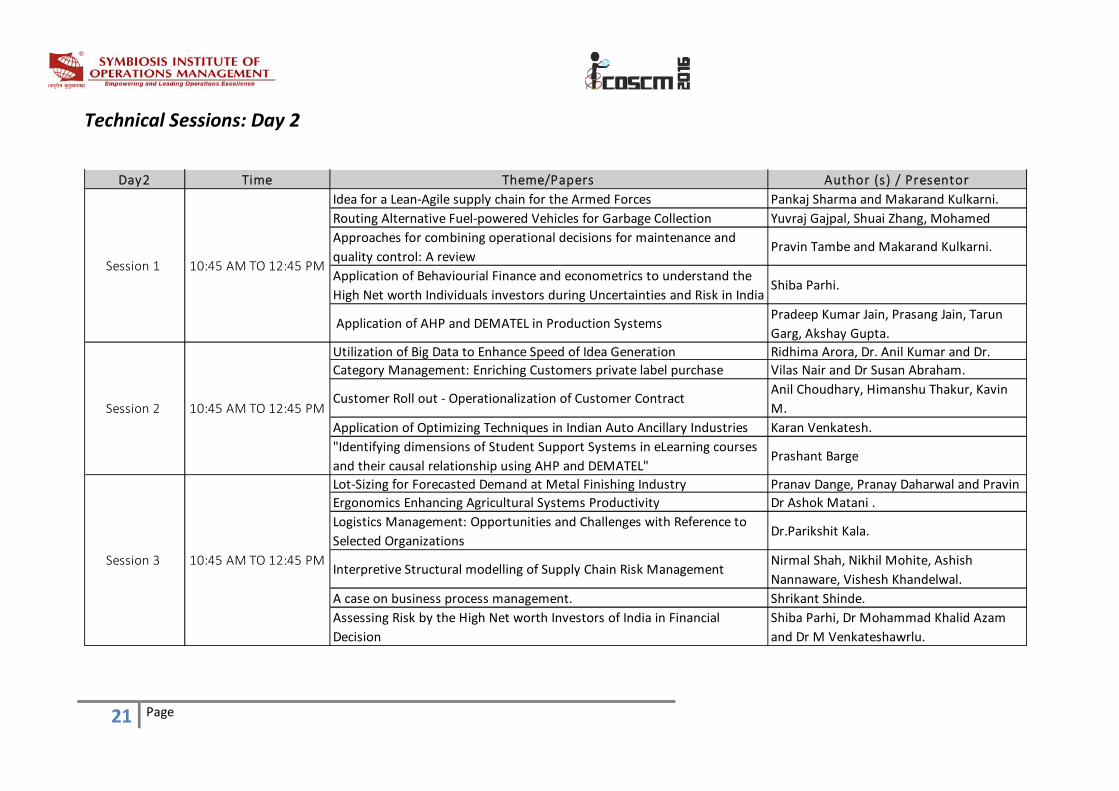
Technical Sessions: Day 2
Day2 Time Theme/Papers Author (s) / PresentorIdea for a Lean‐Agile supply chain for the Armed Forces Pankaj Sharma and Makarand Kulkarni.
Routing Alternative Fuel‐powered Vehicles for Garbage Collection Yuvraj Gajpal, Shuai Zhang, Mohamed
Approaches for combining operational decisions for maintenance and
quality control: A reviewPravin Tambe and Makarand Kulkarni.
Application of Behaviourial Finance and econometrics to understand the
High Net worth Individuals investors during Uncertainties and Risk in IndiaShiba Parhi.
Application of AHP and DEMATEL in Production SystemsPradeep Kumar Jain, Prasang Jain, Tarun
Garg, Akshay Gupta.
Utilization of Big Data to Enhance Speed of Idea Generation Ridhima Arora, Dr. Anil Kumar and Dr.
Category Management: Enriching Customers private label purchase Vilas Nair and Dr Susan Abraham.
Customer Roll out ‐ Operationalization of Customer ContractAnil Choudhary, Himanshu Thakur, Kavin
M.
Application of Optimizing Techniques in Indian Auto Ancillary Industries Karan Venkatesh.
"Identifying dimensions of Student Support Systems in eLearning courses
and their causal relationship using AHP and DEMATEL"Prashant Barge
Lot‐Sizing for Forecasted Demand at Metal Finishing Industry Pranav Dange, Pranay Daharwal and Pravin
Ergonomics Enhancing Agricultural Systems Productivity Dr Ashok Matani .
Logistics Management: Opportunities and Challenges with Reference to
Selected OrganizationsDr.Parikshit Kala.
Interpretive Structural modelling of Supply Chain Risk ManagementNirmal Shah, Nikhil Mohite, Ashish
Nannaware, Vishesh Khandelwal.
A case on business process management. Shrikant Shinde.
Assessing Risk by the High Net worth Investors of India in Financial
Decision
Shiba Parhi, Dr Mohammad Khalid Azam
and Dr M Venkateshawrlu.
Session 3
10:45 AM TO 12:45 PM
10:45 AM TO 12:45 PM
Session 2
10:45 AM TO 12:45 PMSession 1
22 Page
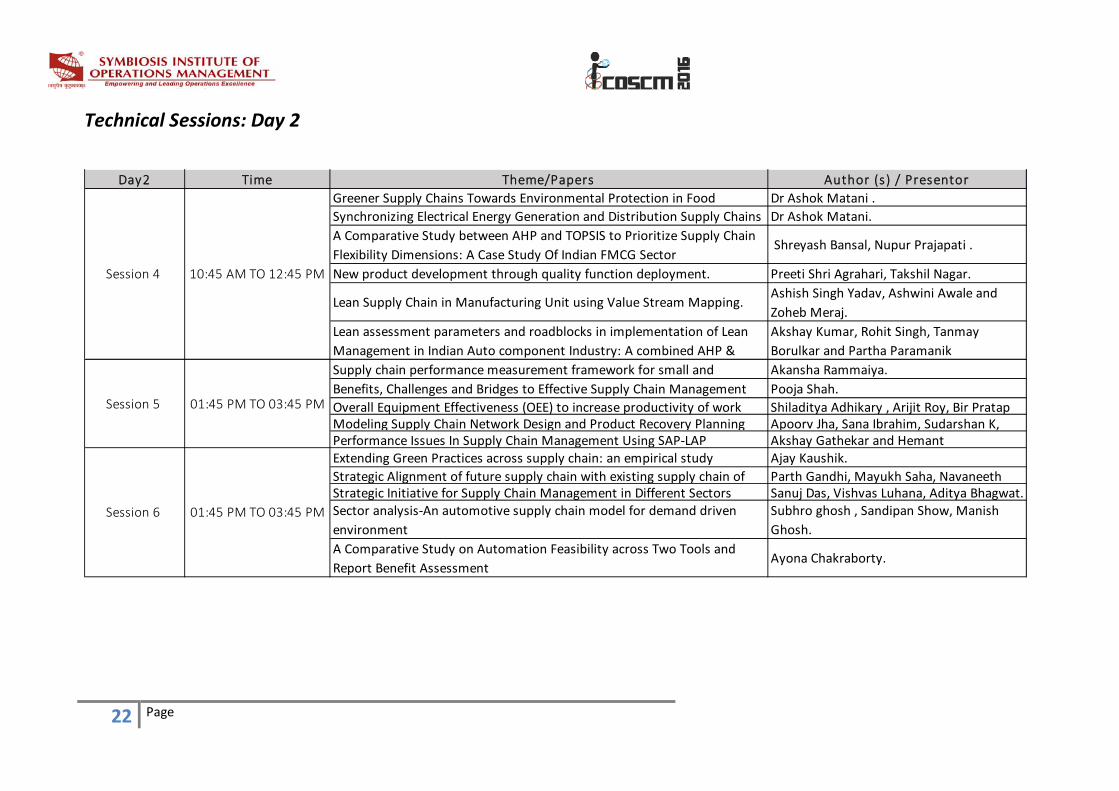
Technical Sessions: Day 2
Day2 Time Theme/Papers Author (s) / PresentorGreener Supply Chains Towards Environmental Protection in Food Dr Ashok Matani .
Synchronizing Electrical Energy Generation and Distribution Supply Chains Dr Ashok Matani.
A Comparative Study between AHP and TOPSIS to Prioritize Supply Chain
Flexibility Dimensions: A Case Study Of Indian FMCG Sector Shreyash Bansal, Nupur Prajapati .
New product development through quality function deployment. Preeti Shri Agrahari, Takshil Nagar.
Lean Supply Chain in Manufacturing Unit using Value Stream Mapping.Ashish Singh Yadav, Ashwini Awale and
Zoheb Meraj.
Lean assessment parameters and roadblocks in implementation of Lean
Management in Indian Auto component Industry: A combined AHP &
Akshay Kumar, Rohit Singh, Tanmay
Borulkar and Partha Paramanik
Supply chain performance measurement framework for small and Akansha Rammaiya.
Benefits, Challenges and Bridges to Effective Supply Chain Management Pooja Shah.
Overall Equipment Effectiveness (OEE) to increase productivity of work Shiladitya Adhikary , Arijit Roy, Bir Pratap Modeling Supply Chain Network Design and Product Recovery Planning Apoorv Jha, Sana Ibrahim, Sudarshan K, Performance Issues In Supply Chain Management Using SAP‐LAP Akshay Gathekar and Hemant Extending Green Practices across supply chain: an empirical study Ajay Kaushik.
Strategic Alignment of future supply chain with existing supply chain of Parth Gandhi, Mayukh Saha, Navaneeth Strategic Initiative for Supply Chain Management in Different Sectors Sanuj Das, Vishvas Luhana, Aditya Bhagwat. Sector analysis‐An automotive supply chain model for demand driven
environment
Subhro ghosh , Sandipan Show, Manish
Ghosh.
A Comparative Study on Automation Feasibility across Two Tools and
Report Benefit AssessmentAyona Chakraborty.
Session 4
01:45 PM TO 03:45 PM
10:45 AM TO 12:45 PM
01:45 PM TO 03:45 PMSession 5
Session 6
23 Page
List of Accepted Abstracts
1. Green Evolution in Hospitality Management
Arshiya Mahajan.
The Tourism Industry in its journey towards excellence has ignored the other very important
aspect of environment and ecology. However with emerging environment consciousness and
concern for posterity the importance of ecological balance has gained prominence. Tourism
today, is not just a simple holiday activity, it has evolved as a phenomena. It is clearly based on
environment. Negative impacts from tourism occur when the level of visitor use is greater than
the environment's ability to cope with this use within the acceptable limits of change.
Uncontrolled conventional tourism poses potential threats to many natural areas around the
world
The Author,( Arshiya Mahajan),has already presented her paper(ME‐MC‐18) in Fifteenth Global
Conference on Flexible Systems Management held at Symbiosis Institute of Technology, Pune
held on October 23‐25,2015 wherein the undersigned has attempted to identify and present
the various extrinsic &intrinsic factors that affect customers“ preference to visit green hotels in
Indian context that can be generalized in the context of the world. Now through this paper will
further analyze the various attributes affecting customers “preference to visit green hotels and
weighted average of each factor on the customers intention to visit a green hotel. In the study
we will discuss various attributes which are affected due to tourism and thus how the
customer’s choice of hotel selection is thus being affected. A green hotel is an environmental
friendly lodging property that institutes and follows ecologically sound programs/practices
(e.g., water and energy savings, reduction of solid waste, and cost saving) to help protect our
planet (GHA, 2008).As the number of customers heading towards green operations increase,
being a green hotel provides a good strategic position in terms of marketing, in this competitive
arena.
Hence, the main objectives of this study included the following:
1. Explore consumers’ perceptions of various attributes that affect a customer’s choice of the
hotel.
In the further future studies we will have a questionnaire survey and make empirical testing of
these factors. Theory proposed will be established in Indian context that is generalized to other
world context for green hotel.
24 Page
2. Deciding the Vendor Selection Criteria for Capital Procurement
Anil Kumar and Manoj Kumar Dash.
Vendor selection for capital procurement is increasingly essential and important for most of the
manufacturing units in all over the world. The need of the best selection is for survival of the
firms as world‐wide globalization and cost cutting concepts are emerged in the competitive
markets. It is helping the firms to produce the products at comparatively low cost .The selection
criterion involves various qualitative & quantitative factors on which basis best suitable supplier
to be selected and this selection basis are also have essentially to build long term relationship
with vendor in the form of tangible & intangible ground. Involving the experts’ guidance &
choice of the vendor section some scientific and analytical tool can be used to derive the
validity of the factors involving in selection criterion such as AHP (Analytical hierarchy Process)
and another technique available is DEMATEL (Decision Making Trial & Evaluation Laboratory).
By using these two selection models, we can found out the best vendor for capital procurement
through the vendor & buyer interactions for selection requirement & with the help of valid data
collection and matrix method. Process of vendor selection for capital procurement has the
multidimensional approach to get confirm information & history chart of the vendor’s
performance in the desired field.
3. Utilization of Big Data to Enhance Speed of Idea Generation Ridhima Arora, Anil Kumar and Shrawan Kumar Trivedi.
Erevelles et al., (2016) examined that analytics is at the epicenter of a Big Data revolution in
every domain of business. The study is an attempt to understand the utilization of big data to
enhance speed of idea generation with applications in different domains of business i.e.
marketing, operation management, finance, human recourse etc. To capture huge data and
plentiful data, technology is helping us. Coming to Big data, there are mainly three “V’s” which
helps in defining the Big data phenomenon, these criteria’s are volume, velocity and variety,
also two more sub‐criteria’s are veracity and value of data captured. Big Data is a new source of
idea generation for product development, customer service, shelf location, distribution,
dynamic pricing, and so on (Erevelles et al., 2016). In a hyper‐competitive marketplace where
great ideas are easily copied, a firm must enhance its speed of idea generation to achieve a
sustainable competitive advantage; Big Data may enable firms to accomplish such a desirable
goal (Erevelles et al., 2007). Researchers are encouraged to study the role of Big Data in
generating ideas and enhancing creativity within a firm to improve its performance.
To better comprehend the effect of Big Data on different business exercises, empowering firms
to better endeavor its advantages, a reasonable structure that expands on asset based
25 Page
hypothesis is proposed. Three assets physical, human, and authoritative capital‐direct the
accompanying:
(1) The procedure of gathering and putting away confirmation of customer movement as Big Data, (2) The procedure of extricating shopper knowledge from Big Data, and (3) The procedure of using buyer understanding to upgrade dynamic/versatile abilities. Besides, exceptional asset prerequisites for firms to profit by Big Data Big data is helpful in understanding so many sub‐sections of marketing analytics such as consumer analytics, operations analytics, supply‐chain analytics and people analytics etc. which leads to the development of new marketing strategies or implementation of marketing analytics. Exploitation of Big Data can be clearly termed as a future for Marketing Analytics. A Marketing Analytics refers to the identification and implantation of most effective and specific strategies with the use of tools and technology which would help in evolving the market ways for selling a product/brand/service. Sub‐parts of marketing analytics a) Consumer analytics is the process of understanding consumer’s behavior and analyzing their insights about a particular company’s products and services. b) Operations analytics is the process of using technologies and resources to use the Big Data to make business decisions and matching supply with demand, also in prediction of future demand uncertainties. c) A supply chain analytics consists of the complete process from getting raw materials from suppliers on time, maintaining contingency stocks, stages of production till the development of finished goods, the delivery in accord to customer expectations effectively and efficiently before other suppliers/business. This all requires the help of big data analytics, i.e., using customer‐related data to draw adequate conclusions about information. The general benefits which can be easily identified from the use of big data are improved buyer and seller relations, lower average cost of production and supply, diminished delivery times. d) People analytics involves using the Big Data to recruit and manage human resources more effectively irrespective to the traditional approaches and relation building styles.
4. A framework for locating and equipping marine oil‐response facilities
Manish Verma
Introduction: Marine transportation, the primary mode for moving oil in Canada, was also
responsible for a country‐high 60 million tons of crude oil and petroleum products transiting
the Newfoundland maritime infrastructure. These numbers have been increasing since 2000,
and the trend is likely to continue given the proposed development of additional off‐shore
petroleum platforms and new refineries in southern Newfoundland. While the region has
benefited tremendously from increased oil‐related activities, there is a concern, especially

26 Page
among the neighboring communities about the province’s preparedness to deal with potential
oil‐spill emergencies. This is an extremely crucial concern because this region experiences over
20,000 vessel movements annually, and hence even a minor oil‐spill episode could be
devastating for the human and marine population, and the tourism‐based economy.
Problem Description: This study deals with location under uncertainty, and is concerned with
both the strategic and tactical aspects of the oil‐spill response problem for this region. More
specifically, we will answer two questions: first, where to locate adequate emergency response
facilities; and second, what types of equipment to stockpile at each facility. Given the strategic
(and tactical) focus of this work, it is important to take into consideration the different known
and uncertain factors likely to impact the spill event, as well as the consequent response
planning. For example, emergency response center location decisions should incorporate: the
projected marine accidents and vessel traffic over the planning horizon; the critical time
associated with each spill location; the estimates of economic and environment damage
resulting from various oil spills; and the estimates of different oil‐spill volumes. Note that while
some of these factors could be reasonably captured via deterministic estimates, others cannot.
For instance, the exact location, volume and type of spill, as well as weather conditions are
uncertain. Hence, probabilistic estimates of various oil‐spill profiles were developed using the
extensive data made available through Transport Canada and Canadian Coast Guard.
Modeling Approach: Although many techniques have been developed to deal with uncertainty
in mathematical programming, stochastic programming with recourse is cited as a general‐
purpose technique that can deal with uncertainty in model parameters. Stochastic programs
with recourse are employed to make decisions prior to the realizations of some random
variables such that the total expected costs of possible recourse actions are minimized. More
specifically in our two‐stage model, the first stage focuses on facility location and equipment
package acquisition decisions, whereas the recourse problem solved in the second stage uses
information about oil spill to make equipment response and dispatch decisions. Subsequently,
the two‐stage stochastic programming model is equivalently stated as a single optimization
program, which has both deterministic and stochastic parameters.
Parameter Estimation: In an effort to take advantage of the extensive information developed
through numerous studies and also to test our model on realistic data, we estimated the values
of the relevant parameters from the Transport Canada reports. In addition, the authors had
personal communication with the environmental response unit of the Canadian Coast Guard.
Computational Results: We used CPLEX 12.4.2 to solve the resulting problems to optimality for
all combinations involving the three different facility costs, three different equipment costs and
both linear and non‐linear settings, and three different spill volumes (i.e., 54 scenarios). The
resulting analyses revealed that with higher equipment acquisition costs, fewer equipment
packages were stockpiled at the open facilities, thereby reducing the overall coverage. On the
other hand, with decreasing facility costs, one noticed an increase in the number of open

27 Page
facilities, which in turn had an equivalent impact on coverage. Hence, it was evident that since
coverage resulted from the trade‐off between expected environment cost with respect to
facility and equipment costs, some results may not do much to assuage the concerns of the
general public. This is because the “expected environmental cost” does not capture the impact
of intangible attributes such as public disutility or adverse perception of catastrophic events
such as an oil spill. In an effort to conduct additional analyses by incorporating such intangibles,
we applied a multiplier to the expected consequence cost term in the objective function and
then solved the problem instance for different values of the multiplier, i.e., disutility factor.
It was evident that larger values of the multiplier put greater emphasis on the expected
environmental cost, thereby yielding better coverage through increased facility and equipment
costs. This was not surprising since larger values of the multiplier meant that not covering an
oil‐spill situation was more expensive, and hence resulted in better coverage. In addition, it was
possible to deduce that the total cost curve under the non‐linear setting was definitely concave,
and somewhat concave under the linear equipment cost setting. This implies that the total cost
will increase at a decreasing rate with increasing disutility factor value, and hence it will cost
proportionately less to provide better coverage.
Finally, since we did not know the budget of the policy makers nor their precise mandated
coverage requirement, we conducted further analyses to facilitate future decision making with
respect to adding new facilities, equipping them and the resulting coverage. To this end, we
generated two types of solutions: first, we used the current location of the response facility to
generate the incremental solutions; and second, we specified the number of facilities to be
opened and then generated the so‐called Greenfield solutions. The resulting analyses under
both the settings revealed that locating more than two facilities was not reasonable because
the percentage of oil‐spill situations covered did not improve with more facilities. In addition,
we also noticed that the variable cost did not change since opening a new facility just forced a
portion of the required equipment package to be bought by the newly added facility, and had
no impact on the total number of equipment.
Conclusion: The south coast of Newfoundland accounts for a significant portion of marine
transportation of crude oil and petroleum products in Canada, and has been a source of
concern due to the potential for oil‐spill emergencies. In this work, we have proposed a two‐
stage stochastic programming approach that answers two questions: the location of emergency
response facilities, and the appropriate equipment stockpile at each facility. The proposed
optimization program was tested on realistic data collected from publicly available reports and
through personal communications. In an effort to account for the stochastic nature of input
parameters, a number of scenarios were generated using the base numbers procured from the
above sources.
Through extensive computational experiments, we can conclude that in general the number of
facilities and equipment stockpiles is a function of the trade‐off between expected
28 Page
environmental costs versus facility and equipment cost. Furthermore, the size of the equipment
stockpile for the region depends on the societal disutility factor, and increases with higher
values of the factor. More specifically, for the area of interest, a maximum of two facilities is
most appropriate since any additional facility will not improve oil‐spill coverage, but will merely
result in the redistribution of equipment packages among various open facilities.
5. An analytical approach to rail‐truck intermodal transportation of
hazardous materials with capacity selection & terminal congestion
Manish Verma.
Introduction: Intermodal transportation, defined as the transportation of goods by a sequence
of at least two different modes, continues to be one of the dominant segments of the
transportation industry. Rail‐truck intermodal transportation, which exploits the positive
attributes of both trains and trucks referred to as drayage, has experienced phenomenal
growth in the last four decades and continues to grow. Note that the attractiveness of rail‐truck
intermodal transportation, in part, stems from two sources: first, the significant reduction in
both delivery and lead‐time certainty because of the schedule‐based operation of intermodal
trains; and, second a more efficient and cost‐effective overall movement ensured by combining
the best attributes of the two modes. Although intermodal transportation, in general, has
received increasing attention from researchers over the past two decades, most of the
discussion is focused on regular freight. Fortunately, this area has received some attention from
academic researchers over the past decade, and the relevant effort has been primarily at the
strategic and tactical levels involving transportation and terminal location decisions.
Problem Description: The proposed study investigates the impact of congestion at the rail
intermodal terminals and its impact on hazmat shipments, and thus extends our earlier
contributions in this domain. Our problem is to determine the best shipment plan for both
hazardous and non‐hazardous freight in a rail‐truck intermodal network, wherein a set of pre‐
defined lead times must be satisfied in choosing the truck routes and the intermodal train
services to be used. The objective is to minimize the total cost as well as the total public risk
associated with intermodal hazmat shipments. Note that this task is complicated because
hazmat risk at terminals needs to be determined by modeling congestion using Markovian
queues, which in turn will drive the decision about equipment capacity (acquisition or
operations) decisions, and only then intermodal freight routing decisions can be made.
Furthermore, it is necessary to streamline the inbound drayage, intermodal rail haul and
outbound drayage activities while making the trade‐off between total cost and total public risk.
Modeling Approach: We propose a bi‐criteria nonlinear optimization model with cost and risk
objectives. The cost objective contains inbound drayage cost, rail haul cost, outbound drayage
29 Page
cost, fixed cost to operate different types of intermodal train services, and the equipment
acquisition cost at the terminals. The risk objective, on the other hand, contains population
exposure due to drayage, various intermodal trains, and from terminal congestion. We simulate
the congestion risk by finding the product of the terminal risk and the average number of
hazmat containers waiting to be served. We used realistic size problem instance data from
earlier peer‐reviewed works, and consulted the appropriate sources for updated information
on cost and risk parameters.
Solution Methodology: In the presence of nonlinear expressions in the risk objective and one of
the constraints, it was not possible to solve realistic‐size problem instances through the
general‐purpose optimization software. Hence, we proposed a customized solution
methodology that exploits the problem structure. More specifically, we combine simulation
with non‐dominated sorting Genetic Algorithm to simulate a set of arrival rates for terminal
equipment, which is then used to estimate average waiting time and consequent hazmat risk.
The algorithm continues until no improvement is encountered in 1000 consecutive offspring.
The conference presentation will contain complete details of the proposed algorithm,
Computational Results: The solution methodology was coded in C#, and numerical experiments
were performed on Intel Core i5 CPU 1.80 GHz with 8 GB RAM. Two of the most common
techniques for solving multi‐objective models are pre‐emptive optimization and weighted
sums, and we make use of the latter approach. In addition, we perform a parametric analysis by
attaching different weights to the two objectives. The resulting analyses revealed significant
lowering of waiting times for hazmat traffic compared to regular traffic, thanks to the
implementation of non‐preemptive priority queuing principle. This is important since most of
the rail intermodal terminals are close to population centers in North America, and thus both
the average waiting time and the number of hazmat containers waiting to be processed
become critical in determining public risk. Hence, conceivably, any effort to lower the waiting
time and number in the queue should reduce terminal risk.
In an effort to get managerial insights into the problem instance, we conducted the standard
risk‐cost analysis by emphasizing one objective over the other, and then examined factors that
affect terminal congestion.
Risk‐Cost Tradeoff: We noticed that ten of the eleven solutions were clustered around the
minimum cost, which in general signals the dominance of cost over public risk. We investigated
this further by solving additional problem instances, and it was noticed that the dominance of
cost starts waning when risk has a weight of at least 0.95 (i.e., cost would have a maximum
weight of 0.05). This is important since, in this instance, attaching equal weight to the cost and
public risk objectives is unlikely to provide a solution acceptable to both the regulatory agencies
and the transport companies. Other related insights and interpretations would be provided at
the conference presentation.
Factors impacting congestion risk: The computational experiments revealed three factors likely
30 Page
to impact congestion risk. First, utilization rate of the cranes is crucial –since higher rate implies
longer average waiting time for hazmat containers. Hence, either purchasing more cranes or
using better technology such that waiting times are reduced could be one of the ways to
mitigate public risk at the terminals. Second, shorter delivery times forced the purchase of
more equipment and use of faster trains thereby increasing the cost, but have a positive
bearing on congestion risk. Third, higher demand would result in increased cost and congestion
risk.
Conclusion: In this paper, we propose a bi‐objective optimization framework for planning rail‐
truck intermodal shipments, when terminal equipment capacity and congestion are considered.
Congestion was captured by implementing a non‐preemptive priority queue discipline on the
containers arriving at various cranes (equipment), with higher priority being accorded to
hazmat. The existence of non‐linear terms in the risk objective and the constraints necessitated
developing a customized solution methodology that makes use of the attributes of genetic
algorithm for multi‐objective problems with CPLEX, which was applied to realistic size problem
instances generated using the problem instance from existing literature.
Through extensive computational experiments, we conclude the following. First, congestion at
the terminals is a non‐negligible source of public risk, and could be a significant source if
intermodal terminals are close to population centers. Second, terminal congestion risk can be
mitigated using a variety of measures. For example, using better technology to process
incoming hazmat containers would ensure lower transit time, which in turn has a positive
bearing on risk.
6. Idea for a Lean‐Agile supply chain for the Armed Forces.
Pankaj Sharma and Makarand Kulkarni.
Armed forces are characterized by huge inventories collected because of the "Just in Case"
concept of stocking. Such large inventories are no more acceptable as there is always a
pressure on the army logistics to cut costs and be lean. This will help in reducing the logistics
footprint in the tactical battle area and also make the fighting force more maneuverable.
However, when the army is fighting a war, it requires quick replenishment of spare parts and
other war like supplies. Cost cutting takes a back seat and mission reliability assumes
paramount importance. In other words, the spare parts supply chain of army is required to be
both lean and agile. These two contradictory requirements are proposed to be fulfilled by using
a dynamically changing time‐separated lean‐agile spare parts replenishment system. The spare
part supply chain needs to be lean during peace and agile during wars. This paper will present a
framework for such a dynamic lean‐agile system for replenishment of spare parts in the army.
The paper then identifies the decision variables that are required to be changed in order to
31 Page
dynamically shift the system from lean to agile and vice‐versa. The values of these decision
variables in each of the emergency levels is also discussed in the paper.
7. Synchronizing Electrical Energy Generation and Distribution Supply Chains Ashok Matani.
In India, though power theft is one of the strongest incentives to install smart meters, there are
other compelling factors such as the need to reduce technical power losses and peak power
deficit and bringing in more efficient transmission of electricity to rewarding consumers who
help in reducing peak power demand. A smart meter is an electronic device that records
consumption of electric energy in intervals of an hour or less and communicates that
information daily for monitoring or billing. Smart meters also enable two‐way communication
between the meter and the central system. They also put consumers in control of their energy
use, allowing them to adopt energy efficiency measures that can help save money on their
energy bills. With the smart meter, one can keep a track of power usage at home in his or her
absence curbing the energy wastage by their children or servants. This can also be connected
with the solar power generating units and even with the grid connected solar systems
effectively.
Ministry for Power, Coal and New and Renewable Energy of Government of India have asked
the meter manufacturers to design a multi‐tasking smart meter displays power consumption at
home in real‐time with giving details of usage of every appliance and point using electricity. The
smart meter would be for those who use more than 200 units a month.
8. Greener Supply Chains towards Environmental Protection in Food
Processing Industries
Ashok Matani
In present economic scenario, organizations are trying to achieve sustainable competitiveness
in global markets. Sustainability incorporates the concepts of economic, social, and
environmental performance. Green supply chain management (GSCM) practices comprise
green design, reducing energy consumption, reusing/recycling material and packaging, reverse
logistics and environmental collaboration in the supply chain. This paper highlights latest
developments in supply chain management practices towards making green supply chain
management more effective and environmental friendly in various industries
32 Page
9. A review on the experimental usage of classical, Shanin and Taguchi design
of experiment (DOE) with Data Mining approach using six sigma DMAIC.
Karuppanna Prasad N, Sekar K and Manohar M.
In present days, the organizational work environment run day in and day out with the daily
routine work environment where preparing and conducting an offline design of experiment
(DOE) in the steady state work environment leads to impact on organization Productivity,
Quality, Cost, Delivery, Safety and Morale(PQCDSM). Organization faces a heat waves due to
market pressure that urges organization to build up a reliable decision with proactive for
making the process in control that will contributes towards organization achieving on technical,
financial and strategic issues. In modern era, a new phrase is coined by the name “Continuous
quality improvement” that plays a focal role in for strengthening and sustaining an organization
sector. The organization are thriving to enhance the quality continuously by using competitive
strategies. The Total Quality Management (TQM) is one of the endemically applied strategies in
organization to sustain the heat waves external market, TQM a people and analytical approach
uses tools, techniques and system like cause and effect diagram, kaizen, quality functional
deployment (QFD) and ISO 9000 series based quality management system (QMS) with operator
level skill matrix for enhancing the operator skill. In present day conditions practicing and
implementing TQM makes myriad of concern failed for achieving the process quality
improvement day in and day out. To overcome, six sigma as proposed by Motorola provide a
pathway for achieving “Continuous quality improvement” through belt based training using six
sigma Define, Measure, Analyze, Improve and Control (DMAIC) stratum and creating of training
cum infrastructure in the organization premises. In afore mention ways for process
improvement the belt based six sigma DMAIC training proves to be an inexpensive yardstick
approach for continuous process improvement and process satisfaction. In DMAIC stratum each
word provide a meaning on the same such as in define the problem faced by the customer most
frequently are addressed by measuring the processing stages for data collection followed by
analyzing the data for causes and root causes for action on choosing the optimal process
parameter setting for continuous quality improvement culminated by incorporating the
changes in Quality Control and Process Control (QCPC) and Standard Operating Procedure
(SOP). In Six sigma DMAIC the application of design of experiment (DOE) plays an imperative
role in the improvement stage to identify the optimum settings for process parameters. DOE an
experimental tool was used for identifying the focal input variable that create variation in
product and process. The variability in the performance of process impacts the profit of an
organization, thus declination in process variability will create a defect free production system.
DOE an experimental tool for enhancing the product performance was firs established by Sir
Ronald fisher in the year 1930 by the name as classical DOE or “one factor at a time” in the field
of agriculture. The one factor at a time was said to be time consuming for choosing the
33 Page
optimum process parameter setting that gives the birth to shanin DOE in the year 1970
developed by Dorian shanin is a statistical tool for identifying the red‐x, pink‐x and pale pink‐x
causes that contribute towards 80% of machine variation. Prolong years of working by box and
hunter in service and manufacturing organization provide a new pathway for conducting
experiments and converting theory to practical by the name Hunter – Box – Hunter (B H2)
experimental design in the year 1980. Later stages, there evolve a discussion in academic circles
in the year 1990 to make DOE simpler and can be used by the manager through the name
taguchi DOE later crafted by the name Taguchi robust design. The present day problem on
using DOE is as we are well aware that organization GEMBA revolve around a routine work
environment, since DOE an offline conduction tool impacts the routine work that leads to a
consequence of unpleasant results. Another concern in DOE was inclusion of more variables
leads to more experimental run that impact cost to company.
In the previous dual decade there arise a huge scope and development in an interdisciplinary
knowledge field known as data mining that stratify the data from data history sheet .The
decision tree model is one of the most familiar data mining method due to it intelligent decision
making, some of the common algorithm based on decision tree model used in data mining are
C4.5 developed by Quinlan (1986) and its extended version C5 followed by Classification and
Regression Tree Algorithm(CART) developed by Breiman (1984) and Chi‐squared Automatic
Interaction Detection (CHAID) by Kass (1980).The usage of data mining have a huge scope in the
organization sector without effecting the routine work environment on one side and
technological advancement in the information technology and sensor technology on the other
side that had made data mining a fruitful tool in the manufacturing process. Real time in the
shop floor of the manufacturing process the process condition or process parameter setting or
control parameter setting was adjusted by the process engineers that impact the quality of the
product due to least awareness cum capability of the process engineers for using an
interdisciplinary tool like data mining in the organization work environment. From all the afore
said statements, it is clear that data collection during routine environment and ineffective
process adjustment were two red‐x causes that impact process performance on quality. To
overcome from dual red x causes that impact the organization work environment data mining
proves to be a focal tool in the field of process control, quality improvement, fault decision and
diagnosis, process design and maintenance over classical, Shanin, Taguchi DOE and data mining
approach for process improvement with an aid of applying it in six sigma Define, Measure,
Analyze, Improve and Control (DMAIC) to enhance organization effectiveness in manufacturing,
service and unconventional sector.

34 Page
10. Performance Measurement of supply chain: a changing paradigm
Anil Sathe.
Preamble: Organizations promise customers, a range of deliverables /solutions through various
products /services. Nobody can deny the contribution supply chains make in delivering these
promises.
At the same time, supply chain management has become much more complex due to global
sourcing, highly demanding customers, shorter product life etc.
when some leading stores announce “same day delivery”, it is obvious that they have done lot
of work to keep the product ready whenever asked.
This means that we need to transform the whole cycle from planning to distribution to deliver
customized solutions “wherever required, whenever required”.
Performance measurement: With realignment of supply chain to new expectations, its
performance measurement needs realignment too.
While the focus will remain on costs, quality and delivery, the definition of these terms will
become wider, sustainability will be a key consideration, customer‐centric approach will be the
decision making factor and technology will provide competitive advantage…
Multiple dimensions of this process are nicely explained in framework below (source: Journal of
business logistics). Key is to strike balance across the entire three axis load.
Few things before we begin…
• Performance measurements have to be in sync with changing organization objectives and
customer requirements. This makes it a process which is “subject to continuous
review/update”
• KPIs will have to have a balanced approach
• Localizing priorities will damage business particularly when there is conflict between
stakeholders
• While looking at terminologies like costs, efficiency, optimization etc. one has to ensure that it
has organizational perspective
• What you set to achieve will depend on where you are today (as is status), where you wish to
be (future status) and the timelines
Irrespective of where maturity level in supply chain, focus on the following areas will be a
common feature:
1. Agility, Adoptability, Alignment
2. End‐To‐End Visibility
35 Page
3. Building customer loyalty
4. Sustainability
5. Innovation
6. Deployment of IT solutions
7. Skill development and retention
Let us look at each one in detail:
1. Agility, Adoptability, Alignment:
• Together they represent SCM’s ability to respond to external stimulus: could be disruption in
supplies, natural calamities, sudden order etc.
• As per Dr. Hau Lee of Stanford, this has to be measured against time (ref Supply chain digest
article dated July 23rd 2010). Ability to respond in one month may be dramatically different
that one week
• Second important aspect would be likely correction (% change in output, time) required.
• It is important to balance this with costs… Gene Tyndall of Tompkins Associates says “Supply
chain managers to be cautious about flexibility. Flexibility usually comes with an added cost,
and this must be weighed against the value proposition for it.”
• As we can see, measurement of this is not easy. However we can recognize the agility based
on the approach to the situation. We can see in the chart below the few examples of
Traditional approach V/s Agile approach.
• Measurement for each supply chain will vary depending on the type of business and
competitive strategy of the organization. For e.g. Productions processes, Type of product
“Made to order or Made to stock) etc. can create different situations to handle /respond
2. End‐To‐End Visibility
• Aberdeen report (May 2013) defines Supply chain visibility as the awareness of, and control
over, specific information related to forecast, capacities, orders and physical shipments, and
other data such as customer preferences /feedback/returns etc.
• Visibility is a prerequisite to supply chain agility and responsiveness
• Decisions to be made are data points, sources for data, frequency, analytical support and
distribution of the data etc.
Depending on role in the organization, performance measurement can be set to cover these
areas. One such approach has been highlighted below. Simple principle to be followed is
“sharing information / making things visible allows people to take informed decision”
36 Page
3. Building customer loyalty:
Chief supply chain officer’s report (2014) highlights importance of SCM contribution to
customer service and loyalty in different industries. It is an eye opener.
SCM at all levels contributes to this and following is one way to implement /measure the same
at all levels;
• At Micro level focus is on improving ‐ demand, manufacturing, supply, distribution,
transportation ‐ within a company's supply chain. The goal is to accelerate the efficiency and
performance and measure could be reducing miles, safety stock, and idle capacity, while
increasing production utilization and quality
• At Macro level focus is on improving the performance of supply chain in totality. The goal is to
optimize the efficiency and performance between multiple areas and measure could be
increasing return on assets, working capital and market share
• At enterprise level focus is on integrating supply chain with the supply chains business
partners, vendors and customers, to satisfy mutual needs. Goals could be being first to the
market; long‐term deals etc. and measures could be time to introduce new products and
services, redundant process quality checks etc. Even measures like repeat business are very
important
4. Sustainability
• The well‐adopted definition of sustainability is that of the Brundtland Commission (World
Commission on Environment and Development, 1987, p. 8): “development that meets the
needs of the present without compromising the ability of future generations to meet their
needs.”
• Balanced approach can be evolved when we understand relationship between the integration
of the concepts of sustainability and supply chain management, and long‐term economic
success.
• Areas to look at in Supply Chain would be:
Logistics: Mode of transport, distance travelled, energy efficiency, handling of hazardous
cargo, safety of people involved etc.
Packaging: Extent of packaging, recycling, conservation of wood etc. Choice of materials: Avoid the ones which damage environment
37 Page
Wastages and Disposal: Wastage percentage, disposal method, damage to environment etc.
(for e.g. Handling E‐waste, recycling of plastic etc.)
Best way to build sustainability goals in these areas will be to ensure that benchmarks are
established and measure year‐on‐year improvements.
5. Innovation
• In his seminal work “The Innovator’s Dilemma,” thought leader Clay Christensen describes
two types of product innovation: sustaining and disruptive. Both types of innovation are likely
in SCM.
• Few suggestions to build innovative culture;
Variation: Take a concept such as “self‐serve” operations and apply it to your business. For e.g.: Web‐check in process, electronic fund transfers etc.
Reversal: Outline a current process, and then reverse it. Vendor‐managed inventory is a
classic example.
“What if?” Ask what would happen if you had to design a new way of serving your customers.
Sharing of infrastructure within competitors is an example
Starting over: If you were redesigning your product or service, what changes would you make? Would they alter your competition? Would they change your customer base, locations,
or resources?
• Measurement:
No of processes changed Growth without additional resources Development of lead indicators
Customer empowerment etc.
Some examples of supply chain innovations are given below:
6. Deployment of IT solutions:
• Use of Information Technology (IT) across the supply chain can become source of competitive
advantage. Deloitte supply chain leadership survey of 2015 gives us a very clear picture on this.
• The objectives of IT in SCM are (Simchi‐Levi, 2003):
Providing information availability and visibility
Enabling a single point of contact for data
Allowing decisions based on total supply chain information
38 Page
Enabling collaboration with partners
• Application areas are many and lot depends on present status. However, area such as e‐
sourcing, mobility solutions, customer interaction are few of the key areas today
• Measurement again will largely depend on present status but could be from “assessment to
full scale deployment” of the solutions
7. Skill development and retention
• Skill set required in supply chain today has dramatically changed and calls for constant up
gradation
• Big supply chain trends include:
The rising role of the cloud and digitization of products Mobility
Social media’s influence
Huge information base / data available with customers
Increasing need to provide end‐of‐life solutions to products • Skill development must bring in readiness to be prepared for this
• This would also have to include innovation, creativity, ethics, compliance etc.
• Lastly this must be done for complete team and hence measurement has to include both the
head of SCM and subordinates from identifying needs to effectiveness
To sum up:
We firmly believe that these changes in performance management have already begun across
the world and will decide the leaders of tomorrow.
It is time all recognize contribution made by supply chain in meeting corporate objectives and
change measurements which will bring out the best: in individuals and supply chain itself.
11. Optimal replenishment policy and preservation technology investment
for a non‐instantaneous deteriorating item with stock‐dependent demand
Haimanti Pal, Sudarshan Bardhan and Bibhas Giri.
Purpose: The purpose of the work is to develop and analyze an inventory model under certain
realistic business assumptions and to derive optimal business strategies so as to maximize
39 Page
average profit.
Assumptions and methodology: An inventory model for a retailer facing deterministic stock‐
dependent demand (with exponential form of dependence) has been developed and analyzed.
The item is assumed to start perishing at a constant rate after a certain time period from when
it reaches the retailer. The retailer has the option to invest in preservation technology to reduce
the effective deterioration rate. To keep the model realistic, the expenditure on preservation
technology is assumed to have a diminishing return. The model has been analyzed to find
optimal amount of investment as well as business cycle length so that average profit is
maximized. An algorithm is provided to find the optimal values of decision variables quickly.
Findings: Optimal values of the decision values have been obtained here. Certain conditions
have been derived to distinguish between the situations where the retailer should or should
not invest in preservation technology. A condition on the time‐point when deterioration starts
has been derived, which acts as a lower bound. Situations have also been identified when it is
always beneficiary to invest in reducing deterioration. Sensitivity analysis has been performed
to examine the stability of the solution as well as its inherent dependency on other
uncontrollable parameters.
Practical implications: In reality, the deterioration rate may be controlled by taking certain
measures in preserving the items. As higher deterioration rate has considerable impact on
system profit, supply chain managers may think of investing in preservation technology to
reduce the effective deterioration. As the technology comes at a cost, the decision of investing
(or not investing) is always a concern for the retailer, particularly when the selling season is
sufficiently short. The retailer may shorten the replenishment period instead in order to reduce
deterioration in his inventory, and thereby bear lesser preservation cost. When and how much
to invest for preservation is therefore a very important decision for the retailer. The present
research throws some light in that direction, and identifies situation when it should be wise to
invest (and how much), or how much the cycle length should be reduced so as to avoid the
effect of deterioration successfully, without compromising the profit.
Originality: The present work is a two‐step generalization of Hsu et al. (2010) as (i) the
assumption of constant demand has been extended to be stock sensitive, and (ii) instantaneous
deterioration is generalized as the non‐instantaneous one. The present work may somewhat be
considered as a partial extension of the work of Dye (2013) too, which studied non‐
instantaneous time‐dependent deterioration under constant demand scenario.
40 Page
12. Role of HR in Lean Manufacturing Implementation – a Comprehensive
Study
Protik Basu and Pranab K Dan.
Purpose: Lean management is a process improvement technique (Bamber et al., 2014) and lean
principles have been recognized as a competitive advantage (Pakdila and Leonard, 2014).
Although there have been a few studies for the various aspects of HR in lean implementation,
there is no comprehensive study of the same. The purpose of this study is to have a detailed
study of the relationship and role of HR in the implementation of lean manufacturing, enabling
the manufacturing industries to strategize towards successful lean implementation.
Design/methodology/approach: The methodology followed by the authors in this study has
three fundamental parts. The first part is to analyze the current literature on the role of HR for
lean initiatives in manufacturing industries. Based on this literature survey, a questionnaire has
been designed for collection of responses with respect to HR practices for lean implementation.
The third part is to suggest a framework incorporating the entire set of HR practices required
for lean implementation. This framework is expected to be empirically tested using statistical
techniques on the responses from manufacturing firms.
Findings: Lean manufacturing is gaining popularity as an approach that can achieve significant
performance improvement in the industry (Susilawati et al., 2015). Lean has been distinguished
as ‘a bottom up approach where management plays a supportive and facilitating role in
engaging shop‐floor workers to form cross‐functional self‐directed work teams and apply Lean
tools’ (Shah et al., 2008). Management commitment has been considered as a significant critical
success factor for lean six sigma deployment. (Bakar et al., 2015). Long‐term philosophy of
growth is at the heart of lean (Pakdila and Leonard, 2014). Multifunctional workers, expansion
of autonomy and responsibility, few levels of management, worker involvement in continuous
quality improvement programmes, work time flexibility, team decision making, worker training,
innovative performance appraisal and performance related pay systems have been considered
as the best practices of HR for a lean enterprise (Panizzolo et al., 2012). Additionally, teamwork,
cooperation, and, involvement, commitment and motivation of the employees are considered
as critical parameters for successful lean implementation. Training and education of individuals
towards lean orientation (Bakar et al., 2015) accompanied by effective leadership (Ravikumar et
al., 2013) and right corporate culture (Bhasin and Burcher, 2006, Wong and Cheah, 2011) will
ensure a smooth and effective implementation process of lean manufacturing. Managerial
action needs to be taken to minimise any negative effects of lean implementation, if any
(Angelis and Fernandes, 2012). Lean was initially viewed as another downsizing method and
such misconceptions must be handled with care (Cudney and Elrod, 2011). An expert full time
41 Page
lean consultant as facilitator is critical for successful lean implementation (Ravikumar et al.,
2013). 22 such HR practices, including role of top management, have been considered in the
framework thus developed for successful lean implementation. Analysis of the survey data is
expected to validate the key constructs identified.
Research limitations/implications: This research is applicable primarily to the manufacturing
sector and is expected to provide further insights for lean implementation. Further research is
required to explore the relationship between HR and lean manufacturing. Technical aspects of
lean adoption are not covered in this paper but should be taken into account by companies
willing to undergo lean implementation.
Originality/value: There are researches on lean implementation but this work is one of the very
first researches to have a comprehensive study of the HR practices for implementation of lean
manufacturing. Piecemeal research studies have been done in the past on HR parameters but
this study intends to bridge the gap and integrate all the parameters into a single
comprehensive study, aimed at practical implementation of lean manufacturing. This is a
notable and promising outcome of the current study, especially from a strategic viewpoint.
Keywords: Lean manufacturing, HR practices, lean implementation, critical parameters.
13. Coordinating a Three‐echelon Supply Chain with Uncertain Demand and
Random Yield
Sudarshan Bardhan, Bibhas Giri and Tarun Maiti.
Purpose: One of the major objectives of modern supply chain management is to deal with
the growing decentralization among the entities and hence minimizing the double
marginalization effect inside the chain, especially when the end‐customers' demand is not
deterministic. The problem of deciding optimal supply/production quantity becomes even
more complicated when the production process of the manufacturer(s) becomes subject to
random yield. Also, to improve the performance of the members as well as total chain in
terms of accumulating more profit by the members of the chain, some kind of coordination
mechanism is necessary. The purpose of the present work is to address all the issues by
formulating a suitable mathematical model, pave the way to coordination leading to
satisfactory channel performance, and provide relevant managerial insights to the supply
chain managers.
42 Page
Assumptions and Methodology: A three‐layer supply chain consisting of one raw‐material
supplier, one manufacturer and one retailer for trading a single product over a single period
of time is assumed here. The market demand is assumed to be stochastic. Productions at
both the raw‐material supplier as well as the manufacturer are instantaneous, and are
subject to random yield. After the raw‐material supplier declares unit wholesale price of the
raw‐material, the manufacturer declares unit wholesale price of the finished product,
depending on which the retailer places an order of finished goods. Depending on the order
quantity, the manufacturer decides his optimal production quantity and places order of the
same amount to the raw‐material supplier. Depending on the order placed by the
manufacturer, the raw‐material supplier decides his optimal production quantity and starts
production. If the amount produced by the raw‐material supplier is lesser than that ordered
by the manufacturer, the supplier buys the deficit amount from the spot market at a higher
price and supplies the whole batch to the manufacturer; otherwise, the excess amount is
sold by the supplier at the secondary market at a reduced price. Similar procedure is
followed by the manufacturer too. The retailer faces shortage or over‐stocking after the
selling season. The centralized model is provided as the benchmark case. The expected
profit for each channel member is maximized under decentralized scenario, and
corresponding optimal values are decided. Finally, a composite coordination mechanism is
proposed to coordinate the chain successfully.
Findings: It has been seen that no simple contract is able to coordinate such a complex
chain alone. A new composite contract is framed combining buyback and two‐way sales
rebate and penalty contracts together, and shown that it is able to coordinate the chain.
The contract has been made flexible enough to alleviate the risk of production/demand
uncertainty for a wide range. The way changes in market scenario (through varying
parameter values) affect both optimal decisions as well as channel performance has also
been exhibited through sensitivity analysis.
Originality: He and Zhao (2012) generalized previously studied three echelon supply chain
models by considering randomness in production process at the supplier's end. However,
their model assumed deterministic production rate at the manufacturer, a limitation
towards modeling real life business companies' network. The limitation has been removed
in the current paper as random yield at the manufacturer has also been considered,
reflecting all the uncertainties a three‐echelon supply chain may face. The added
uncertainty enforces the manufacturer to realign the terms of coordination contracts, and
bring the supplier under the hood of it.
43 Page
14. Investigations on Raw Material Supplier Selection Methodology Using
Fuzzy Logic
K. Kalidas, K. Sundaraj
Several factors make new suppliers important. First, there may exist new suppliers that are
superior in some way to a firm’s existing suppliers. For example, a new supplier may have
developed a novel production technology or streamlined process which allows it to significantly
reduce its production costs relative to predominate production technology or processes or a
new supplier may have a structural cost advantage over existing suppliers, for example, due to
low labor costs or favorable import/export regulations in its home country. Second, existing
suppliers may go out of business, or their costs may be increasing. Third, the buyer may need
additional suppliers simply to drive competition, reduce supply disruption risks, or meet other
business objectives such as supplier diversity. In recognition of these reasons, buyers and their
internal customers may be obliged by company policy to locate a minimum number of viable,
potential suppliers for every product or service procured. So it is important to have a supplier
rating for raw material suppliers. The main focus of the paper is on foundry raw material
suppliers where the quantity required is high. Fuzzy Logic Tool in Matlab is used for rating.
15. A Hybrid Model Based On SWARA And WASPAS MCDM Methods For
Supplier Selection.
Naveen Jain, Amitraj Singh and Akhilesh Kumar Choudhary.
In the competitive global market scenario, selection of potential supplier offers a solution to
gain competitiveness. Selection of potential supplier depends on quantitative and qualitative
criteria’s. Further these criteria’s are conflicting in nature. Hence supplier selection is Multi
Criteria Decision Making (MCDM) problem. This paper proposes a frame work for the selection
of most reliable and suitable supplier for industry. This study proposes a MCDM model that
combines two new MCDM methods, Step‐wise Weight Assessment Ratio Analysis (SWARA) and
Weighted Aggregated Sum Product Assessment (WASPAS) method for supplier selection. The
proposed methodology is demonstrated with a numerical example.
16. Routing Alternative Fuel‐powered Vehicles for Garbage Collection
Yuvraj Gajpal, Shuai Zhang, Mohamed Abdulkader and S. S. Appadoo.
This paper considers the garbage collection problem in which multiple compartment vehicles
are used to collect the garbage. The vehicle is considered to be an Alternative Fuel‐powered
44 Page
Vehicle (AFV) with small fuel tank capacity compared to the tank capacity of traditional fossil
fuel powered vehicle. The AFV is allowed to refill the fuel from the main depot only. We provide
mathematical formulation for the proposed problem. We develop two solution methods to
solve the problem. The first solution method is based on the saving algorithm while the second
method is based on the ant colony algorithm. We generate new problem instances to evaluate
and to compare the performance of the proposed algorithms.
17. Role of Big Data in Decision Making
Sneha Kumari, Shirish Jeble and Yogesh Patil.
Purpose: Information systems coupled with internet, cloud computing, mobile devices and
Internet of Things have led to a massive volumes of data, commonly referred as Big Data. It
includes structured, semi‐structured and unstructured real time data, constituting of data
warehouse, OLAP, ETL and information. Business firms and academicians have designed unique
ways of tapping value from Big Data. There is great scope of using these large datasets as an
additional input to Decision Support Systems in strategic, tactical and operational domains. The
aim of the paper is to explore the role of Big Data in these areas for making better decisions.
Here we explore, how Big Data can be used to make smart and real‐time decisions for
improving business results in the areas of time, cost, and quality and customer service.
Methodology: The paper undergoes literature review and secondary data to provide a
conceptual overview of potential opportunities of Big Data in decision making.
Findings: The paper discusses the concept of Big Data, its role in decision making and also the
competitive advantage of Big Data for different firms. The paper also discusses a framework for
managing data in decision making.
Originality: The topic must be addressed for taking better decisions for firms which will
contribute to high quality knowledge.
18. Service Quality in Selected Hospitals in Indore City: An Empirical Study
Minal Uprety, Sonam Mathur and Sarfaraz Ansari.
In today’s ever increasing competitive scenario, as all the sectors are focusing more on service
quality, health care sector is among one of them. In the proposed research paper, an attempt is
made to identify the service quality factors and analyze patients’ perceptions and expectations
towards these identified service quality factors. The paper has targeted 3 major hospitals of
Indore city; the total sample size is 150 which comprised 50 patients from each hospital, who
visited these hospitals during the period February 2016 to April 2016. Till date, duly filled
45 Page
questionnaires were collected from 96 respondents. SERVQUAL instrument will be used to
measure the service quality. The SERVQUAL questionnaire included an expectations and
perceptions section, each consisting of 34 statements. In addition, the questionnaire contained
an extra section relating to demographics of the respondents and an overall question on the
impression of quality of the service provided by the hospitals. It is expected that the service
quality of the hospital is affected by the availability of advance equipment and specialized
doctors, infrastructure, prompt response, hygiene, cost of services, behavior of the hospital
staff etc.
19. Reverse logistics network design and re manufacturing using new module
supplier
Rohit Titiyal.
Purpose: To provide a literature review on reverse logistic and understanding the reverse
logistics barriers in India. Conceptual and mathematical modeling of a reverse logistic network
with consideration of new module supplier for remanufacturing of end of life (EOL) product.
Methodology: This consist two part first is theoretical part and applied part. Theoretical part
gives extensive literature review on reverse logistics and study reverse logistics barriers in India.
Applied part gives the mathematical model formulation with linear programming method after
model formulation in ARENA simulation software. Model checking is done by the numerical
example.
Finding: Cost of reprocessing, remanufacturing, and the cost of new modules can be the driving
factor for the choice of a reverse logistics network. Throughout simulation with different
quantities of returned product, the cost of the new module is seen as an important factor in
network cost Therefore, it might be beneficial for the decision makers to locate reprocessing
center at a location where resources (like labor, energy, and land) are cheaper and to locate
remanufacturing centers at places where new modules of the remanufactured products can be
obtained at a cheaper rate.
Practical Implication: Model can be used for the firm to locate their remanufacturing center,
disposal site and recycling center by which they can minimize their overall transportation cost.
Originality: Consideration of the new module supplier for remanufacturing the end of life
product.
46 Page
20. A taboo search heuristic with discrete‐event simulation for scheduling
staff in call centers
Ajith Kumar.
Purpose: this study pertains to staff scheduling in a call center. This extended abstract describes
an ongoing work‐in‐progress.
Voice‐response call centers have been used for long to support business operations in large as
well as small organizations. A call center essentially consists of a team of service agents (SA)
trained to respond to customers. Typically, the arrival of calls to the call center is non‐
stationary: the number of arrivals per unit time changes with time of the day and day of the
week and can at best be described stochastically. Such an arrival phenomenon generates, to
the call center, what is termed as flexible demand by Ernst et al. (2004).
Callers interact with the SAs in the call center in real‐time. If a customer is made to wait too
long, she may abandon the call and may or may not call again. Thus, customer time spent
waiting in the queue is an important performance parameter for a call center in its effort to
satisfy customers. Typically, a company’s contracts with its client result in service level
constraints (SLA) that dictate the time the company can take to process a call and give a
satisfactory response to the customer. The SLAs are crucial among the call center’s
performance criteria. Robbins and Harrison (2010) noted that there are multiple types of SLAs,
but the most common one specifies a minimum proportion of calls that must be answered
within a specified time. For example, an 80/120 SLA specifies that at least 80% of the calls must
be answered within 120 seconds. The challenge, then, is to staff the team with as many SAs as
possible that can ensure meeting all SLAs. Having more staff than this, would lower staff
utilization and unnecessarily increase employment expenditure, while having less would
increase the risk of violating one or more SLAs. Further, direct labor costs often account for 60–
80% of the total operating budget of a call center (Aksin et al., 2007; Gans et al., 2003). Thus,
hiring the correct number of staff and scheduling them optimally is of paramount importance
to the success of a call center.
The roots of call center scheduling research can be traced back to an era when call centers did
not exist in their current form, but firms offered telephone‐based services. Examples of this
work include Molina (1927), Clos and Wilkinson (1952), Church (1973) and Segal (1974). Early
traces of research that is more directly related to the current study are evident in Agnihotri and
Taylor (1991), Brigandi et al. (1994) and Andrews and Cunningham (1995).
Design/methodology/approach: The traditional approach to formulating and solving the call
center scheduling problem has two separate stages that are carried out one after the other
(Mehrotra, 1997). The first stage involves dividing the scheduling horizon that could be a day or
47 Page
week, into small time periods of 15 to 30 minutes each, then computing (or forecasting from
past data) the average call arrival rate in each period, and finally determining the minimum
staffing level in each period to ensure that specified service levels are met. The problem
addressed in this stage is also called the ‘staffing problem’. The staffing levels in different
periods obtained as the solution to the staffing problem is the input to the second stage, which
addresses what is called the ‘scheduling problem’. There, an integer program is formulated with
the staffing levels as right hand sides of constraints, and solved to minimize an objective cost
function. The solution to the scheduling problem yields both the minimum total staff size and
the number of employees that must be assigned to each roster line. Taken together, the
staffing problem and the scheduling problem constitute the complete call center scheduling
problem.
Research over the years has incorporated and addressed multiple considerations of real‐life call
center operations into the problem’s formulation. Four most commonly seen in the literature
are
a) breaks within shifts (Henderson and Mason, 1998; Atlason et al., 2004; Bhulai et al., 2008;
Avramidis et al., 2010),
b) differing priorities between calls (e.g. Sze, 1984; Harris et al., 1987; Chen and Henderson,
2001),
c) abandonment or reneging of calls by callers (e.g. Atlason et al., 2004; Avramidis et al., 2010),
and
d) multiple skill groups among service agents (e.g. Cezik and L’Ecuyer, 2008; Avramidis et al.,
2010).
Interestingly, no study could be found that has addressed all these four considerations in the
same formulation. The current study attempts to fill this gap. Further, while almost all studies
only consider the cost of staff wages, the current study also includes the costs of waiting and
abandonment in the model’s minimization objective. These latter two costs are intangible as
they arise out of customer frustration with the voice response service, but clearly, they are very
relevant as they play an important role in the customer’s satisfaction with the service. With the
exception of Nah and Kim (2013), no study could be found that has included both these costs.
Speaking of solution approaches, two distinct modeling methodologies are seen to the staffing
problem: simulation‐based (e.g. Mehrotra and Fama, 2003, Atlason et al., 2004; 2008) and
analytic queuing theory based (e.g. Koole and Mandelbaum, 2002). Analytic queuing models
confer greater computational efficiency and are preferred when it can be reasonably assumed
that the system reaches a steady state quickly, within each time period. However, the steady‐
state assumption may not hold in many real‐life situations. Further, owing to the copious
nature of arrivals, the optimal staffing in one period depends upon the staffing levels of other
periods (Green et al., 2003). Finally, the service level function, which is most commonly
specified as the proportion of customers that must be served with a given time, cannot be
48 Page
algebraically expressed. Here, simulation has also been viewed as a useful methodology that
can provide both the flexibility to accommodate the dependencies between staffing in different
periods and an ability to assess a service level function that cannot be algebraically expressed.
The current study explores a solution approach that aims to combine the strengths evident in
the approaches of earlier researchers. It is developing and accessing variations of a Tabu search
heuristic that invokes discrete‐event simulation as a sub‐procedure to assess the satisfaction of
SLAs in the problem. Analyses currently being conducted explore various designs.
Originality/value: The intended contributions of the study are a) the formulation of an integer
non‐linear program to represent the call center staff optimization problem and b) the
development of a Tabu Search heuristic that uses discrete‐event simulation as a sub‐procedure
to solve the problem.
21. ISM Based modeling of supply chain management enablers
Dr. Vivek Agrawal, Professor Anand Mohan Agrawal and Sucheta Agarwal.
Purpose: In this increasing competitive and dynamic environment, supply chain management is
helping the organizations to meet the challenges (Sharma and Bhat, 2014; Sundram et al.,
2011). Supply chain management includes all those facilities and functions, which are
necessarily required during the transformation phase of goods and services from its initial stage
to end‐user stage (Chopra and Meindl, 2007). It aims to amalgamate the different processes
and structures of supply chain, flow of information to customers, and flow of services and
goods. The organization has taken the initiatives for implementing the supply chain
management and its related functions and practices to survive in this competitive era (Varma et
al., 2006). In future, competition among the organizations will revolve around the supply chain
development. It can be developed by strengthen the supply chain network or by adding other
values.
For this, the purpose of the paper is to identify the enablers of supply chain management and
establish the relationship among these enablers by using interpretive structural modeling. In
addition to this MICMAC analysis is used to find out the driving and dependence power of the
enablers.
Design/ Methodology: For examining the enablers, an extensive literature review was carried
out and prepared the list of enablers of supply chain. This list was circulated to the 12 experts
from the industry to identify the important supply chain enablers. By this exercise 11 important
enablers of supply chain management was identified: operational performance (1), employee
49 Page
empowerment and motivation (2), employee education and training (3), trust among supply
chain partners (4), supply chain collaboration (5), support by top management (6), financial
resources (7), strategic association (8) just in time (9), green supply chain management (10),
and customer satisfaction (11).
Interpretive Structural Modeling (ISM) is used for establishing the relationship among the
supply chain management. In ISM, a set of interrelated elements are structured into a
comprehensive systematic model (Warfield, 1974; Sage, 1977). It helps in identifying the
interrelationship among the variables. In the present research ISM was used to develop a
framework for the variables affecting supply chain management enablers to show the
interrelationship of the different enablers. Various steps involved in ISM are as follows:
• Identification of relevant variables of supply chain management enablers
• Establishing the contextual relationship among the identified variables
• Develop and prepare a structural self‐interaction matrix (SSIM)
• Preparation of Reachability matrix
• Level identification from reachability matrix
• Constructing the ISM model
Self structural interaction matrix was developed by taking the experts views, based on based on
brain storming and nominal group technique etc. In the present research experts from the
academia and industry were approached for identifying the contextual relationships among the
variables of enablers of supply chain management. Four symbols were asked to show the
direction of relationships between the variables (i, j).
V = variable i will help to achieve variable j
A = variable j will be achieved by variable i
X = variables will help achieve each other and
O = variables are unrelated
If the (i, j) entry in the SSIM is V, then the (i, j) entry in the reachability matrix becomes 1 and
the (j, i) entry becomes 0.
If the (i, j) entry in the SSIM is A, then the (i, j) entry in the reachability matrix becomes 0 and
the (j, i) entry becomes 1.
If the (i, j) entry in the SSIM is X, then the (i, j) entry in the reachability matrix becomes 1 and
the (j, i) entry becomes 1.
If the (i, j) entry in the SSIM is O, then the (i, j) entry in the reachability matrix becomes 0 and
the (j, i) entry becomes 0.
The reachability and antecedents set for each variables are obtained from the final reachability
matrix. The antecedents and reachability variables consists of the variables itself and the other
variable which it will help to achieve. With the help of reachability sets and antecedent sets,
intersection set were identified and hence level of variables were identified in different
iteration.
50 Page
Findings: The present study has finally investigated the 11 important supply chain management
enablers and integrated model was prepared using interpretive structural modeling. Further
MICMAC analysis is used to identify the driving and dependence power of supply chain
management enablers.
Research implications/ limitations: Expert opinion was taken to identify the key enablers of
supply chain management and to build relationship among them using interpretive structural
modeling. It is totally based on subjective decision/opinion of experts, so biasness might be
possible by the experts in giving their opinions which affect the result. So, validity of the model
obtained by using interpretive structural modeling is required. This can be tested by using
empirical methods like structural equation modeling.
Practical implications: This study is important for academicians as well as practitioners also. The
practitioners need to focus on all these enablers during implementing the supply chain
management to increase the performance of organization and customer satisfaction. The
future scholars need to emphasize on the combination of qualitative and quantitative studies in
this context to validate the data.
Originality/value: This study has theoretically and practically contributes by identification of
important enablers of supply chain management and develop relational model using
interpretive structural modeling followed by MICMAC analysis to identify the driving and
dependence powers to identify and classify the supply chain enablers.
22. Price and credit period sensitive competitive supply chain model
Brojeswar Pal.
This study considers a two echelon competitive supply chain consisting two rivaling retailers
and one common supplier with trade credit policy. The retailers hope that they can enhance
their market demand by offering credit period to the customers and the supplier also offers
credit period to the retailers. We assume that the market demand of the products of the one
retailer not only depends on its own market price and offering credit period to the customers,
but also on the market price and offering credit period of the other retailer. The supplier
supplies the product with the common wholesale price and offers the same credit period to the
retailers. We study the model under centralize (integrated) case and decentralize (Vertical
51 Page
Nash) case and compare them numerically. Finally, we investigate the model by the collective
numerical data.
23. Ergonomics Enhancing Agricultural Systems Productivity
Ashok Matani.
Agriculture plays an important role in developing countries which are mainly located in tropical
regions. Agriculture is an industry with tremendous opportunities for the application of
ergonomics principles. Working conditions are extremely difficult due to severe environmental
conditions, long working hours, strenuous work and the use of mobile equipment. The
ignorance of the majority of ergonomics principles in the design of agricultural equipment
makes the conditions more difficult.
A vast majority of the world's workers are employed in agricultural activities and are exposed to
a wide variety of hazards. Since agriculture is primarily decentralized activity, it is often difficult
to set and implement work safety norms and standards. While standards can be set for
equipment manufactured in large factories, it is not easy to monitor its condition in use. For
equipment fabricated in small workshops or by the farmers themselves, it becomes very
difficult to ensure that design standards are adhered to especially when the users of equipment
are hired laborers on daily wages.
This paper discusses impact of effective ergonomics in enhancing productivity of agricultural
systems in various parts of the world.
24. Application of TQM in Resolving E‐Commerce Challenges in Rural
Markets
Vandana Sonwaney and Sunny Oswal.
Background/Objectives: E‐Commerce industry is going through a plethora of issues today that
includes logistics challenges, rural penetration and many others. This paper addresses these
issues.
Methods/Statistical analysis: Literature Review has been identified as the strategy that
summarizes existing research and helps collate various bodies of knowledge into a meaningful
theory. This theory has been embedded together to form the theoretical model. Also expert
opinion has been used to come up with recommendations.
52 Page
Findings: The expert opinion has been instrumental to come up with the solutions. The
solutions based on the lines of TQM are imperative to address the issues faced by the e‐
commerce in rural markets. The paper talks about how these findings will help in generalizing
the solution for the e‐commerce industry.
Applications/Improvements: This paper will be especially useful to online marketers, e‐
commerce companies and logistics outsourcing firms operating in rural markets.
25. Mobile Computing, Cloud & Internet of Things in SCM
Nischay Shetiya and Omkar Chandragiri.
INTERNET OF THINGS IN SCM
With the recent developments in technology like ‘Internet of Things’ (IOT) all physical objects
can be made a virtual computer, which can transmit data real‐time. In a way, every object that
you can think about can be connected to the internet and used in unimaginable ways. Let us
take examples of simple day‐to‐day objects.
Shoes ‐ designed to cushion the foot while walking or running.
Street Lights ‐ designed to throw light and illuminate the streets.
Forklifts ‐ designed to move heavy loads from one place to another.
Not so long ago, these items were just used as per their definition. But recent advances in
technology have made manufactures think about the wide variety of options that can be
explored just by inserting a sensor in these objects. Vast amount of information emerge when
these physical objects transform into a computer. This information gives new insights and
business value to the manufacturers along with added value to the consumer.
When connected:
Shoes ‐ can give details about footfalls, distance covered, speed, force of foot with which it
strikes the ground etc.
Street Lights ‐ can give details of cars travelled in the day, traffic, route planning etc.
53 Page
Forklifts ‐ can give details of efficiency, maintenance due‐date, fuel consumption etc.
Even though the amount of information that these objects can provide is enormous, we are still
only at the beginning of the revolution that IOT can bring about. Less than 1 percent of the
physical objects are connected to the Internet so far. To provide a number, less than 15 billion
physical items (including computers, smart phones, electronics etc.) are connected to the
Internet till today and there are roughly more than 1.5 Trillion items on earth!
IOT in Supply Chains
IOT promises to provide far‐reaching benefits to logistics companies and their customers
through connecting physical objects as described above. The benefits extend across the value
chain of logistics, which includes fleet management, warehousing, safety, customer experience,
last mile delivery etc. Through IOT, the seemingly difficult operational problems can be solved
with new ways and ideas.
But the question is whether IOT has been used before in Supply Chain?
Many technologies have been used by logistics companies since many years and IOT is not an
exception. Logistics Industries have been pioneer adopters of IOT technologies from
introduction of bar‐code scanners for inventory management to sensors that monitor shipment
integrity. The following are some examples of IOT being used in SCM.
Traffic and Fleet Management
Sensors placed in the fleet help logistics companies monitor the efficiencies of their vehicles
and also help their customers track their shipments. IOT can also be used for preventive
maintenance of vehicles, alerts in case of any unusual activities while transportation etc.
Production and Manufacturing Shop Floor
Applications that are sensor based have been used in manufacturing companies for a very long
time. These sensors enable the engineers and managers to assess the performance of the
machines along with ambient conditions, wastages, energy consumption, status of production,
flow of materials etc. Along with these KPIs, the sensors also provide information on machine
health which can be used for preventive maintenance and avoid downtime. The Overall
Equipment Efficiency thus is improved through the use of technology.
Warehousing Operations
Warehouses, which were primarily used as a hub for flow of goods through supply chains, are
increasingly becoming more important in today’s business scenario mainly because they serve

54 Page
as a key feature for any company to gain competitive advantage by serving their customers in a
fast, cost‐effective and flexible way. This is an extremely challenging task considering thousands
of different types and forms of goods being stored in an average warehouse. Every inch of the
warehouse should be optimally utilized and it should be ensured that the desired goods are
retrieved, processed and delivered as soon as possible with zero error. This is where technology
comes into picture. From storage to delivery, warehouses today contain these ‘objects’ that are
connected to the internet which facilitate error free operations. Low‐cost and miniscule
identification tags like RFID are used in the modern warehouses for better management.
Sensors combined with radars and cameras allow forklifts in modern warehouses to
communicate with each other and scan for goods throughout the warehouse. Automatic
Guided Vehicles are used for picking goods as well. Some sensors are also used to effectively
use lights in the warehouse to save on energy consumption whereas some sensors detect
unusual activities and alarm against thefts and accidents.
Last‐mile Delivery
recent technologies have enabled logistics companies to help with their last mile deliveries. This
is done through use of boxes outside pickup points which signals only when there are goods to
be picked up. If the boxes are empty, there is no signal and hence route optimizations can be
done for the deliveries and pick‐ups.
Mobility in SCM
The objective of using a mobile handheld device is to facilitate tracking, communication, and
process execution. This would enhance productivity.
Mobile applications allow companies to improve customer service activities, manage
compliance requirements, assess inventory levels and provide information to other managers in
real time. In addition, the mobile apps update in real time, facilitating quick decisions to adjust
supply chain operations to meet industry and client demands
Supply chain and logistics professionals rely on smart phones to access the enterprise
applications such as enterprise resource planning, transportation management systems and
warehouse management systems to track shipments and assets and access reports that are
stored on the cloud to mine useful information to make better business decisions.
Mobile devices can provide supply chain professionals and field sales personnel’s with the same
outside office access.
• Order and Shipment status visibility
• On board computers in the Transport vehicle to capture proof of delivery, calculating driver
hours and keeping track of the vehicles.
• Real‐time automated vehicle locating
55 Page
• Capture real‐time traffic information and suggest alternate routes to avoid delays
• Projecting Actual arrival time of the shipment to the end customer
• Stock‐out validation and point of sale (POS) visibility via Android, Windows Mobile 7 and
Apple iPhone and iPad devices.
• Voice recognition software that can enable forklift operators and warehouse professionals to
‘voice‐pick’ has helped the workers operating in high‐volume; high‐repetition environments
carry out their tasks in an efficient manner.
Mobile RFID devices and bar‐code scanners are gaining importance to keep a tab on the
transportation assets and high‐value equipment.
26. An Examination of Supply Chain Performance Factors based on the
Quality of Relationships
Rajeev Sharma and Gaurav Tripathi.
Purpose
With the growing importance of focus on relationships in business the days for transactional
style of doing business are numbered. This is not only true for situations when the offerings are
transferred to the final consumer through a retail channel but also equally important for
business‐to‐business dealings. In fact the importance of relationship is at the top for all the
actors (or members) of supply chain (SC) who are interested in serious business. In the context
of relationships among the actors of SC the quality of relationship model has gain a lot of
attention among the researchers. The importance of RQ is due to its ability to assess the
relationship strength which adds to competitive advantage (Hennig‐Thurau et al., 2002; Wong
et al., 2007). In fact RQ describes depth and climate of relationship (Johnson, 1999) while
Crosby et al (1990) and Bejou et al (1996) affirmed that it is a prerequisite for building
relationships for long term.
Therefore, the present research work aims at examining the relationship among the key entities
in a supply chain setup. The entities in a supply chain system are medium or large sized
businesses among themselves which work in cohesion to achieve a common goal. A well‐tuned
relationship among at all the levels will help in achieving customer satisfaction. However, the
supply chain management system is full of inefficiencies due to lack of integration among the
entities. The present research work investigates how the intangible relationships work among
the various supply chain players with a focus on the elusive factors contributing towards the
quality of relationships. The quality of relationship embedded in these factors have an impact
on the business performance which is worthy of investigation.
56 Page
Review of Literature
Relationships in business are of utmost importance especially in Indian context. The quality of
relationship is an indicator of the strength of its relationship. It is discussed widely in context of
relationship in case of business to customer and business to business however the consensus
pertaining to the dimensions of quality of relationship has not been achieved. However, it is
interesting to note many researchers have pondered on a conventional definition of quality of
relationship pondering on its constructs (Athanasopoulou, 2009; Qin et al., 2009). This has also
led to difference in conceptualizing the overall quality model in various cases. The lack of
consensus is also dedicated to the insufficiency quality research works which encompass critical
discussion of the model including its dimensions (Hennig‐Thurau, 2000). Hennig‐Thurau (2000)
also pointed out that most of these quality dimensions have been defined on the basis of
intuition and hence causes lack of consensus about the dimensions of the model.
Various studies have focused on exploring the dimensions of quality of relationship in the
context of business to business settings which are definitely in line with the relationships
pertaining to the various entities in the supply chain systems. In other words, due to business to
business context of supply chain management systems these dimensions can be referred for
each other.
Since, there is no agreement on the dimensions of the quality of relationship in the context of
supply chain systems and business to business setting an exploration of literature suggests
three key dimensions. These are trust (Kumar et al, 1995; Dorsch et al., 1998; Walter et al.,
2003; Fynes et al., 2005; Rauyruen and Miller., 2007; Kühne et al., 2013; Razavi et al., 2016),
commitment (Kumar et al., 1995; Dorsch et al., 1998; Walter et al., 2003, Fynes et al., 2005;
Rauyruen and Miller., 2007; Razavi et al., 2016) and satisfaction (Dorsch et al., 1998; Walter et
al., 2003; Rauyruen and Miller., 2007; Kühne et al. 2013). There are other factors but have
found relatively limited attention in the research works. The three factors are explained in the
following paragraphs.
Trust
According to Hosmer (1995), trust is all about relying upon any accepted responsibility in order
to protect interests of all parties engaged in the process of economic exchange. For supply
chain it is a key element for relationship (Svensson, 2004; Gounaris, 2005). It is understood that
building trust among the partners is important for mitigating the risk involved (Spekman and
Davis, 2004). Trust has been of huge importance in studies involving intra‐firm relationships
(Kingshott and Pecotich, 2007; Morgan and Hunt, 1994)
57 Page
Commitment
Commitment encompasses the belief of the players in the supply chain, in the current
relationship, wherein they make their best of the efforts to maintain the terms with other
parties (Morgan and Hunt, 1994). It also includes their willingness to maintain the relationship
(Monczka et al., 1998 and Spekman et al., 1998). This dimension of the quality of relationship is
essential for long term gains. It is noteworthy that the partners are showing willingness towards
focusing on the long term goals at the cost of short term goals (Mentzer et al., 2000). The result
of building long‐term relationships is towards perceived mutual benefits (Morgan and Hunt,
1994). Commitment is an indicator of the level of existence of a relationship in terms of
continuation and break‐down (Wilson and Vlosky, 1998). In addition, Anton et al (2007) said
that reduction in commitment from the supplier influences the relationship between different
parties have a negative impact on the willingness. Any business relationship between two
supply chain entities, which is in continuum needs high degree of commitment to ensure the
achievement of objectives of the supply chain system (Kwon and Suh, 2005). Commitment is
positively and directly related to performance of partnering entities and the whole supply chain
system (Prahinski and Benton, 2004).
Satisfaction
Satisfaction is another key factor which is essential for a strong relationship (Wilson and
Jantrania, 1994). It is strongly connected with the fulfillment of needs and even analogous at
times. (Naude´ and Buttle, 2000). It has strongly linkages with the overall supply chain
performance. Satisfaction can be both economic as well as social which are both involved in
business transactions. Satisfaction from the economic angle is all about the reaction towards
economic benefits of the other players in the chain while satisfaction arising about of social
aspects is mainly about gratification and issues pertaining to the exchange of information (Batt,
2004).
Overall Supply Chain Performance
The overall objective of the supply chain system is to make the system efficient thereby leading
to improved performance. This is strongly present in the literature where in various aspects are
discussed. The supply chain activities when linked with sourcing decisions and manufacturing
goals reflect key supply chain performance indicators viz., cost, quality, dependability and
flexibility (Narasimhan and Jayaram, 1998). These fours aspects are key to supply chain
performance and they can be highly impacted by the strength of the relationship exhibited by
the supply chain players. However, much of the literature on the quality of relationship has
focused on the marketing aspects (Morgan and Hunt, 1994). The impact of quality of
58 Page
relationship (in supply chain settings) on the overall supply chain performance has found
limited attention in the extant literature especially in the Indian context. The study closest to
the present work is that of Fynes et al (2005) who have attempted to the test this relationship
however they have composition of quality of relationship is differently envisaged by them.
Hence, research on examining the impact of quality of relationship on supply chain
performance in supply chain settings in India is a gap which strongly needs to be addressed.
Methodology
The present study involves data collection using structured questionnaires through personal
interaction from the supply chain entities. The key objective is to test the impact of quality of
relationship via trust, commitment and satisfaction on the supply chain performance factors.
The scale items are taken from the various studies related to supply chain in different contexts.
The scale items are refined based on the recommendations from the practitioners and
researchers in the field of supply chain and operations. Data collected will be put to advanced
techniques of multivariate analysis. The impact of quality factors (independent constructs) on
supply chain performance (dependent constructs) will be evaluated.
Findings and Implications
The results of analysis will help in understanding the influence of the quality factors.
Specifically, the impact of possible influence of each factor on the supply chain performance
factors will be the resultant. This means that relationship between trust, commitment and
satisfaction (independent constructs) and overall supply chain performance factors viz., quality,
delivery, cost and flexibility (dependent constructs) will be analyzed. The results will have useful
implications for the supply chain managers and the parties involved to focus specific factors of
quality of relationship based on their predefined performance objectives related to supply
chain performance.
Originality Value
The present study provides useful insights into the linkage between quality of relationships and
supply chin performance which have together received limited attention in the extant
literature. The study will be useful for academia and industry based on its ability to highlight a
key area which is deeply rooted in the Indian culture which is based on building and
maintaining lasting relationships.
59 Page
27. Moderating the effects of Lean manufacturing: A contextual framework
with respect to process industry
Anand Sasikumar and Padmanav Acharya.
The Lean implementation issues in different production systems are due to the complexities of
the process flow structures. Each production system is unique in comparison with other
systems. The uniqueness in terms of volume and variety are major obstacles in implementing
lean manufacturing concepts. The purpose of this paper is to address the issues in
implementing lean manufacturing principles in process industry. The analysis involved the
studying the research articles published from 2006 to 2016 in selected operations management
journals. The articles are categorized by time distribution of articles, methodology of research,
authorship patterns and implementation status in companies. The present paper tries to
explore how the tools and techniques of lean manufacturing developed for assembly line
production system can be adapted to continuous production system. The findings include the
need for intensification in empirical research, the challenges of adapting and implementing lean
principles in continuous process industry.
28. Logistics Management: Opportunities and Challenges with Reference to
Selected Organizations
Parikshit Kala.
Logistics management has become an integral part of business organizations that are keen to
sell their product worldwide. Even the developing countries are not far behind the race. As far
as Indian Logistics Organizations are concerned they are very curious to pick up and deliver the
Services via using effective modes of Transportation to dispatch the cargo shipments. Trend of
logistics management is very popular in metro cities among Supply chain service providers like
Blue Dart, Gati, Dtdc, Pafex, Concor, etc. Researcher took 150 Sample size from three metro
cities from North India. Intention of this research is to find out the motivating factors of logistics
management. In this study researcher asked several questions relating to logistics products and
efficiency in services. This study would be beneficial for logistics organizations to make
potential strategies regarding logistics management.”
60 Page
29. Does magnitude of penalties matter? An empirical investigation in the
healthcare context
Gopalakrishnan Narayanamurthy and Rachna Shah.
Purpose: In general, facilities are inspected by regulatory agencies to check the compliance
status on certain specific pre‐defined standards. On non‐compliance, inspectors decide to
penalize the facility. Based on the scope and severity of the non‐compliance observed,
inspectors impose penalties to threaten and push the facility towards compliance. In this study,
an attempt is made to disentangle the impact of having a penalty and that of the magnitude of
penalty on the future quality of care delivered. Through this attempt, we will be able to
understand the role played by the magnitude of penalty imposed.
Design/methodology/approach: To answer the research question, penalty data of U.S. nursing
homes from 2011‐2014 were empirically analyzed using fixed effects model. Penalties were
binary coded into ‘0’ for those not penalized and ‘1’ for those penalized. Model with these
binary coded variables were run to test the impact of having or not having the penalty on
nursing home’s quality of care. Subsequently, we ran the model only on those nursing homes
which were penalized to capture the impact of the magnitude of penalty. Several other control
variables at state level, zip code level, and nursing home level were included in the model.
Sample, measure and method robustness checks were also performed to reconfirm the results
obtained.
Findings: Results revealed that future quality of care improves on having a penalty, irrespective
of the amount of penalty imposed. Future quality of care was also observed to improve with
increase in magnitude of penalties. But, it was observed that the impact of having a penalty on
future quality of care was much higher than the impact of magnitude of penalty. Analysis also
showed that the magnitude of penalties have an inverted N‐shaped relationship with quality of
care. Different post‐hoc analysis were conducted to draw research and practical implications of
this study.
Originality/value: Based on the literature review conducted, we believe this to be the first
study to understand the impact of a post‐inspection outcome, namely the monetary fines on
future quality of care. This paper is also adding to the minimal literature on inspections in the
context of healthcare. Current study questions the practice of penalization – Is it sufficient to
blacklist the facility as a non‐conforming penalized one with zero penalties or is it essential to
impose them with heavy amount of penalties?
61 Page
30. Category Management: Enriching Customers private label purchase
Vilas Nair and Susan Abraham.
The change is driven by much more educated shoppers (thanks to the Internet), which affects
their path to purchase, and increased data complexity as big data continues to evolve the
accelerating trends within the retail and consumer packaged goods have increased the
importance of category‐based thinking and approach, and a requirement for more
collaboration between Retailers and Supplier / Manufacturer partners. Category Management
is a collaborative continuous process between manufacturers and retailers to manage a
shopper need state which we refer to as a ‘category’. The purpose of this process is to optimize
shopper satisfaction and fulfill the role chosen by the retailer for that category within the
overall portfolio of categories in the retail format. The end state of the category management
process is that combination of assortment, price, shelf presentation and promotion which
optimizes the category role over time. Category management is data intensive and analytical in
character. Category management is about understanding data. By contrast, shopper marketing
is more about understanding emotions or motivations. The retail industry is changing, and
retailers are vying for market share in an increasingly competitive environment. Shoppers are
becoming more complex and demanding. Data and technology options are increasing in
complexity with more and more big data. This research studies that category management
practices finds the optimal solution and provides both assortment, customer service, promotion
an important role. The process of category management consists of three phases namely
analysis, implementation and forecasting (KotzaB & Bjerre (2005). Analysis refers to analyze the
collected information regarding to customers, category development, and the retailers
performance in the category. Implementation means to carry out the analysis above in order to
enhance customer satisfaction, increase sales decrease costs. Forecasting represent the
expectation of how categories can be developed and a how customers’ needs can be
determined in the future.
PRIVATE LABEL BRANDS IN INDIA
Organized retailing is spreading and making its presence felt in different parts of the country.
With the entry of very large corporate houses like Reliance Fresh, Vishal, AV Birla group, Bharati
Walmart joint venture and the existing Biz Bazar, Spencer, Food Mart are also in large scale
expansions across the country, the spread of the organized retail is going to reach soon the
small populations towns of 1 lac to 5 lacs after covering all big, medium and small cities.
The trend in grocery retailing, however, has stated with a growth concentration in the South.
Though there were traditional family owned retail chains in South India such as Nilgiri's as early
as 1904, the retail revolution happened with various major business houses foraying into the
62 Page
starting of chains of food retail outlets in South India with focus on Chennai, Hyderabad and
Bangalore markets, preliminarily. In the Indian context, a countrywide chain in food retailing
has been pioneered by Big Bazar and Reliance fresh only. A large degree of private label growth
is due to the consolidation and expansion of the retail food industry. Over time, as retail chains
have expanded, they have moved from being price takers to price setters, thereby shifting
power from manufacturers to retailers. The increase in private label products among formats
and across countries has allowed retailers to focus on differing consumer demands around the
world.
It is increasingly evident that private label retailers are constantly expanding product selection
to appeal to the greatest consumer segments. For example, private labels stock keeping units
(SKUs) have increased eleven‐fold globally from 2004 to 2008, finally reaching 9,500 during
2008 to 2009. The expansion of retailers across countries and the increase of private label
products across different store formats are not only increasing sales and volume of private label
products, but are creating new opportunities to launch innovative, healthy and conveniently
packaged products to suit different consumer’s needs. Range in India is narrow across
categories compared with developed markets. A leading hypermarket would have 8,000 to
10,000 SKUs. Consumer companies have traditionally focused on fewer SKUs due to lower
affordability and fragmented retail. In future shoppers will increasingly demand more range of
products and retailers will use this as a source of differentiation. Private labels or store brands
can reduce entry prices and raise margin: high value private‐label manufacturing contract
increase retailers‟ bargaining power with vendors and attract more shoppers owing to lower
prices.
The study demonstrates that sales due to category management practices can be significant.
Finally, we propose adoption of private label as a category. With private label brands retailers
attempt to utilize this measure of exclusivity to differentiate them from the competition. The
results of this study suggest that category management enhance customer satisfaction by
focusing more on product availability, presentation, and customer service rather than price.
Key words Category management, private label, product availability, presentation, SKU, Stock
keeping units and customer service.
31. Assessing Risk by the High Net worth Investors of India in Financial
Decision
Shiba Parhi, Mohammad Khalid Azam and M Venkateshawrlu.
Introduction: Financial Management has been guiding the investors in assessing risk, but study
says there are several anomalies in actual measurement of risk. People of different background
63 Page
assess risk differently in different situation. The economist Daniel Kahneman and Tversky
published several papers on the above topic. But looking investors of Indian, a parallel study is
essential explore the variables. High Net worth Individuals are the measure investors in Indian
Business market, so to study their approach and behavior is essential
Objective:
1: To understand the importance of psychology and sentiment while taking financial decision by
the investors in Indian.
2: How do they assess the risk?
Methodology:
To carryout conceptual study to understand the behavior of Indian HNI Investors.
To apply Survey method to explore underneath variables.
Future Scope of the study: The study will help us in understanding the behavior of influential
investor and will guide financial institutions in formulating better financial policies.
32. Application of Behavioral Finance and econometrics to understand the
High Net worth Individuals investors during Uncertainties and Risk in
India
Shiba Parhi.
Introduction: Day by day uncertainties and suddenness are increasing because of political
turmoil and economic uncertainties. Predicting future on the basis of past data on such
situation is challenging. Basically when we are trying to map the behavior of investors in such
situation through econometrics, it is even more challenging, though there are number of
multivariate time series analysis, but need proper analysis.
Objective of study: To forecast the behaviors of HNI investors during economic uncertainties
and risk. Under Behavioral Finance and Econometrics to find out the path to study the HNI
behavior because of the constraint of availability of data.
Research Methodology: To do a conceptual study of the challenges faced by the forecaster in
above situations and to cross verify through econometrics analysis, if possible.
The problem to study HNI is the data, as such because of various rules and regulation and
privacy constraints getting data regarding stock investors and specifically HNI become difficult,
in such situation what a researcher should is a big question mark. Researcher faces problems in
getting basic data relating to pat investments.
64 Page
Through different econometrics analysis the data to be forecasted before the stock market
turmoil and to match with the actual data. Here through various study to understand the
limitations of econometrics in predicting future and to find out the corrective measures to be
taken. The evolving state of economic and political situation is to be understood for such
process. Along with the conceptual and econometrics analysis, in depth interviews to be
conducted among the professionals, econometrics expert and statisticians to understand the
perception among the technical forecaster regarding such mathematical tools.
Future Application: Day by day political turmoil are increasing as well as the terrorism, because
of political situations economic conditions are getting affected in term of pricing, consumption
and export and import condition. How HNI investors behaves in such situations in future.
33. Application of Optimizing Techniques in Indian Auto Ancillary Industries
for SCM.
Karan Venkatesh.
Organizations face many challenges in their battle to survive in the current economic climate. A
major challenge facing an organization is the need to change and change rapidly to remain
competitive. This imperative to change can be categorized as a key to survival. A major change
agent in the current economic climate is the optimization of resources and business processes.
Consequently, optimization has become an essential part in the strategy for survival. An
important prerequisite in achieving optimization is the elimination of waste and as a result
adding value to business processes, products and services companywide. Recent research
postulates that to be successful, organizations must implement strategies to boost process
optimization objectives that achieve customer satisfaction and competitiveness. It particularly
focuses on the impact of lean application in terms of speed, flexibility, reliability, quality and
cost in an attempt to create value to survive and attain customer satisfaction.
Manufacturing firms have a huge number of problems and in order to tackle them involves lot
of man power, time and energy. Thus selecting most influencing factor is the biggest hurdle
faced by the industry; which varies from industries to industry, product to product. In this
highly fluctuating market one requires numerous Research methods which are accurate and
dynamic in nature. Also with increasing competitions in industries adds to the complexity of
selection of parameter. The purpose of the project is to identify the most influencing problem
area and optimize the same in Indian Automotive Industry with respect to Supply Chain
Manufacturing (SCM) using Survey method, weighted average, Factor Analysis (Exploratory
type) technique and Kanban Systems. The basic steps of methodology are Survey instrument
development with the help of questionnaire, data collection, data analysis and validation. The
65 Page
data analysis approached is by weighted average, and validation through Factor Analysis. Also
use of Kanban systems for Optimizing the Inventory. This research is expected to help
government and private industry in selecting the most influencing problem area and its
optimization. It will also help in establishing the relation between various problem areas to cost
reduction. This increase the prediction accuracy in supply chain thus helping organizations to
draft there strategic plans and policy up gradation.
34. Building the foundation for Supply Chain Costing by identifying and
prioritizing the elements involved using TOPSIS.
Shilpa Parkhi and Gary Cokins.
Purpose:
Supply chain managers recognize that the next frontier in supply chain cost management lies in
portions of supply chain beyond their direct control. These executives have long back
understood that many of their costs and business processes are driven by behavior and
practices of their trading partners. Executives require a much broader view of costs than is
provided by their firm’s cost management systems. Supply chain managers’ needs to improve
their internal cost information and extend their “line of sight” to include their trading partners’
costs, both upstream and downstream. Without this information, supply chain costs cannot be
effectively managed. Many of these costs are driven by business practices of trading partners.
Cost visibility and inter‐firm cost management can reveal new potentially greater opportunities
for cost reduction than can be achieved by a single firm.
Despite the importance of supply chain costs, few executives possess the ability to effectively
manage these costs. They frequently lack cost information regarding the firms’ internal
processes, the activities comprising these processes, or the costs to serve different customers,
marketing channels or supply partners. Executives have less visibility over trading partners’
costs or factors influencing their external costs. Above all, supply chain professionals operate in
a dynamic business environment. The requirements of end user demands and the way
organizations function and interact with trading partners are altered by factors such as
globalization, product / service variety expansion etc. Hence measuring and managing both the
existing and prospective supply chain costs is required to meet the sustaining profitability and
remaining competitive in the increasingly complex environment. Firms still continue to rely on
their traditional inward looking costs systems; some firms have begun to extend their cost
visibility to include the major segments of their external supply chain. These firms have adopted
approaches to encounter similar problems in supply chain. But the techniques and strategies
involved differ based on firms’ position and level of cost knowledge of partners. The framework
66 Page
essentially consists of a series of steps recognizing to the costing requirement and challenges
posed by the supply chain.
Design:
Those firms already on their supply chain costing journey have attempted to capture expense
information and calculate costs from end user to the ultimate source of supply. The resulting
cost knowledge allows these professionals to report the magnitude of supply chain costs and
focus on key cost drivers across supply chain. The journey of implementing supply chain costing
consists of five steps. The steps are iterative within the firm and the supply chain.
The process of implementing supply chain costing is shown below:
Step 1: Identifying the elements of cost in Supply Chain
Supply chain costing needs to capture costs in a manner that enables managers to view and
portray costs in many different ways. This step gives careful classification and assignment of
costs. Alternative cost classification permits isolation of costs by product, customer or supply
chain. This step comprises of creating supply chain costs to performance and value creation
through the economic value added or balanced score card model.
Step 2: Prioritization of elements of cost of Supply Chain:
Firm uses a variety of costing method and tools to increase cost visibility and manage internal
and external costs. Hence supply chain encompasses a wide variety of tools and technology.
Most appropriate costing method depends on the management position or the position of firm.
Some costing technique works better than the others in different circumstances. Some work
well in mass production whereas some work well in lean. Hence choosing them is pivotal.
Step 3: Develop a foundation for effective supply chain costing:
First, executives need to have an appropriate foundation in place to support supply chain
costing. Essential elements include a shared vision of SCM and what costing information is
needed to support management decisions. The structure of the cost system should be based on
firm’s strategy, production methods and operating environment. Understanding the factors
affecting the supply chain costs should also be a mechanism in the costing system. The firm’s
position in the supply chain directly influences the supply chain cost and can be managed with
and without sharing the costs with the value chain.
Methodology:
Technique for Order Preference by Similarity to Ideal Solution or TOPSIS was originally
proposed by Hwang and Yoon in 1981. The elements are prioritized on the basis of their
67 Page
similarity to ideal solution. The solution that captures cost related information most efficiently
and can establish the strongest link between the cost and supply chain processes is considered
to be the ideal solution. While the solution that that is least efficient in capturing cost related
information and establishes weakest link between cost and supply chain processes is
considered to be the negative or anti‐ideal solution.
Considering the distance of elements from the ideal and anti‐ideal solution, the cost elements
are prioritized. The high priority elements are those that near to the ideal solution and far from
the anti‐ideal solution. The elements near to anti‐ideal solution and far from ideal solution get
low priority. In this way the high priority cost elements are most crucial for the foundation of
supply chain costing. This high priority elements act as building blocks for any model developed
for simulating supply chain cost and its impact on supply chain processes.
Procedure for TOPSIS:‐
1) Develop the multi‐criteria decision matrix.
2) Derive the normalized matrix.
3) Assign weights and formulate the weighted normalized decision matrix.
4) Find the ideal and anti‐ideal solutions.
5) Find the proximity of cost elements to ideal and anti‐ideal solution.
6) Establish the relative distance to ideal and anti‐ideal solution and prioritize the cost
elements.
Findings:
Even though most of the companies have not been able to implement an efficient supply chain
costing process that can provide enhanced, transparent and visible information regarding the
costs incurred throughout the supply chain. Yet, all the companies that participated in the
research felt the need to obtain the cost information regarding all their trading partners
throughout the entire supply chain. The realization of having an effective supply chain costing
system can be attributed to the shifting focus of the supply chain management processes which
calls for analyzing the costs not only from a single firm but also the costs incurred by all trading
partners in delivering the final product or service to the customer. This shift in center of interest
requires an altogether different cost management perspective than what currently exists in
most organizations.
Firms which focused on supply chain costing considered cost knowledge as a competitive
advantage. Thus, cost information has become an integral part of their culture and has been
aiding these firms in managing their operations by providing a cost driven link between their
decision making processes and its impact on firm’s performance. To establish this cost link
throughout the supply chain, cost estimation models can be developed that can capture the
68 Page
costing information and establish a relationship between the process changes and total cost of
supply chain. Therefore supply chain costing provides a holistic view of costs incurred
throughout the supply chain.
Originality and Value:
Based on the review of the literature of the elements of the cost of supply chain are identified.
Further to establish the significance and influence of these factors on cost of supply chain
Topsis methodology is used. The prioritized elements can be used as a foundation to develop a
supply chain costing model that can establish cost link throughout the entire supply chain and
simulate the impact these elements of cost and supply chain processes.
35. Military Aircraft LRUs with MRO Supply chain improvement: Self Reliance
in Aircraft MRO business and Sustainability for future
Krishana Kant Shukla, Ravindra Kumar Chauhan, Umashankar Aland and Prakash Joshi.
Hindustan Aeronautics Limited (HAL) Nasik has geared up with MRO business for Airframe & all
system LRUs especially Mechanical LRUs at Nasik base & Electrical, avionics LRUs at its sister
divisions within India. Organization has acquired necessary skill sets & better global practices
for its entire operations & spare management. During execution of SU‐30 MRO establishment
for ROH of Airframe & mechanical LRUs, HAL Nasik has managed global practices for its
Qualitative aerospace operations & spares related issues since inception. The risk involved for
execution of MRO of Su30 MKI aircraft that this activity was not being carried out at OEM base
and HAL is the 1st organization in India as well in the world which is engaged in MRO of
SU30MKI aircraft in‐coordination with its global experts. The entire material planning & supply
chain made sustainable for MRO of Mechanical LRUs for MiG‐21, MiG‐27, Mirage‐2000 & other
variants of military aircrafts. HAL’s business operations management has achieved not only
complete management of spares from different OEMs spread globally but were made
sustainable and supporting to Indian Air force from more than five decades. Now it is necessary
to be self‐reliant in spares management to sustain with MRO business of LRUs & Airframe for
cost effectiveness as private players have entered in this business. Also it’s a need of time to
achieve required pace of production / services at par with customer’s requirements. This paper
shares the best global practices implemented by Hindustan Aeronautics Limited Nasik to make
their MRO business sustainable and competitive in spares supply chain management. Also it
explores the opportunity to acquire the business in similar services for civil airline OEMs.
69 Page
36. Redesign of Supply Chain Network of Footwear Manufacturing Company
and impact of GST using Sensitivity Analysis tool
Shilpa Parkhi and Udgar Antani.
Purpose:
The purpose of this paper is to identify the Supply Chain network area of a footwear
manufacturing firm where optimization can be made keeping in mind two Key Performance
Indicators (KPIs): Savings & Service Levels and two Scenarios: Pre GST & Post GST using Dynamic
Sensitivity Analysis method.
Design/Methodology/Approach:
The reader is given analysis of how an optimum network design post Goods & Services Tax
(GST) would vary from an optimum network design in today’s taxation scenario. Post GST
optimal Supply chain network design will be based on logistical benefits and demand
management rather than tax costs. Facility location techniques like Centre of Gravity technique
and Load Distance technique can be used to determine approximate coordinates of the
consolidated Warehouses/RDCs/Depots. Dynamic Sensitivity Analysis method validates the
coordinates of each given location using simulation methods. For propriety reasons, some
information has been disguised and some data have been sanitized.
Findings:
The re‐organized network will in fact be significantly different for footwear manufacturing firm
which can take advantage of Economies of scale in the following manner:
1.Rationalization of Warehouses/ Regional Distribution Centers (RDCs)/ Depots:
o The move towards fewer Warehouses/ RDCs/ Depots would require them to combine, close
and re‐locate.
o The choice of Warehouse/RDC Locations, Depot Locations with respect to the Plants and the
Demand Markets.
o Required capacity of many Warehouses/ RDCs/ Depots will undergo changes and with fewer
numbers, the average sizes will go up.
o Fewer & larger Warehouses/ RDCs/ Depots may make it feasible to route plant production
directly to them rather than through hubs, due to larger throughputs. Thus, the size and
number of hubs could get affected.
70 Page
o The linkages between factories‐hubs‐ warehouses/ RDCs/depots ‐customers for various
products will get re‐aligned.
o Consolidation of warehouses/RDCs/Depots would mean a straight saving on warehousing
costs. The inverse root law states that: ‐
Safety Inventory = 1/sqrt (Number of Stocking Points). This means that the safety stock
requirement would also go down.
o Prima‐facie, some of these savings would be offset by the increased cost of freight especially
Secondary Freight.
2. Rationalization in Distribution and Transportation costs:
o State boundaries will no longer be the parameter for deciding routes since the tax rates
across states are envisaged to be uniform. At the same time, with larger
warehouses/RDCs/Depots, transportation lot sizes will automatically increase, making way for
more efficient bigger trucks i.e. use of FTL (Full Truck Load).
o Re‐designing supply chain networks would decrease cost of primary freight since
warehousing/depot locations are likely to be placed closer to manufacturing/import/export
locations. In contrast, this would increase secondary freight due to fewer
warehouses/RDCs/Depots.
o Downtime of vehicles due to trade barriers such as check‐post inspection, filing of entry
permits, compliances under Entry Tax laws and local levies will be eliminated.
The optimization and rationalization that above options can bring about in the supply chains of
a firm on account of GST will provide a competitive advantage to the business through low‐cost
better service and faster turnaround times.
Thus GST offers a great opportunity to revisit your Supply Chain & Distribution strategy, and
identify what is required to become GST ready. Early movers are likely to gain an advantage on
cost and service levels over their competitors and deliver a better value proposition to the
customer.
Research limitations/implications:
Our approach is focused on a footwear manufacturing firm in the Indian context and thereby
limits the ability to generalize the findings. Nevertheless, this study may serve as a significant
starting point for future research.
71 Page
Practical limitations/implications:
This paper focuses on Pre GST and Post GST scenarios and the implications of the latter will be:
o The Supply Chain network would be Tax neutral as far as Post GST scenario is evaluated.
o Distribution networks would shift towards the interstate sale model, eliminating the need for
C&FAs (Carrying & Forwarding Agents) and warehouses/RDCs/Depots in each state.
o The efficiency of Supply Chain would fundamentally depend on the minimization of Supply
Chain cost such as Primary Freight, Secondary Freight, CFA charges, Warehouse/RDC Fixed and
Variable Cost, Depot Fixed and Variable Cost etc. while maintaining service levels.
o Design of the Supply Chain such as Hub and Spoke vs. Meshed Design vs. combinations
thereof.
o Choice of Mode of transportation such as Road (9 tonner vs. 15 tonner vs. 20 tonner) and Rail
(Half Rake, Full Rake, 2 Point Rake) for the different linkages of Supply Chain.
o Choice of Inventory and Transportation strategies such as Safety Stock, Reorder cycle, Milk
Runs etc.
o Efficient handling of larger volumes per warehouse would command increased reliance on
automation/ technology applications such as Enterprise Resource Planning (ERP) and
Warehouse Management System (WMS).
o The redesigned network will come with the need for technically qualified and optimally skilled
workforce across the supply chain.
Originality/value:
Our work is perhaps the first on impact of GST on facility relocation and service levels in
emerging economies like India covering actual findings and experiences. It gives new insights to
a streamlined supply chain and distribution network reflecting both theoretical imperatives and
practitioner requirements.
Keywords‐ GST, Redesign of Supply Chain, Footwear Manufacturing, Sensitivity Analysis, Facility
location
72 Page
37. Energy efficient reconfigurable architecture for motion estimation in
video coding
Savitha Swaminathan.
Reconfigurable architecture has the ability to dynamically allocate the resources of a
computing device during runtime. This system incorporates some form of hardware
programmability and customizes the hardware periodically in order to execute different
applications using the same hardware. Reconfigurable architecture can be effectively used in
computationally intensive application like media processing. In media processing, video coding
is the computationally intensive part. In video coding, motion estimation is the critical
component as it consumes large amount of computational resources. To overcome this
problem motion estimation is mapped into reconfigurable architecture to effectively manage
the power utilization by dynamic reconfiguration. Determining the motion of objects between
the frames is called Motion Estimation. Dynamically reconfigurable hardware is configured,
based on the input parameters such as battery level of the device, output quality level and the
level of motion in frames of input video. The different configurations are used to reduce the
power dissipation and computational complexity.
Materials used: Altera Quartus v9.0 to design reconfigurable fabric
Methods used: Full search algorithm is used to calculate motion estimation between the
frames. For motion estimation, sum of absolute difference is evaluated by each modules in
reconfigurable fabric. Different sizes of search window is used during motion estimation, to
analyze the power dissipation.
Conclusion: The chrominance subsampling process is considered to study the different
subsampling patterns in YUV video format. Based on that, the YUV 4:2:0 formats is taken as the
input video. The individual frames of the input video are extracted. This is verified using the Hex
Editor tool. The level of motion between the frames for the input video is determined. The
resource utilization for different search window size is analyzed using Altera Quartus 9.0. The
power dissipation is verified by analysing the selecting number of processing elements. The
results concludes that the proper configuration for motion estimation selected during runtime
gives the optimization in terms of power and resource utilization.
38. Lot‐Sizing for Forecasted Demand at Metal Finishing Industry
Pranav Dange, Pranay Daharwal and Pravin Tambe.
Purpose ‐ This paper considers problem associated in lot‐sizing for the procurement of bars for
forecasted demand in metal finishing industry. With the help of the practical case study,
conducted in March‐April 2016 this paper intends to evaluate different lot‐sizing techniques
73 Page
and it’s applicability for the forecasted demand to provide a proactive decision making
approach for procurement managers.
Procurement management is the systematic approach used for buying all the goods and
services needed for a company to stay sustainable. Managing your procurement well adds
value to all business practices and save both time and money. Managing procurement in this
world of liberalisation, globalisation and privatization is one of the challenging problems for the
researchers and practitioners. With the help of these techniques the managers will be able to
understand the trend and plan for the resources needed for meeting the demand which will
have substantial effect on the industry performance in its operation and its supply chain.
Design Methodology/ Approach ‐ This paper try to put forward application of following lot‐
sizing techniques 1. Economic Order Quantity (EOQ) 2. Least Unit Cost (LUC) 3. Minimum Cost
Period (MCP) 4.Part Period Balancing (PPB) 5. Period Order Quantity (POQ) in determination of
total inventory cost.
These techniques are used because lot‐sizing has its far reaching effects on productivity of the
industry and cost associated with procurement. Lot‐sizing concerns with quantity to be
procured and time of procurement. Proper lot‐sizing helps in reducing cost of procurement
while meeting the demand on time. It results in optimization of procurement cost which
includes ordering cost and carrying or holding cost of raw materials. It helps in improving
productivity by optimizing input resources and reducing capital investments. Lot‐sizing is a
technique in the area of operations management which is concerned with determination of
quantity and timing of procurement in a firm to have optimum (minimum) total cost (ordering
and carrying cost) of procurement to satisfy forecasted demand.
Practical implications ‐ The industry had established its operations in the year 1997 which
consists of the range comprising the finest Carbon Steel Product and Bright Bars which has a
high demand in the market. Finishing of this product is done in compliance with the set of
industry norms and guidelines, utilizing the finest raw materials and modern machines. It has to
first pass through the Centre‐less grinding machine in which its diameter is reduced by 0.5 mm
which is followed by dipping bars in acid treatment tanks for improving the electrical
conductivity and load bearing capacity. While procuring the material the industry have been
facing high inventory and procurement cost which is leading to vague decision making of
material requirements planning. This paper investigates the problems by forecasting demand
using quantitative method of forecasting and applications of different lot‐sizing techniques for
meeting the forecasted demand for optimizing total ordering and inventory carrying cost also, it
can be useful for capacity planning of the industry.
74 Page
Findings ‐ The industry has order round the year and to meet this order, they have to procure
raw materials round the year. Currently, they have lot for lot type of lot‐sizing system which
involves very high ordering and carrying cost with huge capital investment. In this lot for lot
type of lot sizing a separate planned order release is placed for each periods projected
requirements by taking the lead time into consideration. This kind of practice leads to excessive
ordering cost if the cost per order is highly significant when compared to the carrying cost per
tonne per month. If the product is finished within the industry then the associated cost for
setting up the finishing system facilities is called as setup cost. But in this case it is brought from
the vendor then it is called as ordering cost. Hence, at the time of making planned order
release, it is made by considering the relative difference between the ordering cost per order,
and carrying cost per tonne per month, it may result in minimum total inventory cost thus this
paper uses this approach to be followed for minimizing the total inventory cost from the
available alternative methods to determine the lot size (order size) in the optimum (minimum)
cost using the best available resources. Demonstration of each lot sizing method is meticulously
calculated and for each method MRP (Material Requirement Planning) is done for determining
the planned order release and stock on hand for the forecasted demand (Projected
Requirement).
The outputs from individual calculations of each method for total inventory cost are shown in
the table given below:
Technique Total Ordering cost Total Carrying cost Total cost
Economic Ordering Quantity 135000 101700 236700
Period Order Quantity 180000 0 180000
Part Period Balancing 120000 49000 169650
Minimum Cost per Period 120000 49000 169650
Least Unit Cost 105000 93750 198750
From the calculations it is clearly manifested that the optimum method of Lot Sizing (Part
Period Balancing or Minimum Cost per Period) should be selected for the procurement of the
raw materials for which the total inventory cost involved is minimum. So in a nutshell this
papers finds the optimum total cost for the appropriate order quantity by implementing
different techniques of lot sizing and also when the planned order to be released. Thus, for an
industry having huge difference in inventory carrying and ordering cost Part Period Balancing or
75 Page
Minimum Cost per Period Method of lot‐sizing should be used for calculating Lot‐Size which can
be further used for Capacity Planning.
39. Vendor Rating & Inventory Management in an Indian Start‐up: A
combined AHP‐TOPSIS approach
Nishant D. Singh, Rohit Singh, Chetan Saxena and Naman Singh.
Fracktal Works is a Bangalore based start‐up which is unique in its own way; Fracktal Works
though known for its 3‐D printers specializes in product development. And during 3 years of its
existence has worked on product development for firms like L’Oreal Cisco, Toshiba, L&T, etc.
Designing an inventory management model for Fracktal was an interesting experience for SIOM
as they are in a growing phase and are constantly adding products to their catalogue. The
growth is not only limited to the volume of the existing products but also to the product mix
itself. SIOM had to be extremely careful that any system designed should be robust enough that
it can withstand the future growth that the firm is aiming.
Rating the suppliers/vendors using Analytical Hierarchical Process involved enabled us to have a
closer understanding of the factors that are essential for effective purchasing. Vendor rating is a
result of a formal vendor evaluation process, while the purchase department at Fracktal Works
does evaluates its vendors, a more formal system was needed which incorporates the
company’s evaluation and rating criterions, ranging from quality, delivery to the scalability
Developing a Vendor Rating system is a complex problem right from the selection of the criteria
to be considered to the method used to analyze various suppliers on the basis of the selected
criteria. Many researchers have focused on the vendor selection problem and have come up
with various criteria on which a vendor can be evaluated.
G. W. Dickson in 1966 studied supplier selection system and decision, and came up with twenty
three supplier criteria that should be considered in vendor evaluation, like quality, delivery,
price, performance history and others. Research compared the works of Weber, Current and
Benton (1991) and the 23 criteria of Dickson (1966) and concluded that price, quality, and
delivery are the most important vendor selection criteria. Ellram (2002) came up with the idea
of including management opinion as the criteria in supplier selection.
The Vendor Rating includes various intangibles like customer service along with different
tangibles like Quality and Delivery. There are various quantitative and qualitative criteria
involved in order to make multi‐objective decisions for vendor evaluation. To address this
problem statement, Thomas L. Saaty’s (1980) AHP can be used as it uses both qualitative and
quantitative criteria in order to make decisions. Analytical Hierarchical Process is a decision
76 Page
making method that assigns priorities to alternatives when multiple criteria are to be
considered and thus allows the decision maker to create hierarchical structure for complex
problems.
As the criteria were impacting the vendor rating both positively and negatively so TOPSIS is
used along with AHP. There have been a lot of researchers who have used AHP along with
TOPSIS for solving Multi criteria decision making problem.
Jadidi et al. (2010) used a TOPSIS based model for multi criteria decision making supplier
selection problem. Vimal et al. (2012) also used TOPSIS method in order to develop an
approach for a manufacturing company for selecting a competent supplier.
Need or justification of the paper
Although the purchase department of the company purchases goods, raw materials,
equipment’s, spares, intermediary products, office items etc. for all its divisions and
departments. The operations department is responsible in determining what to buy, how much
to buy and where to buy from. But the company had no rating system in order to evaluate and
rate its vendors based on their performance.
The objective of this paper is to develop a vendor evaluation and rating system that
incorporates the opinions of the company experts in determining the evaluation and rating
criterions, and then to rate their present vendors on the basis of these criteria.
The vendor rating is needed in order to improve the quality and reliability of the suppliers. It
helps the purchase department to cultivate the good sources that help it to meet its current
and future needs. It helps the company to identify the suppliers who offer best value for the
money spent.
A good vendor rating system protects the purchase department from the charge of bias from
their colleagues and other suppliers, as the department is able to rate the performance of each
supplier based on their entire performance.
It acts as a feedback to suppliers to improve performance and helps the purchase department
to recognize and reward outstanding performers, and can be used to allocate business share
among number of suppliers.
Also objective decisions can be made to disqualify and black list poorly performing suppliers
based on their rating. Also the ratings obtained by the top performers can be used as a
benchmark for others.
77 Page
Apart from the vendor rating system the paper will also mention the inventory management
system that was created in order to track the flow and status of inventory. As a part of this
project we devised a nomenclature system for all the inventory items and created an excel
workbook which keeps a record of all the inventory present, daily purchases and issues,
pending orders and helps the purchase department to identify the shortages and address them
in a timely fashion.
Research Methodology
Vendor rating
The main objectives of this paper are to identify all the supplier evaluation criteria that are
considered as of importance by the experts. Based on the literature review of the supplier
selection criteria ten criteria were identified for vendor evaluation and a questionnaire was
prepared.
This form was then distributed to seven experts and they were asked to score the ten criteria,
based on the score three out the ten criteria were eliminated and we were left with seven
criteria in order to rate the vendors.
Further process can be divided into two sections, first section involve carrying out AHP in order
to assign weights to the seven criteria while the second section will involve assigning ranks to
the vendors using TOPSIS.
Inventory management
As a part of this project, an inventory management system was created in order to track the
flow and status of inventory. We devised a nomenclature system for all the inventory items and
created an excel workbook which keeps a record of all the inventory present, daily purchases
and issues, pending orders and helps the purchase department to identify the shortages and
address them in a timely fashion.
For the purpose of nomenclature, the final product was divided into sub‐assemblies and codes
were given to different sub‐assemblies.
78 Page
40. Demand forecasting, Economic Order Quantity and Reorder point
calculation of a hypothetical company producing solar panels
Rishabh Dua, Tanusha Sharma, Kartik Gupta and Puneet Bhatia.
Correct forecasting has become a need for survival in today’s business world. Not only
production unit but correct forecasting is required at every stage of product development. It is
a foundation upon which the all company plan and objectives are built in terms of market and
revenue. Thus forecasting is method to use past experience and estimate the future. It can be
used for sales forecasting, demand forecasting and technology forecasting. Demand forecasting
is a principal tool for production planning. It is an initial phase of production planning in which
quantity of product required in the future is estimated and accordingly the production schedule
and is prepared. There are different methods of demand forecasting namely qualitative and
quantitative methods. To forecast for products for which there is no historical data or products
that are to be newly launched in the market, qualitative technique is used. It uses judgment of
sales and marketing experts, distributors, executives etc who are knowledgeable in this field.
Various methods for qualitative forecasting are Delphi method, survey of sales force and expert
evaluation. While, qualitative techniques give a narrow range of forecasts, quantitative
techniques such as naïve method, moving average method, exponential smoothening method,
linear regression method etc give a single forecast. Moving average method uses the average
value of the actual weights to calculate the forecasts. Although these methods are famous for
their simplicity, they can forecast up to only one period in the future. Thus, exponential
smoothening and regression methods are most common used since they are the most cost
effective statistical tools. In our paper we would be working on these methods to calculate the
forecast for future. Correct forecasting helps save wastage in materials, man hours, machine
idle time etc. which leads to increased efficiency and productivity.
The dataset selected is that of Solar Panel which under general consensus states the rising
demand of solar panels signifies the rising acceptance of using solar energy as a viable
alternative energy source. Solar Panel refers to a panel designed to absorb the sun's rays which
is an ultimate source of energy for generating electricity or heat. The factor that has hampered
the production of solar panels is the high installation and starting cost but as the acceptance of
solar panels rises the cost of setting up solar panels has been seen to be decreasing. From the
past demand curves, as stated by Swanson's law which states that with every doubling of
production of panels, there has been a 20 percent reduction in the cost of panels.
This project aims analyze a data set of demand of solar panels using the language R and carry
79 Page
out exponential smoothing, moving averages and linear regression model to forecast the
demand for solar panels in the subsequent years.
In order to compare the forecasting techniques the errors generated would be studied
signifying the more suited model to predict for that specific dataset.
The sales data set will be derived from the annual report of Trina Solar. Trina Solar’s PV
modules are sold in over 30 countries, bringing clean, reliable solar energy to residential,
commercial, industrial, and utility applications, on‐grid or off‐grid, around the world.
The sales data of a hypothetical company will be calculated assuming the production takes
place in a single plant in each country and capacity of a single PV module (Solar Panel) is 220W.
Using this actual demand, demand forecasts of PV modules will be calculated using moving
average, linear regression and exponential smoothening methods and respective errors will be
calculated. A suitable forecasting method will be selected and the forecasted demand will be
used to calculate Economic Order Quantity of Inventory and reorder point.
The demand forecasts form a key input to the economic appraisal. As such any errors present
within the demand forecasts will undermine the reliability of the economic appraisal.
Moreover, incorrect forecasts could create several problems such as over or under production,
wastage etc, in the organization as forecasting forms a key input to the planning function. While
forecasts are never perfect, they are necessary to prepare for actual demand. In order to
maintain an optimized inventory and effective supply chain, accurate demand forecasts are
imperative. Therefore, in order to select suitable forecasting techniques, error calculation can
be used as an effective method to select the most suitable technique to forecast demand for a
particular sector. The accuracy of the forecast could be measured by comparing the values of
error produced in the following error values, namely, forecast error (FE), Mean Absolute
Deviation (MAD), Mean Absolute Percentage Error (MAPE), Mean Squared Error (MSE) and
Tracking Signal (TS).
Post the demand forecasting phase, the estimated optimal quantity to inventory would be
calculated with a trade‐off between cost of ordering and cost of inventory and finding out the
order quantity such that the total cost of ordering and inventory is minimal. Since the lead time
between the time of ordering and arrival of order would be non‐zero, a lead time would have to
considered, which would dictate the reorder point which would be equal to the product of the
quantity consumed per unit time and the time required by the supplier to supply the quantity.
Also, since the lead times may vary significantly due to irregularities in supply and demand as
well as to make the possibility of stock out minimal, a minimum quantity, called a safety stock,
may be maintained for smooth operation of business operation. The safety stock acts as a
buffer in case where sales are greater than expected.
80 Page
41. Research on Procurement Management of MSE using system dynamics
methodology
Shubham Kakde, Manas Agrawal and Lakshman Suthar.
Purpose:
Purpose of this paper will be to develop of a system dynamics methodology which will result in
knowing of causal relation of all the elements of a company with its procurement system by
understanding the system w.r.t system dynamic methodology. Since the functions of
procurement like requirement planning, tendering, market study, supplier selection, asset
management will have dependency upon each other to some extent, system dynamics study
and model will help us to configure the dependency of each of these element over one other
and also the extent to which one gets affected by change in other. The desired outcome of the
study is to study various procurement cycles which will help in understanding the system
completely resulting in better policy development and implementation.
Methodology:
System Dynamics has been applied from the very beginning, as Forrester’s early publications
show (Forrester 1958, 1961). System dynamic is an approach to understanding the non‐linear
behavior of complex system over time using stocks, flows, internal feedback loops, auxiliary
variable and Time delay. It was develop in 1950’s to help corporate managers to improve their
understanding of industrial process. System dynamic is a method to study the world around us
looking as think as a whole. The objects and people in the system interact through feedback
loop where a change in one variable affects other variables over time which in turn affect the
original variable and so on.
Due to growing demand in market and the cut throat competition, it is very important to
provide the product in market on right time. Now to deliver the product on right time we need
to focus on the process of manufacturing, the breath of manufacturing is the inventory.
Inventory can be of many type like raw material, semi‐finished goods, tools‐equipment and
finished goods. Now to have this all at right time, at right place, of right quality and with right
quantity, Procurement Management play an important role. System dynamic method can be a
powerful tool for developing a general understanding for the underlying problem structures
within procurement management. In this paper we will focus our study in 3 sector of
procurement management as General Procurement, Procurement of Hazardous materials and
Procurement of Food material. Procurement management in general, pointing out relationship
81 Page
among the manufacturers, suppliers, distributors, and other relevant factors of procurement
system through system dynamics theory and method, confirming the causal relationship chart
and the system flowchart of the procurement system and deriving the causes tree of the
procurement system by VensimPLE which is a kind of software for system dynamics simulation.
Relationship management is a systematic project, including not only the enterprises which
contact with purchaser directly, but also other factors such as inventory levels, market
conditions and environment situation. However, the current theoretical results describing
systematically the interaction among the various elements of relationship management are
very few. Therefore, clarifying all kinds of influence factors to relationship management of
manufacturers in procurement activities and the feedback relationship of those influence
factors is necessary to improve procurement performance of manufacturing‐sector companies.
If system dynamics theory is to be used, the boundaries and scope of the system to be
inspected must be determined firstly. The core concept to be discussed of the paper is the
procurement, specifically the procurement to raw materials which are used by manufacturers
for their productions. Its decision also depends upon the market demand, manufacturing
capacity, inventory cost and climatic condition which will be set.
According to the system dynamics theory, the causal relationship among the factors should be
determined after determining the boundary of the system. The reason for manufacturers to
conduct procurement of raw materials is to maintain smooth production flow. This implies that
a system should be self‐adjusting as per the change caused by the factors in the system which
will give a better understanding and effective decisions. Basic factors which are responsible for
procurement management are purchasing, order processing, material handling, market
demand, inventory and capacity. For example for production it required procurement of raw
material through purchasing department and their dependencies on order processing of that
product
After determining the causal relationship chart among the factors of the procurement system,
system Stock and Flow‐chart can be determined according the system causal relationship and
by entering the equation for various variable according to their interdependency. Which will
result in forecasting of various factor which will be interdepended and help us to formulate
better policy by considering effect on whole system
Purchasing Policy applies to and binds all directors, managers and employees of the
organization in any situation where they are involved in a purchasing process, whether as
requisiteness or specifiers, purchasers or negotiators, or those who validate or authorize
payment. ‘Purchasing’ includes all procurement activities including leasing and hiring, and may
82 Page
where appropriate include other activities accompanying the life cycle of goods (or service
contracts) and the end‐of‐life disposal of goods which have been procured (whether or not they
remain in our ownership). It also include consideration of all legality, accountability and
auditability and mainly economic effectiveness, exploitation of development, risk management
and performance target.
Practical Implementation:
Procurement of Hazardous Materials. For this type of procurement purchase orders (PO),
maintain accurate inventory. There should be a responsible company employees as the person
to whom the material is to be shipped. The originator of the purchase order shall ensure that
the responsible person's name is noted on the PO. The procuring department shall enter the
purchase order information to system and print a barcode label for that material to be used
when it is received. When the hazardous material is received, the container, bottle, etc., shall
have the bar code label affixed to the container by the department ordering the hazardous
material. The bar code label must include the expiration date of the material. The material shall
be stored, if not used immediately, in accordance with the manufacturer's MSDS or label
warnings. Another sector of procurement management is procurement of food items.
Companies must ensure that all purchased food items meet the purchased food standards.
These items must then fit in to all meals or snacks served such that these meals and snacks
meet the nutrient requirements. The purchased food standards ensure that agencies are
making healthier choices like low‐fat dairy products a regular part of people’s diets and
ensuring that people who eat a few items of each meal will have healthy options. The meal and
snack standards ensure that people eating whole meals and snacks are eating a healthy,
balanced diet it also ensure the packing is airtight and food is stored in proper condition as
required. Understanding this system using SD methodology will give us better understanding
which will result making good policies and in taking optimal decision according to the policies.
Value:
The paper is unique in the sense that it develops an in‐depth model, which will help the
managers and procurement departments to better understand and predict the future steps at
the time of any change in the system. Also this paper will to plan the procurement process and
the factors associated with it as in time of process, further requirements with help of market
survey and the system.
42. Approaches for combining operational decisions for maintenance and
quality control: A review
Pravin Tambe and Makarand Kulkarni.
83 Page
Purpose – The purpose of this paper is to review the literature on combined decision for
maintenance and quality control. For these integrated models critical observations from the
literature are presented.
Design/methodology/approach – The paper systematically classifies the published literature
using different techniques, and also identifies the considerations in the author approaches
about the integrated modeling and the outcomes from the research. A variety of mathematical
tools and techniques used in the literature are mapped to the main issues considered.
Findings – The paper finds the important issues in the integrated modeling between
maintenance and quality control over a period from 1988 to 2016. The literature is segregated
year wise and author wise. There is an emerging trend towards interest for developing the
combined approaches for these functions. For developing the integrated models, either a
periodic or age based maintenance is combined with quality control using x ̅‐control chart
based on the economic design principle. The objective was to determine the optimal values of
the decision variables (n, h, k, and TPM) that minimize the expected total cost per unit time of
the system. Apart from this, a condition based maintenance is also considered in the recent
years. The integrated approaches have shown significant cost saving as compared to traditional
approach.
Practical implications – A limited literature is available on the classification of integrated
approaches between maintenance and quality control. The paper systematically classifies the
literature on the combined approaches for maintenance optimization along with quality control
parameters. This will give a holistic view of the different considerations for maintenance and
quality control in the integrated modeling. It also outlines the directions for future research in
the area of integrating these functions with other shop floor aspects.
Originality/value – The paper contains a comprehensive listing of publications on the combined
approaches and their classification according to various attributes. The paper will be useful to
researchers, maintenance professionals and others concerned with maintenance and quality
control to understand the importance of maintenance management in combination with the
quality control function.
84 Page
43. Multicommodity Network Design under Congestion
Navneet Vidyarthi, Sachin Jayaswal and Sagnik Das.
Multicommodity Network Design (MND) problems arise in various applications ranging from
telecommunications, transportation, and logistics to production planning. In this paper, we
consider a class of multicommodity capacitated xed‐charge network design (MCFND) problems
under congestion. The model captures four important features of network design applications:
the interplay between investment and operational costs, the multicommodity aspect, the
presence of capacity constraints, and accounts for congestion
on the arcs while routing flows from the source to the destination. The problem seeks to
simultaneously establish capacitated arcs that connect various nodes on the network and route
flows from the origin node to the destination node so as to minimize the sum of the fixed cost
of establishing the capacitated arcs, the transportation cost for every origin‐destination pair as
well as the congestion associated with waiting and service delay on the arcs. Congestion on arcs
is modeled as the ratio of total flow to surplus capacity by viewing the arcs as a single‐server
queuing system with Poisson inter‐arrival rates and exponential service times where congestion
refers to the queuing delays as a result of variability in the arrival times and service delays on
the capacitated arcs. We present a nonlinear integer programming formulation of the model.
Using simple transformation of the nonlinear objective function and piecewise linear
approximation, we present a linear
reformulation of the model. An outer‐approximation algorithm based exact solution approach
is proposed and computational results are presented.
44. Stepping on the Scale: SOLAS’ Container Weight Amendment
Saroj Koul.
Purpose: The rationale of this study is to examine if the 2016 SOLAS amendment will provide a
net benefit for affected parties such as exporters, importers, and national governments. This
report will allow affected parties to familiarize themselves with the standards before they
become legally binding. Since its announcement in 2014, the amendment has been met with
resistance by various groups such as the U.S. Congress, U.S. Coast Guard, and members of the
Russian government; our research also serves to determine whether this resistance is justified
or not.
Approach: This report will begin by explaining the complicated amendment in simple terms;
specifically, the two methodologies to weigh shipped goods and the consequences for those
who do not comply will be discussed in detail. Thereafter, a meta‐analysis of the issue will be
performed; in other words, legal interpretations, scholarly articles and newspaper articles in
85 Page
the public domain will be explored. The meta‐analysis will serve to determine whether the new
standards will be beneficial for three main stakeholders: shippers, port authorities, and national
governing authorities.
Findings: It was determined that all three stakeholders receive an overall benefit from the
implementation of the amendment. This is based on financial, logistical, and safety
considerations.
Practical Applicability: The container weight amendment by SOLAS is a current issue facing the
supply chain industry; parties who ship or receive goods via ocean transport need to be
exceptionally familiar with the new standards. This study will provide stakeholders with a
simplified explanation of exactly what needs to be done to comply with SOLAS’ amendment
and consequences for non‐compliers. Furthermore, the amendment has been met with
opposition by various stakeholders in the United States and Russia; it is hoped that the findings
of this investigation can assist in convincing them that compulsory container weight verification
will be an overall benefit for the shipping industry.
Originality/Value: While articles which discuss the implications of the SOLAS amendment exist,
very few research papers have been published. Consequently, a meta‐analysis of qualitative
research topics will provide substantiating evidence to those affected by the amendment.
45. Benefits & Scope of GPS in Logistics and in Different Works of Life
Arijit Poddar.
The issue of time management is an integral part of today’s life. So most of the thing we do,
we think of doing or is happening in an around us is associated with the factor 'Time'. So real
time data will put us in a better position to be able to assess the optimal time related to the
execution of the concerned work, so that we are in a better position to manage our daily
schedule, work etc and plan the day ahead efficiently. Suppose A has purchased an article from
an e‐tailer say XYZ who will be delivering the item to the buyer’s address. But A lives alone and
has to go to work on the day of delivery. Now the item which is out for delivery can be tracked
through a GPS and real time data is being sent to A every 30 minutes, A would be in a better
position to arrange for someone to receive the item on this behalf and he doesn't have to wait
to receive the delivery nor does A has to miss his office to take the delivery. Suppose one has a
logistics business whose office is located in West Bengal and his trucks are moving in different
parts of India. Now the owner has a lot of questions in his mind such as the following ones.
86 Page
Has his vehicle yet reached the destination?
What is the present location of his vehicle?
The vehicle is delayed. Where is it?
Are the kilometers log accurate?
How to ensure transparency about the vehicles movement?
How to check & prevent unauthorized detours?
How to view the travel route?
Trip Sheets
What is movement pattern of the vehicle?
How to ensure the shortest delivery path?
Is the vehicle over speeding?
So a real time data about the vehicles from the tracking details obtained through GPS
connectivity will enable the owner of the business to have readily available details at any
given time. The GPS connectivity along with the use of different tracking software that are
available in the market, will provide solutions to the owner’s queries , provide him with better
data which would help him optimize business decisions and also will help him provide his
clients transparent details. The GPS facility also helps in knowing when and where the vehicle is
taking breaks and if the vehicle is following the correct and shortest route. The data obtained
through GPS attached in the vehicle will help improve the followings:
Operational Optimization
Curb unauthorized halts
Enforce safety norms
Real time and updated information’s to customers
Over speeding alerts
Android APP for anytime anywhere tracking
Route adherence
Schedule adherence
Temperature Report
Door opening
Accurate monitoring of hold period at point of delivery
Logging of kilometers for accurate billing
Improved vehicle utilization due to faster turn‐around
More trips per vehicle per year
Higher revenue
Reduced cost
Happier end customers which will result in loyal customers
Enhanced safety of Man & Materials
Immobilize vehicle remotely through sms in case of any emergency
87 Page
Similarly in another situation, suppose a Ready Mix Concrete vehicle is out for delivery with
Ready Mix Concrete, now the client waiting at the construction site has done the necessary
so that casting can be done once the concrete reaches the work site. At the last moment
some technical glitches arise which need to be addressed keeping in mind that the Ready
Mix Concrete can't be kept in the vehicle for long. If the operation manager at the work site
has access to the real time location of the Ready Mix Concrete vehicle he or she would be in
a better position to take decision such as how much manpower should be employed for the
rectification work without disturbing the other works which are in progress. There are many
other vehicles which might be in use in the construction on a rental basis, movement of such
vehicles can been monitored in real time which will help the company generate work hours
from the vehicles they have rented by utilizing the real data from the GPS connected in the
vehicle. Once technology like this is easily available in the market and more people are aware
of facilities like these it will help different types of industries such as the Hotel Industry to keep
a track o the Guest moving in the hotel cars for safety reasons, the local vendors can also get
the benefit of this technology as they can track the vehicles carrying their orders from the place
it has been dispatched and so, if proper data is provided in real time to the vendors they
can utilize their daily time in a much better way. Manufacturing industries can track their
goods which are being transported daily to their customers. This will help develop
customer relationships as they are always connected with shipments that are being transported
to them.
46. Interdependence among dimensions of Sustainable Supply Chain:
evidence from Indian leather industry
Sandeep Kumar Gupta and Uday S. Racherla
Purpose: The Indian Leather industry has been passing through turbulent time due to its environmental compliance requirements. To assist the industry in coping up these challenges, it is vital to understand the relationships among the three dimensions of sustainability i.e. economic, social and environmental performance in a leather value chain. Though, many researchers have tested and recognized the relationship with theoretical as well as empirical basis for various industry but not for leather industry. The results have been mixed, as such, there is no consensus among their findings. Therefore, to assess interdependence or influence of one on another i.e. among economic, social and environmental performance, this study focuses on leading states of Indian leather Industry.
Design/methodology/approach: This study followed exploratory research where Partial Least Square (PLS) based Structural Equation Modelling (SEM) has been used to explore the relationship among the dimensions of sustainability in leather supply chain. The states has been selected based on judgmental sampling. The study used unit level data for the leading states of
88 Page
Indian leather Industry namely, Tamil Nadu (TN), West Bengal (WB) and Uttar Pradesh (UP). The study has used Annual Survey of Industry (ASI) data from 2007‐08 to 2011‐12. The proposed hypotheses have been tested using WarpPLS 5.0 software. For performance assessment purpose, a framework has been developed based on theoretical constructs, namely ‐ economic, social and environmental performances – which were weighted averages of indicator values (Fig. 2). These indicators were in turn based on literature precedence, recommendations by industry experts, correlation analysis and available data.
Findings: The descriptive analysis revealed that UP has performed better in social and environmental performance, whereas, TN has shown leadership in economic performance. This could be attributed to higher export margin and superior technological advancement of TN. The worst performance of WB may be assigned to its less incentive and low motivation for pollution preventive measures, and strong hold of labour union.
The structural equation analysis of unit‐wise leather industry data supports significantly bi‐directional negative relationship between social performance and economic performance among all the selected states. In contrast, the relationship between economic performance and environmental performance, as expected and supported by many existing theories, has shown bidirectional positive relationship. However, the relationship between social and environmental performance has shown quite mysterious and mixed trends. TN has depicted significantly negative coefficients which could be attributed to higher pressure for environmental compliance which might have led to trade‐off between the two to gain cost competitiveness.
Research limitations: Unfortunately, due to unavailability of data, many critical indicators were dropped from the theoretical framework of sustainability measurement. These are – Percent Child Labor (PCL), Differences in Remuneration (DIR) between men and women, Percent Community Welfare Expense (PCWE), Effluent Treatment Index (ETI), Solid Waste Disposal Index (SWDI), and Emission Index (EmI).
Practical implications: The outcome of the study could be used to help policy makers and industry owners to map and to take appropriate preventive or corrective steps in terms of selecting and supporting various social and environmental interventions which are having positive influence on economic sustainability of leather industry.
Social implications: The leather industry in India, specifically in the selected states, has been extending employment opportunities to thousands of men and women. However, the industry is also found responsible for water pollution and various health hazards in the areas of close vicinity. Therefore, it is essential to understand the interdependence among sustainability dimensions and optimize the trade‐off.
Originality/value: the sustainability framework proposed in this work is an original contribution of authors to the existing literature. Moreover, this study on the Indian leather industry fills the gap and resolve the mystery of interdependence among the three dimensions of sustainability.
Keywords: Sustainability; Indian Leather Industry; Structural Equation Modelling.
89 Page
47. Integrating SME’s of Indian Switchgear and Transformer Industry using
Lean Supply Chain Management Practices
Mrunalini Dodkey
Purpose: The growth of any nation is primarily decided by available infrastructure and the
vision it has to move to the next level as a part of larger economy. The four pillar of
Infrastructure includes modes of communication, transportation, industrial setups and power
capability. This makes it very important to have strategic view of all these four areas at national
level. As per 12th plan released by Planning Commission of India, energy use in India will
increase by 10% till 2031 as compared to what it is today. The emphasis is on providing energy
to rural India with focus on increasing supply side potential by augmenting generation capacity,
expansion of transmission system and capacity, strengthening of distribution system, improving
access to energy, development of renewable energy. Purpose of the research is to study the
supply chain management of electrical industry especially switchgear and transformers and the
role of SME’s in strengthening the supply chain. Unlike the automotive industry and other
repetitive type of industry where most of the activities relates to procurement, manufacturing
and distribution, in electrical industry, engineering is time consuming activity which decides the
lead time of the product to the market. Joint ventures, technical collaboration, value chain
partnering, green channel vendors are some of the models that are adopted in electrical
industry. Many of the OEM’s have outsourced technology to SME’s in form of ancillary units
and have become lean in the process. The role of SME’s in this area is very important since
SME’s are technically very sound and have the niche in value chain.
Design/Methodology: Secondary data through literature review and primary data through
Questionnaire Survey will be used to explore the supply chain management practices in upward
supply chain and study SME’s constraints to move towards lean supply chain management.
Findings: PCA identified 6 factors namely: Industry Type, Demand Variability, Product
Segmentation, Use of Lean Tools, Information Integration, and Size of the Organization as
deciding factors for implementation of lean supply chain management practices.
Research Limitations/Implications: The SME’s from only Maharashtra region were contacted
for data collection purposes.
Practical Implications: Lean supply chain processes across the organization will speed up the
entire value chain. Information Integration throughout the supply chain shall improve overall
supply chain efficiency. Formation of switchgear and transformer cluster will enable the SME’s
to respond to dynamic changes in the demand variability.
90 Page
Social Implications: None
Originality value: Enabling of information integration through frugal solutions across the value
chain shall make product movement transparent right from source up to the customer and shall
help in better delivery commitments, reduced lead time, reduced inventory at different
decoupling points and hence reduced wastages.
Keywords: SME’s, Switchgear and Transformer, Lean Supply Chain Management
48. Supplier Selection Using Combined SWARA and WASPAS – A Case study
of Indian Cement Industry
Rohit Singh, Jitendra Vishnolia, Jigar Gajjar and Anand Singh.
The focus of this research is projected on the dynamic relationship of two closed entities buyer
and supplier who are backbone of supply chain management (SCM).Aim of the paper relate
implementation of supplier management practices which creates culture of benchmarking of
these absolute quality management practices. The aim is to recognize and establish
relationships between supplier’s management by buyer and its relation with buyer’s quality
management. As for any company design of supply chain has a motto of supply chain surplus,
an obvious approach is to explore within the box rather than thinking outside the box. Some
companies have already established as a practice, and this trend will increase with time. Supply
bases are full of deep pockets of knowledge within them which can be very fruitful. Generally
multi factor method should be considered in the decision making method of research. Hence, a
robust model should be considered for such study cases. Moreover, the forethought outlook is
necessary for the future competing of the project. “Stepwise Weight Assessment Ratio Analysis
(SWARA)” is used for decision making process in order to prioritize and calculate the relative
importance of the criteria. Further, Weighted Aggregated Sum Product Assessment (WASPAS)
methodology is applied to evaluate potential alternatives.
49. Extending Green Practices in Supply Chain Management
Sonal Surabhi, Suman Sowrabh, Aditya Dubey, Yashomandira Kharde, Rohit Singh.
The aim of the paper is to understand green supply chain, and with the help of that, to
understand problematic areas and methodologies adopted to develop an understanding of
alignment of processes towards a greener environment. We have proceeded with our research
with certain key parameters like supply chain’s incoming logistics, production, outbound
logistics and reverse logistics. The supply chain metrics that we have measured include order to
91 Page
delivery lead time and supply chain response time. We have initiated our research with the help
of descriptive analysis of the data by floating a questionnaire for capturing data from various
Manufacturing companies in and around Nasik.
The questionnaire has helped us gain real time information of the factors and its effect on
supply chain. The sample has been taken from top and middle level managers of supply chain
industry. After data collection, Hypothesis generation has been done in line with dependence of
the factors on the supply chain metrics. Further, the methodology used is Reliability Test, Factor
analysis of data which has helped us to find impact and relationship of the factors with the
supply chain measures: lead time and response time.
50. Lean Production Supply Chain Management as Driver towards Enhancing
Product Quality and Business Performance
Sunil Das, Arun Koonammave, Prasanjit Biswal.
The main purpose of this study is to see how lean production, a key component of an efficient
supply chain management aims for continuous elimination of waste in all production process
thus achieving lower production costs, reducing the lead time and increase in output thereby
acting as a driver towards enhancing product quality and business performance. Lean
production thus, enables companies to attain good process management and better
documentation as it focuses on improving the operational efficiency, improving efficiency of
material flow, better supplier bond, simplified scheduling, increasing manufacturing flexibility
and hence increasing the overall product quality. Lean production strategy has found its
application in many sectors like electronics and automobile manufacturing industries whose
foremost priority is to reduce the production cycle time. One more aspect of lean management
is to reduce the uncertainties regarding demand, manufacturing and supplier. Manufacturing
uncertainties include product quality characteristic, downtime, worker’s absenteeism and
operator skill levels. Lean Supply Chain Management aims to reduce the various variations by
establishing standard work procedures.
The authors have taken the case of a company ABC Ltd. where there was either an inventory of
finished goods/ raw material piled up in the plant and or at times a shortage of raw materials
because of variable nature of demand from client. The authors have then tried to find out how
to go for effective production planning so that the inventory of finished goods/ raw materials
can be managed? The objective is to reduce the lead time across supply chain.
There are different methods of lean transformation. In this paper an enhanced Feld model has
been proposed by addition of a new phase “FUTURE STATE VERIFICATION AND VALIDATION”
after the “FUTURE STATE DESIGN” phase in order to ensure that it correctly addresses current
state gap. Measures have been proposed about to reduce lead time for parts procured from
92 Page
abroad and also from local suppliers. Finally it has been proposed to adopt a combination of
Lean and Agile (Leagile) supply chain strategy with additional recommendations of Enterprise
resource planning (ERP) and Collaborative Planning Forecasting & Replenishment (CPFR)
method to improve overall operations and customer services.
51. Lean Supply Chain in Manufacturing Unit using Value Stream Mapping.
Ashish Yadav, Ashwini Awale, Md. Zoheb Mehraj
Lean a series of activities or solutions to eliminate waste, reduce non‐value added (NVA)
operations, and improve the value added (VA). This VA and NVA concept were derived mainly
from Toyota Production System. Lean is a combination of 5S, SMED, Kanban, and JIT. There are
basically eight type of waste highlighted in TPS like: overproduction, waiting, conveyance, over
processing, excess inventory, movement, defects, unused employee creativity and Over‐
production (biggest failure).
Value Stream Mapping (VSM): It is a tool/ lean method to analyze the Current State and design
a Future State for the series of events that take a service or product from its beginning to finally
to the customer. Imagining Value Stream as a Waterfall will help to understand the concept
with clarity. In Value Stream, “all the steps, both value adding and non‐value adding required to
take a product or service from raw material to the waiting arms of the customer”. Value Stream
Mapping is mainly about reducing the Muda. Muda consumes enormous amount of time. On
the contrary, the value added time or the time the customers want to pay for is very small.
Often the company focus on the VA portion of the lead time. For instance, they want to make
VA twice as fast. They work to save a few seconds or minutes of machine or operate cycle time
in order to reduce the overall‐lead time. VSM Most important lean tool as it is, it behaves like a
visual tool which helps in documenting all the activities required to receive and fulfill a request
from our customer. It helps people see what is actually happening in a process through direct
observations. One has to closely monitor the process and collect actual data. Through this study
we try to find out the different aspect of VSM and how it can be useful in decreasing the
Manufacturing lead time
52. Supply chain performance measurement framework for small and
medium scale enterprises
Akansha Rammaiya.
An effective supply chain system is required for lowering of distribution and inventory costs
and increase operational efficiency by providing better medium for information sharing
93 Page
between all the links involved in the supply chain, improving process integration, providing
efficient manufacturing strategy along with improving financial aspects like cash flow to
collaboratively result in value addition to the customer culminating in higher profit margins. To
connection for those processing industry, the worth propositions from claiming supply chain
administration incorporate network differentiation also market division where the focus is to
distinguish as a chain to meet those progressive what's more particular requests of customers,
integrated quality where the target includes meeting the expanding requests from clients and
network optimization a process where the target is to minimize those expenses through a
streamlined chain hosting coherent information supply.
The extent of realization of above mentioned objectives and benefits can be measured by using
output of the Supply chain. This is because the performance measurement of supply chain
provides important feedback information which enables decision makers to monitor
performance, reveal progress, enhance communication and motivation and diagnose problems.
It is also used to reveal effectiveness of strategies and identification of potential opportunities.
Specific key performance indicators are used depending upon the objectives of the supply
chain. It is very critical to choose the right kind of performance measures and performance
measurement system in the supply chain. Some of the difficulties in determining a performance
measurement system include lack of connection with the strategy, an unbalanced approach,
low focus on competition as wells as customers, localized optimization due to lack of systematic
approach etc. Literature shows seven different types of supply chain performance management
systems exist. These are Function based measurement system, Dimension based measurement
system, Supply chain operations, reference model, Supply chain balanced scorecard,
Hierarchical based measurement system, Interface based measurement system and Perspective
based measurement system.
Performance measurement systems succeed when the organization’s strategy and performance
measures are in alignment and when senior managers convey the organization’s mission,
vision, values and strategic direction to employees and external stakeholders. The performance
measures helps to contribute to the success of the company and its stakeholders’ measurable
expectations. Both Balance Scorecard approach (BSC) and Supply Chain Operation Reference
(SCOR) model have been considered.
Execution estimation frameworks succeed when the association's methodology and execution
measures are in arrangement and when senior managers pass on the association's main goal,
vision, values and vital heading to workers and outside partners. The performance measures
adds to the achievement of the organization and its partners' quantifiable expectations. Both
Balance Scorecard approach (BSC) and Supply Chain Operation Reference (SCOR) model have
been considered.
94 Page
53. Lean assessment parameters and roadblocks in implementation of Lean
Management in Indian Auto component Industry: A combined AHP &
MICMAC approach
Akshay Kumar, Rohit Singh, Tanmay Borulkar and Partha Paramanik.
Purpose ‐ The aim of this paper is the prioritization of roadblocks in the implementation of lean
management in Indian Auto component industry based on the industry inputs and the
development of an interpretative structural model to establish the relationship between these
variables. The MICMAC analysis is carried out and the driving as well as the driven power of the
roadblocks are established further. The cause – effect relationships between the popular 7
wastes associated with Lean management and the roadblocks is investigated and the
relationship between ISM hierarchical levels and the Lean wastes found out. Finally, the impact
of the domino effect created by tackling the bottom – up ISM hierarchical structure of
roadblocks is seen upon Leanness assessment parameters with respect to various wastes.
Methodology – 14 Roadblocks in implementation of Lean management in Indian Auto
component industry have been identified via industry visits and by interacting with the industry
experts combined with extensive review of the literature available on Lean Management.
Further, a questionnaire based study has been carried out and the responses of the candidates.
The identification of the variables affecting the smooth execution of lean set ‐ up in the vehicle
sector in India is followed by prioritizing them with a powerful pair wise comparison analysis
using the AHP technique along with the calculation of Consistency Ratios. The statistical Mode
has been calculated for registering a response of a question answered by several respondents
from the concerned industry. ISM methodology is further used to identify interrelationships
among specific roadblocks, which are prevalent in the Indian automobile industry. MICMAC
analysis of developed ISM model is subsequently carried out in order to understand the driving
power and dependence of the roadblocks. A cause – effect analysis is used to establish the
relationship between the popular 7 wastes associated with Lean management and the
roadblocks arranged into hierarchical levels using the ISM methodology. Finally, the impact of
the domino effect thus created by tackling the roadblocks in the hierarchical order of the ISM
model is seen on Leanness assessment parameters with respect to various wastes.
Findings – This paper contains an argument to prioritize using AHP technique the Roadblocks in
implementation of Lean management in Indian Auto component industry identified via industry
inputs and literature review. A description of interrelationships developed using the ISM
approach has been described. The same has been cross – verified by using the MICMAC
approach that also surfaces out some of the latent variables, which can possibly be misjudged
95 Page
by the ISM model. The relationship investigated between the roadblocks and popular wastes in
Lean implementation is used to measure the impact of dealing with the roadblocks in bottom –
up hierarchy of ISM model upon the Leanness assessment parameters with respect to various
wastes.
Practical Implications – The identification and prioritization of the various occurring roadblocks
in the Indian Auto component Industry and identification of the various interrelationships
among specific roadblocks along with understanding the driving power and dependence of the
roadblocks will enable managers to use this intel for waste reduction along with the use of a
powerful pair wise comparison analysis using the AHP technique to focus on areas of
improvement. Consistency ratio values are obtained and used to accept or revise the subjective
judgment of the industry experts who answered the questionnaire used in data collection. The
managers will also have knowledge of interrelationships among the popular 7 wastes of Lean
management they are familiar with and the latent roadblocks that govern them in the industrial
scenario along with the impact of tackling the roadblocks in the ISM hierarchical domino
structure on the Leanness assessment parameters (with respect to the various wastes). This is
necessary especially for the Indian market considering the importance of resource constraints,
time and cost effectiveness to survive in this highly competitive scenario.
54. Benefits, Challenges and Bridges to Effective Supply Chain Management.
Pooja Shah
Purpose – Purpose of this paper is to analyze and come up with the benefits, barriers and
bridges to effective supply chain management and study the innovative methods used by two
of the leading organizations on how to counter the challenges faced by their supply chain.
Design/Methodology/Approach – The paper uses a pragmatic approach where previous
research is used to identify the major barriers for the supply chain and two cases of leading
firms are discussed to realize what the barriers in those firms are.
Findings – Major barriers to supply chain of the two firms were high demand fluctuations
because of varied product profiles and the lack of proper integration amongst the supply chain
elements. Customer satisfaction and on time delivery is being ensured by organizations by
overcoming various supply chain barriers such as coordination between various supply chain
partners by incorporating a flexible supply chain design and by use of improved technology and
communication systems to achieve the benefits of reduced cost and sustainability.
Research Limitations/Implications – The findings and analysis are based on firms in the specific
sector. There might be other possible benefits, barriers and bridges while considering other
sectors that have not been discussed in this paper.
96 Page
Practical implications – This study provides deep insights into the various problems faced by
the firms to effectively manage supply chain related challenges. Successful implementation of
right supply chain model proves to have provided the desired benefits in terms of cost,
sustainability and improved efficiency.
55. Prioritization of Antecedents for the Adoption and Execution of Supply
Chain Management using TOPSIS
Shreyash Bansal, Paras Bharel, Prahar Dongre
Purpose: The supply chain that we presently see has come a long way from what it used to be
traditionally. This evolution in the field of supply chain management can be attributed to
various antecedents that have shaped its development in past few decades. We have seen
many concepts like lean supply chain, JIT, agile supply chain, etc. and the latest being supply
chain flexibility, which have added new dimensions to the traditional supply chain. Thus, the
purpose of this study is to prioritize the Antecedents for the Adoption and Execution of Supply
Chain Management (extracted from literature) using TOPSIS Methodology in Indian FMCG
industry.
Approach: Authors have visited case firm to have an idea of issues related to their supply chain.
To carry out this study authors have done extensive literature review and extracted
antecedents most suited for Indian FMCG firm, accordingly designed the self‐administered
questionnaire and floated it among executives of case industry. The feedback authors received
in terms of filled up questionnaire become the input of data analytics using TOPSIS, and finally
designed the structured hierarchy of supply chain antecedents.
56. Digital Retail: A Sustainable Opportunity Yashomandira Kharde, Prasad Madan, Sonal Surabhi, Pravin Kharde
Purpose‐ The purpose of this paper is to understand that giving consumers what they want is
an easy win, but it is afflicted with sustainability challenges. Actual achievement lies in
motivating consumers to want what best not only for them; but for all of us‐ profit craving
people and planet.
Methodology‐ In this study the authors have extracted information from systematic literature
review (SLR) identify the variables or factors from extant literature and have used confirmatory
factor analysis approach to derive the conclusion.
97 Page
Findings‐ The findings mainly indicate that today time is equivalent to money. SLR output
suggests that we will see not just more online shopping, but a blurring of the physical and
online experience, with shoppers at home able to visit virtual outlets and in‐store shoppers able
to access a cloud of information about products and at the same time the consumer experience
will be more tailored, more continuous and more omnipresent.
Research limitations/ implications‐ Like any study, this study has its own limitations. In this
study, the authors have developed a model based on expert opinion. Though the number may
not be enough to validate the model statistically, nevertheless, it can be considered as a
platform for further research study.
Keywords‐ Digital, Retail, Sustainability
57. A Comparative Study on Automation Feasibility across Two Tools and
Report Benefit Assessment
Ayona Chakraborty
Infrastructure services offers a comprehensive portfolio of services to the clients that
completely maps the entire landscape of IT infrastructure advisory, design, implementation and
ongoing management to serve as true end to end capability partner focused entirely focused on
business outcomes. The result is an infrastructure solution which is efficient, scalable and
secure, that strikes a balance between flexibility and cost while facilitating innovation and
future business planning. The main objective is to help ensure that an IT service provider
company’s infrastructure operations runs as smoothly and reliably as possible. Robust
integrated operations are going to be built to the best practices of the IT infrastructure library
(ITIL), incorporating proven technology solutions and are augmented by specialist technical
expertise. The IT company of the study is known to provide its world class infrastructure
services by managing and optimizing its IT infrastructure to deliver true value by reducing
capital expenditure, reducing operational expenditure, integrating quality services, embedding
environmental considerations, the end results of which is higher productivity and end user
satisfaction. The company of study has achieved remarkable progress in streamlining IT
operations and providing support to customers across the globe. For ex‐ They successfully
helped reduce operational costs for manufacturing company Hochtief by increasing IT process
efficiency and providing value through economies of scale. Aided with a global team of 10,000
technical experts in all aspects of infrastructure, the company is now capable of implementing
multi source service integration to facilitate the standardization of infrastructure processes and
to maximize the value of services delivered by IT suppliers. It is also capable of providing
effective outsourcing services and service management capabilities across all infrastructure
98 Page
disciplines and legacy systems. Infrastructure services are now integrating the benefits of cloud
to business through the incorporation of a dedicated or multi‐tenant cloud services sourced
from public and private providers, including other associated cost effective infrastructure
services.
Whether or not businesses are outsourcing IT functions, it is vital for infrastructure and
application IT platforms are properly managed. The company’s service management team
ensures that the IT services provided are effective, efficient and aligned to the business
objectives. Today’s multi source environment evolved to be complex and global in bid to
improve the service delivery, cost effectiveness and efficiency but for achieving those grounds,
effectively managed services are essential. Service management in its current capacity holds
some of the most important projects associated to its services. In current situation
mutualisation and automation in the company are the two current projects of centre bed in the
SMG functions. Service management’s commitment towards cost benefit is not only associated
to the resources and processes it streamlines but also the placement of resources, technical
experts across the functional and technical domains. Service management endeavors to
streamline all processes associated to the IT services provided. With this thought in mind. The
Servicer management has been looking to automate the process of report making for faster and
efficient report making process.
Before we go deeper into the concept of automation, an understanding of the entire
automation initiative driven within the IT Company is important. The automation landscape
basically encompasses three streams Report, Process and Smart Utilities. Report automation is
the current drive within SMG today, where they are looking to automate 64 accounts into the
automation drive. Process automation mainly deals with streamlining the value process based
on its maturity by making an effectiveness and efficiency matrix and smart utilities help to
automate basic functions within excel like auto collate, for speeding up basic processes.
For developing an understanding of the process followed in reporting automation i.e. the first
stream of automation. We must first develop an understanding of the reporting process
followed by the reporting team. Essentially when there is a disruption on the flow of the
services provided by the service provider, the user/client raises an incident or a ticket. This
ticket is first reported as an incident and in response to this ticket a change process is initiated
after which an implementation ends the life cycle of the ticket. Repeated incidents are termed
as a problem and require a separate course of actions. So these four pillars of the ITIL
framework: incidents, problem, change and implementation information is picked up from the
remedy data base which is the ITSM platform used by the concerned IT company. This
information is also called the ITSM ROD data. This information is picked up from the ITSM
database and then collated into a report using various excel tools like Pivot tables, charts etc.
99 Page
Based on this various reports are made Service level agreement reports, breach reports and Key
Performance Indicator reports which are populated into a common dashboard and is available
for view for all the direct t stakeholders. Here the direct stakeholders are the clients, Senior
Management and Domain level managers.
Report automation is primarily done by two tools centrally in service management purview.
These are ITBM and Qlikview. ITBM as a tool has the ability to induct 33 of the 64 accounts bulk
of the accounts under the service management purview. The process followed by ITBM starts
with picking up information from ITSM ROD and then with constant dialoguing with the SMG
team, the ITBM dashboard is built using the reports data and the business logic behind
identifying the Key Performance Indicators are applied.
The main aim of this study is to streamline the processes to increase the efforts saving and this
objective can be met by identifying which tool in current capacity can meet the operational
requirements of the service management. Also since the ulterior motive is to induct as many
accounts of the IT Company in question into the automation program, the main aim of study is
to find a way to accommodate the two tools into the automation program. This project will
have tremendous cost benefits associated to faster and effective functions in the organization.
Now the end goal of this study is to satisfy the customers and maintain the quality of the
services provided.
58. New product development through quality function deployment
Preeti Shri Agrahari, Takshil Nagar
The aim of this paper is to explore the application of Quality Function Deployment in the mobile
phone industry. In today's world, the whole society is going tech savvy and what is more
technological in common man's life other than mobile phones. As a result the whole mobile
industry is growing rapidly and with more growth comes more challenges. Challenges to
compete, grow and sustain in the market.
As a research product, we have taken to upgrade outdated software and design of a smart
phone as per customer expectations to improve product life cycle and market share. Internal
processes and practices were not enough for the business so we decided to work on product
development through QFD as it helps in continuous improvement.
To achieve the mentioned goal we have used Quality function deployment methodology in
which we tried to map the voice of customers to voice of engineers. It works on triage
technique, therefore focuses on the higher priority requirements which saves time and effort.
100 Page
QFD is used for understanding the customer's needs and it also helps business to stay ahead in
the game.
It is strongly believed that mobile service design cost and design time will be significantly
reduced while mobile service quality will be greatly improved by using QFD approach due to its
systematic linking of customer requirements into and throughout the entire design,
development, and implementation process.
According to Dr. Yoji Akao who actually developed QFD in 1966, Quality function deployment
(QFD) is a “Method to transform user demands into design quality, to deploy the functions
forming quality, and to deploy methods for achieving the design quality into subsystems and
component parts, and ultimately to specific elements of the manufacturing process.”
“A process of determining the customer needs (the whats) and transforming them into target
attributes (the hows) thus converting the ‘whats’ into hows’.”
59. Interpretive Structural Modeling of Supply Chain Risks in a
Manufacturing Firm
M. Parthasarathi, Ravina Gautam, Kunal Pawar
Purpose: Manufacturing sector is an ever growing sector with a wide range of suppliers. The
supply chain of a manufacturing company is one its most critical part. The supply chain has a
huge role in many aspects of a manufacturing firm such as price of the product, lead time,
profits, quality etc. The supply chain has become a very complex structure due to a large
number of suppliers, service providers and customers. This complexity also has several types of
risks associated to it. Understanding and analyzing these risks has become an important aspect
in the manufacturing sector. Identification of supply chain risks is the first step towards
managing the risk. But the most important part is to devise an appropriate method that would
identify the most critical risk among all the risks and take the necessary action to avoid any
severe impact caused due to that risk. This will save a lot of time and money for any
manufacturing company.
One such method is the Interpretive Structural Modeling which is used for identifying
relationships among specific items. There may be many issues related to a complex problem.
But to understand these issues more accurately, it is important to clearly understand the
relationship between them. This helps in simplifying the problem to some extent.
Methodology: The approach starts with identifying many supply chain risks associated to a
manufacturing sector. The risks are identified and are placed in two categories – Internal Risks
101 Page
and External Risks. Internal Risks are the risks that exist within the organization and external
risks are the risks that arise from the events taking place out of the organization. Once the risks
are identified, a relevant relation will be chosen between all the risks.
A Structural Self Interaction Matrix (SSIM) is developed based on pairwise comparison of risks.
The matrix is then checked for transitivity. The SSIM is then converted into a Reachability
Matrix. The obtained matrix is then partitioned into different levels. The reachability matrix is
then converted into conical form. A digraph is drawn based on the relationship given in the
reachability matrix. The resultant digraph is then converted into an ISM model by replacing
nodes with statements.
Findings: This paper will help in analyzing the different supply chain risks associated with the
manufacturing sector and will also help in rating them based on their severity. This way the
most severe risk can be identified and can be avoided by taking some necessary actions.
Research Limitations: This paper does not include all the supply chain risks associated with the
manufacturing sector but only some important risks. The impact of other risks that are not
included in this paper will remain unexplored.
Keywords: Interpretive Structural Modeling, supply chain, structural self‐interaction matrix,
reachability matrix, transitivity matrix.
60. Evaluation of Supplier(s) for an Automobile Firm.
Moumita Saha, Vivek Alamadi, Aditya Bapat and Sudhanshu Pandey.
This paper is intended to put fixate on identifying critical parameters required to evaluate the
performance of the Automobile Industry. In this paper we will quantify the different
performance parameters on the substructure of which congruous evaluation of suppliers would
be done.
Methodology ‐ Performance quantification parameters of Automobile Industry have been
identified via plant visits and by interacting with the subsisting suppliers cumulated with the
extensive review of the literature available on Supplier Evaluation Parameters. TOPSIS analysis
is rigorously used to strengthen the relative judgment of the Automobile Industry stalwarts
whose responses have been collected with the help of questionnaire.
Finding‐ This paper contains an argument of using confirmatory TOPSIS analysis to reinforce the
subjective judgment of industry experts who answered the questionnaire regarding Evaluation
of Suppliers that was used for data collection.
102 Page
Practical Implications ‐ The identification of measures of performance of the evaluation of
suppliers is of extreme consequentiality for the present Automobile industry in India
considering the limitations of resource constraints, time and cost efficacy to survive in this
highly competitive scenario.
Limitations – The results thus obtained are strictly applicable to the Speedosteer Company.
However, these findings may or may not be applicable for some another industry. As every
company has different area of operations and respective supplier evaluation criterion is a
subjective matter to study.
61. A case on Business Process management.
Shrikant Shinde
ABC Ltd is one of the leading stock exchange in the India. ABC Ltd became the first exchange in
the country to provide a modern, fully automated screen‐based electronic trading system
which offered easy trading facility to the investors across all over the globe.
Key products offered by the ABC Ltd are Equities, Indices, Mutual funds, Equity Derivatives,
Currency Derivatives, Corporate bonds.
There are over 1000+ processes in the ABC Ltd across various departments. There is no
structured process classification in the organization. The processes for individual departments
are there at the local repository but not at the central repository. Also the levels defined by
each department are different. So there is no common language across organization for the
process classification. These impacts on the understanding of processes at organization level
and also the inter‐departmental linkage are difficult to understand. Also the knowledge transfer
to the new employees is difficult. Because going through each process without having the Life
cycle view of the process makes it difficult to understand.
The major problems across organization can be classified as below:
Content Management: The content management includes collection, management and
publishing of the information in any form or medium. ABC Ltd observed that due to
inconsistent internal language to describe the work done within the organization makes the
content management difficult. Also the organization of enterprise content, process flows and
models is difficult.
Benchmarking: The lack of structured process classification makes it difficult to compare the
tasks. Developing a common language takes a large portion of organizations time. Also the lack
of process framework makes it difficult to study the internal and external processes and
103 Page
practices of the organization. This makes the benchmarking difficult not only within the
organization but also between organizations. The performance management and process
measurement between organizations is difficult to implement.
Business process definition: The cross functional processes are missing. There is no way to
identify and create the missing cross functional processes.
ABC Ltd needs to improve its corporate performance by managing and optimizing its business
processes. It needs to map its processes in a Framework which will help in classifying the
processes according to global standards which will further enable Benchmarking, Content
Management and Business Process definition. But mapping all the processes of the organization
in a framework is a time consuming and complicated task. Hence ABC Ltd is looking for a
framework which is already existing and accepted across the industry and will offer easy
process mapping and classification.
62. Overall Equipment Effectiveness (OEE) to increase productivity of work
centre.
Shiladitya Adhikary, Arijit Roy, Bir Pratap Singh, Sourav Ghosh
Purpose: Overall equipment effectiveness (OEE) is a highly effective business performance
management tool, which critically evaluates how effectively a manufacturing operation is
utilized? It provides a quantitative approach on parameters such as availability, performance
and quality for measuring the efficiency of individual equipment or entire work centre. Besides
these parameters, there are certain performance factors such as the efficient use of raw
materials and the production conditions e.g. production system, logistics, skilled labour, etc. in
which the equipment or the process is exposed has a significant role to play in the overall
process performance. The purpose of this paper is to present an alternative solution to
implement OEE in work centre to increase productivity.
Design/methodology/approach: This paper reviews the scope of OEE to be implemented on an
individual machine or entire work centre to increase the productivity and yield. In a seamless
tube plant, overall equipment effectiveness (OEE) is being monitored on the mother machine
(hot rolling mill) which produces the seamless tubes. The total operations of the mill are being
recorded minute by minute. The data generated is being analyzed for productive time and
unproductive time, breakdown time, utilization%, productivity% and availability.
The crane productivity report generated has parameters such as available hours, working
hours, idle hours, Breakdown hours. Total no. of lifts, holding hours and utilization. After
implementation of OEE, the efficiency of the cranes will be heightened.
104 Page
Originality/value: This paper presents a novel and alterative approach to measure the
performance of manufacturing and construction equipment and processes. The OEE is to be
implemented to decrease breakdown time and streamline TPM.
Findings: Before implementation of OEE, there was a substantial gap between equipment
capacity & actual output. Workers & managers were not able to come to a reason for low
outputs & quality issues, hence increased production cost, high downtime & breakdowns,
defects in products. The focus area was not clear & that’s why these problems couldn’t be
attacked. Management was not able to take decisions regarding the future course of actions
due to low output & increased production cost. The per second value of running the mill was Rs
100 as per management.
As the first step of OEE implementation, we came up with a plan to monitor each minute’s
performance of the machine with help of a software & a spreadsheet (format attached). Every
minute was accounted for in a shift & reasons for problems were noted down so as to take the
necessary actions to avoid such problems in future. Furthermore, the responsibility of problems
were divided into 5 sections involved in running the machine.
At the end of the shift, there were brain Storming Sessions in which key people from Quality
Assurance, Mechanical Maintenance, Electrical Maintenance, Operations, & Tooling sit down
together & discuss together on CAPA for last day's stoppages, breakdowns & come up with
action plans to eradicate/ reduce this delay time
Standard time for each activity is set based on good practices & video clippings are made
This standard time is taken as reference for assessing the performance of a team in performing
the same activity in their shift.
After accumulation of lots of data, we could actually identify what are the most frequent
problems, which are the least frequent, which problem the most time was consuming.
Differentiating the problems helped a lot to managers to decide upon the action plan & takes
the necessary actions & make the necessary resources available on time for avoid such delays.
After 4 months, we could see that the efficiency of the machine increased from 82.4 % to 85.3
%. The utilization increased from 64.2% to 70.7%. (Report attached)
Keywords: Overall Equipment Effectiveness, Availability, Quality, Productivity, Total Productive
Maintenance.
105 Page
63. Risk Analysis in Global Supply Chain Management: Application of AHP
and DEMATEL
Pradeep Kumar Jain, Prasang Jain, Tarun Garg, Akshay Gupta
Purpose – The efforts put forward would be in finding out the critical parameters out of the set
of general parameters that will have an effect on the production systems in the organization,
first by identifying the influential parameters from the set of recognized general parameters by
using AHP (Analytical Hierarchy Process). Each of these influential parameters can then be
analyzed independently by DEMATEL (Decision Making Trial and Evaluation Laboratory)
technique to find out the most critical parameters among these that affect production system
the most and accordingly we can use our findings to improve those production systems.
Design/methodology/approach – we have identified and build a hypothetical case comprising
of general parameters which were the result of surveys, studies and research done in the past.
Based on this data and with the help of industry experts, we have assigned weightage to
individual factor according to its relevance to the production systems of organizations. Then,
we ranked these different recognized parameters according to their level of importance using
AHP. According to the ranks, we selected few influential parameters and further evaluated
those pair wise to find the cause and effect relationship between these using DEMATEL and
decide which parameters are most crucial to work upon for improvement in production system.
Research limitations/implications – Since this is a hypothetical case, the selection of the
parameters and their effect on each other is based on some individuals perceptions which
might not go with the perception of the rest. The structural model is based on the AHP and
DEMATEL methodology, which has its own limitations. For example; the model is highly
dependent on the judgments of the experts. Opinions of the experts may be biased. Besides
that, the effect of uncertainty and human bias in evaluating the parameters has not been
considered in this study.
Practical implications – The proposed DEMATEL based analysis model may also be extended to
the different industry sectors of Indian economy, in improving their production system.
However, the expert’s opinion regarding factor evaluation may 3 vary. The result obtained for a
particular sector might not comply with the findings of the other sector and hence the findings
would not be generalized.
Originality/value – This is the first kind of study which identified many parameters across
different domains of production systems in an organization. After this, a hierarchy among these
identified parameters is determined by using AHP approach. After this approach we came to
know the most influential parameters responsible for improvement in production systems. We
106 Page
further evaluated these influential parameters to understand the cause and effect relationship
among these using DEMATEL which are most critical for the production systems.
Keywords AHP, DEMATEL, Production System, Influential, Critical
64. Process development using ISM in Ecommerce business.
Basavaraj Koulapur, Sudipto Sinha, Eshwar Pasarge, Vivek Munshi
Electronic commerce, commonly known as e‐commerce or e‐commerce, is the trading or
facilitation of trading in products or services using computer networks, such as the Internet.
The Ecommerce business looks to promising at least in the near future. It is estimated by
Morgan Stanley Research that Ecommerce market size in India will be USD 119 BN by 2020. This
also comes as a challenge with growing competitors, improved customer satisfaction and
catering to wide range of customers. To retain profitable market share it is essential that
companies need innovation and improvements in the existing process.
The scope of the project is to identify the important factors that influence strategy and profit of
an Ecommerce business. This can be achieved by using Interpretative Structural Modelling
(ISM). This tool is used to identify how each of these factors affect remaining factors. Further
prioritizing these factors at various levels to strategize the plan of action in successful business.
65. Identification and evaluation of parameters affecting ERP System
Implementation in a manufacturing firm
Priya Daware, Videtha Ghai, Mayank Mehrotra, Saikat Chandra.
Purpose: Today business is not limited to local markets but has grown to global business
environment. Competition today is not limited between companies only, but it has extended to
be among their supply chains as well. Thus, companies are beginning to realize that in order to
survive in the global business environment they must improve their whole supply chain along
with the organizational efficiency. These reasons force many companies to make large
investments in developing and implementing better technologies and systems such as
enterprise resource planning (ERP) system (Davenport and Brooks, 2004).
The purpose of this paper is to examine the parameters for successful implementation of ERP in
manufacturing sector.
Design/methodology/approach:
107 Page
The regression ‐
It is a mathematical method of obtaining the reliability of the data by obtaining the line
of best fit between dependent variable, usually demand and some independent
variable. This method indicates the linear relation between X and Y by the value of co
relation co efficient.
This method is being used to calculate confirmatory factor analysis using coefficient of
determination.
Research limitations/implications: This research focuses only on implementation of ERP
system life cycle, where ERP system passes through three implementation stages of system life
cycle and that includes pre‐implantation stage, implementation stage, and finally post‐
implementation stage. Two or three stages of ERP system life cycle could be investigated
simultaneously.
Originality/value: The results of this study will enable the sector to achieve optimum usage of
ERP system after the implementation stage and help to avoid system failure and achieve better
SCM performance. The study contributes toward technology diffusion between companies
through reducing the likelihood of ERP systems failure, and therefore introduces ERP systems in
manufacturing sector.
Practical implications: The application of this integrated methodology would serve as a
systematic approach for measurement of the aggregate performance of ERP in manufacturing
sector so as to gain valuable academic and practical insights
66. Interpretive Structural modelling of Supply Chain Risk Management
Nirmal Shah, Nikhil Mohite, Ashish Nannaware, Vishesh Khandelwal.
Purpose: The purpose of this paper is to identify the possible risk in Supply Chain, assessment of
it and provide structural analysis of major risk which is interdependent. It will provide how
interpretive structural modeling (ISM) gives deep insight to managers in identifying and
understanding interdependencies among supply chain risks on different levels like Inbound, in
house and outbound. Interdependencies among risks will be derived and structured into a
hierarchy in order to derive which risk is major and affect other risk with corresponding driving
power and dependency.
Design/methodology/approach: Interpretive structural modeling is a well‐established
methodology for identifying relationships among specific items, which define a problem or an
issue. ISM was used to identify relationships among major supply
108 Page
Chain risks and to classify the risks according to their driving and dependence power.
Originality/Value: This model’s insight would help supply chain managers in the identifying the
risk which is destructive to the supply chain system which can be tackled by preventive and
reactive action. Also managers get a deep insight in effectively allocation of risk management
resources in the subsequent risk management action.
67. Kumbh Mela: Nasik City Logistics study of the state shuttle‐bus
transportation system using simulation approach
Jitendra Vishnolia and Rohit Singh.
Kumbh Mela is the largest peaceful and religious gathering in the world, in which Hindus
gather to bathe in a sacred river to cleanse one of all sins. The month‐long Kumbh Mela is a
Hindu festival that takes place once every three years rotating around four cities—Haridwar,
Allahabad, Nashik and Ujjain. Kumbh Mela 2015 is being held in Nashik. More than 10 million
pilgrims and Sadhus with a prayer on their lips and a desire to attain freedom from the cycle of
life, a sea of humanity are expected to dip in the holy water of river Godavari. Kumbh Melas are
being held in India since ancient times. They are older than history. Even in ancient times when
transport facilities were next to nothing, thousands of men, women and children used to
converge for a holy bath from all corners of the country. Risk management strategies to tackle
stampedes during previous Kumbh Mela have failed consistently in India because of the large
crowds and the widening spread of the venues. Lakhs of devotees are expected to attend the
Kumbh mela this year and take a holy dip at various 'ghats', constructed on Godavari river bank
in Panchavati locality. Seven ghats have been established at Nashik. Eight Routes paths have
been proposed for Nashik and four for Triambkeshvar. These seven ghats are Takali Sangam
Ram Ghat, Nandur Ram Ghat, Dasak Ram Ghat, Lakshmi Narayan Ram Ghat, Rokdoba maidan
Ramghat ‐ Gouri patangan ghat, Gandhi Talav Ram Ghat and Talkteshwar Ghat. The
government officials and authorities have done micro planning to manage the huge crowd
efficiently. The arrangements of seven outer‐parkings has been made, where devotees coming
from different places like Mumbai, Dhule, Pune, Trimbakeshwar, Aurangabad, Gujarat and
others will park their vehicles . The devotees will park their vehicles in the outer parking. They
will have to reach ghats by Maharashtra State Road Transport Corporation (MSRTC) buses
which would be kept ready at the outer parking. The distance between outer parking and inner
parking is expected to be covered by State Road Transport Buses running over defined specific
path assigned. This research looks into a queuing model to build the relationship between no of
pilgrims and frequency of state transport on the particular route to minimize the risk of
blocking. Queuing theory is the study of queue or waiting lines. Analysis has been carried out
using queuing model include the expected waiting time in the queue, the average time in the
109 Page
system, the expected queue length as well as the probability of the system to be in certain
states, such as empty or full. The devotees will come to the outer parking with their own
transport channel then they have to get down and utilize the facility of state road transport,
this will be done in batches to avoid the blockage/traffic issue. From the inner parking devotees
will travel to the respective “ghats” by walk in performing their rituals of bath. They will again
come back to the inner parking to avail the facility of State Road Transport which will lead them
to the outer parking. The complete transport channel is divided into three systems, System 1
will be the flow of devotees from outer parking to the inner parking availing the facility of State
Shuttle Bus Transport, and System 2 will be the flow of devotees from inner parking to the
respective “ghats” which will be travelled by foot where the devotees can utilize the service of
Kumbh Bath / Kumbh Snan and then return back to the inner parking and the System 3 will be
the flow of devotees from the inner parking to the outer parking where devotees will avail the
facility of State Shuttle Bus Transport. The methodology proposed in this paper focuses on the
constant flow of pilgrims throughout the above planned channel and avoid blockage at any
location. Queuing model is used in this practical phenomenon to determine the
frequency/number of the State Road transport required at individual respective routes.
Queuing model will be used to determine the waiting time of devotees per hour at each of the
systems. The queuing model is simulated through Monte‐Carlo simulation using Crystal Ball
software for better solutions. This research will help the authorities to determine the frequency
of state shuttle bus transport required at both the system 1 and system 3. Thus they will deploy
the State Bus as per the requirement and frequency predicted. As the arrival of devotees will be
random at the eight route paths proposed for Nashik and four for Triambkeshwar, the
calculation of waiting time per hour and frequency of State shuttle bus transport will be
calculated for each individual route path proposed for Kumbh Snan considering the distance
between outer and inner parking for each proposed path. The objective of this study is to
introduce a new model for optimizing the flow/transportation of pilgrims between the outer
and inner parking location through the deployment of existing techniques in a new application‐
domain. This research can bring out the effective model where concerns of crowd safety
management, entry and exit systems, steady flow of crowd is maintained so that all the pilgrims
can utilize the service of Kumbh Bath / Kumbh Snan without any misfortune.
110 Page
68. Customer Roll out ‐ Operationalization of Customer Contract
Anil Choudhary, Himanshu Thakur, Kavin M Purpose – Design the Large Item Distribution Process and Streamlining and standardizing the
3PL and client operations
Design/methodology/approach ‐ Analysis of existing process of LID system. , data collection , Data Analysis , Designing of zones and sub zones depending upon the existing pin code., determining the number of lanes/pallets/inventory for each zone depending on the customer orders for LID region., designing of dashboard for automatic put‐away strategies, designing of MIS for tracking and visibility of current inventory ,execution and conclusion of new LID process. Findings – LID was the Prime bottleneck area of the warehouse, no standard process for LID put
away and picking area, multiple region items were placed on the same SKU causing difficulty in
picking process, multiple piling and random placement of the material was resulting into more
picking time and travel time of the pickers. ,No tracking of item stored in LID area result into
Item lost / not found , High customer delivery time of pepper fry last mile delivery, customer
dissatisfaction because of late delivery ,low productivity of pickers because of random
placement of materials.
69. Supply Chain Management: Asset Control and its impact on the value of
firm
Elvin Clements, Pratik Gupta, Vimal Singh
Purpose: The purpose of this research paper is to examine the effect of Supply Chain
Implementation using Logistics performance as a focal construct since it has implications on
both marketing and financial performances which ultimately impact the value of a firm.
Design/Methodology: A survey with questionnaires related to the various aspects of supply
chain strategy, logistics performance, marketing and financial performance was shared across
various operations and logistics managers. The responses from the respondents was collected
and a confirmatory factor analysis was conducted in locating the factors that affect the system
and in turn proving the hypothesis made. A correlation analysis was conducted to identify the
interrelationship among the various factors identified.
Findings: It has been proved that the logistics performance impacts the supply chain
management and its successful implementation impacts the marketing and financial
performance which are direct measures of supply chain performance. Hypothesis have been
proved using statistical measures which substantiate the hypothesis quantitatively.
111 Page
Research limitations/ implications: Scope of the research is limited to analysing logistics
performance alone assuming that other drivers/elements like supplier integration, sourcing,
inventory management, capacity utilization, etc., of supply chain management are constant and
not affecting the firm’s value to a great extent.
Implementation of Supply Chain Management would involve designing a supply chain network,
Planning and Coordinating Demand and Supply In a Supply chain, Planning and Managing
Inventories in a Supply chain, Designing and Planning Transportation Networks right from the
suppliers, manufacturers, transporters, warehouses, retailers and the customers and thus help
in creating flexibility and robustness of a supply chain. Logistics plays an important part in
efficient performance of supply chain. The lead time reduction for raw material, finished goods,
in‐plant transient goods, distribution and delivery greatly affect the overall organization’s
performance.
Practical Implications: Transportation alone accounts for up to 50 percent of the total logistics
cost and thus needs to be contained in improving the performances of the supply chain.
Originality/Value: This research demonstrates the impact of logistics performance to support
and advocate implementation of supply chain management which improves the
competitiveness and value of the firm.
Keywords: Supply chain management, organizational performance, logistics, statistical
modelling
70. Sector analysis‐An automotive supply chain model for demand driven
environment
Subhro ghosh, Sandipan Show, Manish Ghosh.
Purpose: The main aim of this paper is to study the challenge of demand management and
formulate a model to increase the efficiency of supply chain model and optimize the process to
cater to increasing demand of the automobile goods.
Design/methodology/approach: The efficient supply chain model has been developed. It
mainly comprises of the structure, components, the physical flow, operational planning and
processes and strategies of the supply chain model. Suppliers are usually located at different
locations and time taken by the suppliers to deliver parts may vary. Local suppliers may take
one or two days where as overseas suppliers may take several weeks. This may result in
stocking of parts to manage lead time and ever changing demand. To maintain lead time this
112 Page
model make use of supplier parks to cut down on lead time and fluctuations in demand. A
supplier park is the concentration of dedicated production, assembly, sequencing or
warehousing facilities run by suppliers or a third party in close proximity. It increases the
reliability of supply because the delivery time from finished component to assembly will not be
more than a few minutes. It makes the supply more reliable as it reduces the delivery time from
hours to minutes. Entire assembly of vehicles depends on timely delivery of the components.
Synchronous delivery is obtained by employing a decoupling point upstream the chain.
Decoupling point shows how customer order enters in goods flow. This arrangement ensures
synchronous sequential deliveries between second and first tier suppliers and first tier and
OEMs.This results in increased efficiency in vehicle manufactured. In this type of arrangement,
first tier‐supplier is located close to OEM site. This delivery between them is synchronized
sequentially. The second tier is shifted within the supplier park. This improves the
communication between first tier, second tier, OEMs for executing synchronous deliveries of
the products and also increases the ability to provide demand and production information.
Findings: The proposed model consists of three processes namely physical flow, operational
and planning processes and strategies. The physical process mainly deals with movement of
goods or information in transit or storage. In operational and planning tasks are performed to
guarantee proper physical flow. Strategies are employed to increase the efficiency and
responsiveness to changing market. This supply chain model will provide an environment of
high product variety. The customer receives the exact product specification required, with
ensured sales finished goods inventory and discounts, as well a reduction in stock obsolescence
risk. There is also balance between MTO and MTS which will help in maintaining stock levels
matching the market requirements.
Practical Implications: Though the proposed model is perfect example of responsive supply
chain its applicability is a question. The model is yet to be tested. The researchers have made
propositions and additional enhanced the model to make it more impressive. It can be
enhanced by practices like as JIT manufacturing, quick response, flexible manufacturing
systems, and vendor‐managed inventory (VMI).Furthermore supplier parks ensure close
proximity between the tier suppliers and the manufacturers.
Originality/value: The Applications of this model will ensure that Indian automotive sector is
able to cater the changing demand cycles and stays competitive in terms of flexibility as well as
strategies.
Keywords: overall equipment manufacturer (OEM), Make to order (MTO), Make to Stock
(MTS), Leagile, Vendor manage Inventory (VMI), Just‐In‐time (JIT).
113 Page
71. Performance Issues in Supply Chain Management Using SAP‐LAP
Framework: A Case Study Evidence from Manufacturing Industry
Akshay Gathekar, Hemant Gavale, Salman Mohammad
Purpose: The purpose of this paper is to analyze the case of Tasty Bite, a biscuit manufacturing
firm in India, status of its supply chain performance, issue identification and help provide
solutions and various associated tangibles and intangibles to bridge the gap. A situations‐
actors‐processes (SAP) learning‐action‐performance (LAP) analysis has been applied to identify
the various issues that need attention, compare current performance with the desired
performance, propose development plans and hence making the supply chain efficient and
effective.
Design/methodology/approach: SAP‐LAP is a holistic framework that blends hard systems and
soft systems paradigms. There is a pressing need to evolve a management approach which is
holistic and flexible in the light of dramatic change in various external factors of the business
environment and the corresponding change in the internal factors of the organizations. The
SAP‐LAP framework consists of three entities in any context, viz. a situation to be dealt with, an
'actor' or group of actors who deal with it and a 'process' or processes that recreate the
situation. In this framework, freedom of choice lies with the actor. A synthesis of SAP leads to
LAP which deals with learning, action and performance. We often encounter situations in
managing organizations and conducting management research to carry out an in‐depth inquiry
of the problem/case at hand for effective action.
Findings: The proposed inclusive framework of SAP‐LAP model is presented to capture the
whole Scenario of coordination to exploring the performance level of supply chain in the
manufacturing industry. It is based on the three key entities, viz. situation, actor and process
and takes the learning synthesis in terms of learning, action and performance. The framework
helps in identifying different coordination issues based on the relative importance of using
internal supply chain in the manufacturing industry.
Practical Implications: Logistics, sales and distribution –They use both inbound and outbound
logistics. When researched, it was found that outbound logistics are more complicated than the
inbound logistics. The whole phenomenon is managed through a mix of spoke and hub, where
the raw materials were taken from various vendors of one area in a truck and then supplied to
the factory unit. Vendor development strategy‐Tasty Bite incurs about (50‐60) % of the total
cost towards the procurement of raw materials like wheat flour, sugar, vegetable fat, liquid
glucose, milk powder, yeast, color, flavours, coconut, fat and packaging material
114 Page
Originality/value: The paper mainly looks at the application and execution of “SAP‐LAP
framework” in an Indian FMCG company for the supply chain management.
Key words: Situation‐ Actor‐Process (SAP), Learning Action Performance (LAP), Performance
measurement.
72. Strategic Alignment of future supply chain with existing supply chain of
LNG distributing organization in India
Parth Gandhi, Mayukh Saha, Navaneeth Surendran
Ronald H. Ballou in “The evolution and future of logistics and supply chain” states that “Before
1950’s firms might have organized key activities at that time in terms of the responsibilities and
objectives for marketing, finance, and production. This fragmentation led to conflicts among
those responsible for logistics activities with the result that, from the firm’s perspective, costs
and customer service were sub‐optimized. The reasons for this fragmentation were said to be:
a lack of understanding of key cost trade‐offs, the inertia of traditions and conventions, areas
other than logistics were thought to be more important, and the organization may have been in
an evolutionary state.” He also states that the earlier distribution network also intended to
have a manageable flow of resources and materials from its source to end consumer. With
network of multiple suppliers, manufacturers and customers increasingly cause constraints in
smooth flow, with limited or no co‐ordination of activities. The concept of total cost is used to
serve as the basis for managing certain activities, which were associated with flow of material
across the supply chain. Activities such as transportation and inventory control were managed
together because they were in cost conflict. Moreover the physical distribution and logistics
were embraced by both marketing and production areas, but have very less responsiveness
towards the issues of product flow. As a result, physical distribution and logistics started to
emerge as separate entity within business and further resulting in high logistics cost and
unrealized opportunity to optimize them.
With the advent of globalization created an urge for cost optimization. The globalization gave
way for MNC’s to have their product available in local market. Now the SCM is concerned with
realizing the opportunities from integrated management of product flow processes across
functions. This led to logistics being seen as subset of SCM. Earlier, the scope of logistics was
very much limited within the boundaries of the function of a firm. Inter‐functional and inter‐
organizational management seem to be within the purview of SCM rather than logistics.
Logistics as an identifying name supersedes physical distribution. Currently, SCM is practiced as
logistics and not the broad, theoretical scope envisioned for it. Perhaps managers will begin to
115 Page
practice SCM when its benefits are better documented and measured, and the techniques and
tools needed to achieve the benefits are refined. As new MNC’s are moving towards emerging
markets to establish supply chains based on the cultural, administrative, geographic and
economic distance of the host market, a new holistic relationship between manufacturer,
supplier and distributor have started to developed. The conflicting interests between
marketing, production and finance plans, is now foregone to realize the need for saving overall
cost optimization.
Thus, to understand the current changes and challenges of strategic alignment which
organizations of LNG distributing industry faces, with this paper tried to identify such issues and
mitigating solutions for the same. For the same purpose, we have considered ABC Ltd. a LNG
distribution organization, which is moving towards integrating its supplier network and
customer networks by working with the supplier and distribution. Its supplies come from gulf
countries and random tramp ships. The supplies are fulfilled with existing contracts between
their suppliers and ad hoc contracts based on urgent need of the customers. On account of high
lead times and LNG price fluctuation based on crude variation, existing contracts is detrimental
in optimizing the costs incurred. With exploratory research based approach on the content
available, the dimensions were validated for measuring performance of SCM. After analysing
through the AHP model, parameter for the current supply chain suggests a holistic outlook for
viewing supply chain. The paper brings out the evolution of supply chain by setting an example
of LNG distribution plant. The evolution would be majorly in terms of collaboration using the
KPI’s listed in the SCOR model as a performance evaluation metric and further setting the
agenda to reduce setup time in VSM. The essential non value added domains in VSM could be
further sketched after implementing measures and suggestions. The paper is a guideline to
improve the existing process at the LNG distribution plant.
73. Transporter selection using AHP analysis & Central warehouse Planning
Saqibullah Choudhary, Rohit Kapoor, Viraj Raut
Business environment is getting complex day by day. Coping with the complexity of today’s
business environment is not about predicting the future or reducing risk. It’s about building the
capacity, in yourself, your people, and the organization to adapt continuously and learn
speedily, in order to maximize the chances of seizing fleeting opportunities. Today, companies
are building strategies to achieve competitive advantage. Among these, warehousing is still
unlooked as a medium to gain advantage in this competitive environment.
In FMCG industry, there is great outward of materials having variety in dimension, weight,
packaging designs etc. A small improvement in warehousing/logistics operations increases the
116 Page
turnover, increasing the profitability of company but the constraint lies in finding these
improvements and implementing it.
Transportation cost is one of the major components of the supply chain cost. To reduce the
supply chain cost of an organization it is important to focus on this area. Using Analytical
Hierarchy Process as a tool, we evaluate the transporters on a number of criteria and provide a
framework for future selection of transporters, which further helped us in assigning fleets to
the transporters based on their ranking.
The paper depicts the route towards warehouse operations improvement by suggesting various
improvement strategies. There are about 450 different SKUs in Finished Goods warehouse to
be dispatched. Each part is completely studied & brainstormed and finally improvements were
filtered out. These improvements ultimately provide cost savings for the company.
Central warehouse strategy is made for the company as the drawbacks of different warehouses
are causing various problems to the organization in terms of lead time, cost and lose of orders.
Tool used for planning for central warehouse location is Load‐distance analysis.
74. Strategic Initiative for Supply Chain Management in Different Sectors.
Sanuj Das, Vishvas Luhana, Aditya Bhagwat
Purpose: The aim of this paper is to research the case of departments of the sectors,
particularly of health care (Care Pharma) sector and manufacturing sector (A1 chocolate
manufacturing industry), standing of its provide chain performance, issue identification and
facilitate other solutions and varied associated tangibles and intangibles to bridge the gap.
Methodology: This paper research is done on the stated problems and also the situation
analyzed for developing and delivering optimized solution to the organization. A situations‐
actors‐processes (SAP) learning‐action‐performance (LAP) analysis has been applied to spot the
assorted problems that require attention. Compare current performance with the required
performance; propose development plans and create the value addition to the available supply
chain model by enhancing economical and effective operation.
Findings: Cross sectional matrix giving the interdependency of assorted drivers among state of
affairs, Actor and method will be designed that provides an additional elaborate approach
towards the implementation of LAP (Learning‐Action‐Performance) measures. The self‐
interaction matrices represent the interdependency of the varied drivers among one another.
The dependency will be understood and also the level to that it's answerable for the
organization’s offer chain performance. The projected inclusive framework of SAP‐LAP model is
conferred to capture the complete state of affairs of coordination to exploring the performance
117 Page
level of providing chain inside the manufacturing trade. It supported the three key entities, viz.
situation, actor and technique and takes the coaching synthesis in terms of learning, action and
performance. The framework helps in characteristic altogether totally different coordination
issues supported the relative importance of victimization internal give chain inside the
manufacturing trade.
Practical implications: Management case studies are generally action oriented. After having
diagnosed the problem an action needs to be suggested. If one compares SAP‐LAP with
management case analysis frameworks like SWOT, VRIO then one finds that SAP‐LAP helps
understanding in roles that actors (key decision makers) play. No other framework talks about
actors and learning. In SWOT and RIO managers generally do not explain the learning which
accrues to them. SAP‐LAP framework gives tremendous clarity on the roles key decision
makers’ play, recommended actions, expected performance and learning which can carry
forward. No other framework provides these features. SAP‐LAP is an interpretive framework
that we can use as a case method in a context of management teaching, research and practices.
It is holistic yet simple framework that can be applied in a variety of contexts. It takes situation
as the driving element and takes into consideration the freedom‐of‐choice of actors. The
synthesis is learning centric. It can be extended by using it in a dynamic manner and by
interrelating various elements via SAP‐LAP linkages, which can be categorized by Interpretive
Ranking Process (IRP).
Keywords: Supply Chain; Supply Chain Management; Order Management; Vehicle Breakdown;
Shipment visibility; Vendor development strategy; Vendor quality control; SAP‐LAP; SAP‐LAP
Analysis; Self – interaction matrix; Cross‐ Sectional matrix
75. Extending Green Practices across supply chain: an empirical study
Ajay kaushik.
Introduction: In initial environmental management frameworks, operations managers were
involved only at small length. Separate organizational units had the responsibility for ensuring
environmental excellence in the fields of operations, product development, process design,
marketing, logistics, waste management and regulatory compliance etc. Today, this has
developed from the quality revolution of the 1980’s to the 1990’s supply‐chain revolution, it
has become clearer that the best practices call upon for the integration of environmental
management with the on‐going operations.
Green supply chain management (GrSCM) is attracting more interest among practitioners and
researchers of operations and supply‐chain management. The growing importance of Green
Supply chain management is driven mainly by the increasing deterioration of the environment,
118 Page
e.g. reducing raw material resources, superfluous waste sites and ever increasing levels of
pollution in the environment. However, this isn’t just about being environment ‐ friendly; but it
is about higher profits returns and good business sense. In fact, it should be a business value
driver and not like a cost centre. Moreover, consumer pressures and the regulatory
requirements are driving GrSCM. Hence, the scope of GrSCM ranges not only from a reactive
monitoring of the general management programmes but to a more proactive practices
implemented through various Rs (Reduce, Re‐manufacture, Re‐use, Re‐work, Re‐furbish,
Reverse logistics, Reclaim, Re‐cycle, etc).
Purpose: Our main objective is to present a detailed integrated view of the published literature
on all the aspects and facets of GrSCM, taking a ‘reverse logistics view’ so as to facilitate deep
study, practice and research on it .To meet this objective, we define a few relevant term to
understand the topic well. Qualitative analysis was applied to classify the existing literature on
the basis of problem context and the approach taken into consideration. We map the tools via
the problem context classification. Green supply‐chain management has its roots in both
supply chain management and environment management literature. Adding the ‘green’
component to supply‐chain management involves addressing the relationship and influence
between supply chain management and natural environment. Similar to the concept of supply‐
chain management, the limits of GrSCM is based on the goal of the investigator. The meaning
and scope of GrSCM in the literature has varied from green purchasing to an integrated green
supply chains flowing from the supplier to the manufacturer to the customer, and even the RL
GrSCM is defined as ‘integrating environmental thinking into supply‐chain management,
including material sourcing ,product design and selection, manufacturing processes, delivery of
the final product to the consumers also the proper end‐of‐life management of the product after
its useful life is over’. We basically focus on RL and mathematical modelling aspects in order to
prepare for further study and research work. Green design has been used remarkably in the
literature to mark the designing products with some unavoidable environmental
considerations. It is the well‐developed systematic consideration of design issues related with
health and environmental safety over the full product life cycle during process development
and new production Its scope entails many disciplines, including product safety, environmental
risk management, occupational health and safety, resource conservation, pollution prevention
and waste management. A green operations takes into consideration of all aspects related to
usage, handling, product manufacture/remanufacture, logistics and waste management as and
once the design has been finalized. A green manufacturing aims to minimize the ecological
burden by using appropriate technologies and material, while remanufacturing mentions to an
industrial process, in which worn‐out products are being restored to new‐like condition.
119 Page
Few characterize RL as 'the procedure of arranging, executing, and controlling the proficient,
practical stream of crude materials, in‐procedure stock, completed products and related data
from the purpose of utilization to the point of root with the end goal of recovering quality or
legitimate transfer', while some characterizes waste minimization as 'the lessening ... of
dangerous waste which is created (amid production and operations) or in this manner treated,
put away or arranged ...'.
Methodology: We classify the existing GrSCM literature into three different categories based
on the problem context in supply chain design which are highlighting the importance of GrSCM;
literature on green supply design; and literature on green operations to be taken. Green design
may be looked into from the viewpoint of environment conscious design and assessment of the
product and/or process into account. Similarly, green operations involve all operational aspects
relating to RL and network design (collection; inspection/sorting; pre‐processing; network
design), green manufacturing and remanufacturing (reduce; recycle; production planning and
scheduling; inventory management; re‐use, product and material recovery) and waste
management (reduction; pollution prevention; disposal). We do not consider literature and
practices relating to green logistics, the issues are more operational than the strategic in nature
and are not be significant in the supply chain design. We do not focus in detail on empirical
studies on GrSCM and literature on green purchasing, industrial ecology and industrial
ecosystems, as it is limited by our research design. We focus more onto the RL as the
establishment of efficient and effective RL networks is the prerequisite for profitable recycling
and remanufacturing.
The classification is for the easier understanding of different problem contexts of GrSCM – their
interactions, integration and relationships – in order to present a well‐defined and clear vision
for in‐depth analysis and research. It is not rigid, and there could be many overlaps (for
example, reduce gets focused not only in green manufacturing and remanufacturing, but also
elsewhere as to reverse logistics and waste management; green design, emphasizes reduced
use of virgin material and other resources on the platform. Similarly, green design should be
taken into account for the whole product life‐cycle costs, including those during manufacturing
and re‐manufacturing, reverse logistics and disposal for the same.
The target of this paper is to distinguish significant deals with green production network
administration exploration incorporating ecological speculation into inventory network
administration, and from that point, to arrange them to recognize gaps, issues and open doors
for further study and research. A writing audit is by all accounts a legitimate methodology, as it
is a vital stride in organizing an examination field and structures a fundamental piece of any
exploration directed. This distinguishes the theoretical substance of the field and aides towards
hypothesis improvement. Our exploration is driven by hypothetical pre contemplations and
120 Page
takes after a reasonable procedure, as this permits conclusions to be drawn on the checked on
writing. It might be delegated an archival examination technique in the system for leading and
assessing exploration. Our procedure of investigation contains the accompanying steps:
Defining unit of analysis: The unit of investigation has been characterized as a solitary
exploration paper/book. We further delimit the material (examination paper/book) to be
gathered according to our degree.
Classification context: We select and characterize the order setting to be connected in the
writing audit to structure and arrange the material. There are two settings: the issue
connection and philosophy/approach setting.
Material evaluation: The material is broke down and sorted by arrangement setting. This
permits ID of important issues and understanding of the outcomes. Issue setting and related
philosophy/methodologies permit grouping of the checked on writing, which can be inferred
deductively or inductively.
Findings: A lot of literature exists about various facets and aspects of GrSCM. Detailed reviews
on green design, production planning, repairable inventories and control for re‐manufacturing,
issues in green manufacturing and product recovery, reverse logistics (RL) and logistics network
design have been published in many works. Earlier reviews and works had a very limited focus
and narrow perspective. They did not cover adequately all the facets and aspects of GrSCM that
was required. Much of the work was empirical and did not focus much on network design
related issues and modelling.
Practical Implications: Our writing audit centers upon books, altered volumes and diary articles
just. To set up a period compass, a beginning stage was set at 1990. This appears to be
legitimized, as the start of the level headed discussion on GrSCM can be followed to this period.
Library databases were utilized where a watchword hunt utilizing some vital catchphrases, for
example, 'green store network', 'remanufacturing', 'green buying', 'green configuration',
'modern biology', 'mechanical environments', 'RL', "remanufacturing" and 'squander
administration' were directed. To delimit the quantity of distributions, observational papers
fundamentally tending to firm‐level or particular operational issues were prohibited from the
survey. Likewise, exceedingly specialized work on points, for example, life‐cycle appraisal, stock,
contamination counteractive action and dismantling was additionally barred from the survey.
Research with an exceptionally natural instead of production network point of view (green
buying, mechanical environment and modern biological systems) was additionally avoided. This
is by all accounts supported while considering the goal laid out, which focuses on incorporating
ecological deduction into store network administration. We utilize the distributed writing from
1990 onwards to do a reversal to different papers by cross referencing. As the distributed
121 Page
writing is interlinked to an extensive degree, one paper (stem) prompts others (branches). In
this way, when we get one string, we can discover others. As references collected, we found
that some of them were more focal and helpful than others. We consider such references as
original papers. These were additionally observed to be for the most part referenced various
times in consequent writing. Therefore, inside of our characterized objective, this work
incorporates and takes forward the writing on GrSCM since its conceptualization. Around 1500
books, articles from diaries and altered volumes have been secured.
76. Performance Measurement of supply chain: A Balance Score Card (BSC)
approach
PRS Sagar
Purpose: The main aim of this paper is to study the importance of performance measurement of supply chain using Balanced score card framework in Indian FMCG Industry. Design/methodology/approach: Performance management has become an important requirement for all the industries in different sectors. Unfortunately, many tools don’t exist to measure and monitor performance measurement of supply chain delivery effectively. Managers need accurate information to ensure that their decisions not based on feelings and speculations, but that the information with regard to service delivery is precise and relevant. So Balanced Scorecard (BSC) methodology is used to translate the organization’s strategy into performance objectives, measures, goals and initiatives. A precise balanced scorecard framework can predict the effectiveness of an organization’s strategy through a series of performance measures based on four perspectives of the framework including: Finance, Internal processes, customers, Employee growth and learning. Findings: Gap analysis for financial and non‐financial parameters of supply chain is done by Balanced score card framework and the results are shown using Radar chart. Regression analysis has been done .The findings of the study will be showing the importance of different perspectives of BSC in an organization. The findings will also include the interdependence of the parameters that have been measured and analyzed using various statistical tools where we can compare multivariate data. Different organizations have quite different needs, market areas, people, products and services, and will end up with significantly different balanced scorecards. Practical Implications: The balanced scorecard framework is balanced not only in one dimension of balance of measures of important areas of business, but also a balance between goals versus accountability. The people of the organization are the key to the success of the balanced scorecard system. Each organization must adopt a more balanced perspective in its performance measurement and management. Originality/value: The paper mainly looks at the application and execution of “Balanced Score Card Performance” in an Indian FMCG company for the supply chain management. Keywords: Performance measurement, Balanced Scorecard (BSC), Radar chart, four perspectives.
122 Page
77. Modeling Supply Chain Network Design and Product Recovery Planning
Under Demand Uncertainty
Apoorv Jha, Sana Ibrahim, Sudarshan K, Rohan Sharma
The backbone of any industry whether it manufacturing, FMCG, services etc. is their supply
chain network. It plays a very important role in defining the Key Performance Indicators (KPIs)
of that particular industry or firm. Supply chain network comprises of the complete SIPOC
diagram starting from the supplier to the end customer. Organizations are banking heavily on
making their networks leaner and more efficient.
With the ever changing dynamics of the global market and cut‐throat competition, we need to
take into account the major aspect that is the product differentiation and the demand
uncertainty. Product differentiation is a very critical aspect as it helps to set our product apart
from the rest of the market whether it is in terms of additional features, quality standards or
pricing. This involves offering delight to the customers in terms of product standard.
While talking about the supply chain network, it is very crucial to consider the demand
uncertainties related to the product. Right from the supplier to the end‐customer,
understanding the demand patterns helps by efficiently managing the following parameters:
Reducing the Lead Time at all the levels of the SIPOC cycle
Optimizing the inventory levels according to the requirements
Maintaining the quality standards as per norms
Developing the Master Planning Schedule (MPS)
Planning the production cycles
Implementation of the Pull view of supply chain based on Just‐In‐Time philosophy
There has been several research articles published to understand how organizations should
react to demand uncertainty by bringing the necessary changes in their supply chain design. For
instance, we can look into the AAA supply chain model (Hau L. Lee, HBR, 2004) especially
designed for products belonging to niche markets where the production is relying heavily on
the demand from the market.
Agility
Adaptability
Alignment
It involves the organizational commitment to quickly adapt and align their current practices to
the market dynamics.
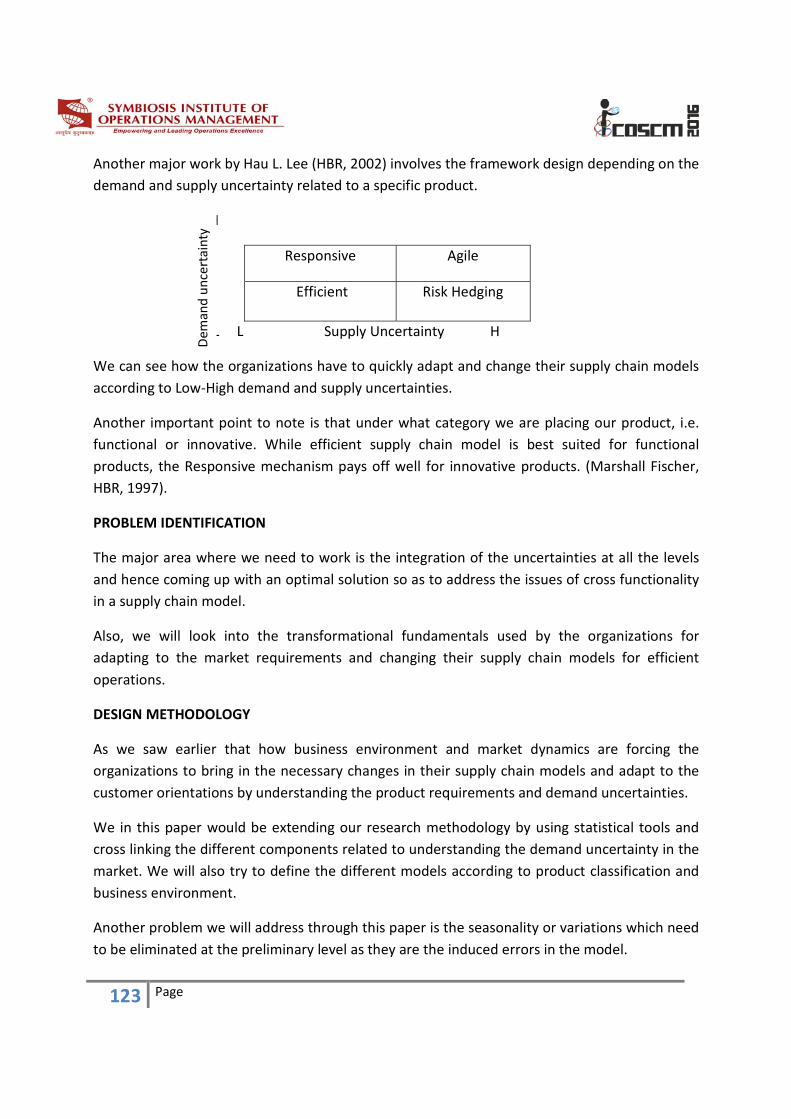
123 Page
Another major work by Hau L. Lee (HBR, 2002) involves the framework design depending on the
demand and supply uncertainty related to a specific product.
H
Responsive Agile
Efficient Risk Hedging
L L Supply Uncertainty H
We can see how the organizations have to quickly adapt and change their supply chain models
according to Low‐High demand and supply uncertainties.
Another important point to note is that under what category we are placing our product, i.e.
functional or innovative. While efficient supply chain model is best suited for functional
products, the Responsive mechanism pays off well for innovative products. (Marshall Fischer,
HBR, 1997).
PROBLEM IDENTIFICATION
The major area where we need to work is the integration of the uncertainties at all the levels
and hence coming up with an optimal solution so as to address the issues of cross functionality
in a supply chain model.
Also, we will look into the transformational fundamentals used by the organizations for
adapting to the market requirements and changing their supply chain models for efficient
operations.
DESIGN METHODOLOGY
As we saw earlier that how business environment and market dynamics are forcing the
organizations to bring in the necessary changes in their supply chain models and adapt to the
customer orientations by understanding the product requirements and demand uncertainties.
We in this paper would be extending our research methodology by using statistical tools and
cross linking the different components related to understanding the demand uncertainty in the
market. We will also try to define the different models according to product classification and
business environment.
Another problem we will address through this paper is the seasonality or variations which need
to be eliminated at the preliminary level as they are the induced errors in the model.
Dem
and uncertainty
124 Page
Different forecasting techniques which we will see to understand the demand changes include:
Average Forecasting Method
Weighted Average Method
Exponential Smoothing Method
Regression Method
Next Generation Regression Model
Different inventory models, deterministic or probabilistic will be further linked to the demand
scenarios and other parameters which are cross functional will be included.
We will also try and incorporate the much talked about Big Data Analysis for supply chain
design. It is one of the current trending topics in this field comprising of gathering and analyzing
data available in the following formats:
Unstructured Data (Through Twitter, LinkedIn, News etc. comprising 80‐90% of the data)
Semi‐Structured Data (Interview, discussion with reports etc.)
Structured Data (Reports published by research agencies, organizations etc.)
This is important to integrate the information in hand for predictive modeling and analyze the
different supply chain models. For this, there are different tools which can be used including
the Goal Programming, Mixed Integer Linear Programming and Multivariate Statistics.
Findings: The approach adopted here for supply chain modeling is a dynamic one which will
depend on the priorities assigned as per the industry experts. Also, the demand forecasting
tools involved are of the continuous nature and help the organization to develop preventive
benchmarks. This approach can be adopted by managers for Critical‐To‐Quality (CTQ) issues
and analyze the functional domain involving the activities.
Research Limitations: This method simulates the basic priorities assigned by the functional
heads in an organization. However, the process needs to accommodate more parameters for
understanding the root cause and take corrective actions for the same with the use of the three
stage process involving identification, analysis and corrective action. Other areas which can be
involved include Flexible manufacturing systems (FMS) and how it can be effectively managed
using demand forecasting and product development.
Practical Implication: The methods adopted have been explained by using the data sets
available from the Indian manufacturing industry which imply the actual problems faced by the
companies under quality control. The assigned scores for different parameters of demand
uncertainties and product development are included while taking the functional areas in
consideration.
125 Page
Keywords: Lead time, Quality planning, Master Planning Schedule, Production system, Pull view
of supply chain, Demand forecasting, Critical‐to‐quality (CTQ), Next generation regression
model, Key performance Indicators (KPI).
78. A Comparative Study between AHP and TOPSIS to Prioritize Supply Chain
Flexibility Dimensions: A Case Study of Indian FMCG Sector
Shreyash Bansal, Nupur Prajapati
This is a comparative study between AHP and TOPSIS methodologies to prioritize the supply
chain flexibility dimensions (extracted from literature) in Indian FMCG industry. Authors have
visited the case firm to have an idea of issues related to flexibility. Flexibility is the ease by
which an organization can adapt or change itself to the changing business environments and
customer needs. It is the ability of a system to respond to internal or external changes which
may affect its value delivery in cost effective and timely manner. Flexibility enables an
organization to swiftly respond to any uncertainty by sustaining its output and profitability.
These uncertainties may be in a form of a risk or an opportunity, in former case the primary
objective of flexibility becomes to sustain while in the latter case the primary objective is to
increase or enhance the value delivery system of the organization. Thus, being flexible has
helped many organizations to pass the test of the time with flying colors. The factors of
changing consumer behaviors, frequent innovations in technologies across various domains and
raging price wars have made flexibility the need of the hour. One such industry which is
constantly driven by these factors is the Fast Moving Consumer Goods or FMCG industry. To
thrive in the unpredictable, uncertain and turbulent modern business environment flexibility in
supply chain is must.
To carry out this study authors have done extensive literature review and extracted supply
chain flexibility dimensions, most suited for Indian FMCG firm, accordingly designed the self‐
administered questionnaire and floated it among executives of case industry. The feedback
authors received in terms of filled up questionnaire become the input of data analytics using
AHP and TOPSIS, and finally designed the structured hierarchy of supply chain flexibility
dimensions. This study will help firm to understand which area to focus upon the most to make
firm’s supply chain flexible enough to cope up with uncertainties present in external
environment.
Key words: Supply Chain Flexibility, FMCG, AHP, TOPSIS, Uncertainty.
126 Page
79. A combined AHP‐ANP approach to evaluate supply chain of electronic
business
Abhishek Tuli, Ankit Karir
Purpose: The purpose of this study is to solve the issues in supply chain network with the
integration of Operation Management models and E‐Business and to provide the real time
solution to Wrangler that witnessed the decline in sales and market share, which was once
highly successful and highly competitive in the denim jeans market. Wrangler identified that
product was not conveniently available to the customers.
Methodology: This problem includes both tangible and intangible criteria therefore analytic
hierarchy process (AHP) is accepted as the methodology and to identify the interdependency
between these criteria analytic network process (ANP) is used.
Findings: According to our observations by using different OM models, it was found out using
AHP that Future group emerged as the most important criteria followed by Westside and
Reliance retail for managing the distribution network of Wrangler products. Dependency
among the different criteria was identified using ANP.
Originality/Value: In this study we implemented various OM models to a real world supply chain
problem. The results that we obtained were considered acceptable and feasible by the decision
maker.
Practical Implications: This robust technique for the effective use of E‐business with OM models
as a backbone in supply chain network can be used in any sector for effective use of resources
and achieving customer satisfaction.
Keywords: AHP, ANP, Supply chain management, E‐Business.
80. Identifying dimensions of Student Support Systems in eLearning courses
and their causal relationship using AHP and DEMATEL
Prashant Barge
Today’s business environment is supported by e‐activities, up to the extent that no business is
possible to have maximum profitability without availing e services. Today “E” is everything: e‐
commerce, e‐business, e‐banking and e‐learning also (Richard N. Katz and Diana G. Oblinger
2000). The ocean of “E”, a world where the Internet, Internet of Things (IOT) and the Big Data
with Cloud technology is changing the ways people work and the ways businesses operate on
127 Page
all levels. We are talking of SMART World with SAMRT Cities, which is possible now using
Internet of Things (IOT).
Many universities across the world want to improve the performance of their e‐Learning
initiatives in this e‐era. The Student Support Services in e‐Learning has major role and is major
component as discussed and proved by many researchers (Alias 2005). As mentioned by Sener
and Humbert (2003); student satisfaction is vital element in successful e‐Learning program.
Students’ satisfaction ultimately leads to completion of the course. This in turn helps to reduce
the attrition rates in e‐Learning course.
The purpose of this paper is to identify the key variables of Student Support Services through
Systematic Literature Review (SLR). Further attempt has been made by authors to establish the
causal relationship among selected constructs of Student Support Services using Analytic
Hierarchy Process (AHP) and DEMATEL.
The study has employed AHP and DEMATEL to develop a Student Support Services framework
and formulated strategy to implement in Indian scenario.
Our key objectives of this research paper are:
• To identify key variables for Effective Student Support Systems (S3) in eLearning Courses,
• To explore conceivable linkage among these dimensions; and
• To propose new Student Support Systems (S3) framework to increase student satisfaction in
eLearning courses.
Research Methodology: Based on the AHP process; following phases are followed by the
researchers to prioritize strategic areas (Categories) and sub factors (Attributes) used for this
study. AHP provides a framework to cope with multiple criteria situations involving intuitive,
rational, quantitative and qualitative aspects for such study.
In the next section of research, authors have established a structure for identifying the
evaluation attributes and factors as well as their relationships. This study presents not only the
priority of attributes and factors within each attribute but also the cause and effect relationship
between them using DEMATEL. DEMATEL analytical technique was used to determine the
causal relations and to identify the significant attributes and factors which consists those
attributes.
Future Application of proposed research:
1: To reduce the attrition in the e‐learning courses
2: To increase the satisfaction of e‐learners
128 Page
3: To develop the better e‐learning courses considering personalization
81. The Role of Information Uncertainty on Cement Industry‐ (Using
Combined AHP‐DEMATEL Analysis)
Rohit Singh, Jitendra Vishnolia, Anand Singh, Jigar Gajjar, Udgar Antani
Implementation of Sustainable manufacturing into products and processes has become the
necessity of major cement manufacturing industries as Cement Manufacturing process
comprises of consumption of raw material, energy, and major source of pollutants. Thus in this
research the role of information uncertainty in the Key performance indicators of the
Sustainable Cement Manufacturing process is evaluated based on the triple bottom line of
sustainability.
Sustainable manufacturing should be integrated and evaluated with respect to the three
indicators of environmental, social, and economic, known as the triple bottom line of
sustainability.
The society’s infrastructure construction around the world uses the fundamental building
material Cement which is the most important ingredient of concrete. Generally, the cement
plants are characterized as an intensive consumer of natural raw materials and fossil fuels, and
hence are remarked as emitters of pollutants. According to United Nations Environment
Program report, due to an ever increasing demand for the building sector; the annual growth
rates of cement is about 6% for cement but at the same time these industries caused about 6%
of global greenhouse gas emissions. Therefore, evaluating sustainable manufacturing has
become a necessity for this industry. This reflects the crux of our case.
Generally, the cement plants are categorized as a concentrated consumer of natural raw
materials and fossil fuels, and has observed as emitters of pollutants. Therefore, assessing
sustainable manufacturing has turn out to be a requirement for this industry.
In this study, an attempt was carried out to rank and to establish relationship between
indicators commonly used in sustainable manufacturing evaluation. This paper proposes a set
of Key Performance Indicators (KPIs) for assessing the sustainable manufacturing assumed to be
suitable to the cement industry. The KPIs are then used to develop an assessment model of
sustainable manufacturing.
Multiple criteria decision making (MCDM) refers to making decisions in the presence of
multiple, typically conflicting, criteria. MCDM problems are common in everyday life.

129 Page
Issues related to MCDM are most common, MCDM as a discipline exclusively encompasses a
relatively short history of concerning thirty years.
This research helps in prioritizing the performance indicators and to analyze the relationship
between these indicators using “Analytic Hierarchy process” (AHP) and “Decision‐making Trial
and Evaluation Laboratory” (DEMATEL).
The Analytic Hierarchy Process (AHP) is a multi‐criteria decision‐making approach and was
introduced by Saaty (1977 and 1994).The analytic hierarchy process (AHP), as proposed by
Saaty is a later development and it has recently become popular. Recently modification to the
AHP is considered to be more consistent than the original approach.
Sustainable manufacturing is certainly one of the critical issues for the cement industry.
Cement, as the most important ingredient of concrete, is a fundamental building material for
society’s infrastructure construction around the world. The Analytical Hierarchy Process (AHP)
methodology is applied to weighting the KPIs and prioritize them. It is believed that the
proposed KPIs and the evaluation model enable and assist the cement industry in effort to
increase their sustainable manufacturing performance.
The prioritized KPIs are then checked for interdependency between the indicators by the help
of DEMATEL another approach of Multi criterion Decision‐Making (MCDM).
DEMATEL is functional to examine and build the relationship of cause and effect among
assessment criteria (Yang et al., 2008) or to develop interrelationship among indicators (Lin and
Tzeng, 2009).
The key performance indicators are identified and classified into three categories: Economic,
Environmental and Social factors. The DEMATEL method will be used to identify dependency of
the performance indicators and the AHP multi criteria decision making (MCDM) approach will
prioritize the indicators, which will support in project decision making and rank the alternatives
in a preferred order. This priority and relationship will help the cement industry to achieve
higher performance and better competitiveness.
The Key Performance Indicators classified on the basis of triple bottom line:
1. Economic Factors
Material Cost
Inventory Cost
Labour Cost
Product Delivery
Raw Material substitution
130 Page
2. Environmental Factors
Air Emission
Energy Consumption
Fuel Consumption
Material Consumption
Noise Pollution
Non‐product Output
Water Utilization
Land Utilization
3. Social Factors
Accident Rate
Employee Involvement
Labour Relationship
Gender Equity
Occupational Health and Safety
Training and Education
Out of the Triple Bottom line of sustainability one is the traditional measure of corporate
profit—the “bottom line” of the profit and loss account. The second is the bottom line of a
company's “people account”—a measure in some shape or form of how socially responsible an
organization has been throughout its operations. The third is the bottom line of the company's
“planet” account—a measure of how environmentally responsible it has been. The triple
bottom line (TBL) thus consists of three Ps: profit, people and planet. It aims to measure the
financial, social and environmental performance of the corporation over a period of time. Only
a company that produces a TBL is taking account of the full cost involved in doing business.
Thus, for sustainable cement manufacturing Process the key performance indicators are
classified on the basis of Triple Bottom line of sustainability.
Firstly the KPIs will be rated by managers of production and manufacturing unit of Cement Plant
for sustainable manufacturing assessment in the cement industry. The outcome of the
Response from ten managers of leading manufacturing Cement Industries will be evaluated for
prioritization through AHP method.
Once the priority is decided the DEMATEL method is applied to analyze and form the
relationship of cause and effect among evaluation criteria or to derive interrelationship among
factors. The DEMATEL method converts the relationship between the causes and effects of
criteria into an intelligible structural model of the system. The questionnaire will be developed
and sent to different managers or responsible persons to understand their opinion and
131 Page
relationships as per their point of view. Response of the concerned managers will be averaged
out and normalized to build the DEMATEL model.
The outcome of the AHP approach will prioritize the KPIs. The proposed KPIs and the evaluation
model will enable and assist the cement industry in effort to increase their sustainable
manufacturing performance. Whereas the DEMATEL approach will define the interdependency
of the KPIs on one another.
It has been reported that those companies adopting sustainable practices are able to achieve
better product quality, higher market share, and increased profits. Hence lower the information
uncertainty, better evaluation of above mentioned Key Performance Indicators (KPIs). This
priority and relationship will help the cement industry to achieve higher performance.
Keywords— Sustainable manufacturing, Key performance indicators (KPI), Analytic Hierarchy
process (AHP), Decision‐making Trial and Evaluation Laboratory (DEMATEL).
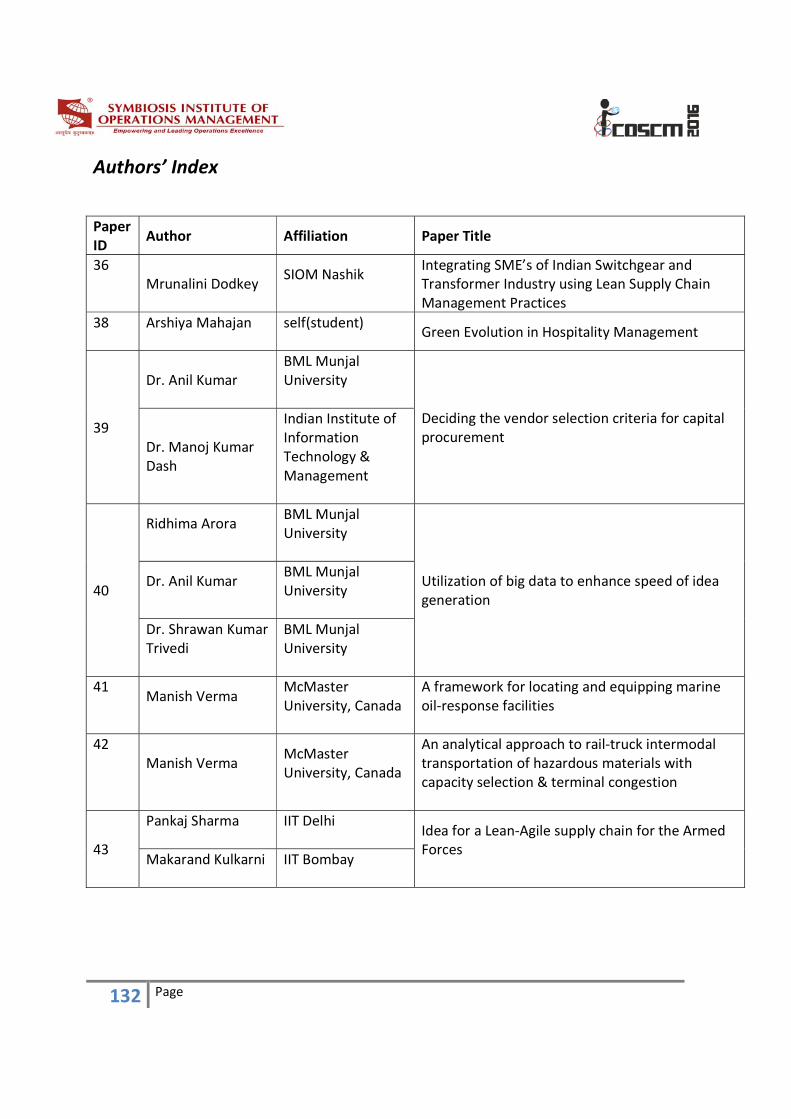
132 Page
Authors’ Index
Paper ID
Author Affiliation Paper Title
36 Mrunalini Dodkey
SIOM Nashik
Integrating SME’s of Indian Switchgear and Transformer Industry using Lean Supply Chain Management Practices
38 Arshiya Mahajan
self(student)
Green Evolution in Hospitality Management
39
Dr. Anil Kumar BML Munjal University
Deciding the vendor selection criteria for capital procurement
Dr. Manoj Kumar Dash
Indian Institute of Information Technology & Management
40
Ridhima Arora
BML Munjal University
Utilization of big data to enhance speed of idea generation
Dr. Anil Kumar
BML Munjal University
Dr. Shrawan Kumar Trivedi
BML Munjal University
41 Manish Verma
McMaster University, Canada
A framework for locating and equipping marine oil‐response facilities
42 Manish Verma
McMaster University, Canada
An analytical approach to rail‐truck intermodal transportation of hazardous materials with capacity selection & terminal congestion
43
Pankaj Sharma
IIT Delhi
Idea for a Lean‐Agile supply chain for the Armed Forces
Makarand Kulkarni
IIT Bombay
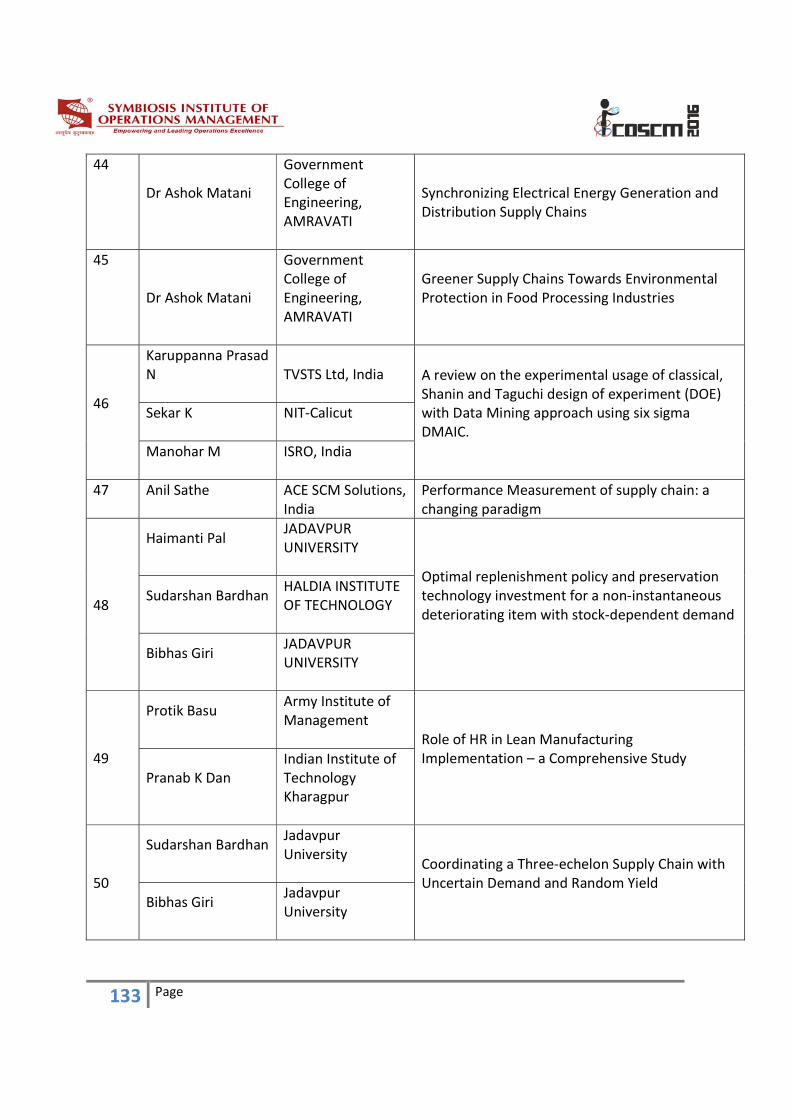
133 Page
44
Dr Ashok Matani
Government College of Engineering, AMRAVATI
Synchronizing Electrical Energy Generation and Distribution Supply Chains
45
Dr Ashok Matani
Government College of Engineering, AMRAVATI
Greener Supply Chains Towards Environmental Protection in Food Processing Industries
46
Karuppanna Prasad N
TVSTS Ltd, India A review on the experimental usage of classical, Shanin and Taguchi design of experiment (DOE) with Data Mining approach using six sigma DMAIC.
Sekar K
NIT‐Calicut
Manohar M
ISRO, India
47 Anil Sathe
ACE SCM Solutions, India
Performance Measurement of supply chain: a changing paradigm
48
Haimanti Pal
JADAVPUR UNIVERSITY
Optimal replenishment policy and preservation technology investment for a non‐instantaneous deteriorating item with stock‐dependent demand
Sudarshan Bardhan
HALDIA INSTITUTE OF TECHNOLOGY
Bibhas Giri
JADAVPUR UNIVERSITY
49
Protik Basu
Army Institute of Management Role of HR in Lean Manufacturing
Implementation – a Comprehensive Study Pranab K Dan
Indian Institute of Technology Kharagpur
50
Sudarshan Bardhan
Jadavpur University
Coordinating a Three‐echelon Supply Chain with Uncertain Demand and Random Yield Bibhas Giri
Jadavpur University
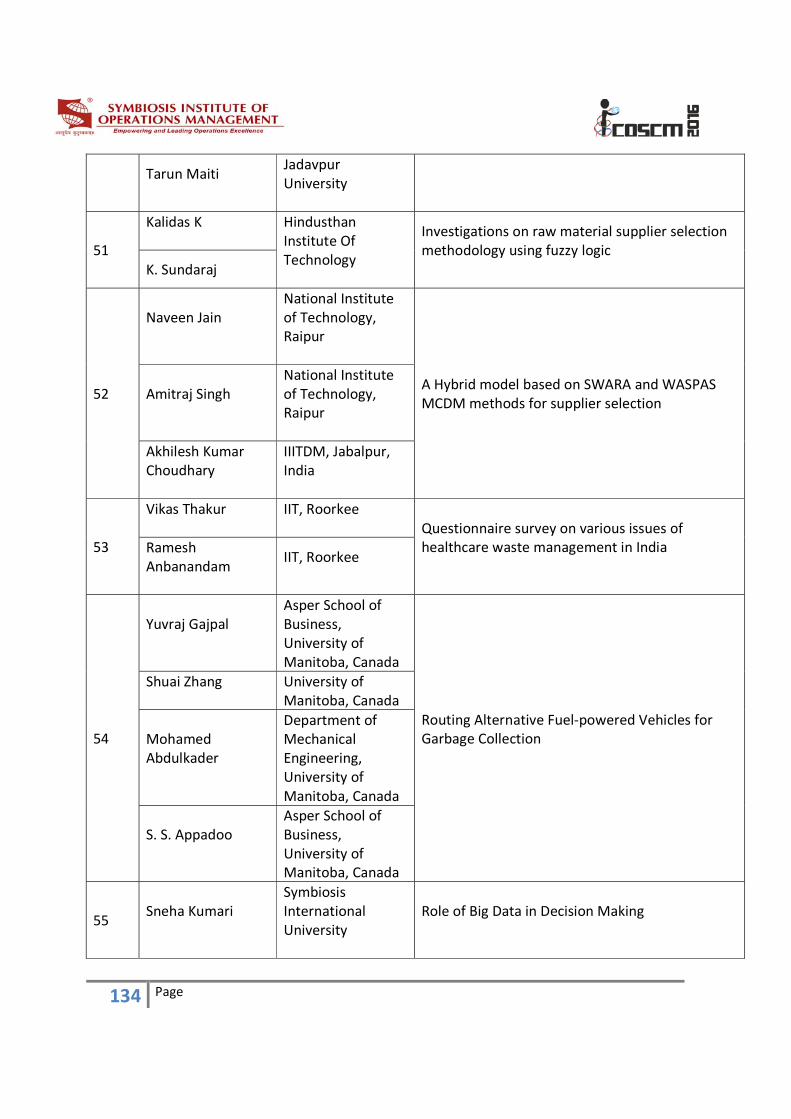
134 Page
Tarun Maiti
Jadavpur University
51
Kalidas K
Hindusthan Institute Of Technology
Investigations on raw material supplier selection methodology using fuzzy logic K. Sundaraj
52
Naveen Jain
National Institute of Technology, Raipur
A Hybrid model based on SWARA and WASPAS MCDM methods for supplier selection
Amitraj Singh
National Institute of Technology, Raipur
Akhilesh Kumar Choudhary
IIITDM, Jabalpur, India
53
Vikas Thakur
IIT, Roorkee Questionnaire survey on various issues of
healthcare waste management in India
Ramesh Anbanandam
IIT, Roorkee
54
Yuvraj Gajpal
Asper School of Business, University of Manitoba, Canada
Routing Alternative Fuel‐powered Vehicles for Garbage Collection
Shuai Zhang
University of Manitoba, Canada
Mohamed Abdulkader
Department of Mechanical Engineering, University of Manitoba, Canada
S. S. Appadoo
Asper School of Business, University of Manitoba, Canada
55 Sneha Kumari
Symbiosis International University
Role of Big Data in Decision Making
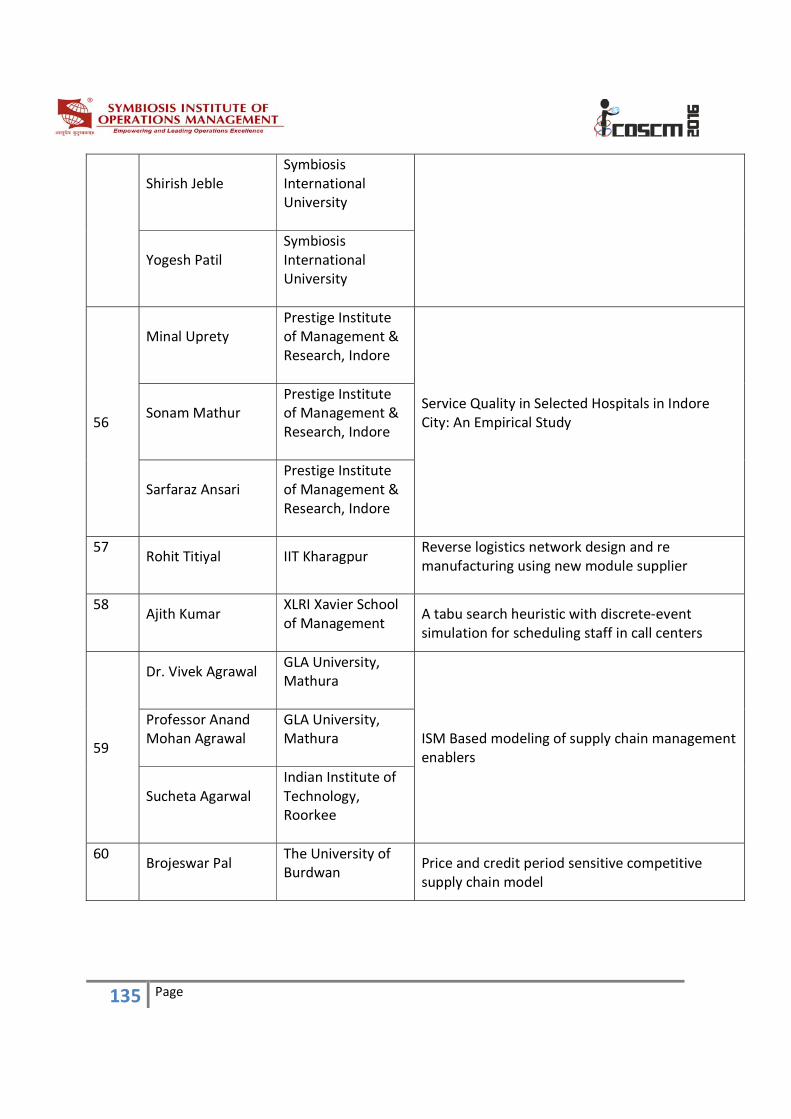
135 Page
Shirish Jeble
Symbiosis International University
Yogesh Patil
Symbiosis International University
56
Minal Uprety
Prestige Institute of Management & Research, Indore
Service Quality in Selected Hospitals in Indore City: An Empirical Study
Sonam Mathur
Prestige Institute of Management & Research, Indore
Sarfaraz Ansari
Prestige Institute of Management & Research, Indore
57 Rohit Titiyal
IIT Kharagpur
Reverse logistics network design and re manufacturing using new module supplier
58 Ajith Kumar
XLRI Xavier School of Management
A tabu search heuristic with discrete‐event simulation for scheduling staff in call centers
59
Dr. Vivek Agrawal
GLA University, Mathura
ISM Based modeling of supply chain management enablers
Professor Anand Mohan Agrawal
GLA University, Mathura
Sucheta Agarwal
Indian Institute of Technology, Roorkee
60 Brojeswar Pal
The University of Burdwan
Price and credit period sensitive competitive supply chain model
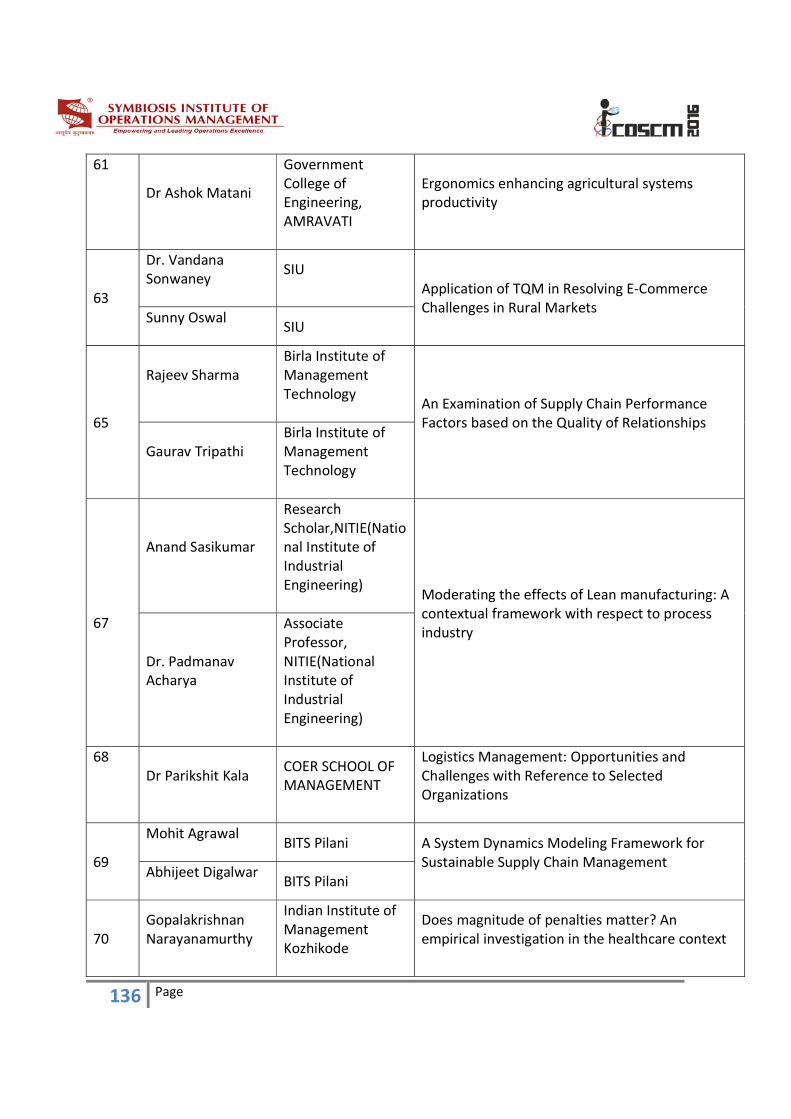
136 Page
61
Dr Ashok Matani
Government College of Engineering, AMRAVATI
Ergonomics enhancing agricultural systems productivity
63
Dr. Vandana Sonwaney
SIU Application of TQM in Resolving E‐Commerce
Challenges in Rural Markets Sunny Oswal
SIU
65
Rajeev Sharma
Birla Institute of Management Technology
An Examination of Supply Chain Performance Factors based on the Quality of Relationships
Gaurav Tripathi
Birla Institute of Management Technology
67
Anand Sasikumar
Research Scholar,NITIE(National Institute of Industrial Engineering)
Moderating the effects of Lean manufacturing: A contextual framework with respect to process industry
Dr. Padmanav Acharya
Associate Professor, NITIE(National Institute of Industrial Engineering)
68 Dr Parikshit Kala
COER SCHOOL OF MANAGEMENT
Logistics Management: Opportunities and Challenges with Reference to Selected Organizations
69
Mohit Agrawal
BITS Pilani A System Dynamics Modeling Framework for Sustainable Supply Chain Management
Abhijeet Digalwar
BITS Pilani
70 Gopalakrishnan Narayanamurthy
Indian Institute of Management Kozhikode
Does magnitude of penalties matter? An empirical investigation in the healthcare context
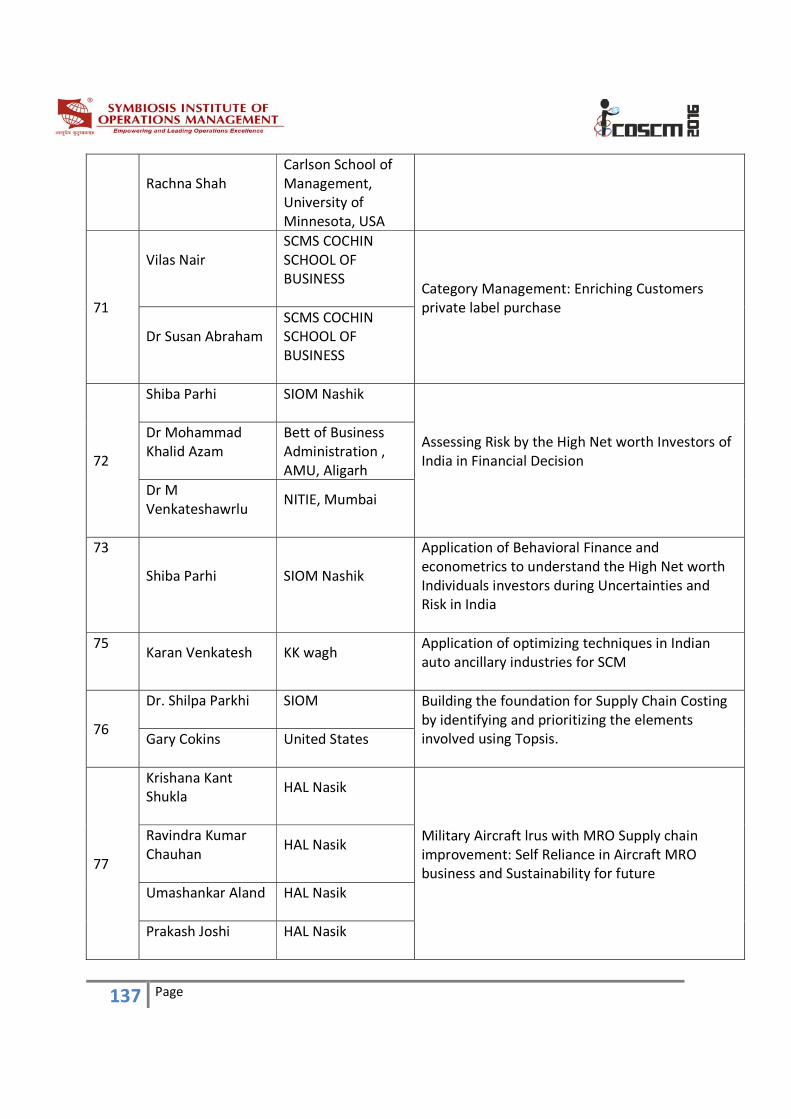
137 Page
Rachna Shah
Carlson School of Management, University of Minnesota, USA
71
Vilas Nair
SCMS COCHIN SCHOOL OF BUSINESS
Category Management: Enriching Customers private label purchase
Dr Susan Abraham
SCMS COCHIN SCHOOL OF BUSINESS
72
Shiba Parhi
SIOM Nashik
Assessing Risk by the High Net worth Investors of India in Financial Decision
Dr Mohammad Khalid Azam
Bett of Business Administration , AMU, Aligarh
Dr M Venkateshawrlu
NITIE, Mumbai
73
Shiba Parhi
SIOM Nashik
Application of Behavioral Finance and econometrics to understand the High Net worth Individuals investors during Uncertainties and Risk in India
75 Karan Venkatesh
KK wagh
Application of optimizing techniques in Indian auto ancillary industries for SCM
76
Dr. Shilpa Parkhi
SIOM
Building the foundation for Supply Chain Costing by identifying and prioritizing the elements involved using Topsis.
Gary Cokins
United States
77
Krishana Kant Shukla
HAL Nasik
Military Aircraft lrus with MRO Supply chain improvement: Self Reliance in Aircraft MRO business and Sustainability for future
Ravindra Kumar Chauhan
HAL Nasik
Umashankar Aland
HAL Nasik
Prakash Joshi
HAL Nasik
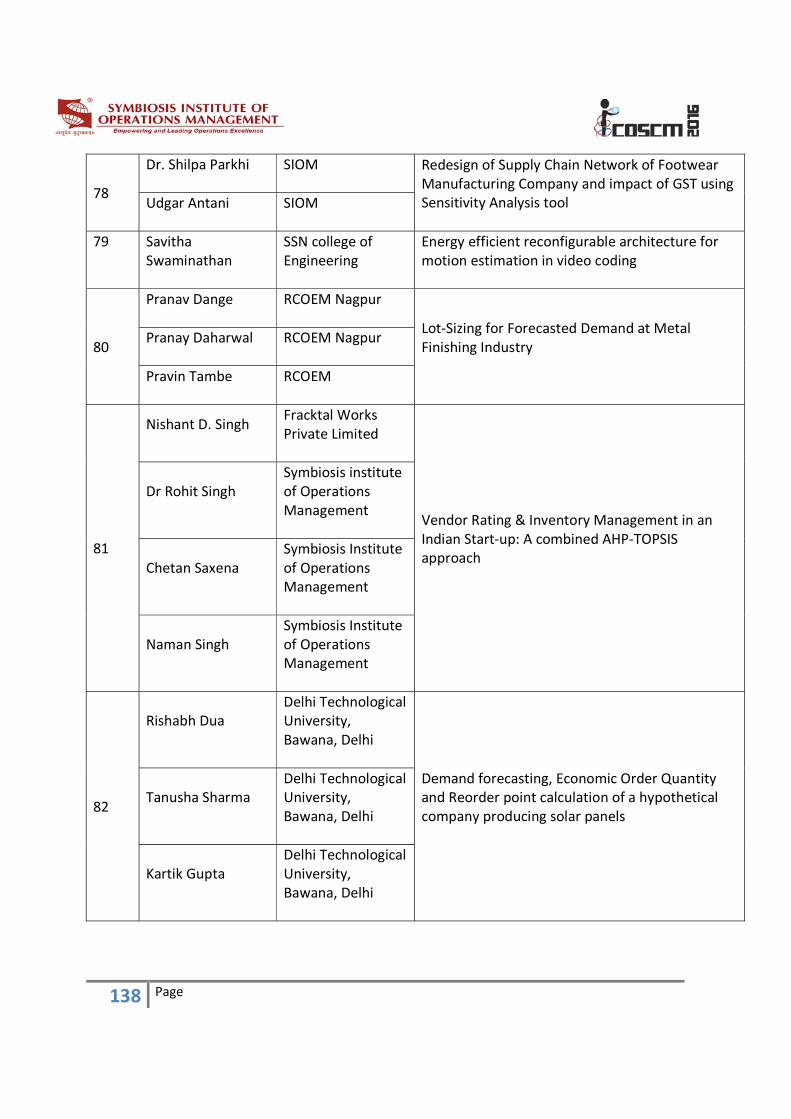
138 Page
78
Dr. Shilpa Parkhi
SIOM
Redesign of Supply Chain Network of Footwear Manufacturing Company and impact of GST using Sensitivity Analysis tool
Udgar Antani
SIOM
79 Savitha Swaminathan
SSN college of Engineering
Energy efficient reconfigurable architecture for motion estimation in video coding
80
Pranav Dange
RCOEM Nagpur
Lot‐Sizing for Forecasted Demand at Metal Finishing Industry
Pranay Daharwal
RCOEM Nagpur
Pravin Tambe
RCOEM
81
Nishant D. Singh
Fracktal Works Private Limited
Vendor Rating & Inventory Management in an Indian Start‐up: A combined AHP‐TOPSIS approach
Dr Rohit Singh
Symbiosis institute of Operations Management
Chetan Saxena
Symbiosis Institute of Operations Management
Naman Singh
Symbiosis Institute of Operations Management
82
Rishabh Dua
Delhi Technological University, Bawana, Delhi
Demand forecasting, Economic Order Quantity and Reorder point calculation of a hypothetical company producing solar panels
Tanusha Sharma
Delhi Technological University, Bawana, Delhi
Kartik Gupta
Delhi Technological University, Bawana, Delhi
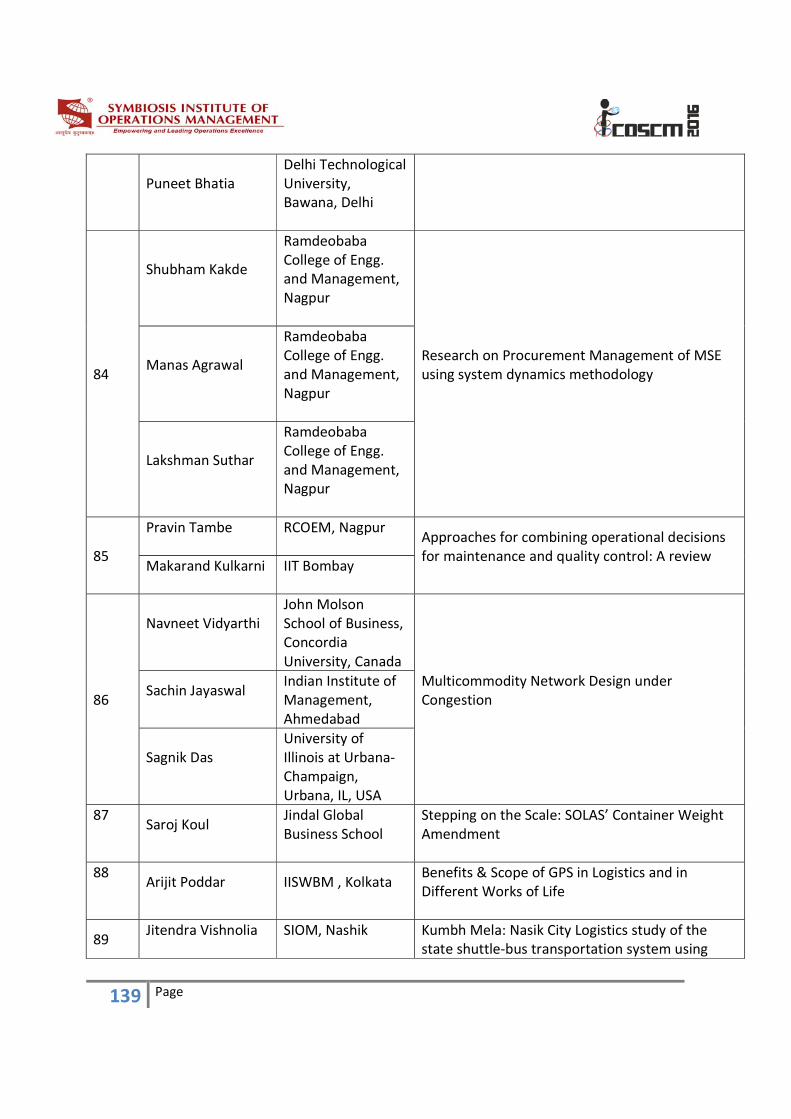
139 Page
Puneet Bhatia
Delhi Technological University, Bawana, Delhi
84
Shubham Kakde
Ramdeobaba College of Engg. and Management, Nagpur
Research on Procurement Management of MSE using system dynamics methodology
Manas Agrawal
Ramdeobaba College of Engg. and Management, Nagpur
Lakshman Suthar
Ramdeobaba College of Engg. and Management, Nagpur
85
Pravin Tambe
RCOEM, Nagpur
Approaches for combining operational decisions for maintenance and quality control: A review
Makarand Kulkarni
IIT Bombay
86
Navneet Vidyarthi
John Molson School of Business, Concordia University, Canada
Multicommodity Network Design under Congestion
Sachin Jayaswal
Indian Institute of Management, Ahmedabad
Sagnik Das
University of Illinois at Urbana‐Champaign, Urbana, IL, USA
87 Saroj Koul
Jindal Global Business School
Stepping on the Scale: SOLAS’ Container Weight Amendment
88 Arijit Poddar
IISWBM , Kolkata
Benefits & Scope of GPS in Logistics and in Different Works of Life
89 Jitendra Vishnolia
SIOM, Nashik
Kumbh Mela: Nasik City Logistics study of the state shuttle‐bus transportation system using
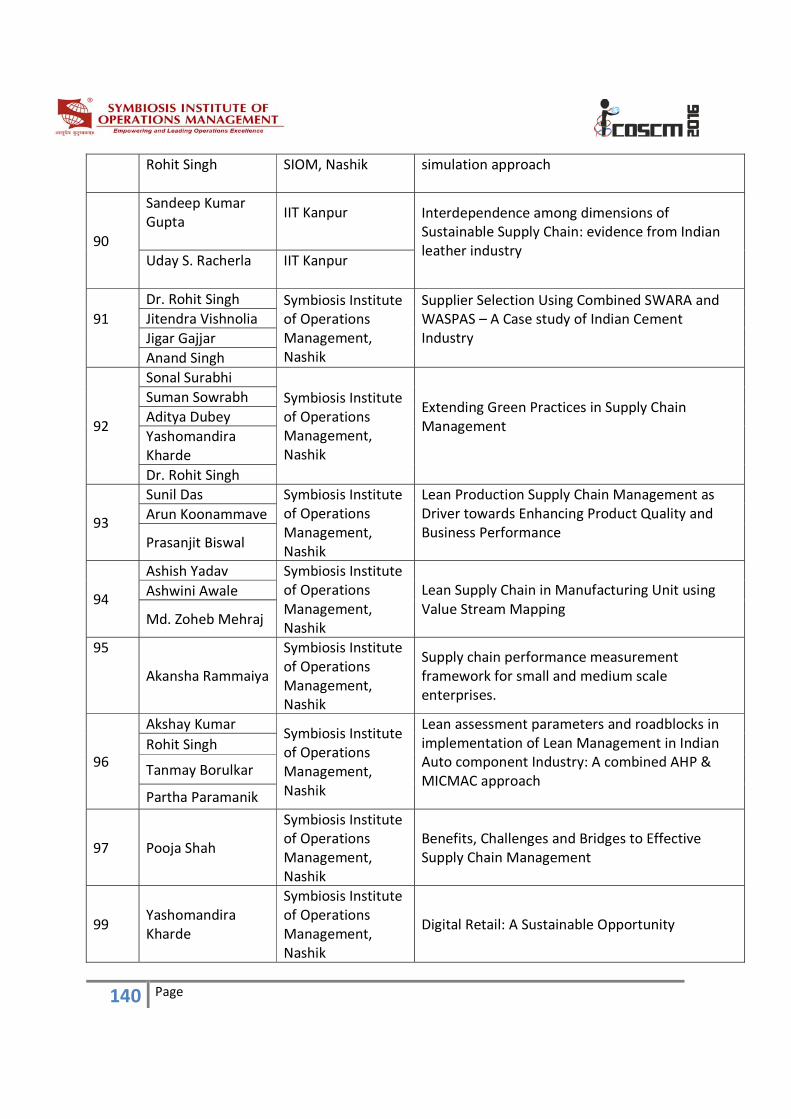
140 Page
Rohit Singh
SIOM, Nashik
simulation approach
90
Sandeep Kumar Gupta
IIT Kanpur
Interdependence among dimensions of Sustainable Supply Chain: evidence from Indian leather industry
Uday S. Racherla
IIT Kanpur
91
Dr. Rohit Singh Symbiosis Institute of Operations Management, Nashik
Supplier Selection Using Combined SWARA and WASPAS – A Case study of Indian Cement Industry
Jitendra Vishnolia
Jigar Gajjar
Anand Singh
92
Sonal Surabhi
Symbiosis Institute of Operations Management, Nashik
Extending Green Practices in Supply Chain Management
Suman Sowrabh
Aditya Dubey
Yashomandira Kharde
Dr. Rohit Singh
93
Sunil Das Symbiosis Institute of Operations Management, Nashik
Lean Production Supply Chain Management as Driver towards Enhancing Product Quality and Business Performance
Arun Koonammave
Prasanjit Biswal
94
Ashish Yadav Symbiosis Institute of Operations Management, Nashik
Lean Supply Chain in Manufacturing Unit using Value Stream Mapping
Ashwini Awale
Md. Zoheb Mehraj
95
Akansha Rammaiya
Symbiosis Institute of Operations Management, Nashik
Supply chain performance measurement framework for small and medium scale enterprises.
96
Akshay KumarSymbiosis Institute of Operations Management, Nashik
Lean assessment parameters and roadblocks in implementation of Lean Management in Indian Auto component Industry: A combined AHP & MICMAC approach
Rohit Singh
Tanmay Borulkar
Partha Paramanik
97 Pooja Shah
Symbiosis Institute of Operations Management, Nashik
Benefits, Challenges and Bridges to Effective Supply Chain Management
99 Yashomandira Kharde
Symbiosis Institute of Operations Management, Nashik
Digital Retail: A Sustainable Opportunity
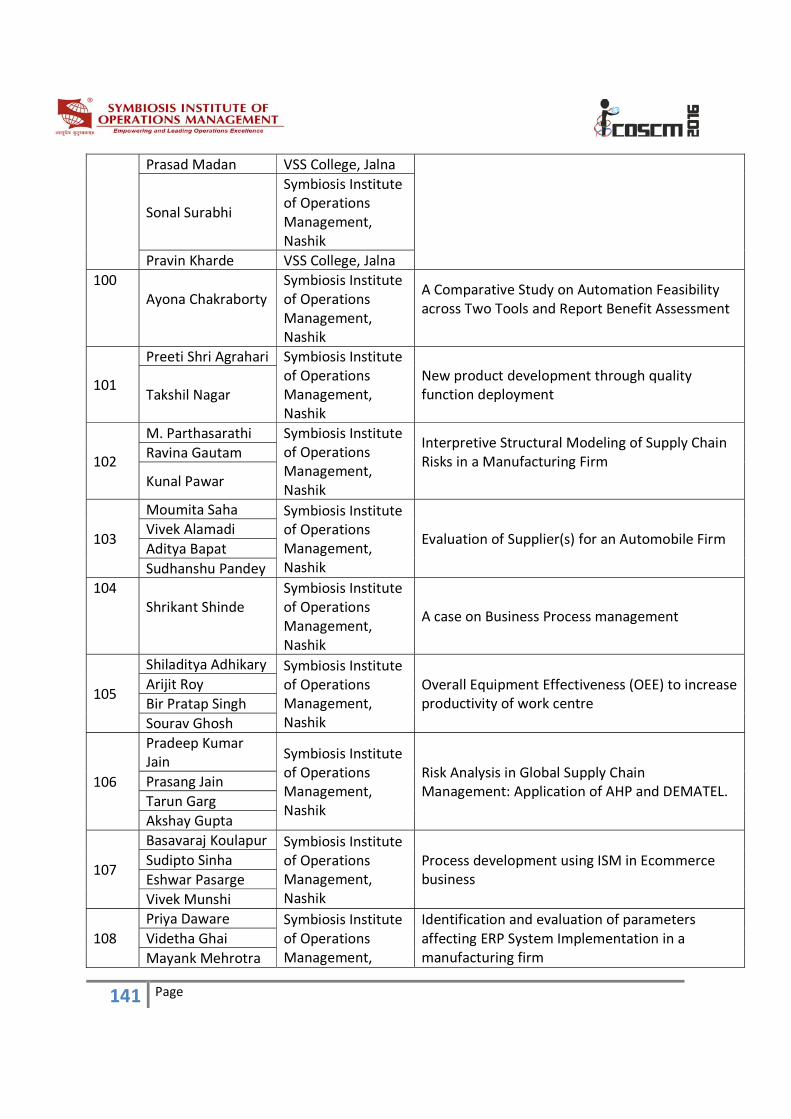
141 Page
Prasad Madan VSS College, Jalna
Sonal Surabhi
Symbiosis Institute of Operations Management, Nashik
Pravin Kharde VSS College, Jalna
100 Ayona Chakraborty
Symbiosis Institute of Operations Management, Nashik
A Comparative Study on Automation Feasibility across Two Tools and Report Benefit Assessment
101
Preeti Shri Agrahari Symbiosis Institute of Operations Management, Nashik
New product development through quality function deployment Takshil Nagar
102
M. Parthasarathi Symbiosis Institute of Operations Management, Nashik
Interpretive Structural Modeling of Supply Chain Risks in a Manufacturing Firm
Ravina Gautam
Kunal Pawar
103
Moumita Saha Symbiosis Institute of Operations Management, Nashik
Evaluation of Supplier(s) for an Automobile Firm Vivek Alamadi
Aditya Bapat
Sudhanshu Pandey
104 Shrikant Shinde
Symbiosis Institute of Operations Management, Nashik
A case on Business Process management
105
Shiladitya Adhikary Symbiosis Institute of Operations Management, Nashik
Overall Equipment Effectiveness (OEE) to increase productivity of work centre
Arijit Roy
Bir Pratap Singh
Sourav Ghosh
106
Pradeep Kumar Jain
Symbiosis Institute of Operations Management, Nashik
Risk Analysis in Global Supply Chain Management: Application of AHP and DEMATEL.
Prasang Jain
Tarun Garg
Akshay Gupta
107
Basavaraj Koulapur Symbiosis Institute of Operations Management, Nashik
Process development using ISM in Ecommerce business
Sudipto Sinha
Eshwar Pasarge
Vivek Munshi
108
Priya Daware Symbiosis Institute of Operations Management,
Identification and evaluation of parameters affecting ERP System Implementation in a manufacturing firm
Videtha Ghai
Mayank Mehrotra
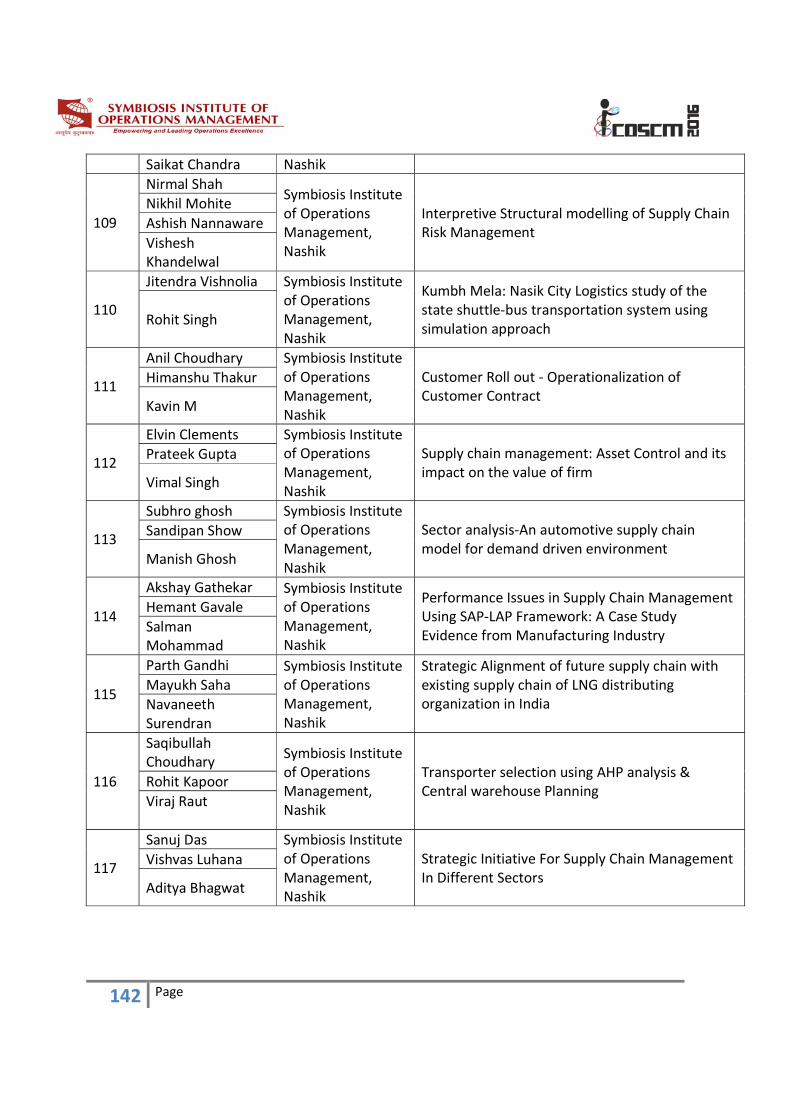
142 Page
Saikat Chandra Nashik
109
Nirmal Shah Symbiosis Institute of Operations Management, Nashik
Interpretive Structural modelling of Supply Chain Risk Management
Nikhil Mohite
Ashish Nannaware
Vishesh Khandelwal
110
Jitendra Vishnolia Symbiosis Institute of Operations Management, Nashik
Kumbh Mela: Nasik City Logistics study of the state shuttle‐bus transportation system using simulation approach
Rohit Singh
111
Anil Choudhary Symbiosis Institute of Operations Management, Nashik
Customer Roll out ‐ Operationalization of Customer Contract
Himanshu Thakur
Kavin M
112
Elvin Clements Symbiosis Institute of Operations Management, Nashik
Supply chain management: Asset Control and its impact on the value of firm
Prateek Gupta
Vimal Singh
113
Subhro ghosh Symbiosis Institute of Operations Management, Nashik
Sector analysis‐An automotive supply chain model for demand driven environment
Sandipan Show
Manish Ghosh
114
Akshay Gathekar Symbiosis Institute of Operations Management, Nashik
Performance Issues in Supply Chain Management Using SAP‐LAP Framework: A Case Study Evidence from Manufacturing Industry
Hemant Gavale
Salman Mohammad
115
Parth Gandhi Symbiosis Institute of Operations Management, Nashik
Strategic Alignment of future supply chain with existing supply chain of LNG distributing organization in India
Mayukh Saha
Navaneeth Surendran
116
Saqibullah Choudhary
Symbiosis Institute of Operations Management, Nashik
Transporter selection using AHP analysis & Central warehouse Planning
Rohit Kapoor
Viraj Raut
117
Sanuj Das Symbiosis Institute of Operations Management, Nashik
Strategic Initiative For Supply Chain Management In Different Sectors
Vishvas Luhana
Aditya Bhagwat
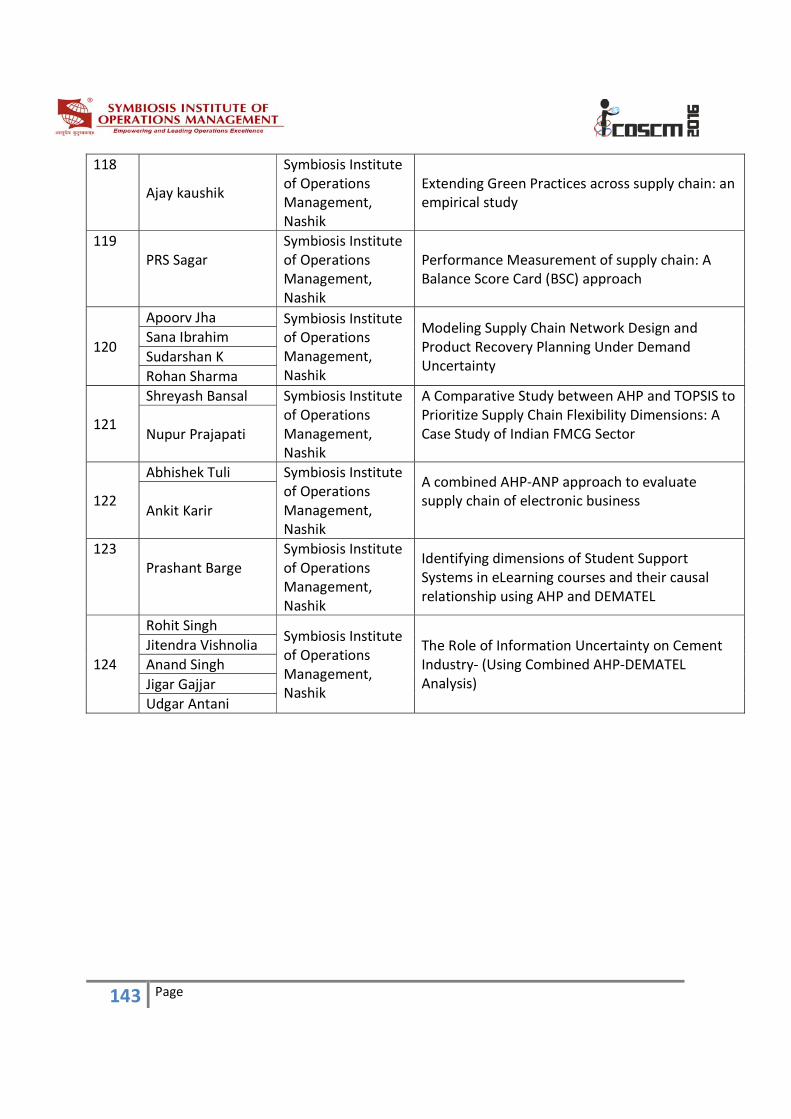
143 Page
118
Ajay kaushik
Symbiosis Institute of Operations Management, Nashik
Extending Green Practices across supply chain: an empirical study
119 PRS Sagar
Symbiosis Institute of Operations Management, Nashik
Performance Measurement of supply chain: A Balance Score Card (BSC) approach
120
Apoorv Jha Symbiosis Institute of Operations Management, Nashik
Modeling Supply Chain Network Design and Product Recovery Planning Under Demand Uncertainty
Sana Ibrahim
Sudarshan K
Rohan Sharma
121
Shreyash Bansal Symbiosis Institute of Operations Management, Nashik
A Comparative Study between AHP and TOPSIS to Prioritize Supply Chain Flexibility Dimensions: A Case Study of Indian FMCG Sector
Nupur Prajapati
122
Abhishek Tuli Symbiosis Institute of Operations Management, Nashik
A combined AHP‐ANP approach to evaluate supply chain of electronic business
Ankit Karir
123 Prashant Barge
Symbiosis Institute of Operations Management, Nashik
Identifying dimensions of Student Support Systems in eLearning courses and their causal relationship using AHP and DEMATEL
124
Rohit Singh Symbiosis Institute of Operations Management, Nashik
The Role of Information Uncertainty on Cement Industry‐ (Using Combined AHP‐DEMATEL Analysis)
Jitendra Vishnolia
Anand Singh
Jigar Gajjar
Udgar Antani
144 Page
Leadership
HONORARY PATRON
(FOUNDER PRESIDENT – SYMBIOSIS SOCIETY,
CHANCELLOR – SIU): Prof. (Dr.) S. B. Mujumdar
HONORARY PATRON (PRINCIPAL DIRECTOR – SYMBIOSIS SOCIETY): Dr. Vidya Yeravdekar
CHIEF PATRON (VICE CHANCELLOR – SIU): Prof. Rajani Gupte
Organizing Team
PATRON (DIRECTOR – SIOM, NASHIK): Prof. Vandana Sonwaney
CONVENER (FACULTY, SIOM): Prof. Rohit Singh
CO‐CONVENER (FACULTY, SIOM): Prof. P.A Ratna
ORGANIZING SECRETARY (FACULTY, SIOM): Prof. Rohit Singh
Prof. Aditi Mishal
Prof. Rishabh Jain
ORGANIZING COMMITTEE MEMBERS (FACULTY, SIOM): Prof. Shiba Parhi
Prof. Surendra Kansara
Prof. Yashomandira Kharde
Prof. Prashant Barge
Prof. Mrunalini Dodkey
Prof. Aasha Sharma
Prof. Shilpa Parkhi

145 Page
STUDENT CONVENER (STUDENTS, SIOM): ‐ Jitendra Vishnolia
Sriparna Nandi
Arun Goyal
Sonal Surabhi
STUDENT SECRETARY (STUDENT, SIOM): Rohit Pande
VERTICAL HEADS (STUDENTS, SIOM): Himanshu Thakur
Avinash Karthik
Chetan Saxena
Jigar Gajjar
Aditya Bhagwat
Anand Singh
Rahul Mishra
Manish Puri