ABPS Infrastructure Advisory. Legal and Policy Framework for promotion of RE.
116
ABPS Infrastructure Advisory
-
Upload
polly-bennett -
Category
Documents
-
view
215 -
download
0
Transcript of ABPS Infrastructure Advisory. Legal and Policy Framework for promotion of RE.
ABPS Infrastructure Advisory

Legal and Policy Framework for
promotion of RE

Legal Framework
Federal Structure
Electricity is a concurrent subject.
Central legislation:
Electricity Act, 2003
Basic policy and regulatory framework
Regulatory Framework
Central level
Central Electricity Regulatory Commission (CERC) (inter-State issues)
Province level
State Electricity Regulatory Commission (SERCs) (intra-State issues)
Forum of Regulators - for harmonization
3

The Electricity Act, 2003 Enabling provisions
Section 86(1)(e): Specify Renewable Purchase Obligation
(RPO) from renewable energy sources
Section 61(h): Tariff regulations to be guided by promotion of
renewable energy sources
Section 3: National Electricity Policy, Tariff Policy and Plan
Section 4: National Policy permitting stand alone systems
including renewable sources of energy for rural areas
4
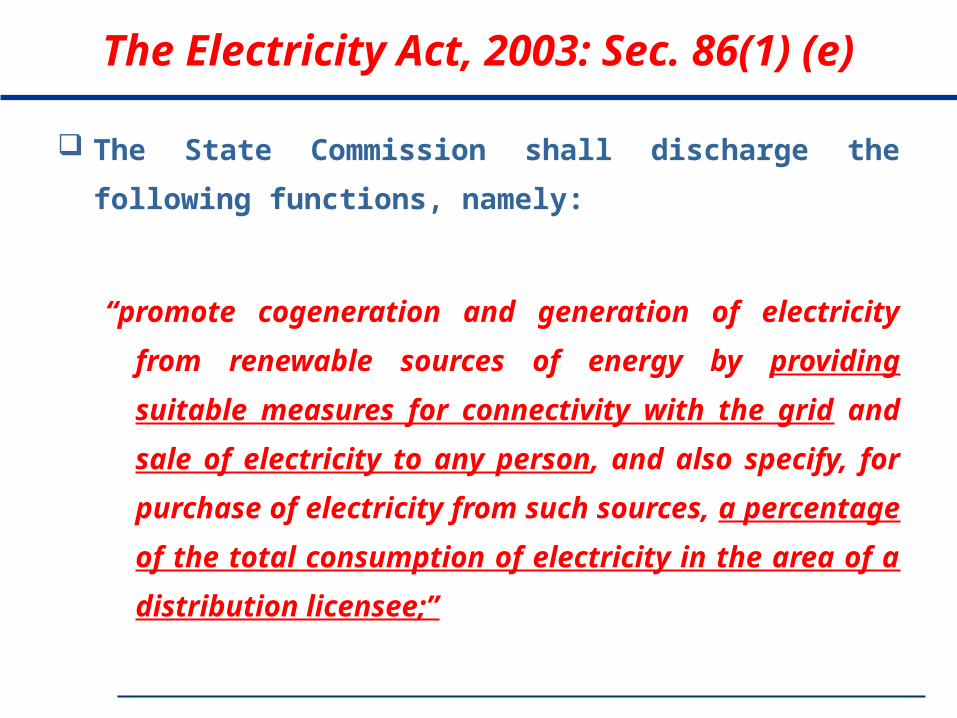
The Electricity Act, 2003: Sec. 86(1) (e)
The State Commission shall discharge the following
functions, namely:
“promote cogeneration and generation of electricity from
renewable sources of energy by providing suitable
measures for connectivity with the grid and sale of
electricity to any person, and also specify, for
purchase of electricity from such sources, a
percentage of the total consumption of electricity in
the area of a distribution licensee;”
5

The Electricity Act, 2003: Sec. 61(h)
The Appropriate Commission shall, subject to the
provisions of this Act, specify the terms and
conditions for the determination of tariff, and in
doing so, shall be guided by the following, namely:-
(h) the promotion of co-generation and generation of
electricity from renewable sources of energy;
6
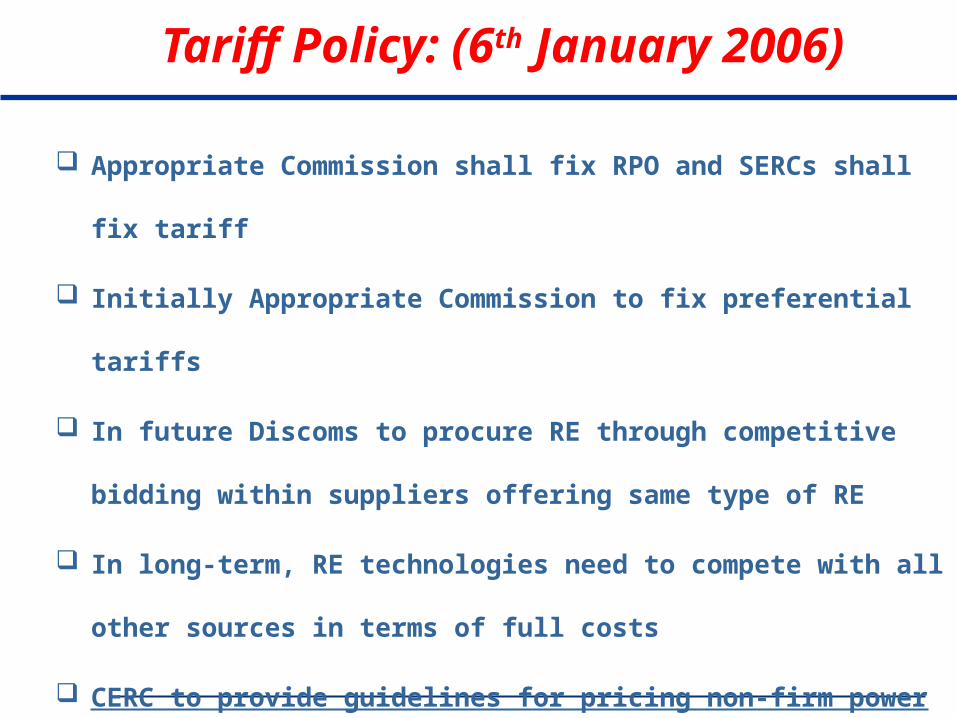
Tariff Policy: (6th January 2006)
Appropriate Commission shall fix RPO and SERCs shall fix tariff
Initially Appropriate Commission to fix preferential tariffs
In future Discoms to procure RE through competitive bidding
within suppliers offering same type of RE
In long-term, RE technologies need to compete with all other
sources in terms of full costs
CERC to provide guidelines for pricing non-firm power if RE
procurement is not through competitive bidding
7

National Electricity Policy: (12th February, 05)
Urgent need of promotion of renewable sources of energy
Efforts need to be made to reduce the capital cost
Cost of energy can be reduced by promoting competition
Adequate promotional measures would have to be taken for
development of technologies and its sustained growth
SERCs to provide suitable measures for connectivity with grid
and fix percentage of purchase from Renewable sources
Progressively the such share of electricity need to be increased
8

National Action Plan on Climate Change (NAPCC), 2008
National level target for RE Purchase
5% of total grid purchase in 2010, to be increased by 1% each year
for 10 years: 15% by 2020
SERCs may set higher target
Appropriate authorities may issue certificates that procure RE
in excess of the national standard
Such certificates may be tradable, to enable utilities falling short to
meet their RPO
RE generation capacity needed: From 25000 to 45000 MW by FY2015
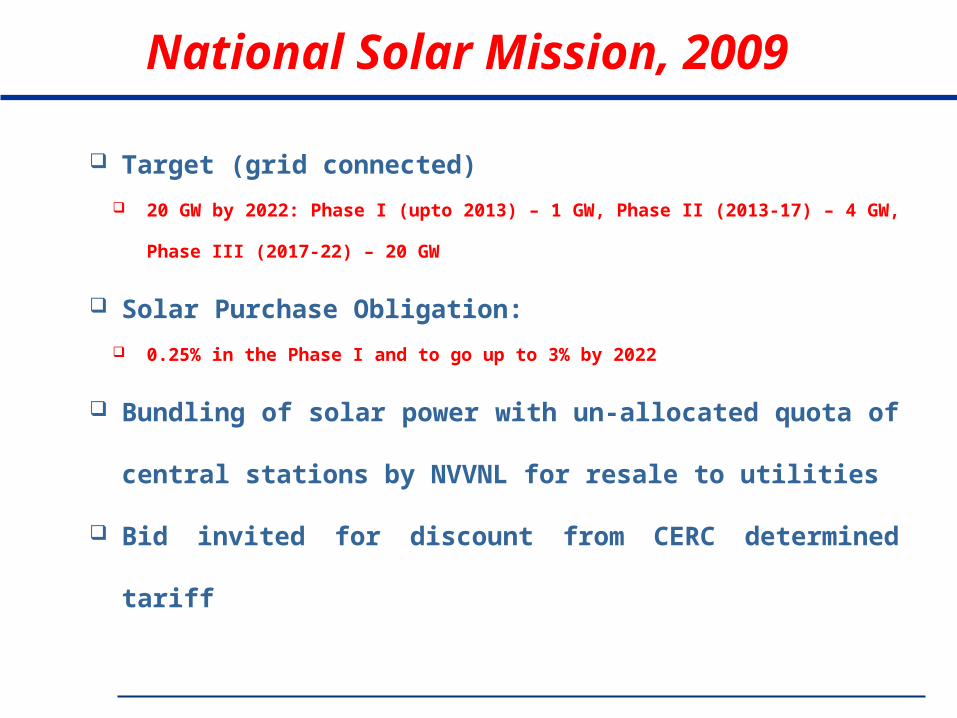
National Solar Mission, 2009
10
Target (grid connected)
20 GW by 2022: Phase I (upto 2013) – 1 GW, Phase II (2013-17) – 4 GW, Phase III
(2017-22) – 20 GW
Solar Purchase Obligation:
0.25% in the Phase I and to go up to 3% by 2022
Bundling of solar power with un-allocated quota of central
stations by NVVNL for resale to utilities
Bid invited for discount from CERC determined tariff

Regulatory Intervention
• Renewable Purchase Obligation (RPO)
• Preferential Tariff
• Facilitative Framework for Grid Connectivity
• Market Development (Tradable Renewable Energy Certificates)
11

12
Renewable Energy Tariff Design

ABPS Infrastructure Advisory
GENERAL PRINCIPLESGENERAL PRINCIPLES
General Principles
Tariff Period
Tariff Design
Tariff Period
Control Period
Project Specific Tariff
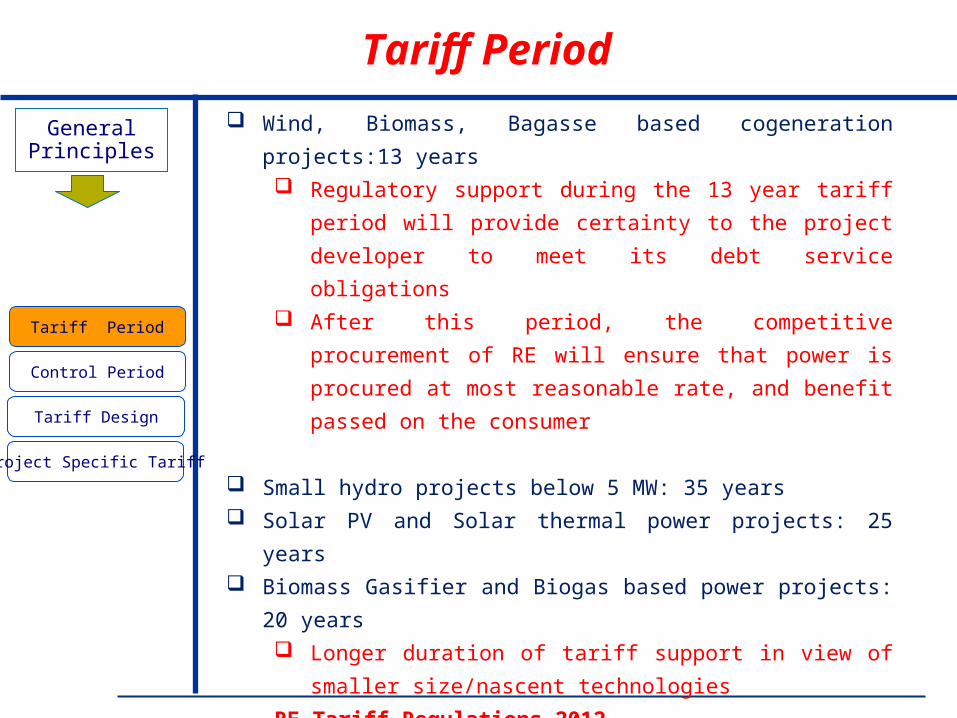
Wind, Biomass, Bagasse based cogeneration projects:13 years Regulatory support during the 13 year tariff period will provide
certainty to the project developer to meet its debt service
obligations After this period, the competitive procurement of RE will
ensure that power is procured at most reasonable rate, and
benefit passed on the consumer
Small hydro projects below 5 MW: 35 years Solar PV and Solar thermal power projects: 25 years Biomass Gasifier and Biogas based power projects: 20 years
Longer duration of tariff support in view of smaller
size/nascent technologies
RE Tariff Regulations-2012 Regulation modified to substitute the expression “shall be thirteen
(13) years” by the expression “shall be for a minimum period of
thirteen (13) years”
General Principles
Control Period
Tariff Design
Tariff Period
Control Period
Project Specific Tariff
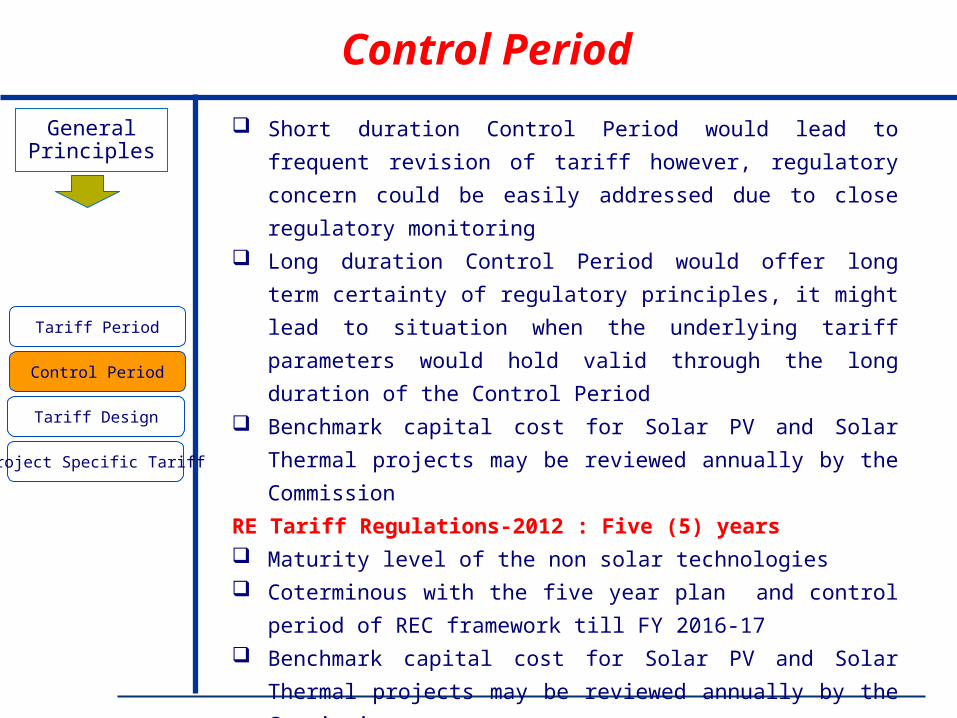
Short duration Control Period would lead to frequent revision of
tariff however, regulatory concern could be easily addressed due
to close regulatory monitoring Long duration Control Period would offer long term certainty of
regulatory principles, it might lead to situation when the underlying
tariff parameters would hold valid through the long duration of the
Control Period Benchmark capital cost for Solar PV and Solar Thermal projects
may be reviewed annually by the Commission
RE Tariff Regulations-2012 : Five (5) years Maturity level of the non solar technologies Coterminous with the five year plan and control period of REC
framework till FY 2016-17 Benchmark capital cost for Solar PV and Solar Thermal projects
may be reviewed annually by the Commission Biomass price will be reviewed at the end of the third year of the
Control period in order to take care of any price volatility
General Principles
Tariff Design
Tariff Design
Tariff period
Control Period
Project Specific Tariff
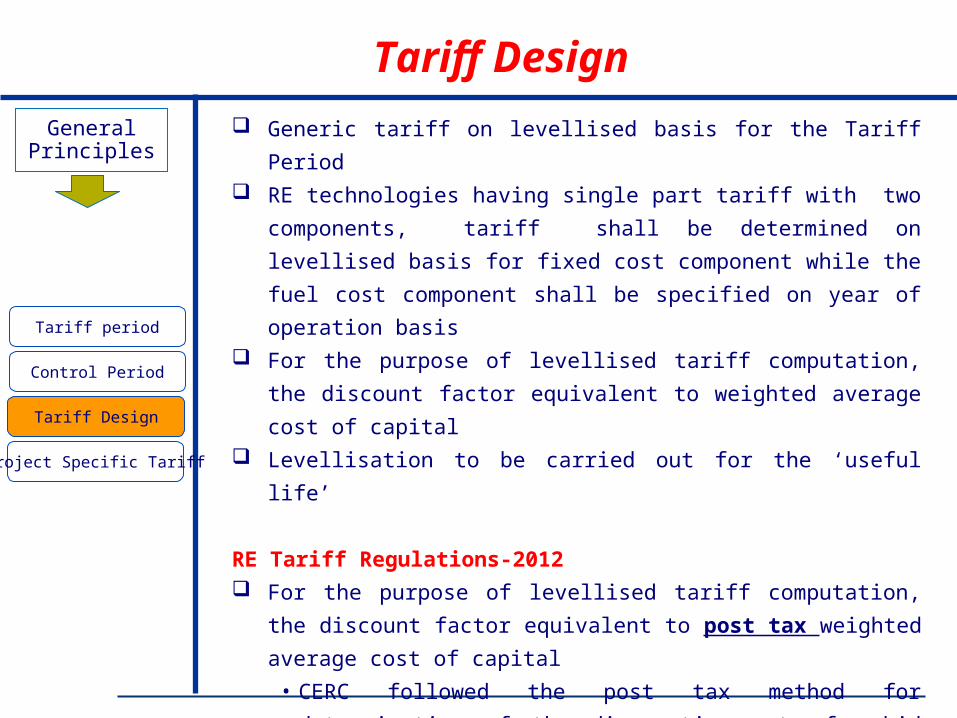
Generic tariff on levellised basis for the Tariff Period RE technologies having single part tariff with two components, tariff
shall be determined on levellised basis for fixed cost component
while the fuel cost component shall be specified on year of operation
basis For the purpose of levellised tariff computation, the discount factor
equivalent to weighted average cost of capital Levellisation to be carried out for the ‘useful life’
RE Tariff Regulations-2012 For the purpose of levellised tariff computation, the discount factor
equivalent to post tax weighted average cost of capital
• CERC followed the post tax method for determination of the
discounting rate for bid evaluation
• while taking the investment decisions developer considers post
tax WACC as the discount rate to post tax incremental cash flows
to arrive at NPV of the project.
General Principles
Project Specific Tariff
Tariff Design
Tariff period
Control Period
Project Specific Tariff
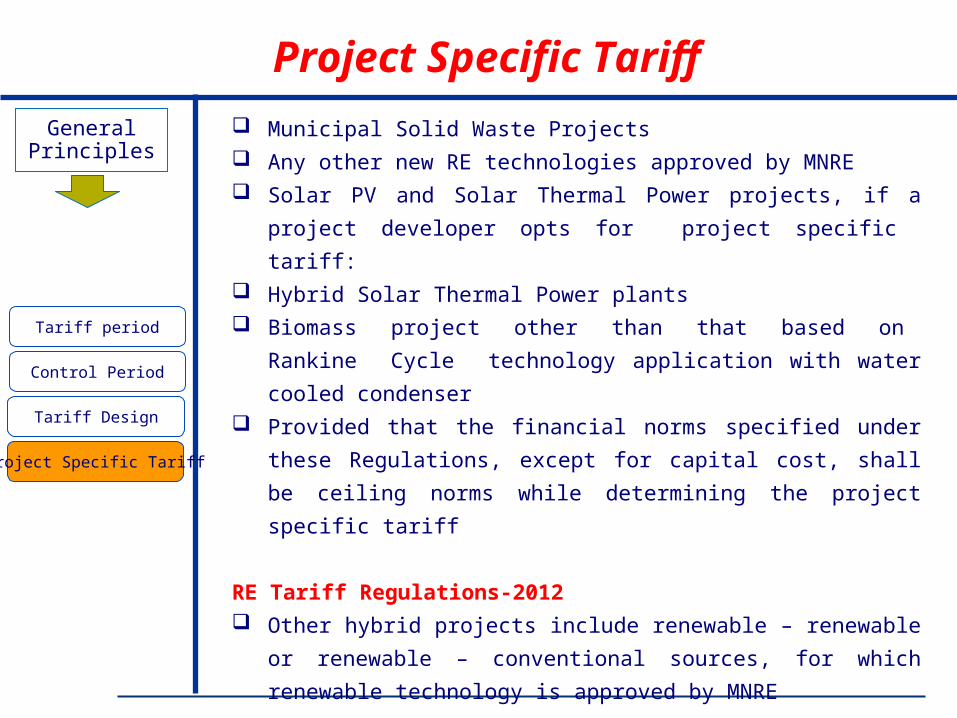
Municipal Solid Waste Projects Any other new RE technologies approved by MNRE Solar PV and Solar Thermal Power projects, if a project developer
opts for project specific tariff: Hybrid Solar Thermal Power plants Biomass project other than that based on Rankine Cycle
technology application with water cooled condenser Provided that the financial norms specified under these Regulations,
except for capital cost, shall be ceiling norms while determining the
project specific tariff
RE Tariff Regulations-2012 Other hybrid projects include renewable – renewable or renewable –
conventional sources, for which renewable technology is approved by
MNRE

ABPS Infrastructure Advisory
FINANCIAL PRINCIPLESFINANCIAL PRINCIPLES

Financial Principles
Reg. 13: Debt Equity Ratio
Interest Rate
Return on Equity
Depreciation
RE Tariff Regulations-2012 Debt to equity ratio of 70:30 has been specified Further, for RE projects where equity employed is more than 30% (in
case of project specific tariff determination), the amount of equity for the
purpose for determining the tariff shall be limited to 30% only whereas in
case the equity employed is less than 30%, the actual equity employed
shall be considered.
The Tariff Policy notified by the Government of India, stipulates
consideration of debt equity ratio of 70:30 for financing all future projects. CERC Tariff Regulations, 2009 also provide for normative debt-equity
ratio of 70:30 for Generating Company/licensee. Regulatory Commissions across different States for RE projects have
been following the same principle laid down in the TP.
Loan Tenure
Debt Equity Ratio
Interest rate on WC
O &M Escalation
Sharing of CDM
Subsidy or Incentive
Taxes & Duties

Financial Principles
Loan Tenure
Interest Rate
Return on Equity
Depreciation
RE Tariff Regulations-2009
• loan tenure of 10 years
Draft RE Tariff Regulations-2012
• Proposed loan tenure of 12 years
Comments received
• Majority of Stakeholders have suggested considering 10 years as loan
tenure for Renewable Energy projects.
• IREDA does not offer a term loan repayment period of 12 years
• Even if tenure beyond 10 years is offered then it comes with additional
interest rate
• Solar PV is still considered a nascent technology in Indian context, loan
repayment tenure of 10 years should be considered with proportionate
increase in depreciation so as to ensure loan repayment as per
envisaged repayment period.
RE Tariff Regulations-2012 loan tenure of 12 years
Loan Tenure
Debt Equity Ratio
Interest rate on WC
O &M Escalation
Sharing of CDM
Subsidy or Incentive
Taxes & Duties

Financial Principles
Reg. 14: Interest Rate
Interest Rate
Return on Equity
Depreciation
Loan Tenure
Debt Equity Ratio
Interest rate on WC
O &M Escalation
Sharing of CDM
Subsidy or Incentive
Taxes & Duties
RE Tariff Regulations-2009
• 150 basis points above average SBI – LTPLR , as on 1st April of the
relevant year of the Control Period
• W.e.f. 1.07.2010, SBI replaced BPLR regime by regime of Base Rate
• IREDA/PFC classify borrowers/investors into four grades and depending
on the grade charge interest rate from 11 to 13.50% depending upon the
renewable energy technology.
• Matured technologies are being financed at lower interest rate
• RE Tariff Regulation-2012: Normative interest rate of 300 basis points
above Average SBI Base Rate prevalent during the first six months of
previous year of the relevant year of the Control Period
Grade I Grade II Grade III Grade IV
Schedule-A, AAA. Rated PSU
11.00
State Sector 11.00 11.25 11.50 11.75
Wind, Cogen, Hydro 11.75 12.00 12.25 12.5
Solar PV 12.25 12.50 12.75 13.00
Solar Thermal 12.50 12.75 13.00 13.25
Other Sectors 13.50
Financial Principles
Reg. 13: Depreciation
Interest Rate
Return on Equity
Depreciation
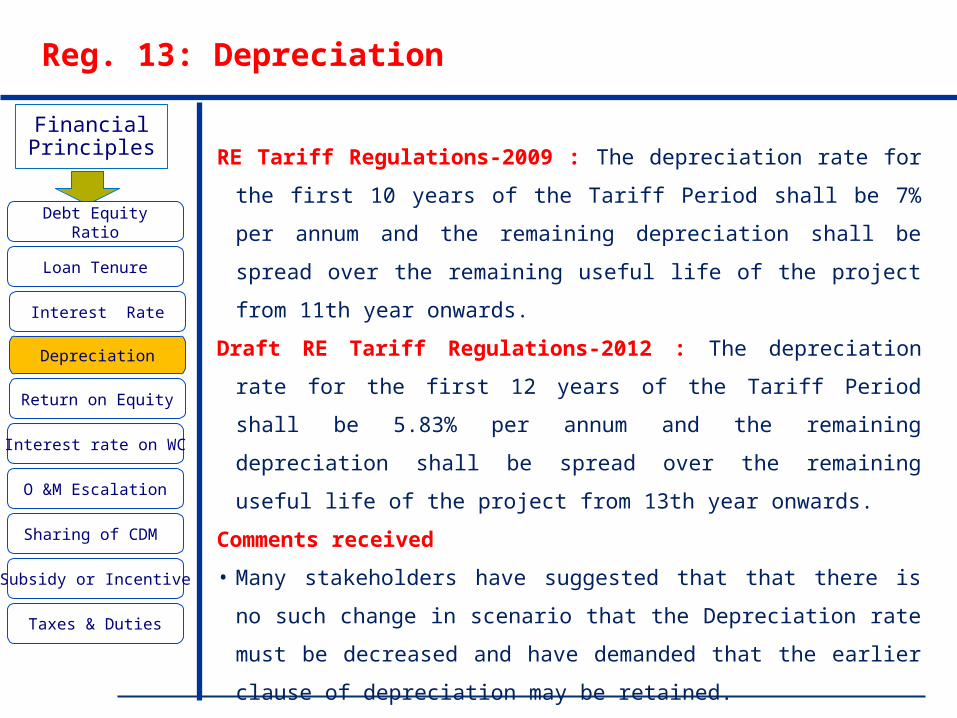
RE Tariff Regulations-2009 : The depreciation rate for the first 10 years
of the Tariff Period shall be 7% per annum and the remaining
depreciation shall be spread over the remaining useful life of the project
from 11th year onwards.
Draft RE Tariff Regulations-2012 : The depreciation rate for the first 12
years of the Tariff Period shall be 5.83% per annum and the remaining
depreciation shall be spread over the remaining useful life of the project
from 13th year onwards.
Comments received
• Many stakeholders have suggested that that there is no such change in
scenario that the Depreciation rate must be decreased and have
demanded that the earlier clause of depreciation may be retained.
RE Tariff Regulations-2012 : Retained as per the draft regulations
Loan Tenure
Debt Equity Ratio
Interest rate on WC
O &M Escalation
Sharing of CDM
Subsidy or Incentive
Taxes & Duties
Financial Principles
Return on Equity
Interest Rate
Return on Equity
Depreciation
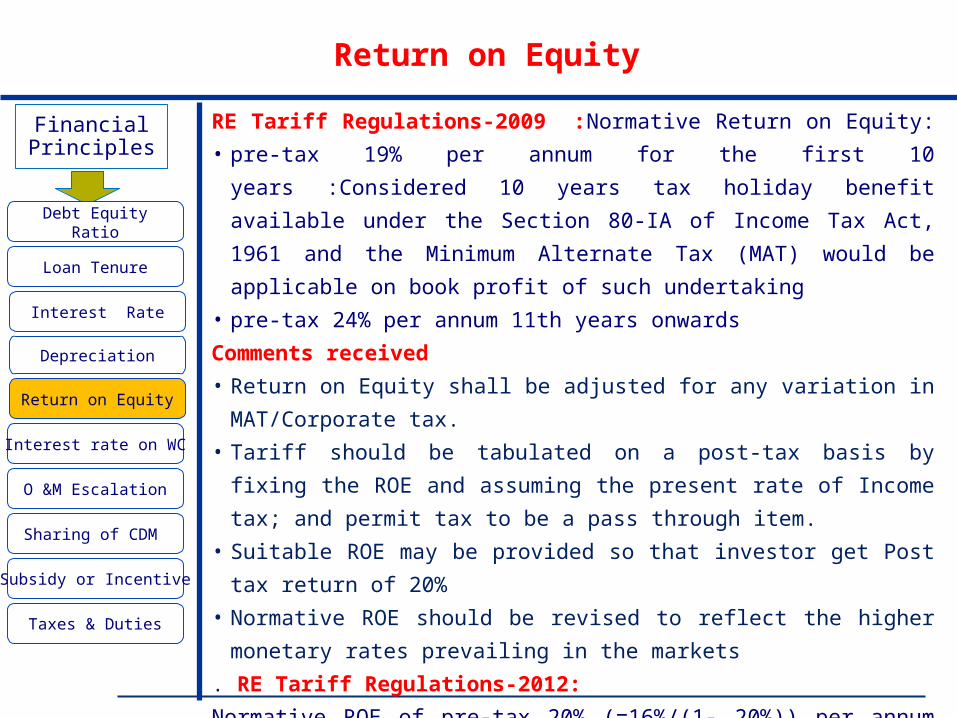
RE Tariff Regulations-2009 :Normative Return on Equity:
• pre-tax 19% per annum for the first 10 years :Considered 10 years tax
holiday benefit available under the Section 80-IA of Income Tax Act, 1961
and the Minimum Alternate Tax (MAT) would be applicable on book profit
of such undertaking
• pre-tax 24% per annum 11th years onwards
Comments received
• Return on Equity shall be adjusted for any variation in MAT/Corporate tax.
• Tariff should be tabulated on a post-tax basis by fixing the ROE and
assuming the present rate of Income tax; and permit tax to be a pass
through item.
• Suitable ROE may be provided so that investor get Post tax return of 20%
• Normative ROE should be revised to reflect the higher monetary rates
prevailing in the markets
. RE Tariff Regulations-2012:
Normative ROE of pre-tax 20% (=16%/(1- 20%)) per annum for the first 10
years and pre-tax 24% (=16%/(1- 32.445%)) per annum 11th years
onwards considering 20% MAT rate and 32.445% Corporate Tax rate
Loan Tenure
Debt Equity Ratio
Interest rate on WC
O &M Escalation
Sharing of CDM
Subsidy or Incentive
Taxes & Duties

Financial Principles
Working Capital
Interest Rate
Return on Equity
Depreciation
• RE Tariff Regulations-2009:
(a) Wind Energy / Small Hydro Power
(i) Operation & Maintenance expense for one month,
(ii) Receivables equivalent to 2 months of energy charges for sale of
electricity calculated on the normative CUF.
(iii) Maintenance spare @ 15% of operation and maintenance expenses.
(b) Biomass Power and Non-fossil fuel Co-generation
(i) Fuel costs for four months equivalent to normative PLF
(ii) Operation & Maintenance expense for one month,
(iii) Receivables equivalent to 2 months of fixed and variable charges for
sale of electricity calculated on the target PLF.
(iv) Maintenance spare @ 15% of operation and maintenance expenses
Comments received
• Receivables: 3 months instead of 2 months, Fuel cost : 6 months instead
of 4 months, O&M cost: 6 months instead of 1 month
• Maintenance Spares: 20% of O & M cost instead of 15%
RE Tariff Regulations-2012
• Retained as per 2009 Regulations
Loan Tenure
Debt Equity Ratio
Interest rate on WC
O &M Escalation
Sharing of CDM
Subsidy or Incentive
Taxes & Duties
Financial Principles
Interest on Working Capital
Interest Rate
Return on Equity
Depreciation
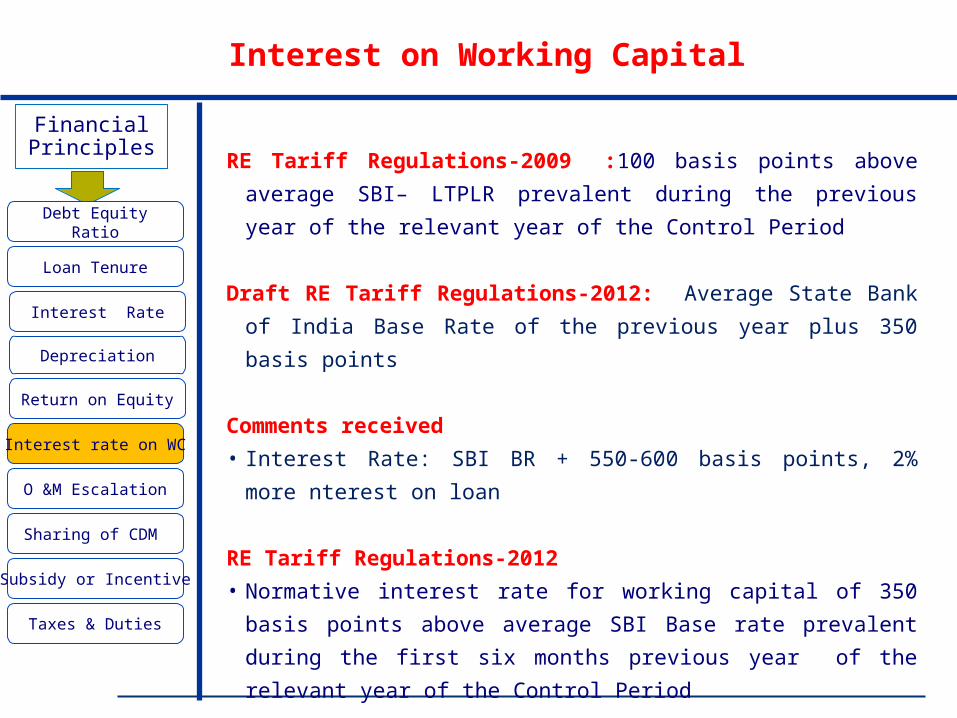
RE Tariff Regulations-2009 :100 basis points above average SBI–
LTPLR prevalent during the previous year of the relevant year of the
Control Period
Draft RE Tariff Regulations-2012: Average State Bank of India Base
Rate of the previous year plus 350 basis points
Comments received
• Interest Rate: SBI BR + 550-600 basis points, 2% more nterest on loan
RE Tariff Regulations-2012
• Normative interest rate for working capital of 350 basis points above
average SBI Base rate prevalent during the first six months previous
year of the relevant year of the Control Period
Loan Tenure
Debt Equity Ratio
Interest rate on WC
O &M Escalation
Sharing of CDM
Subsidy or Incentive
Taxes & Duties
Financial Principles
O & M Escalation:
Interest Rate
Return on Equity
Depreciation
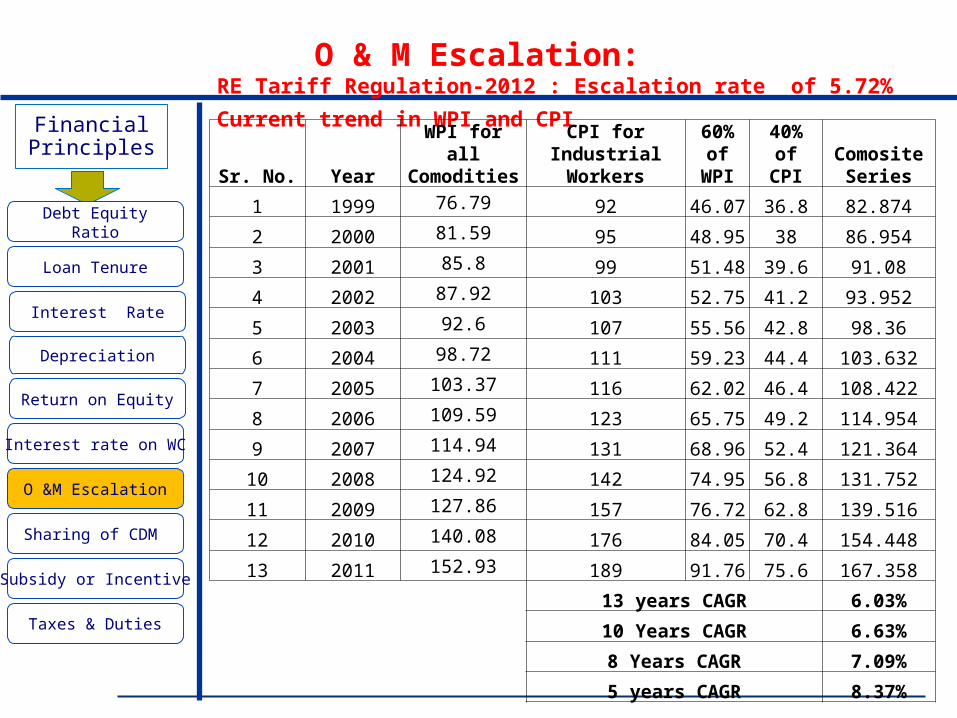
RE Tariff Regulation-2012 : Escalation rate of 5.72%
Current trend in WPI and CPI
Loan Tenure
Debt Equity Ratio
Interest rate on WC
O &M Escalation
Sharing of CDM
Subsidy or Incentive
Taxes & Duties
Sr. No. YearWPI for all Comodities
CPI for Industrial Workers
60% of WPI
40% of CPI
Comosite Series
1 1999 76.79 92 46.07 36.8 82.874
2 2000 81.59 95 48.95 38 86.954
3 2001 85.8 99 51.48 39.6 91.08
4 2002 87.92 103 52.75 41.2 93.952
5 2003 92.6 107 55.56 42.8 98.36
6 2004 98.72 111 59.23 44.4 103.632
7 2005 103.37 116 62.02 46.4 108.422
8 2006 109.59 123 65.75 49.2 114.954
9 2007 114.94 131 68.96 52.4 121.364
10 2008 124.92 142 74.95 56.8 131.752
11 2009 127.86 157 76.72 62.8 139.516
12 2010 140.08 176 84.05 70.4 154.448
13 2011 152.93 189 91.76 75.6 167.358
13 years CAGR 6.03%
10 Years CAGR 6.63%
8 Years CAGR 7.09%
5 years CAGR 8.37%

Financial Principles
Sharing of CDM
Interest Rate
Return on Equity
Depreciation
Draft RE Tariff Regulations-2012: As per 2009 Regulations
Comments received
• Most of the stakeholders suggested that 100% gross proceeds of CDM
benefits are allowed to be retained by the project developer
• Sharing of CDM benefit, if any, shoulld be applicable only after the sale
proceeds from CERs are received by Project Developer
RE Tariff Regulations-2012
• As regards sharing of CDM benefits, Commission considered the
stipulations made under the tariff policy, recommendations by Forum of
Regulators (FOR) under its Report on Policies for Renewable Energy
and the similar provision in the tariff regulations for conventional power.
• Clarifed in the Statement of Reasons that the sharing of CDM benefit, if
any, shall be applicable only after the sale proceeds from CERs are
received by Project Developer and not from date of commissioning.
Loan Tenure
Debt Equity Ratio
Interest rate on WC
O &M Escalation
Sharing of CDM
Subsidy or Incentive
Taxes & Duties
Financial Principles
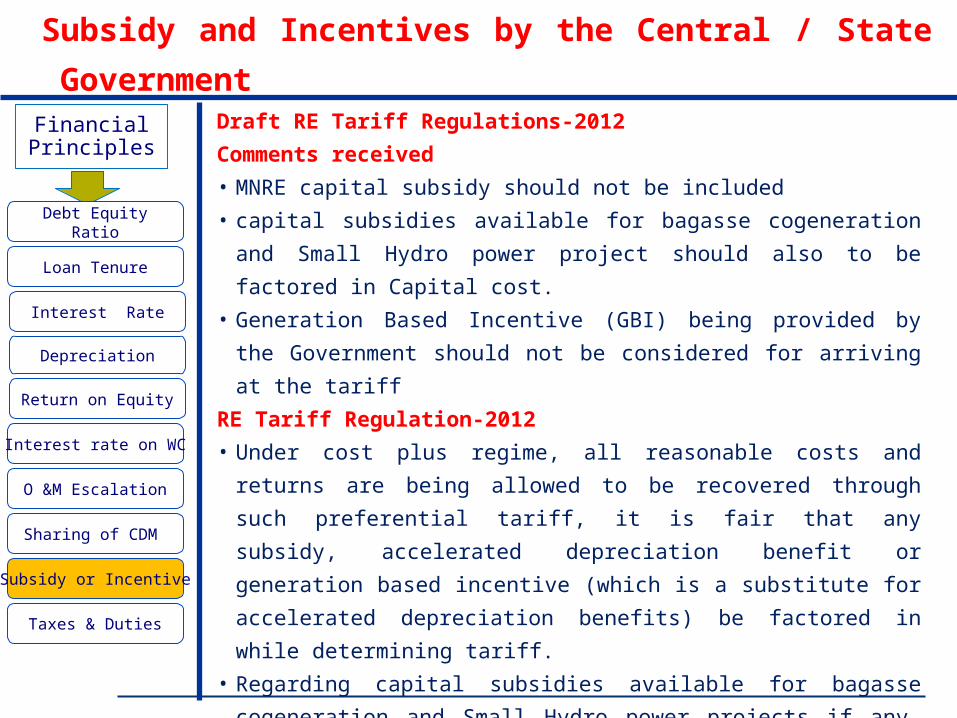
Subsidy and Incentives by the Central / State Government
Interest Rate
Return on Equity
Depreciation
Draft RE Tariff Regulations-2012
Comments received
• MNRE capital subsidy should not be included
• capital subsidies available for bagasse cogeneration and Small Hydro
power project should also to be factored in Capital cost.
• Generation Based Incentive (GBI) being provided by the Government
should not be considered for arriving at the tariff
RE Tariff Regulation-2012
• Under cost plus regime, all reasonable costs and returns are being
allowed to be recovered through such preferential tariff, it is fair that any
subsidy, accelerated depreciation benefit or generation based incentive
(which is a substitute for accelerated depreciation benefits) be factored
in while determining tariff.
• Regarding capital subsidies available for bagasse cogeneration and
Small Hydro power projects if any, factored in the same in the final
Regulation.
Loan Tenure
Debt Equity Ratio
Interest rate on WC
O &M Escalation
Sharing of CDM
Subsidy or Incentive
Taxes & Duties
Financial Principles
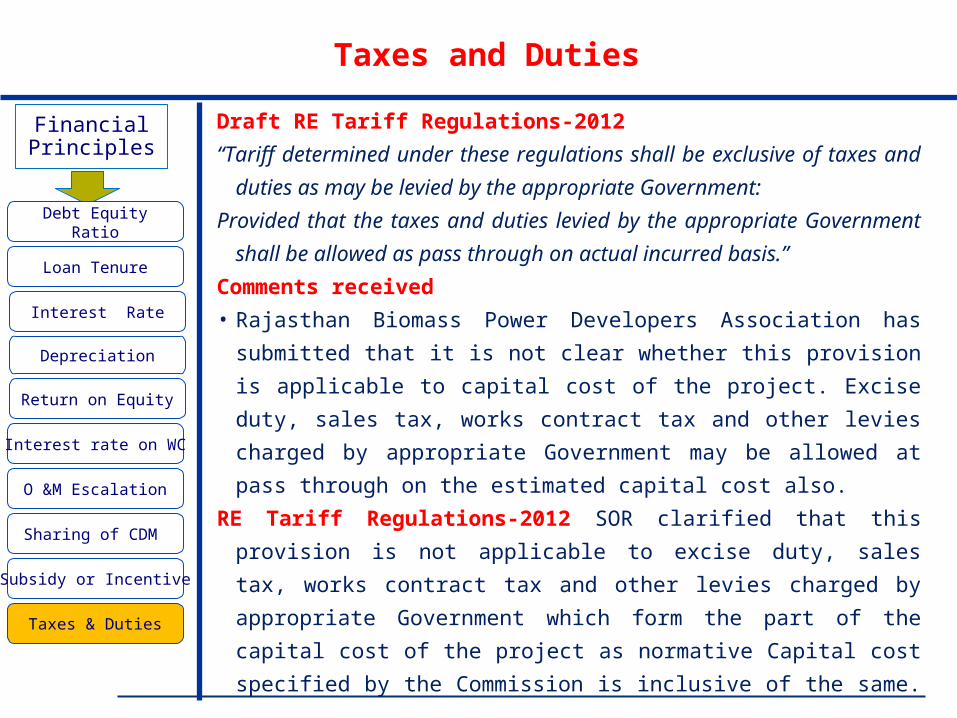
Taxes and Duties
Interest Rate
Return on Equity
Depreciation
Draft RE Tariff Regulations-2012
“Tariff determined under these regulations shall be exclusive of taxes and
duties as may be levied by the appropriate Government:
Provided that the taxes and duties levied by the appropriate Government
shall be allowed as pass through on actual incurred basis.”
Comments received
• Rajasthan Biomass Power Developers Association has submitted that it
is not clear whether this provision is applicable to capital cost of the
project. Excise duty, sales tax, works contract tax and other levies
charged by appropriate Government may be allowed at pass through on
the estimated capital cost also.
RE Tariff Regulations-2012 SOR clarified that this provision is not
applicable to excise duty, sales tax, works contract tax and other levies
charged by appropriate Government which form the part of the capital
cost of the project as normative Capital cost specified by the
Commission is inclusive of the same.
• Retained the provisions as specified under draft Regulations.
Loan Tenure
Debt Equity Ratio
Interest rate on WC
O &M Escalation
Sharing of CDM
Subsidy or Incentive
Taxes & Duties
TECHNOLOGY SPECIFIC NORMS: WIND ENERGY

Wind
Wind - Capital Cost
Capital Cost
O & M Cost
CUF
RE Tariff Regulations-2009
Year Date of
Order/Regulation
Capital cost
` Lacs/MW
2009-10 17.09.2009 515.00
2010-11 26.02.2010 467.13
2011-12 09.11.2010 492.52

Wind
Wind - Capital Cost
Capital Cost
O & M Cost
CUF
International Trend: Installed Project Cost - USA
U.S. Department of Energy’s report on “2010 Wind Technologies Market Report”: June - 2011 prepared by the Lawrence Berkeley National Laboratory (LBNL)
•1 GW of capacity that either have been or will be built in 2011 suggests
that average installed costs may decline in 2011

Wind
Wind - Capital Cost
Capital Cost
O & M Cost
CUF
International Trend: Turbine Cost - USA
U.S. Department of Energy’s report on “2010 Wind Technologies Market Report”: June - 2011 prepared by the Lawrence Berkeley National Laboratory (LBNL)
•In US total Project costs which were bottomed out in 2001-04; rose by
$850/kW on average through 2009; held steady in 2010 at around
$2,160/kW and appear to be dropping in 2011 at around $2000/kW

Wind
Wind - Capital Cost
Capital Cost
O & M Cost
CUF
Capital Cost considered by other SERCs
Name of the Commission Date of Order/Regulation Capital cost
` Lacs/MW
CERC (2009-10) 17.09.2009 515.00
KERC 11.12.2009 470.00 (inc. evacuation cost)
CERC (2010-11) 26.02.2010 467.13
MPERC 14.05.2010 500.00 (inc. evacuation cost)
OERC
(FY 10-11 to FY12-13)
14.09.2010 467.13 (As per CERC, w/o
escalation)
CERC (2011-12) 09.11.2010 492.52
MERC (2010-11) 29.04.2011 489.53 (As per CERC, with
escalation)
Wind
Wind - Capital Cost
Capital Cost
O & M Cost
CUF
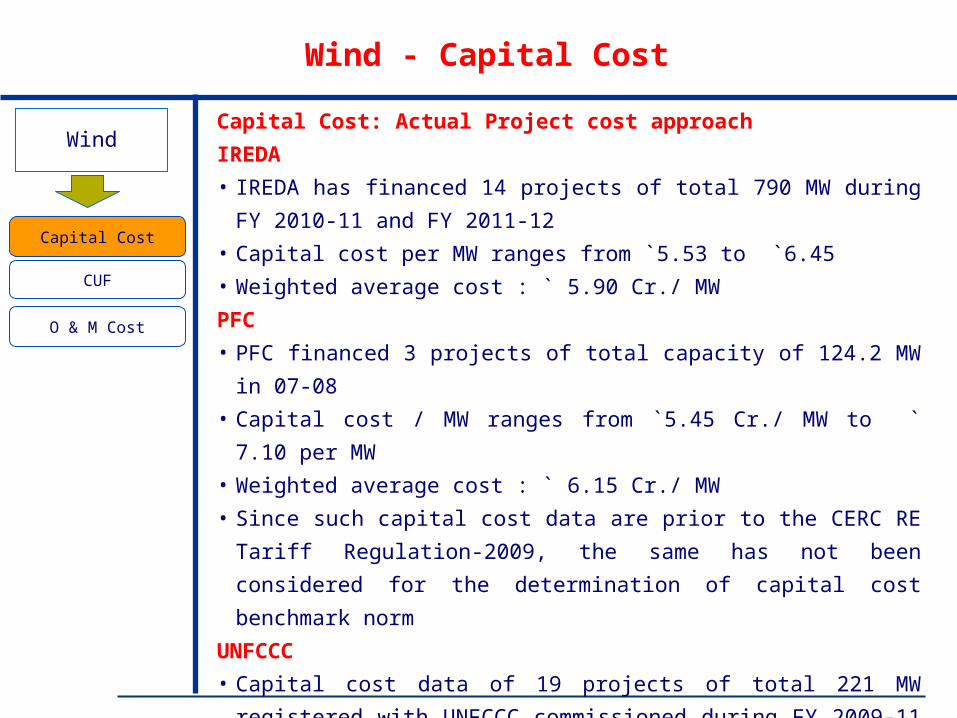
Capital Cost: Actual Project cost approach
IREDA
• IREDA has financed 14 projects of total 790 MW during FY 2010-
11 and FY 2011-12
• Capital cost per MW ranges from `5.53 to `6.45
• Weighted average cost : ` 5.90 Cr./ MW
PFC
• PFC financed 3 projects of total capacity of 124.2 MW in 07-08
• Capital cost / MW ranges from `5.45 Cr./ MW to ` 7.10 per MW
• Weighted average cost : ` 6.15 Cr./ MW
• Since such capital cost data are prior to the CERC RE Tariff
Regulation-2009, the same has not been considered for the
determination of capital cost benchmark norm
UNFCCC
• Capital cost data of 19 projects of total 221 MW registered with
UNFCCC commissioned during FY 2009-11 analyzed
• Capital cost/MW ranges from `4.43 to `6.62 Cr./ MW
• Weighted average cost : `5.32 Cr./ MW

Wind
Wind - Capital Cost
Capital Cost
O & M Cost
CUF
Capital Cost: Market based approach
• Various private and public entities have set up wind farms
by inviting the tenders from various wind project developers
• Total 34.20 MW capacity awarded through tender process
during the FY2010-11 of total 5 wind projects
• Capital cost/ MW ranges from `5.82 Cr. to `6.18 Cr.
• Weighted average cost works out to `6.00 Cr./ MW

Wind
Wind - Capital Cost
Capital Cost
O & M Cost
CUF
Capital Cost:
• The average project cost in the industry stands higher at
around ` 5.23 to 6 Cr./MW depending upon the size,
capacity, sites as against the CERC’s normative ` 4.92
Cr./MW for 2011-12
Source No. of
Projects
MW
IREDA (FY 10-11) 10 570 `5.90 Cr./ MW
IREDA (FY 11-12) 4 220 `5.90 Cr./ MW
UNFCCC (FY 09-10) 14 137 `5.23 Cr./ MW
UNFCCC (FY 10-11) 5 84 `5.47 Cr./ MW
Tender (FY 10-11) 5 34 `6.00 Cr./ MW
Total 38 1045
Wind
Wind - Capital Cost
Capital Cost
O & M Cost
CUF
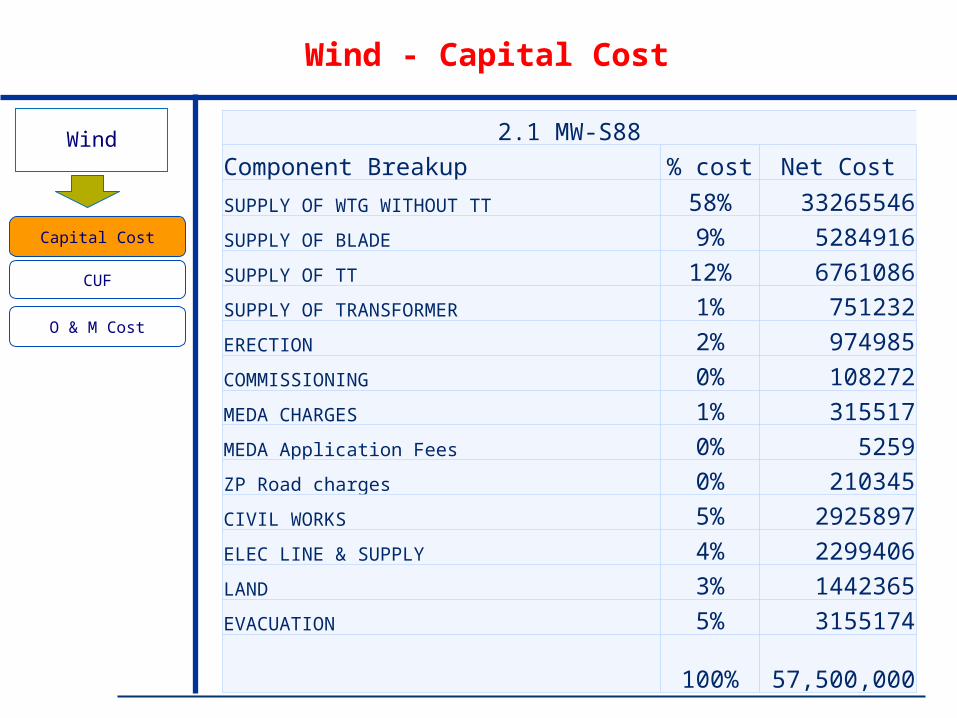
2.1 MW-S88
Component Breakup % cost Net Cost
SUPPLY OF WTG WITHOUT TT 58% 33265546
SUPPLY OF BLADE 9% 5284916
SUPPLY OF TT 12% 6761086
SUPPLY OF TRANSFORMER 1% 751232
ERECTION 2% 974985
COMMISSIONING 0% 108272
MEDA CHARGES 1% 315517
MEDA Application Fees 0% 5259
ZP Road charges 0% 210345
CIVIL WORKS 5% 2925897
ELEC LINE & SUPPLY 4% 2299406
LAND 3% 1442365
EVACUATION 5% 3155174
100% 57,500,000

Wind
Wind - Capital Cost
Capital Cost
O & M Cost
CUF
Major reason for the increase of the costs• Primarily due to increased cost of the balance of systems
• There has been a tremendous increase in the market value of the land, and the creation of infrastructure (viz. civil, electrical, crane charges, logistics etc.)
• As per the latest estimates the cost/MW (excluding the wind turbine) ranges from ` 1.10-1.35 Cr. per MW, against approximately ` 65-70 lakhs/MW two years ago.
Sr. No Particulars in lac `1 Land 15
CIVIL 2 Foundation 223 Internal Road 34 Area development 4 Total: 1to 4 29
5 DP Yard 8
6Internal lines & Poles (33 kV lines @ Rs 14 lacs per km) 14
Total: 5 to 6 22
7 Erection & Commissioning (assuming deployment of 500 T cranes) 22
8
EHV + Pooling station (assuming a 33 kV/132 kV : 100 MVA) Pooling station ((20 Cr - consisting of 2 x 50 MVA : 33 kV/132 kV, including bay + land) 20
9 Miscellaneous 1 Total : 8 to 9 21
10 Logistics 15Grant Total 114

Wind
Wind - Capital Cost: PSU/State Govt. companies
investment through Tenders for FY 2010-11
• PSU
Capital Cost
O & M Cost
CUF
Name of PSU/State
Government
Qty * MW Capacity
MW
Site/State Cost/MW (Rs. In
Crore including
Service Tax)
Hutti Gold Mines Ltd.
(HGML)
1 * 2.10 2.10 Chitradurga/Karnataka 5.85
Hindustan Petroleum
Corporation Limited
(HPCL)
17 * 1.50 25.50 Akal / Rajasthan 6.06
Surat Municipal
Corporation (SMC)
2 * 1.50 3.00 Adodar / Gujarat 6.15
Gujarat Energy
Development Agency
(GEDA)
1 * 1.50 1.50 Jamanwada / Gujarat 6.18
Gujarat Energy
Development Agency
(GEDA)
1 * 2.10 2.10 Jamanwada / Gujarat 5.82
Total 34.20 6.00
Wind
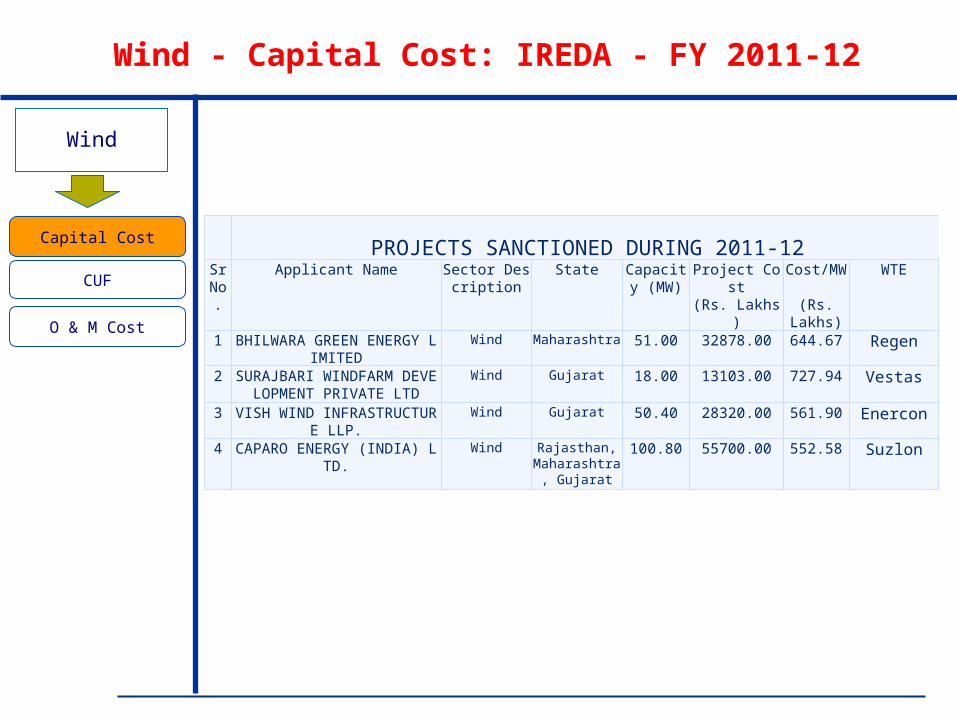
Wind - Capital Cost: IREDA - FY 2011-12
Capital Cost
O & M Cost
CUF
PROJECTS SANCTIONED DURING 2011-12Sr
No.Applicant Name Sector Descri
ptionState Capacity
(MW)Project Cost (Rs. Lakhs)
Cost/MW (Rs. Lakhs)
WTE
1 BHILWARA GREEN ENERGY LIMITED
Wind Maharashtra 51.00 32878.00 644.67 Regen
2 SURAJBARI WINDFARM DEVELOPMENT PRIVATE LTD
Wind Gujarat 18.00 13103.00 727.94 Vestas
3 VISH WIND INFRASTRUCTURE LLP.
Wind Gujarat 50.40 28320.00 561.90 Enercon
4 CAPARO ENERGY (INDIA) LTD.
Wind Rajasthan, Maharashtra,
Gujarat
100.80 55700.00 552.58 Suzlon
Wind
Wind - Capital Cost
Capital Cost
O & M Cost
CUF
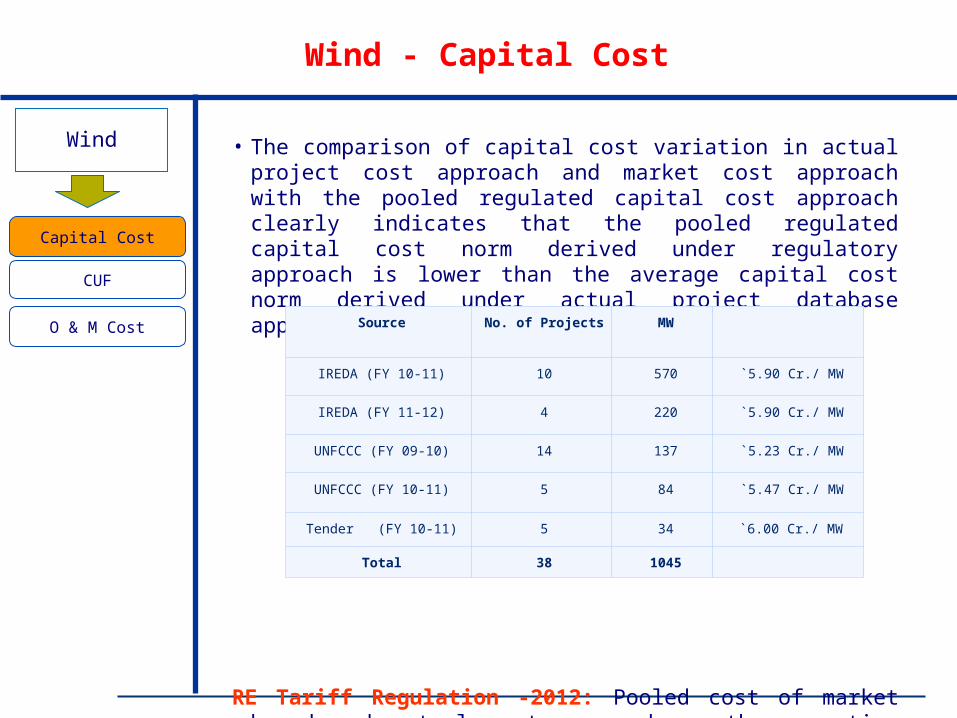
• The comparison of capital cost variation in actual project
cost approach and market cost approach with the pooled regulated capital cost approach clearly indicates that the pooled regulated capital cost norm derived under regulatory approach is lower than the average capital cost norm derived under actual project database approach
RE Tariff Regulation -2012: Pooled cost of market based and actual cost approach as the normative capital cost for first year of the next Control Period which works out to ` 5.75 Cr./MW
Source No. of Projects MW
IREDA (FY 10-11) 10 570 `5.90 Cr./ MW
IREDA (FY 11-12) 4 220 `5.90 Cr./ MW
UNFCCC (FY 09-10) 14 137 `5.23 Cr./ MW
UNFCCC (FY 10-11) 5 84 `5.47 Cr./ MW
Tender (FY 10-11) 5 34 `6.00 Cr./ MW
Total 38 1045

Wind
Reg. 26: Wind: Capacity Utilisation Factor (CUF)
Capital Cost
O & M Cost
CUF
RE Tariff Regulations-2009 : CUF
• Wind Atlas as and when prepared by C-WET would be basis of
categorization of wind sties
• C-WET
• Published Indian Wind Atlas in February 2010
• Suggested that it is not advisable to use Atlas for tariff fixation and
the same is also mentioned in the preface of atlas
• Suggested that the theoretical energy in the WPD cannot really
represent the power getting out from today’s model of wind turbine
as actual performance is depends on the power curve and efficiency
of machine
• MNRE Circular dated 1.08.2011: No restriction will exist for WPD criteria
as far the development of wind power project is concerned
Annual Mean Wind Power Density
(W/m2) at 50 mtr hub heightCUF
200-250 20%
250-300 23%
300-400 27%
> 400 30%
Wind
Capital Cost
O & M Cost
CUF
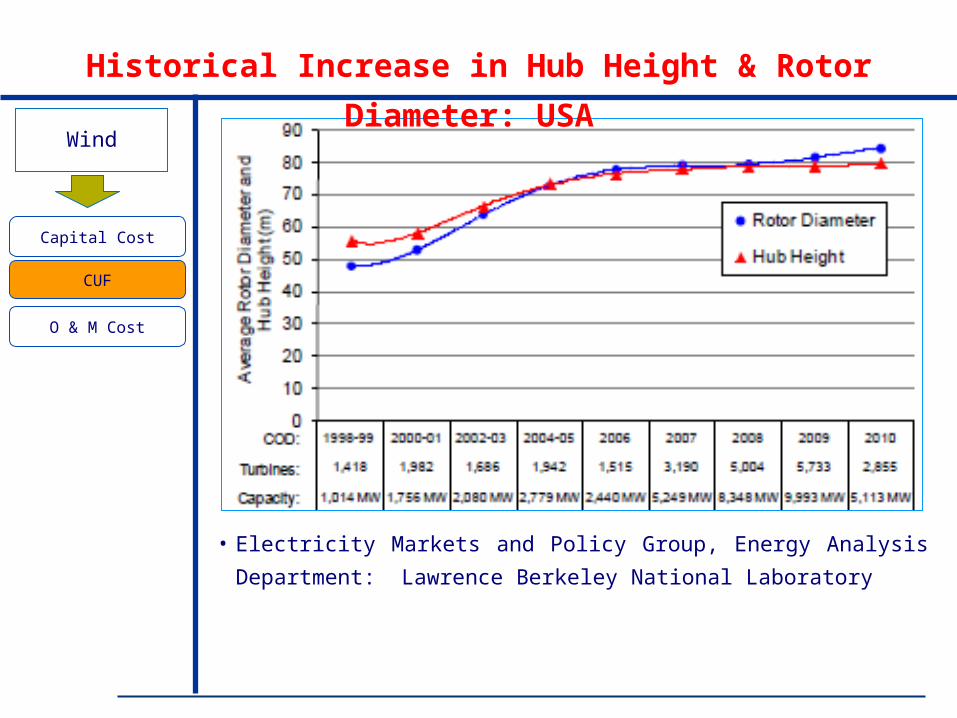
• Electricity Markets and Policy Group, Energy Analysis Department:
Lawrence Berkeley National Laboratory
Historical Increase in Hub Height & Rotor Diameter: USA

Wind
Capital Cost
O & M Cost
CUF
Wind Energy Installation for year FY 2010-11
Developer State MAH KAR TN RAJ MP GUJ AP Total % Hub HeightSuzlon 107.2 93.95 191.55 333.5 42.6 183.1 951.9 40.48 65 75 78 80Enercon 31.2 116 112 103.2 78.4 63.2 504 21.43 50 56 57 65Vestas 39.6 115.5 20.4 175.5 7.46 70 78 80
Maruti Windfarm 21.15 21.15 0.90RS Windfarm 41.25 41.25 1.75TS Windfarm 25 25 1.06Sriram EPC 1 25 2.5 28.5 1.21 41Vestas RRB 99 99 4.21 65Gamesa 213.35 14.45 227.8 9.69Regen 4.5 96 7.5 108 4.59 75 85SWPL 6 0.45 6.45 0.27 45GWL 31.93 3 34.93 1.49Pioneer Wind 2.25 28 2 32.25 1.37 50WinWind 29 29 1.23 70Cwel 14.03 14.03 0.60INOX 2 2 0.09 80Kenersys 10 2 12 0.51 80Shiva Wind 1.5 1.5 0.06 50TTG 0.25 0.25 0.01LeitWind 36.3 36.3 1.54 65IWPL 1 1 0.04
TOTAL 239.05 254.05 997.41 436.7 48.6 312.8 63.2 2351.81 100% 10.16 10.80 42.41 18.57 2.07 13.30 2.69 100.00 84.46

Wind
Capital Cost
O & M Cost
CUF
LBNL : Reassessing Wind Potential Estimates for India:
Source : LBNL

Wind
Wind: Capacity Utilisation Factor (CUF)
Capital Cost
O & M Cost
CUF
RE Tariff Regulations-2009
Annual Mean WPD (W/m2) at 50 mtr HH
CUF
Zone-1 200-250 20%
Zone-2 250-300 23%
Zone-3 300-400 27%
Zone-4 > 400 30%
RE Tariff Regulations-2012
WPD at 80 mtr
Zone-1 Upto 200 20%
Zone-2 200-250 22%
Zone-3 250-300 25%
Zone-4 300-400 29%
Zone-5 > 400 32%

Wind
Wind: Operation & Maintenance Cost
Capital Cost
O & M Cost
CUF
RE Tariff Regulations-2009
• Normative O&M expenses for the first year of the Control Period (i.e. FY
2009-10) : ` 6.5 Lakh per MW.
• Escalation Rate: 5.72% per annum over the tariff period to compute the
levellised tariff.
• FY 2010-11: ` 6.87 Lakh per MW, FY 2011-12: ` 7.26 Lakh per MW
Market data on actual project-level O&M costs are not readily available. O&M agreement being signed between the wind farm developers and
investors are in the range of ` 7 to 10 lakh/MW.Now Forecasting cost would be additional cost
RE Tariff Regulations-2012
• Commission considered 5.72% annual escalation over the normative
Operation and Maintenance Cost allowed for FY 11-12 along with
additional insurance cost was considered at 0.25% of capital cost as well
as forecasting cost: FY 2012-13 Rs. 9 Lakh/MW with 5.72% Esc.
Wind
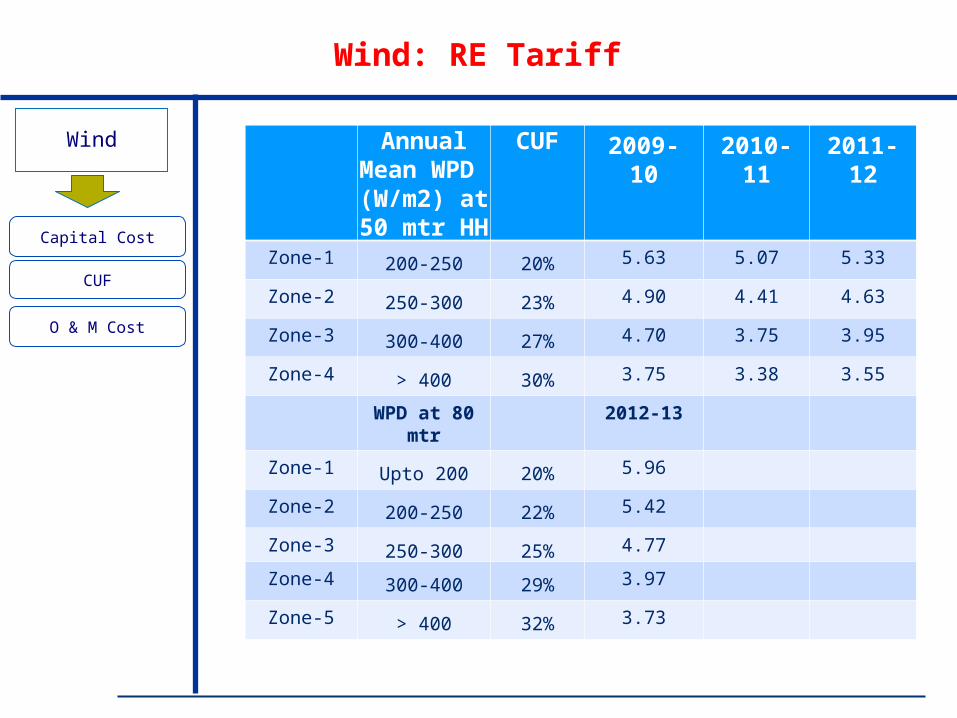
Wind: RE Tariff
Capital Cost
O & M Cost
CUF
Annual Mean WPD (W/m2) at 50 mtr HH
CUF 2009-10 2010-11 2011-12
Zone-1 200-250 20% 5.63 5.07 5.33
Zone-2 250-300 23% 4.90 4.41 4.63
Zone-3 300-400 27% 4.70 3.75 3.95
Zone-4 > 400 30% 3.75 3.38 3.55
WPD at 80 mtr
2012-13
Zone-1 Upto 200 20% 5.96
Zone-2 200-250 22% 5.42
Zone-3 250-300 25% 4.77
Zone-4 300-400 29% 3.97
Zone-5 > 400 32% 3.73
TECHNOLOGY SPECIFIC NORMS:
SMALL HYDRO PROJECT

Small Hydro
Small Hydro - Capital Cost
Capital Cost
O & M Cost
Region Project SizeCapital Cost(FY 2009-10)(` Lakh/ MW)
Capital Cost(FY 2010-11)(` Lakh/ MW)
Capital Cost(FY 2011-12)(` Lakh/ MW)
Himachal Pradesh, Uttarakhand and North
Eastern States
Below 5 MW5 MW to 25 MW
700630
634.94571.44
669.42602.48
Other StatesBelow 5 MW
5 MW to 25 MW550500
498.88453.53
525.97478.16
RE Tariff Regulations-2009

Small Hydro
Small Hydro - Capital Cost
Capital Cost
O & M Cost
Capital Cost considered by other SERCs
• MERC and UERC has followed CERC specified norm for capital cost
• MERC has followed indexation mechanism as per CREC
• UERC, OERC and KERC have not considered the year on year basis
variation in capital cost
• KERC has included evacuation/grid connectivity cost as part of Capital
Cost
KERC HPERC OERC MERC UERC
Project Cost (Cr/Mw)
4.75 6.5 6.7
FY 10-11: 4.98
for < 1 to 5MW and
4.53 for > 5 to 25 MW
indexation mechanism as per CERC For future years
Upto 5 MW: 7.0
5 MW to 10 MW: 6.85
10MW to 15 MW: 6.70
15 MW to 20 MW: 6.50
20 MW to 25 MW: 6.30
Projects Commissioned after
01.04.2009
Order Dec 2009 Feb 2010 May 2010 June 2010 July 2010

Small Hydro
Small Hydro - Capital Cost
Capital Cost
O & M Cost
Capital Cost : Actual Project Cost Approach
IREDA
PFC• PFC financed 10 projects of total cap. of 72.75 MW in 08-09.
• Capital cost per MW ranges from `7.89 Cr to `15.39 Cr
Source No of
Projects
Capacity, MW
IREDA 7 78.15 MW
PFC 12 83.45 MW
UNFCCC 1 15.00 MW
Total 20 176.60 MW
Region Project SizeNo. of
projects
Capital Cost(FY 2009-10)(` Lakh/ MW)
No. of projects
Capital Cost(FY 2010-11)(` Lakh/ MW)
Himachal Pradesh, Uttarakhand and North
Eastern States
Below 5 MW5 MW to 25 MW
12
796743
-
2
-
817
Other StatesBelow 5 MW
5 MW to 25 MW-1
-538
1-
518

Small Hydro
Small Hydro - Capital Cost
Capital Cost
O & M Cost
Capital Cost : Actual Project Cost Approach
PFC• PFC financed 2 small hydro projects in Kerala State of total
capacity of 10.7 MW in 2009-10.
UNFCCC• Capital cost data of 1 projects of total 15 MW commissioned in
Karnataka State registered with UNFCCC commissioned during
FY 2009-10 having per MW capital cost at ` 5.26 Cr./ MW
Region Project SizeNo. of
projectsMW
Capital Cost(FY 2009-10)(` Lakh/ MW)
Other States: Kerala
Below 5 MW5 MW to 25 MW
11
3.2 MW7.5 MW
594458
Small Hydro
Small Hydro - Capital Cost
Capital Cost
O & M Cost
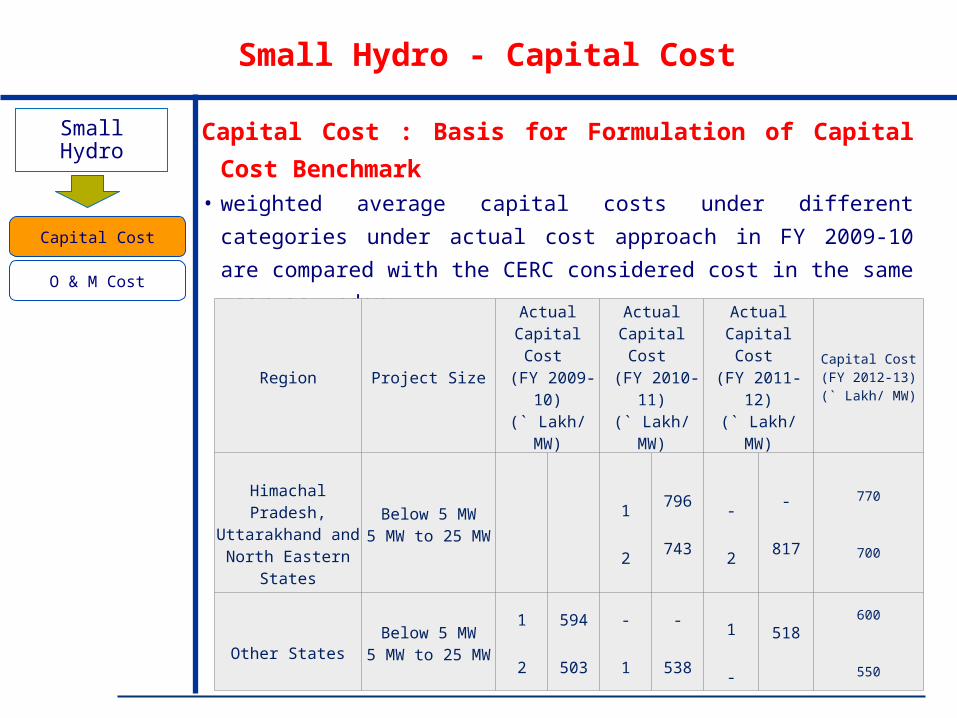
Capital Cost : Basis for Formulation of Capital Cost
Benchmark • weighted average capital costs under different categories under
actual cost approach in FY 2009-10 are compared with the CERC
considered cost in the same year as under
Region Project Size
Actual Capital Cost
(FY 2009-10)(` Lakh/ MW)
Actual Capital Cost
(FY 2010-11)(` Lakh/ MW)
Actual Capital Cost
(FY 2011-12)(` Lakh/ MW)
Capital Cost(FY 2012-13)(` Lakh/ MW)
Himachal Pradesh, Uttarakhand and
North Eastern States
Below 5 MW5 MW to 25 MW
1
2
796
743
-
2
-
817
770
700
Other StatesBelow 5 MW
5 MW to 25 MW
1
2
594
503
-
1
-
538
1
-
518600
550
Small Hydro
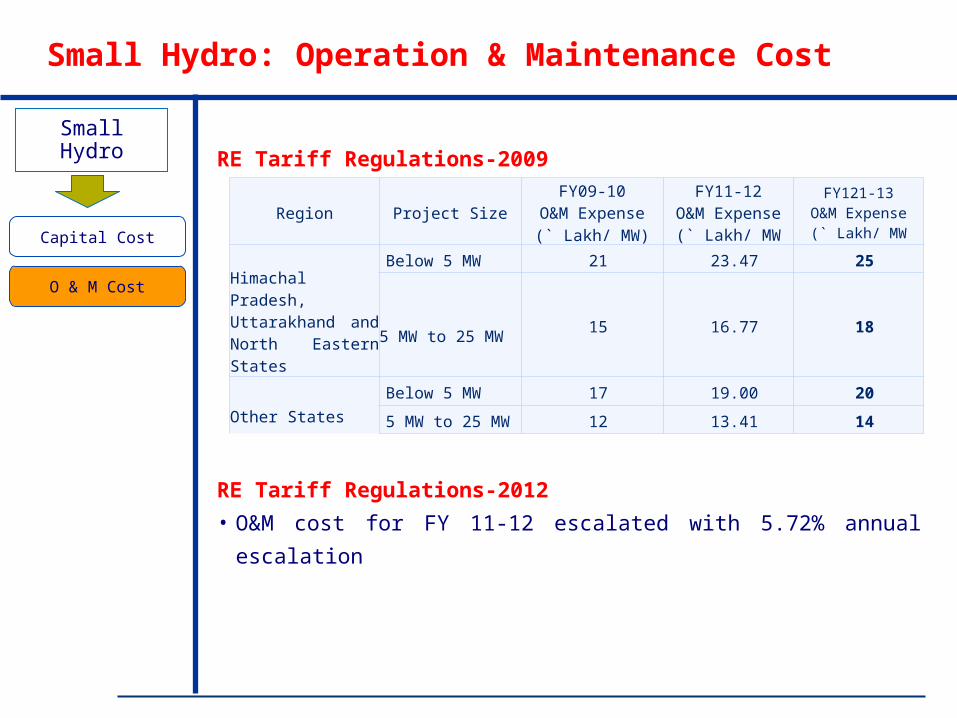
Small Hydro: Operation & Maintenance Cost
Capital Cost
O & M Cost
RE Tariff Regulations-2009
RE Tariff Regulations-2012
• O&M cost for FY 11-12 escalated with 5.72% annual escalation
Region Project SizeFY09-10
O&M Expense(` Lakh/ MW)
FY11-12O&M Expense(` Lakh/ MW
FY121-13O&M Expense(` Lakh/ MW
Himachal Pradesh, Uttarakhand and North Eastern States
Below 5 MW 21 23.47 25
5 MW to 25 MW15 16.77 18
Other States
Below 5 MW 17 19.00 20
5 MW to 25 MW 12 13.41 14

Small Hydro
Small Hydro: Tariff 2012-13
Capital Cost
O & M Cost
09-10 10-11 11-12 12-13
HP, Uttarakhand and NE States (Below 5MW) ` /kWh
3.90 3.59 3.78 4.14
HP, Uttarakhand and NE States (5MW to 25 MW) ` /kWh
3.35 3.06 3.22 3.54
Other States (Below 5 MW) ` /kWh 4.62 4.26 4.49 4.88
Other States (5MW to 25 MW) ` /kWh 4.00 3.65 3.84 4.16

TECHNOLOGY SPECIFIC NORMS:
Biomass Based Power Projects with Rankine Cycle Technology

Biomass
Biomass Power Project: Capital Cost
Capital Cost
O & M Cost
Biomass Price
RE Tariff Regulations-2009
Year Date of
Order/Regulation
Capital cost
` Lacs/MW
2009-10 17.09.2009 450.00
2010-11 26.02.2010 402.54
2011-12 09.11.2010 426.30
Station Heat Rate
Gross Calorific value
Auxiliary Consumption

Biomass
Biomass Power Project: Capital Cost
Capital Cost
O & M Cost
Biomass Price
Capital Cost Approved by the SERCsSERCs Capital Cost
` Cr./MW
Indexation Mechanism
Order/ Regulation Remark
RERC 5.40 :
Water Cooled Condenser
5.85 :
Air Cooled Condenser
As per Formula Regulation 23/01/2009
GERC 4.25 Not provided Order No.5 of 2010:
17.05.2010
Took note of CERC determined CC for FY10-11, specified higher CC as common for water and Air cooled condenser
UERC 4.50 Not provided Regulation
Dated 06.07.2010
As per CERC
MERC 4.03
(2010-11)
As per CERC Regulation
07.06.2010
As per CERC
KERC 4.87
inclusive of transmission infrastructure costs
Not provided Order No.5 of 2010:
11.12.2009
Took note of CERC specified CC for 2009-10
JSERC 4.50 Not provided Regulation
Dated 27.01.2010
As per CERC
HERC 4.50 Not provided Order dated 27.5.2011
As per CERC
Station Heat Rate
Gross Calorific value
Auxiliary Consumption
Biomass
Biomass Power Project: Capital Cost
Capital Cost
O & M Cost
Biomass Price
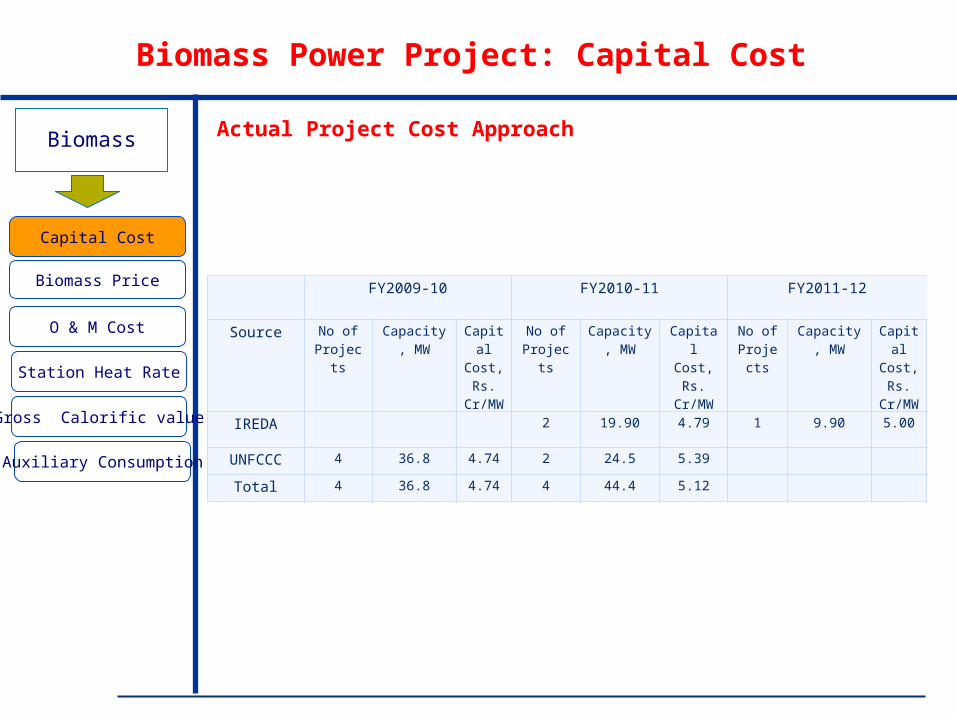
Actual Project Cost Approach
FY2009-10 FY2010-11 FY2011-12
Source No of Projects
Capacity, MW
Capital Cost, Rs.
Cr/MW
No of Projects
Capacity, MW
Capital Cost, Rs.
Cr/MW
No of Project
s
Capacity, MW
Capital Cost, Rs.
Cr/MW
IREDA 2 19.90 4.79 1 9.90 5.00
UNFCCC 4 36.8 4.74 2 24.5 5.39
Total 4 36.8 4.74 4 44.4 5.12
Auxiliary Consumption
Station Heat Rate
Gross Calorific value
Biomass
Biomass Power Project: Capital Cost
Capital Cost
O & M Cost
Biomass Price
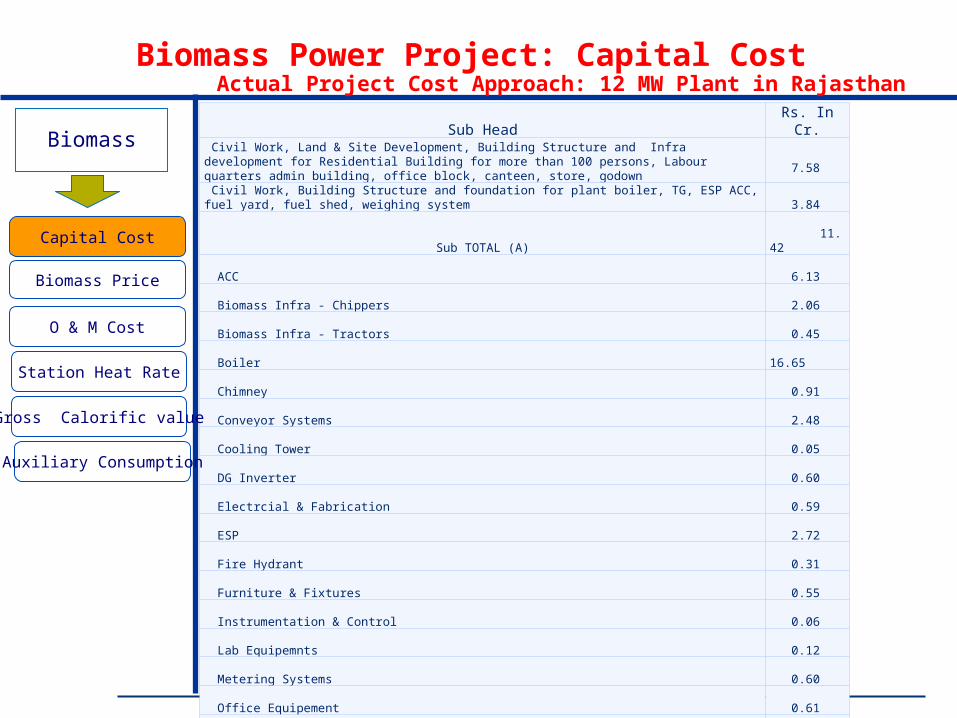
Actual Project Cost Approach: 12 MW Plant in RajasthanSub Head Rs. In Cr.
Civil Work, Land & Site Development, Building Structure and Infra development for Residential Building for more than 100 persons, Labour quarters admin building, office block, canteen, store, godown
7.58
Civil Work, Building Structure and foundation for plant boiler, TG, ESP ACC, fuel yard, fuel shed, weighing system
3.84
Sub TOTAL (A) 11.42ACC 6.13Biomass Infra - Chippers 2.06Biomass Infra - Tractors 0.45Boiler 16.65Chimney 0.91Conveyor Systems 2.48Cooling Tower 0.05DG Inverter 0.60Electrcial & Fabrication 0.59ESP 2.72Fire Hydrant 0.31Furniture & Fixtures 0.55Instrumentation & Control 0.06Lab Equipemnts 0.12Metering Systems 0.60Office Equipement 0.61Overhead Line 0.08Plant Lighting 0.18Power Receving Facilities 0.32Steam Piping & Exhaust Piping 2.22Switchyard 1.17TG 9.42Transfarmer 1.44Vehicles 0.13Weigh Bridge 0.13Workshop, Tools & Tackels & Stores 0.45WTP 0.94
Sub TOTAL (B) 51.38Preliminary & Pre-Operative Exp. 5.50Interest during Construction 3.70Margin Money for Working Capital 1.50
Sub TOTAL (C) 10.70
GRAND TOTAL (A+B+C) 73.50
Station Heat Rate
Auxiliary Consumption
Gross Calorific value
Biomass
Biomass Power Project: Capital Cost
Capital Cost
O & M Cost
Biomass Price
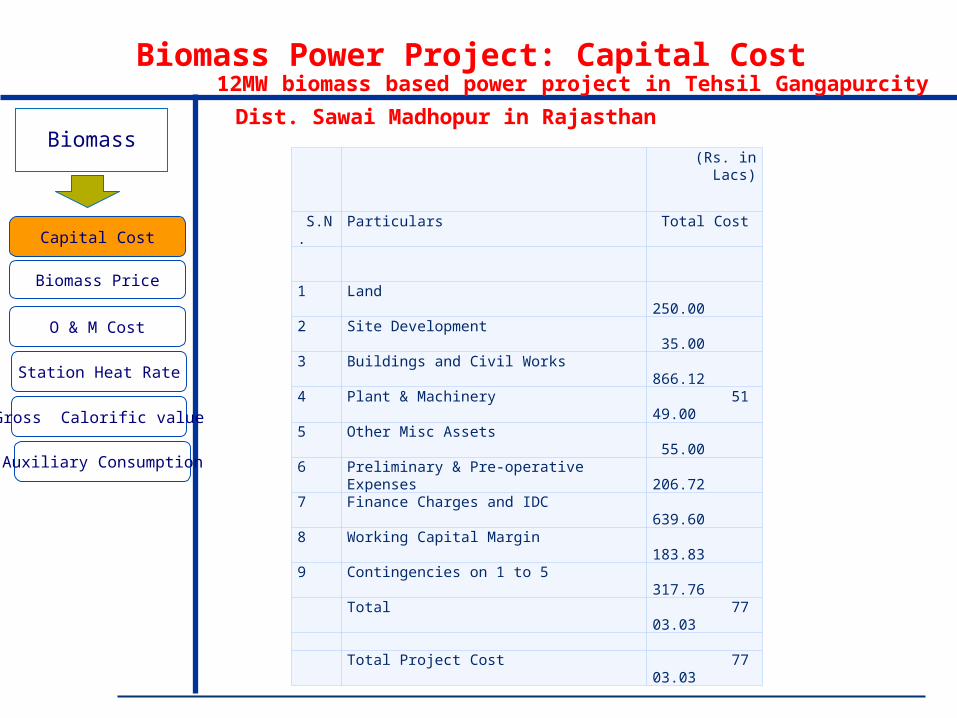
12MW biomass based power project in Tehsil Gangapurcity Dist.
Sawai Madhopur in Rajasthan
(Rs. in Lacs)
S.N. Particulars Total Cost
1 Land 250.00
2 Site Development 35.00
3 Buildings and Civil Works 866.12
4 Plant & Machinery 5149.00
5 Other Misc Assets 55.00
6 Preliminary & Pre-operative Expenses 206.72
7 Finance Charges and IDC 639.60
8 Working Capital Margin 183.83
9 Contingencies on 1 to 5 317.76
Total 7703.03
Total Project Cost 7703.03
The Project cost as appraised by SBI Caps is Rs. 7703.03 Lacs with the following breakup: The Project cost as appraised by SBI Caps is Rs. 7703.03 Lacs with the following breakup:
Station Heat Rate
Gross Calorific value
Auxiliary Consumption
Biomass
Biomass Power Project: Capital Cost
Capital Cost
O & M Cost
Biomass Price
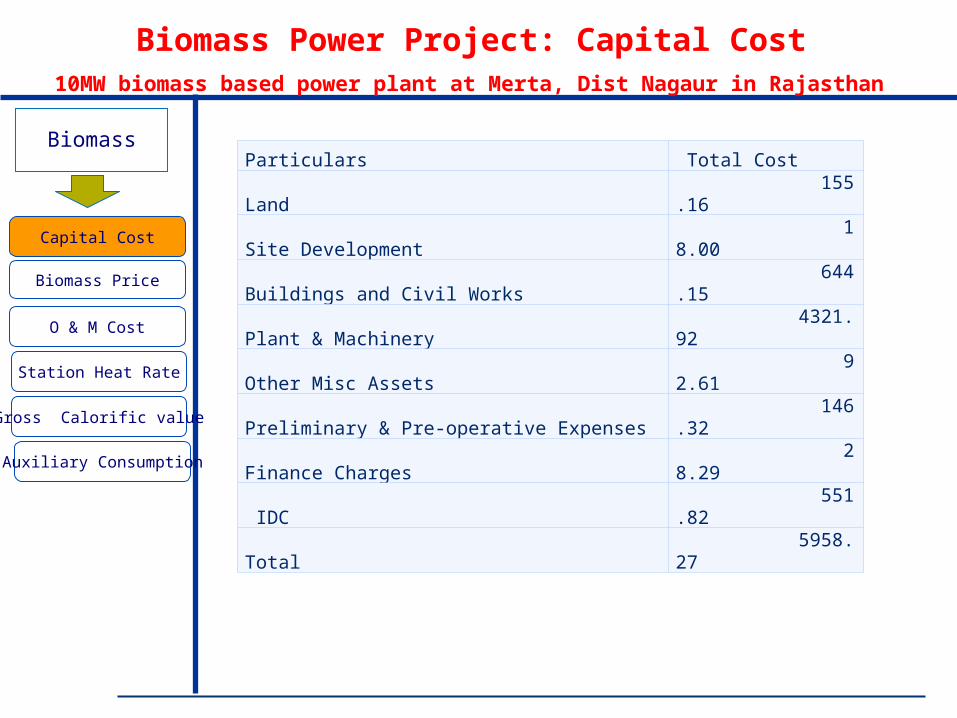
10MW biomass based power plant at Merta, Dist Nagaur in Rajasthan
Particulars Total Cost
Land 155.16
Site Development 18.00
Buildings and Civil Works 644.15
Plant & Machinery 4321.92
Other Misc Assets 92.61
Preliminary & Pre-operative Expenses 146.32
Finance Charges 28.29
IDC 551.82
Total 5958.27
Station Heat Rate
Gross Calorific value
Auxiliary Consumption
Biomass
Biomass Power Project: Capital Cost
Capital Cost
O & M Cost
Biomass Price
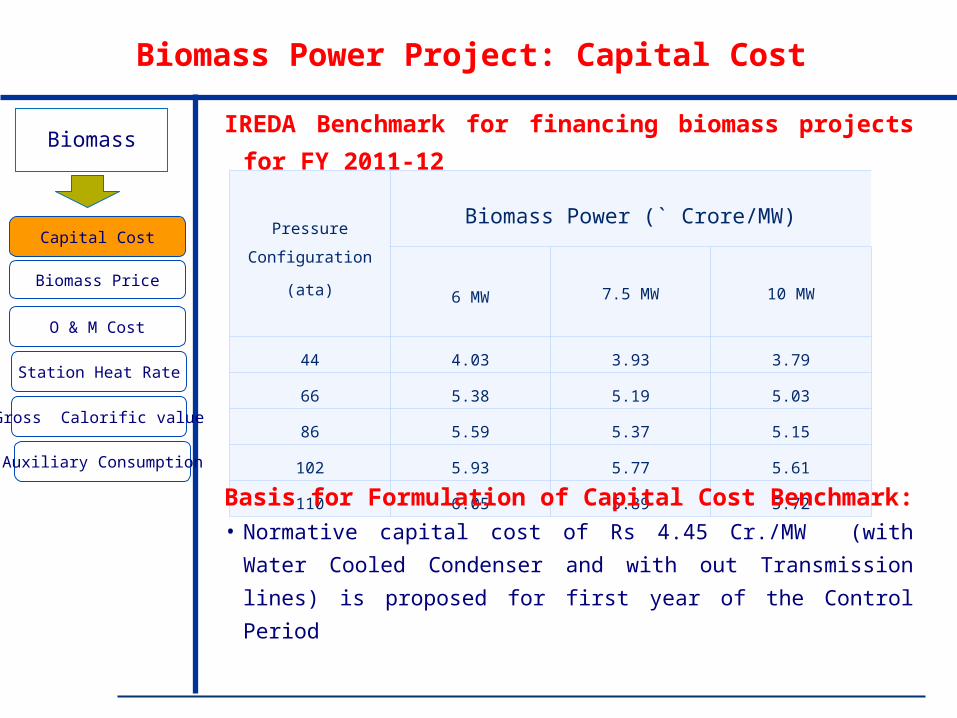
Pressure
Configuration
(ata)
Biomass Power (` Crore/MW)
6 MW 7.5 MW 10 MW
44 4.03 3.93 3.79
66 5.38 5.19 5.03
86 5.59 5.37 5.15
102 5.93 5.77 5.61
110 6.05 5.89 5.72
IREDA Benchmark for financing biomass projects for FY
2011-12
Basis for Formulation of Capital Cost Benchmark:• Normative capital cost of Rs 4.45 Cr./MW (with Water Cooled
Condenser and with out Transmission lines) is proposed for
first year of the Control Period
Station Heat Rate
Gross Calorific value
Auxiliary Consumption

Biomass
Biomass Power Project: Biomass Price
Capital Cost
O & M Cost
Biomass Price
RE Tariff Regulations-2009
State
Biomass price
(Rs/MT)
2009-10
Biomass price
(Rs/MT)
2010-11
Biomass price
(Rs/MT)
2011-12
Andhra Pradesh 1301 1,342.81 1,460.75
Haryana 2168 2,237.67 2,434.21
Maharashtra 1801 1,858.87 2,022.14
Madhya Pradesh 1299 1,340.74 1,458.50
Punjab 2092 2,159.23 2,348.88
Rajasthan 1822 1,880.55 2,045.72
Tamil Nadu 1823 1,881.58 2,046.84
Uttar Pradesh 1518 1,566.78 1,704.39
Other States 1797 1,854.75 2,017.65
Station Heat Rate
Gross Calorific value
Auxiliary Consumption

Biomass
Biomass Power Project: Biomass Price
Capital Cost
O & M Cost
Biomass Price
Proposal in Draft Regulation-2012
• Approach considered was Median value of SERC determined price
escalated with 5% to bring at FY12-13, MNRE suggested price and
equivalent heat approach
State
Biomass price
(Rs/MT)
2009-10
Biomass price
(Rs/MT)
2010-11
Biomass price
(Rs/MT)
2011-12
Proposed in
draft Reg.
Andhra Pradesh 1301 1,342.81 1,460.75 2315
Haryana 2168 2,237.67 2,434.21 2635
Maharashtra 1801 1,858.87 2,022.14 2116
Madhya Pradesh 1299 1,340.74 1,458.50 1507
Punjab 2092 2,159.23 2,348.88 2756
Rajasthan 1822 1,880.55 2,045.72 2300
Tamil Nadu 1823 1,881.58 2,046.84 2277
Uttar Pradesh 1518 1,566.78 1,704.39 2355
Other States 1797 1,854.75 2,017.65 2283
Station Heat Rate
Gross Calorific value
Auxiliary Consumption
Biomass
Biomass Power Project: Biomass Price
Capital Cost
O & M Cost
Biomass Price
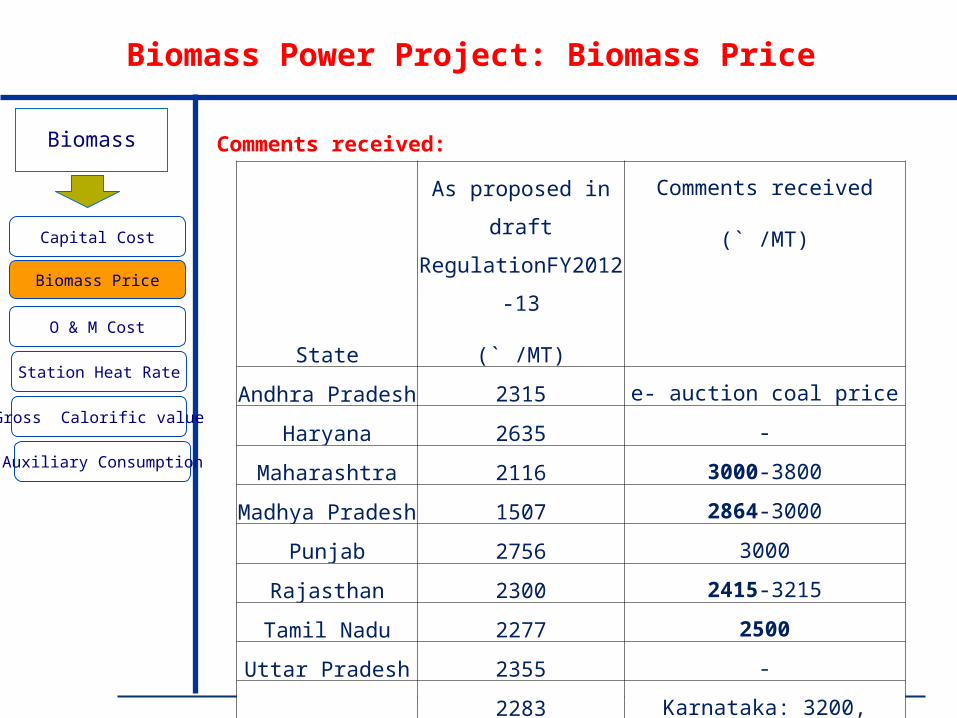
Comments received:
Station Heat Rate
Gross Calorific value
State
As proposed in draft
RegulationFY2012-13
(` /MT)
Comments received
(` /MT)
Andhra Pradesh 2315 e- auction coal price
Haryana 2635 -
Maharashtra 2116 3000-3800
Madhya Pradesh 1507 2864-3000
Punjab 2756 3000
Rajasthan 2300 2415-3215
Tamil Nadu 2277 2500
Uttar Pradesh 2355 -
Other States
2283 Karnataka: 3200, Gujarat 3000,
Orissa: 3000
Auxiliary Consumption
Biomass
Reg. 44: Biomass Price :
Capital Cost
O & M Cost
Biomass Price
Station Heat Rate
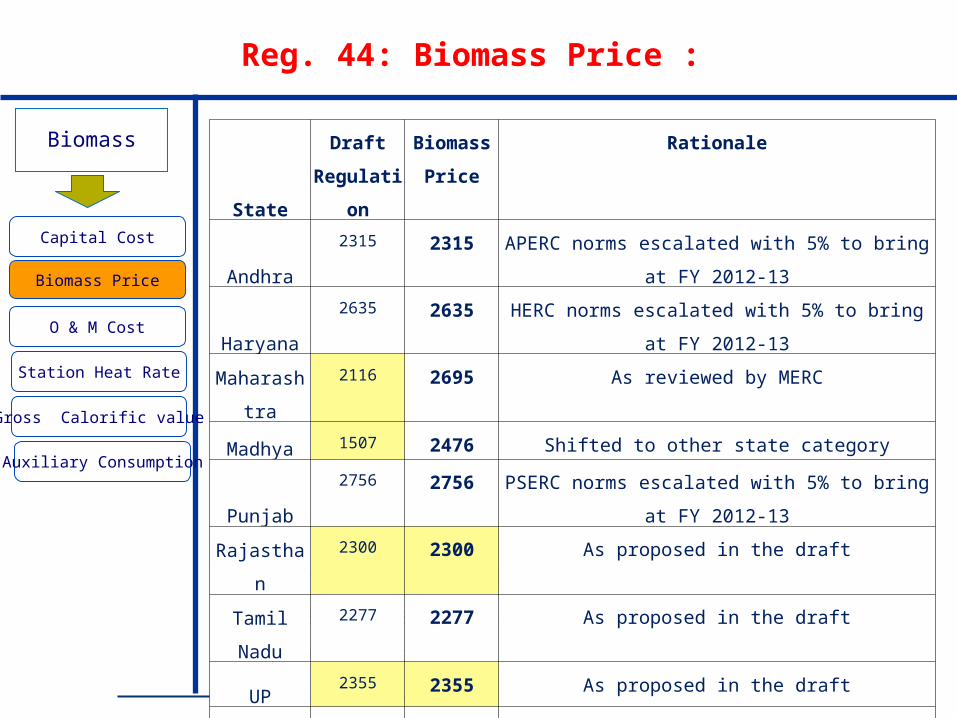
Staff views
• Latest norm specified by the respective State Commission as
well as detailed study if any carried out by the States
whichever is maximum.
Gross Calorific value
State
Draft
Regulation
Biomass
Price
Rationale
Andhra 2315 2315 APERC norms escalated with 5% to bring at FY 2012-13
Haryana 2635 2635 HERC norms escalated with 5% to bring at FY 2012-13
Maharashtra 2116 2695 As reviewed by MERC
Madhya 1507 2476 Shifted to other state category
Punjab 2756 2756 PSERC norms escalated with 5% to bring at FY 2012-13
Rajasthan 2300 2300 As proposed in the draft
Tamil Nadu 2277 2277 As proposed in the draft
UP2355 2355 As proposed in the draft
Other States 2283 2476 Average of the above States
Auxiliary Consumption
Biomass
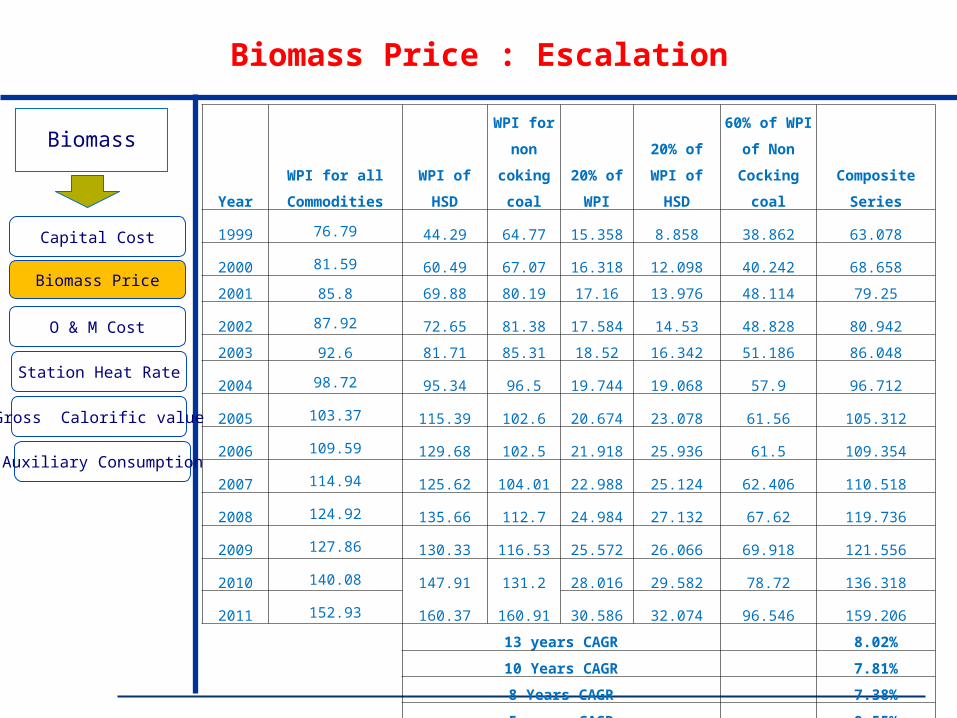
Biomass Price : Escalation
Capital Cost
O & M Cost
Biomass Price
Station Heat Rate
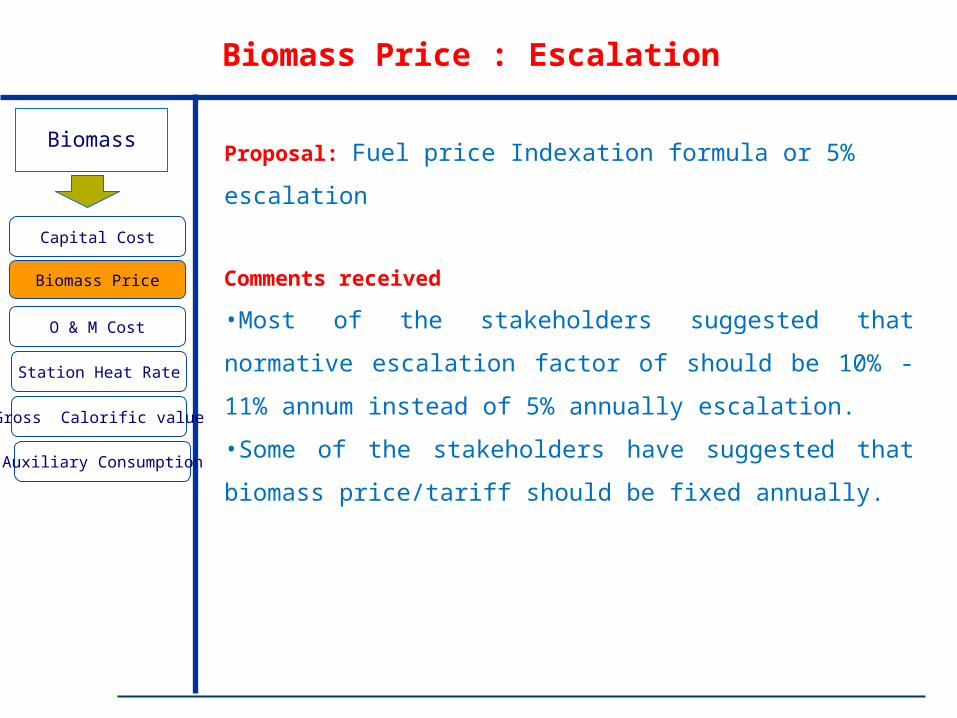
Proposal: Fuel price Indexation formula or 5% escalation
Comments received
•Most of the stakeholders suggested that normative escalation
factor of should be 10% -11% annum instead of 5% annually
escalation.
•Some of the stakeholders have suggested that biomass
price/tariff should be fixed annually.
Gross Calorific value
Auxiliary Consumption
Biomass
Biomass Price : Escalation
Capital Cost
O & M Cost
Biomass Price
Station Heat Rate
Gross Calorific value
Year
WPI for all
Commodities WPI of HSD
WPI for
non coking
coal
20% of
WPI
20% of WPI
of HSD
60% of WPI of
Non Cocking
coal Composite Series
1999 76.79 44.29 64.77 15.358 8.858 38.862 63.078
2000 81.59 60.49 67.07 16.318 12.098 40.242 68.658
2001 85.8 69.88 80.19 17.16 13.976 48.114 79.25
2002 87.92 72.65 81.38 17.584 14.53 48.828 80.942
2003 92.6 81.71 85.31 18.52 16.342 51.186 86.048
2004 98.72 95.34 96.5 19.744 19.068 57.9 96.712
2005 103.37 115.39 102.6 20.674 23.078 61.56 105.312
2006 109.59 129.68 102.5 21.918 25.936 61.5 109.354
2007 114.94 125.62 104.01 22.988 25.124 62.406 110.518
2008 124.92 135.66 112.7 24.984 27.132 67.62 119.736
2009 127.86 130.33 116.53 25.572 26.066 69.918 121.556
2010 140.08 147.91 131.2 28.016 29.582 78.72 136.318
2011 152.93 160.37 160.91 30.586 32.074 96.546 159.206
13 years CAGR 8.02%
10 Years CAGR 7.81%
8 Years CAGR 7.38%
5 years CAGR 9.55%
Auxiliary Consumption
Biomass
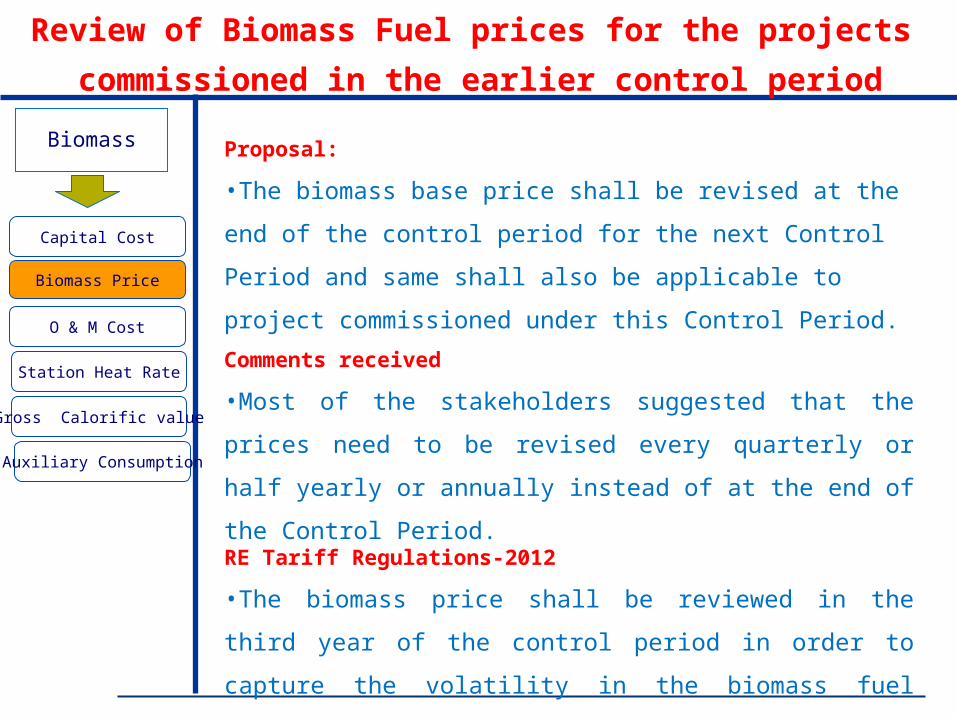
Review of Biomass Fuel prices for the projects
commissioned in the earlier control period
Capital Cost
O & M Cost
Biomass Price
Station Heat Rate
Proposal:
•The biomass base price shall be revised at the end of the
control period for the next Control Period and same shall also be
applicable to project commissioned under this Control Period.
Comments received
•Most of the stakeholders suggested that the prices need to be
revised every quarterly or half yearly or annually instead of at the
end of the Control Period. RE Tariff Regulations-2012
•The biomass price shall be reviewed in the third year of the
control period in order to capture the volatility in the biomass fuel
market as well as more realistic prices.
Gross Calorific value
Auxiliary Consumption

Biomass
Reg. 39: Biomass Project: Operation & Maintenance Cost
Capital Cost
O & M Cost
Biomass Price
Proposal in Draft Regulations
• 24 Lakh/MW for FY 2012-13 (which are determined by applying annual
escalation factor of 5.72% per annum on the O&M cost norm applicable for
FY 2011-12)
Comments received
• Separate norm for project with water-cooled and air-cooled condensers
• Separate norm for smaller biomass power plant
• 6.5% to 9.39% of the Capital cost
• Suggestions received in the range of ` 32 .4 Lakh /MW to ` 50 Lakh/MW
• Annual escalation factor should be 7%
• CERC speciifed norm for :200 MW sets: ` 21.51 Lac/MW, Tanda: ` 31.02
Lac/MW, Badarpur: ` 34.12 Lac/MW, Talchar: ` 38.70 Lac/MW
RE Tariff Regulations-2012
• Retained the norm as provided in the draft Regulations
Station Heat Rate
Gross Calorific value
Auxiliary Consumption

Biomass
Reg. 38 : Biomass Project: Station Heat Rate
Capital Cost
O & M Cost
Biomass Price
• RE Tariff Regulations-2009: 3800 Kcal/kWh
• Proposal in draft RE Tariff Regulations-2012: 4000 Kcal/kWh
• Comments received:
• Some of the stakeholders suggested that SHR of
4200kCal/kWh and 4400kCal/kWh should be considered for
project with water-cooled condensers and air-cooled
condensers
• Some of the stakeholders requested to consider the SHR as
4500kCal/kWh as per CEA study
• Station Heat Rate of 4400 kcal/kwh for paddy straw fired biomass
power plant should be considered
• Dalkia Energy Services has recommended to consider SHR as 4100,
4400 and 4150kCal/kWh for rice husk based (> 5MW), straw based
and other fuel based biomass power plants.
Station Heat Rate
Gross Calorific value
Auxiliary Consumption

Biomass
Reg. 38 : Biomass Project: Station Heat Rate
Capital Cost
O & M Cost
Biomass Price
• MNRE recommendation on SHR for different technology :
• National Productivity Council conducted a field study for MEDA for
assessment of heat rate of commissioned biomass power plants in
Maharashtra.
• RE Tariff Regulations-2012
• Station Heat Rate at 4000 kCal/kWh
Station Heat Rate
Biomass Source
IPP (> 5 MW)
Tail End (< 2 MW)
Rice Husk 4100 5200Straw 4400 5500Others 4150 5200
Gross Calorific value
Project with Boiler Type
Station Heat RatekCal/KWh
AFBC 4000 – 4100Traveling Grate 4150 - 4250
Auxiliary Consumption

Biomass
Reg. 38 : Biomass Project: Gross Calorific value
Capital Cost
O & M Cost
Biomass Price
RE Tariff Regulations-2009: State wise GCV specified, Average GCV
was 3462 kCal/kg
Proposal in draft RE Tariff Regulations-2012: 3300 kCal/kg
Comments received
• CEA, National Productivity Council and MNRE recommended GCV
have not considered degradation in GCV of these seasonal fuels
over the non-seasonal period.
• Due to the rains, storage, contamination by fuel suppliers and
inherent mud in agricultural residues there is a significant
reduction in GCV of biomass fuels.
• Actual GCV in rice husk is between 3000-3100 kCal/kg.
• GCV of cotton stalk available in Gujarat is around 3600-3700
kcal/kg and average GCV of the biomass would be around 3500
kCal/kg.
• Some of the stakeholders suggested that average GCV should be
taken as 3000 kCal/kg considering loss of GCV during storage,
which is a practical requirement.
Station Heat Rate
Gross Calorific value
Auxiliary Consumption

Biomass
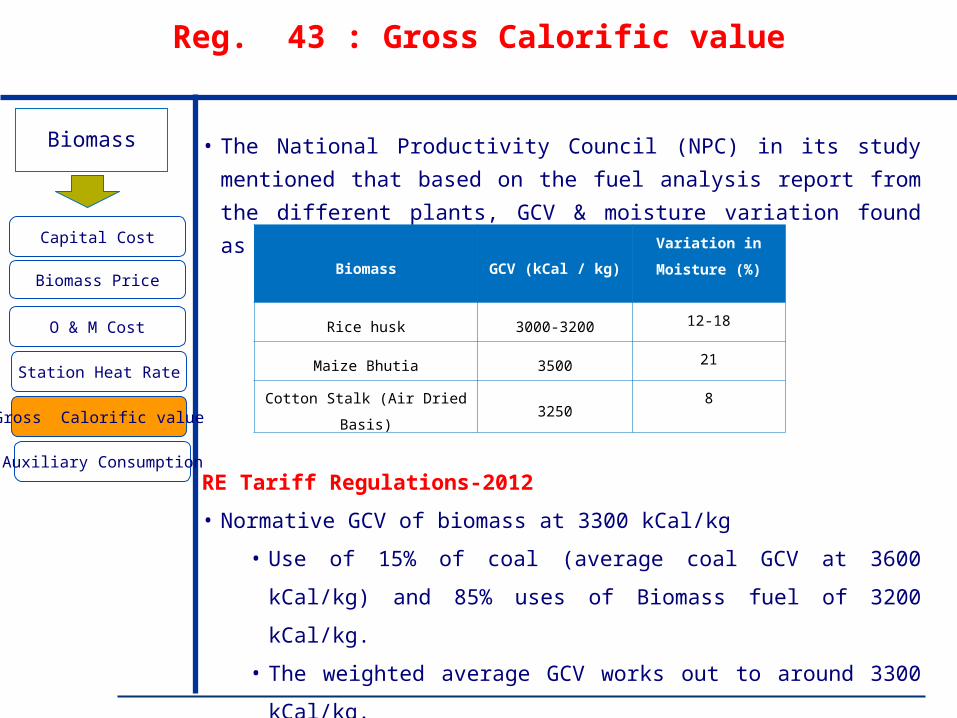
Reg. 43 : Gross Calorific value
Capital Cost
O & M Cost
Biomass Price
• MNRE Recommendation
• MNRE also mentioned that there are other losses which are being
encountered during the storage and handling of biomass due to
land settlement, loss of fuel during sand storm,
• GCV loss due to decaying of biomass. MNRE referred a recent
survey has been carried out by DESL under mandate from
Rajasthan Renewable Energy Corporation Ltd. (RREC) to assess
such losses which are in the range of 3.2 to 3.5%.
• MNRE recommended that there should be provision of loss of fuel
during storage at around 2%.
• MNRE recommended following general principles can be adopted
for the GCV as under:
Station Heat Rate
Gross Calorific value
Biomass GCV (kCal / kg)
Rice husk 3200
Straw/Stalks/Other husks 3300
Plantation 2800
Auxiliary Consumption
Biomass
Reg. 43 : Gross Calorific value
Capital Cost
O & M Cost
Biomass Price
• The National Productivity Council (NPC) in its study mentioned
that based on the fuel analysis report from the different plants,
GCV & moisture variation found as under:
RE Tariff Regulations-2012
• Normative GCV of biomass at 3300 kCal/kg
• Use of 15% of coal (average coal GCV at 3600 kCal/kg) and
85% uses of Biomass fuel of 3200 kCal/kg.
• The weighted average GCV works out to around 3300
kCal/kg.
Station Heat Rate
Gross Calorific value
Biomass GCV (kCal / kg)
Variation in Moisture
(%)
Rice husk 3000-3200 12-18
Maize Bhutia 3500 21
Cotton Stalk (Air Dried Basis) 3250 8
Auxiliary Consumption
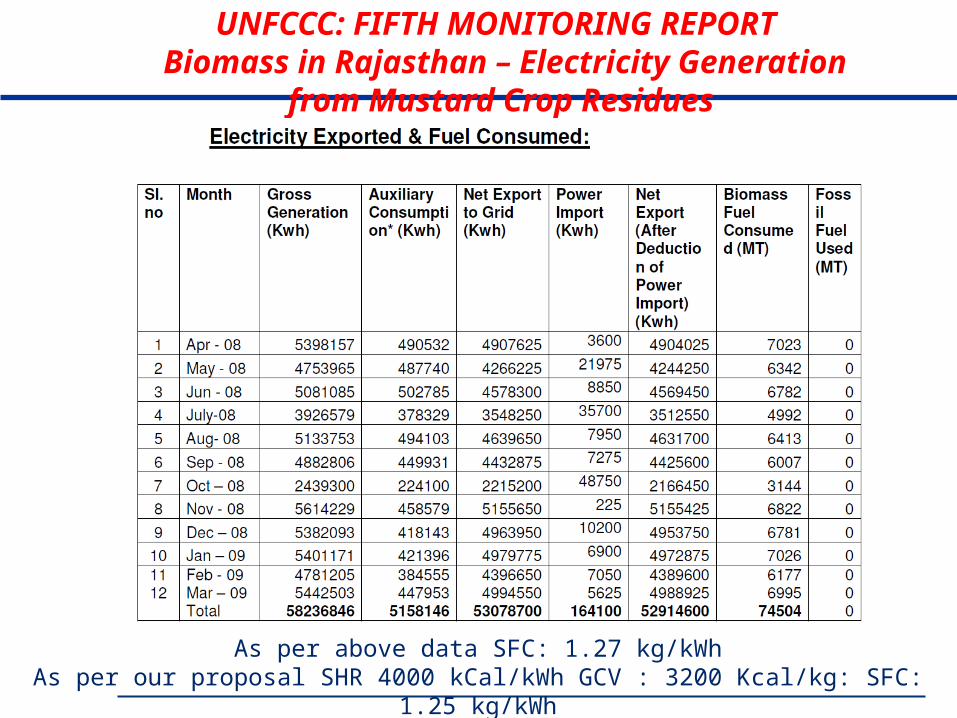
UNFCCC: FIFTH MONITORING REPORTBiomass in Rajasthan – Electricity Generation
from Mustard Crop Residues
As per above data SFC: 1.27 kg/kWhAs per our proposal SHR 4000 kCal/kWh GCV : 3200 Kcal/kg: SFC: 1.25 kg/kWh

Biomass
Reg. 37 : Biomass Project: Auxiliary Consumption
Capital Cost
O & M Cost
Biomass Price
• RE Tariff Regulations-2009: 10%
• Proposal in draft RE Tariff Regulations-2012: 10%
Comments received
• Many stakeholders have suggested to increase the same which
are ranges from 11.5% to 14%
• Separate norm for projects with water cooled and air cooled
condensers
• Higher auxiliary consumption during stabilisation period
• Separate norm for straw fired plants, Auxiliary Consumption
should be considered at 14% for Water Cooled Condenser and
16% for Air Cooled Condenser
RE Tariff Regulations-2012: 10%
Station Heat Rate
Gross Calorific value
Auxiliary Consumption
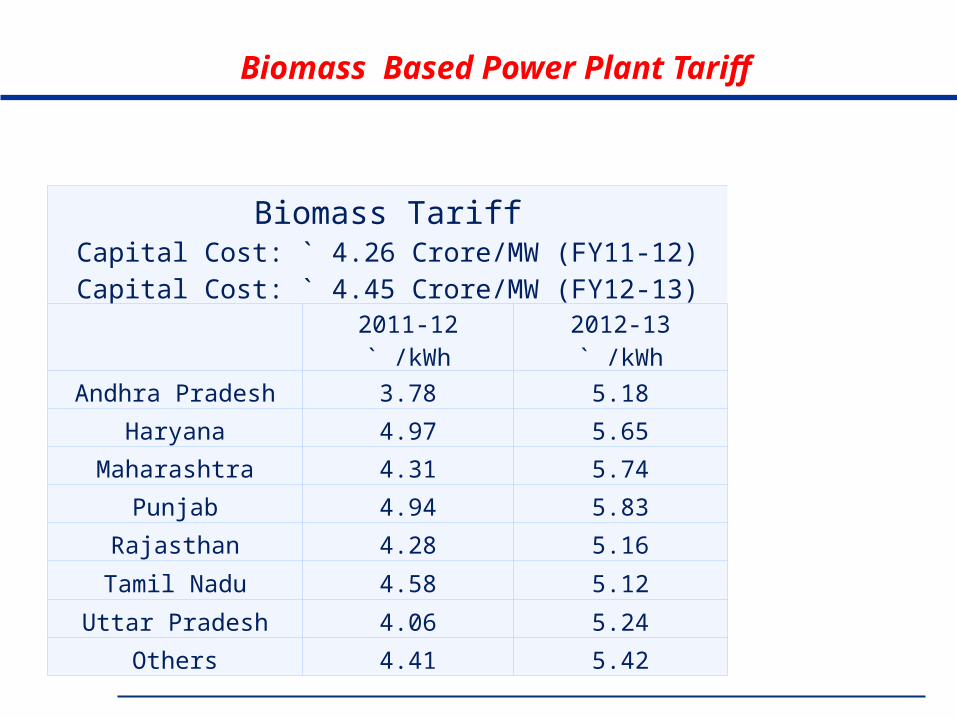
Biomass Based Power Plant Tariff
Biomass TariffCapital Cost: ` 4.26 Crore/MW (FY11-12)Capital Cost: ` 4.45 Crore/MW (FY12-13)
2011-12` /kWh
2012-13` /kWh
Andhra Pradesh 3.78 5.18
Haryana 4.97 5.65
Maharashtra 4.31 5.74
Punjab 4.94 5.83
Rajasthan 4.28 5.16
Tamil Nadu 4.58 5.12
Uttar Pradesh 4.06 5.24
Others 4.41 5.42
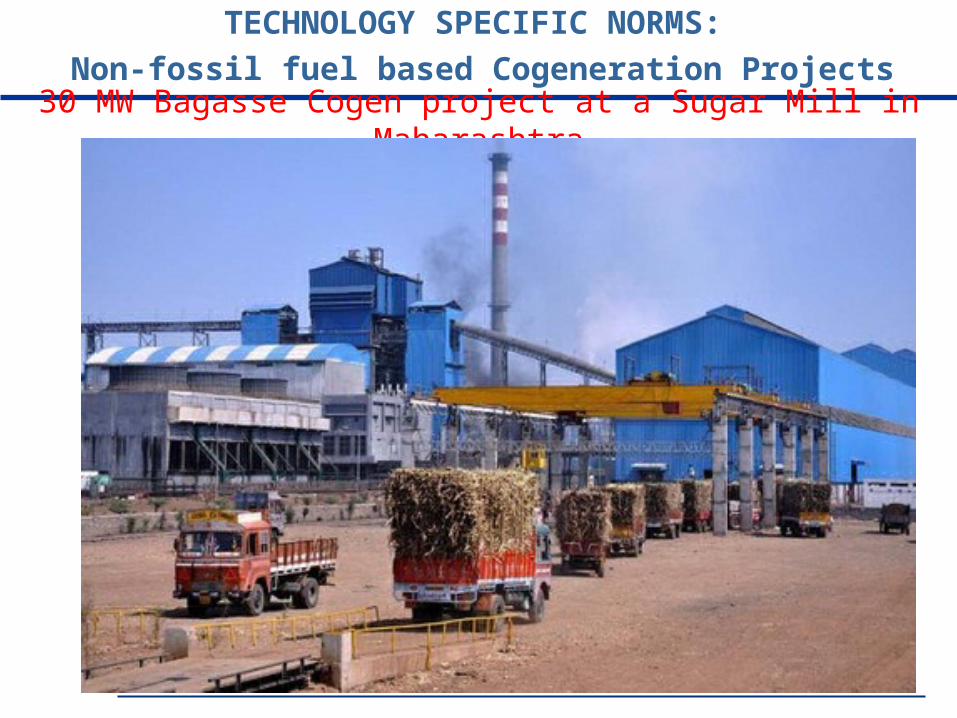
30 MW Bagasse Cogen project at a Sugar Mill in Maharashtra
TECHNOLOGY SPECIFIC NORMS:
Non-fossil fuel based Cogeneration Projects

Bagasse based cogeneration
Non-fossil fuel based Cogeneration Projects
- Capital Cost
Capital Cost
O & M Cost
Bagasse Price
Proposal in Draft RE Tariff Regulations-2012: ` 420 Lakh /
MW
Comments Received
• IL&FS RE Ltd.
• Capital cost of bagasse based co-generation projects should be `
550 Lakhs/MW.
• Capital Cost of two projects (36 MW and 44 MW) commissioned
by IREL under Urjankur Nidhi initiative on Boot basis incurred
project cost of ` 530 Lakh/MW and ` 550 Lakh/MW respectively
for projects with 110 ata pressure and 5400 C temperature.
RE Trariff Regulations-2012
• While proposing the normative capital cost of ` 420 Lakh / MW
we considered the capital cost norm developed by IREDA for
financing the project during FY 2011-12 considering the typical
size of the project for 2500 TCD with 66 bar / 480 o C
configuration.
Auxiliary Consumption

Bagasse based cogeneration
Non-fossil fuel based Cogeneration Projects
- Capital Cost
Capital Cost
O & M Cost
Bagasse Price
IREDA Benchmark for financing biomass projects for FY 2011-12
• It can be seen that higher capital cost is justified if one opts
for higher temperature and pressure configuration.
• Commission reatained the norm of Capital Cost at ` 420
Lakhs/MW which is also in line with the benchmark capital
cost norm developed by IREDA
Pressure
Configuratio
n
Kg/ cm2
Bagasse Co-gen (` Crore/MW)
2500
TCD3500 TCD 5000 TCD
>5000 TCD
44 3.70 3.58 3.53 3.46
66 4.13 4.06 4.00 3.93
86 4.77 4.70 4.66 4.60
102 5.42 5.12 4.83 4.77
110 5.53 5.22 4.93 4.87
Auxiliary Consumption

Bagasse based cogeneration
Non-fossil fuel based Cogeneration Projects
- Bagasse Price
Capital Cost
O & M Cost
Bagasse Price
Proposal
• Bagasse price assumption for FY2012-13 (`/MT) across
States: ‘equivalent heat value’ approach for landed cost of
coal for thermal Stations for respective States
State Bagasse Price (`/MT)
Andhra Pradesh 1307
Haryana 1859
Maharashtra 1327
Madhya Pradesh 946
Punjab 1636
Tamil Nadu 1408
Uttar Pradesh 1458
Other States 1420
Auxiliary Consumption

Bagasse based cogeneration
Non-fossil fuel based Cogeneration Projects
- Bagasse Price
Capital Cost
O & M Cost
Bagasse Price
Proposal Draft RE tariff Regulations-2012
• Bagasse price assumption for FY2012-13 (`/MT) across
States: ‘equivalent heat value’ approach for landed cost of
coal for thermal Stations for respective States
State Bagasse Price (`/MT)
Andhra Pradesh 1307
Haryana 1859
Maharashtra 1327
Madhya Pradesh 946
Punjab 1636
Tamil Nadu 1408
Uttar Pradesh 1458
Other States 1420
Auxiliary Consumption

Bagasse based cogeneration
Non-fossil fuel based Cogeneration Projects
- Bagasse Price
Capital Cost
O & M Cost
Bagasse Price
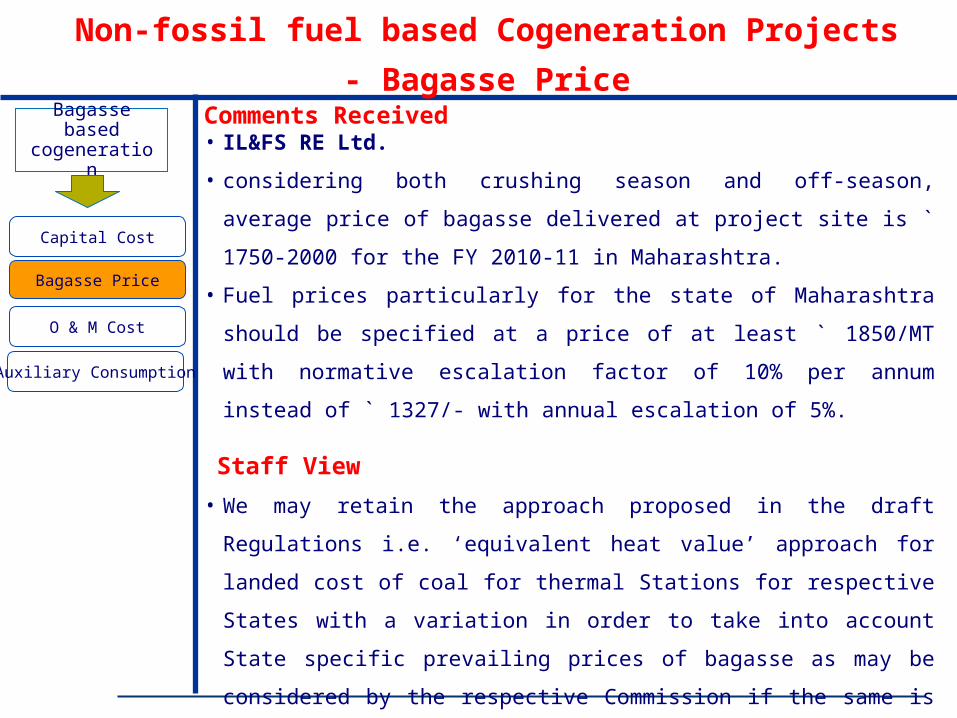
Comments Received
IL&FS RE Ltd. : Considering both crushing season and off-season,
average price of bagasse delivered at project site is ` 1750-2000
for the FY 2010-11 in Maharashtra.
• Fuel prices particularly for the state of Maharashtra should be
specified at a price of at least ` 1850/MT with normative
escalation factor of 10% per annum instead of ` 1327/- with
annual escalation of 5%. RE Tariff Regulations-2012
• Commission retained the approach proposed in the draft
Regulations i.e. ‘equivalent heat value’ approach for landed cost
of coal for thermal Stations for respective States with a variation
in order to take into account State specific prevailing prices of
bagasse as may be considered by the respective Commission if
the same is higher than the price. Accordingly Maharashtra State
price revised to Rs. 1832/MT and MP shifted to other States
category
Bagasse based cogeneration
Non-fossil fuel based Cogeneration Projects
- Bagasse Price
Capital Cost
O & M Cost
Bagasse Price
Comments Received• IL&FS RE Ltd.
• considering both crushing season and off-season, average price of
bagasse delivered at project site is ` 1750-2000 for the FY 2010-
11 in Maharashtra.
• Fuel prices particularly for the state of Maharashtra should be
specified at a price of at least ` 1850/MT with normative
escalation factor of 10% per annum instead of ` 1327/- with
annual escalation of 5%.
Staff View
• We may retain the approach proposed in the draft Regulations i.e.
‘equivalent heat value’ approach for landed cost of coal for
thermal Stations for respective States with a variation in order to
take into account State specific prevailing prices of bagasse as
may be considered by the respective Commission if the same is
higher than the price.
Auxiliary Consumption
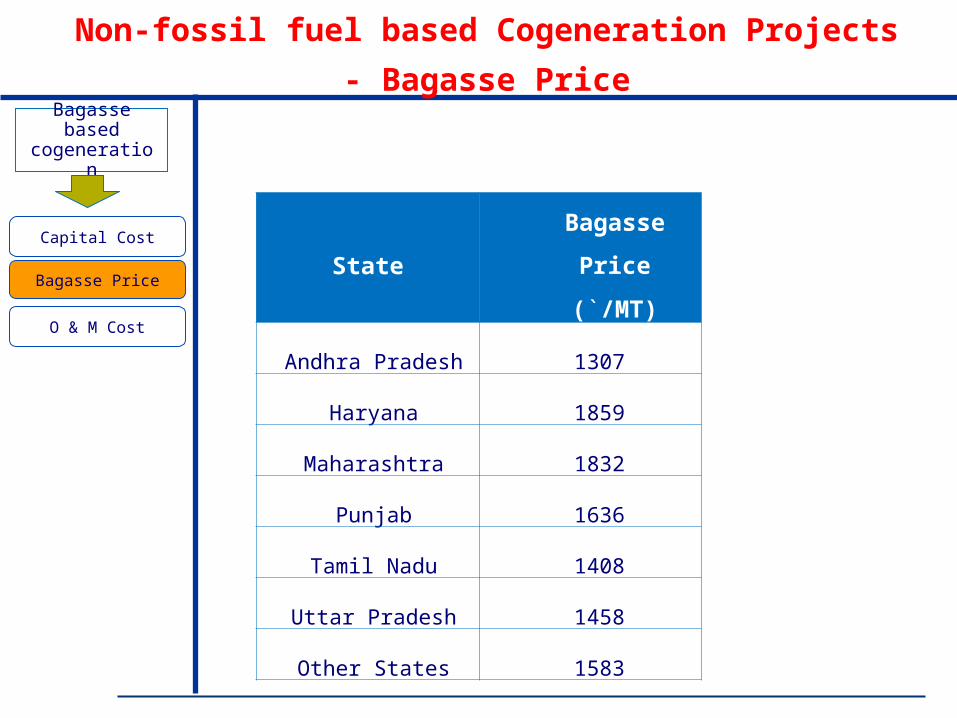
Bagasse based cogeneration
Non-fossil fuel based Cogeneration Projects
- Bagasse Price
Capital Cost
O & M Cost
Bagasse Price
StateBagasse Price
(`/MT)
Andhra Pradesh 1307
Haryana 1859
Maharashtra 1832
Punjab 1636
Tamil Nadu 1408
Uttar Pradesh 1458
Other States 1583

Bagasse based cogeneration
Non-fossil fuel based Cogeneration Projects
- O & M Expenses
Capital Cost
O & M Cost
Bagasse Price
Proposal in Draft Regulations-2012
• ` 16 Lakh/MW for FY 2012-13
GUVNL
• O&M expanses should be consider at ` 14.75 Lakh/MW as
considered by the SERCs with annual escalation at 5.72%
Staff View
• Normative O&M Expenses for non‐fossil fuel co‐generation
projects for the year 2012‐13 has been specified as ` 16 Lakh
per MW which shall be escalated at the rate of 5.72% per
annum over the tariff period
Auxiliary Consumption
Bagasse based cogeneration
Reg. 50: Non-fossil fuel based Cogeneration Projects
- Auxiliary consumption
Capital Cost
O & M Cost
Bagasse Price
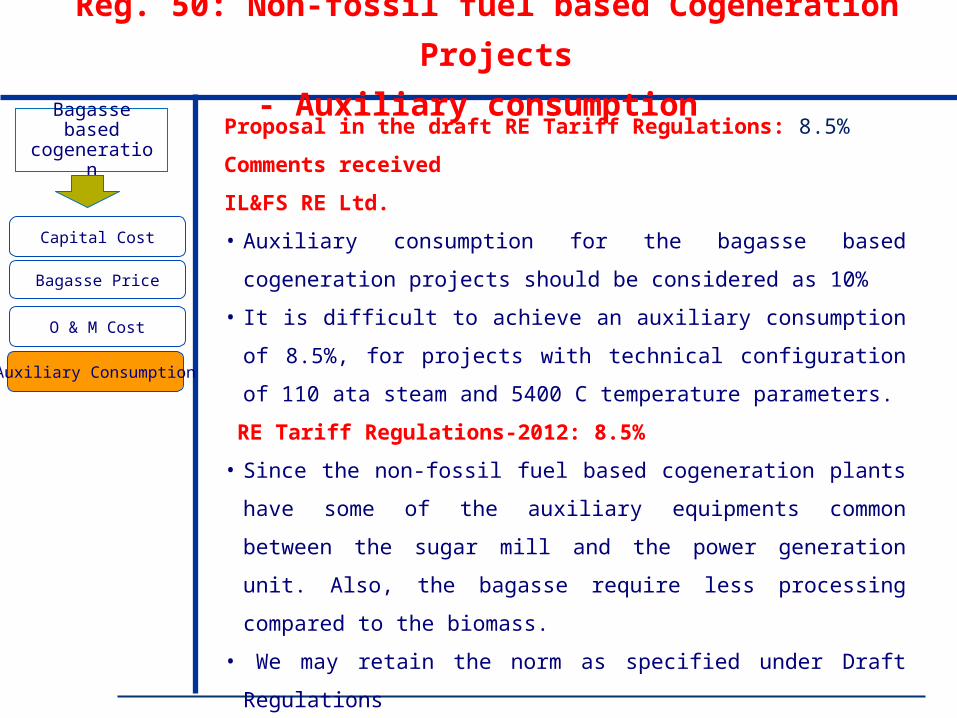
Proposal in the draft RE Tariff Regulations: 8.5%
Comments received
IL&FS RE Ltd.
• Auxiliary consumption for the bagasse based cogeneration
projects should be considered as 10%
• It is difficult to achieve an auxiliary consumption of 8.5%, for
projects with technical configuration of 110 ata steam and
5400 C temperature parameters.
RE Tariff Regulations-2012: 8.5%
• Since the non-fossil fuel based cogeneration plants have
some of the auxiliary equipments common between the sugar
mill and the power generation unit. Also, the bagasse require
less processing compared to the biomass.
• We may retain the norm as specified under Draft Regulations
Auxiliary Consumption
Bagasse based cogeneration
Tariff: Non-fossil fuel based Cogeneration Projects
Capital Cost
O & M Cost
Bagasse Price
Auxiliary Consumption
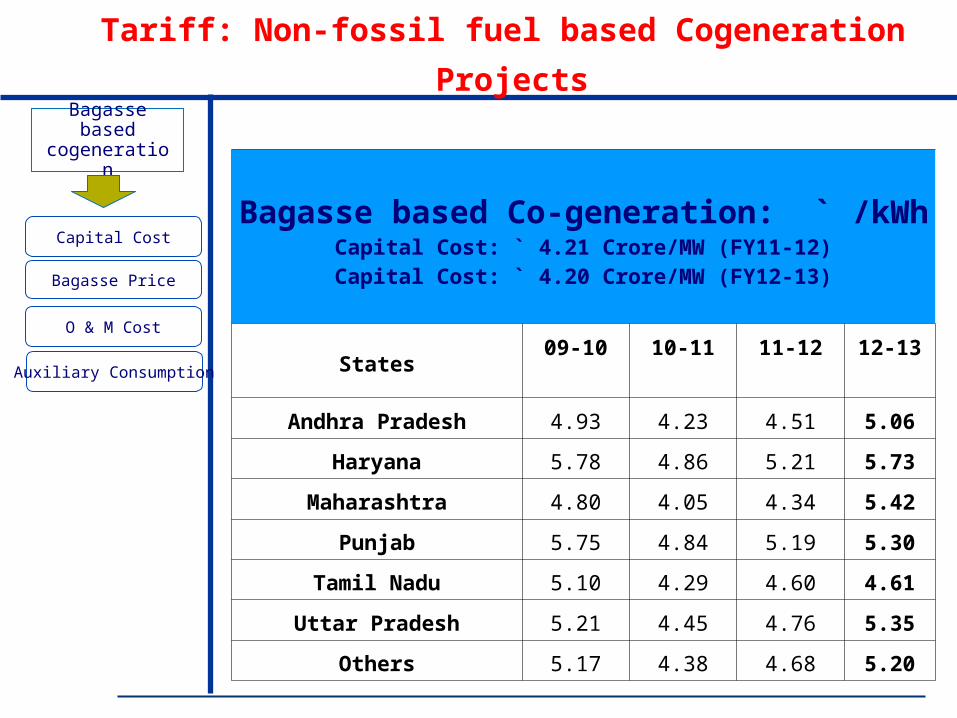
Bagasse based Co-generation: ` /kWhCapital Cost: ` 4.21 Crore/MW (FY11-12)Capital Cost: ` 4.20 Crore/MW (FY12-13)
States09-10
` /kWh10-11
` /kWh11-12
` /kWh12-13
` /kWh
Andhra Pradesh 4.93 4.23 4.51 5.06
Haryana 5.78 4.86 5.21 5.73
Maharashtra 4.80 4.05 4.34 5.42
Punjab 5.75 4.84 5.19 5.30
Tamil Nadu 5.10 4.29 4.60 4.61
Uttar Pradesh 5.21 4.45 4.76 5.35
Others 5.17 4.38 4.68 5.20

TECHNOLOGY SPECIFIC NORMS:
SOLAR PV POWER PLANT
Solar PV
Solar Photovoltaic (PV) Power Project
- Capital Cost & Module Cost
Module Cost
O & M Cost
Non Module Cost
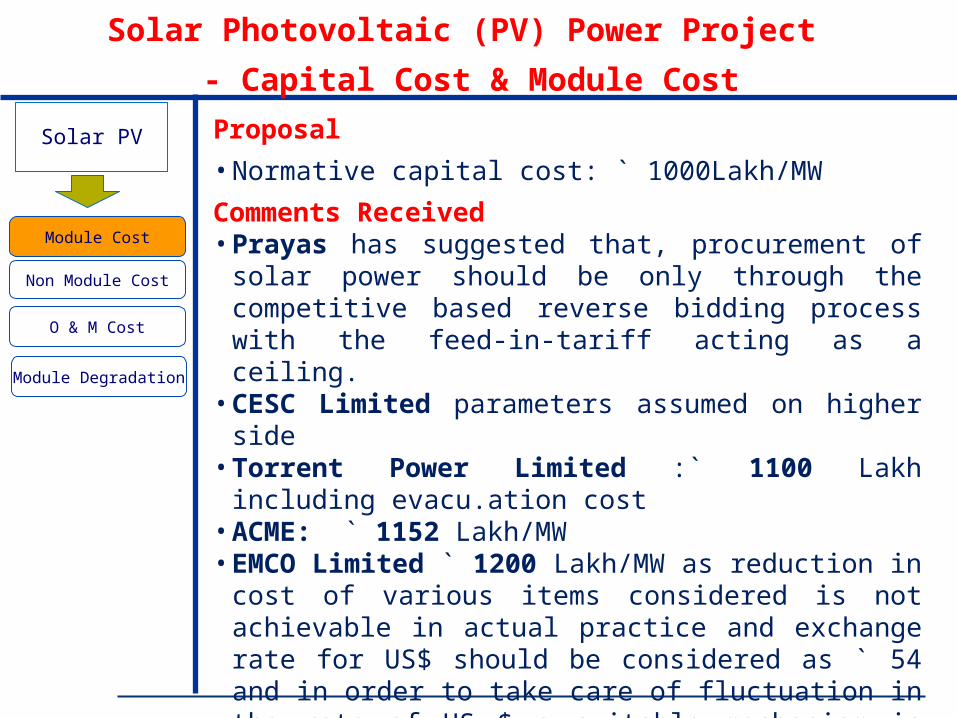
Proposal
• Normative capital cost: ` 1000Lakh/MW
Comments Received• Prayas has suggested that, procurement of solar power
should be only through the competitive based reverse bidding process with the feed‐in‐tariff acting as a ceiling.
• CESC Limited parameters assumed on higher side• Torrent Power Limited :` 1100 Lakh including
evacu.ation cost• ACME: ` 1152 Lakh/MW• EMCO Limited ` 1200 Lakh/MW as reduction in cost of
various items considered is not achievable in actual practice and exchange rate for US$ should be considered as ` 54 and in order to take care of fluctuation in the rate of US $ a suitable mechanism is needed to be devised and it may be made pass through.
Module Degradation

Solar PV
Solar Photovoltaic (PV) Power Project
- Capital Cost & Module Cost
Module Cost
O & M Cost
Non Module Cost
Proposal
• Normative capital cost: ` 1000Lakh/MW
Comments Received
• Reliance Power Ltd.: `1300 - 1400 Lakh/MW
• SDS Solar Private Limited:
• Only module cost has gone down and other non
module cost components have gone up.
• Solar PV project cost should be considered under
two head: (1) Project upto Max of 2 MW and (2)
bigger projects.
Module Degradation

Solar PV
Reg. 57: Solar Photovoltaic (PV) Power Project
- Capital Cost: Module cost
Capital Cost
O & M Cost
CUF
Solar PV modules price: Energy Trend’s survey
weekly spot prices per watt as on 28/12//2011
Module Degradation
Solar PV
Reg. 57: Solar Photovoltaic (PV) Power Project
- Capital Cost: Module Cost
Capital Cost
O & M Cost
CUF
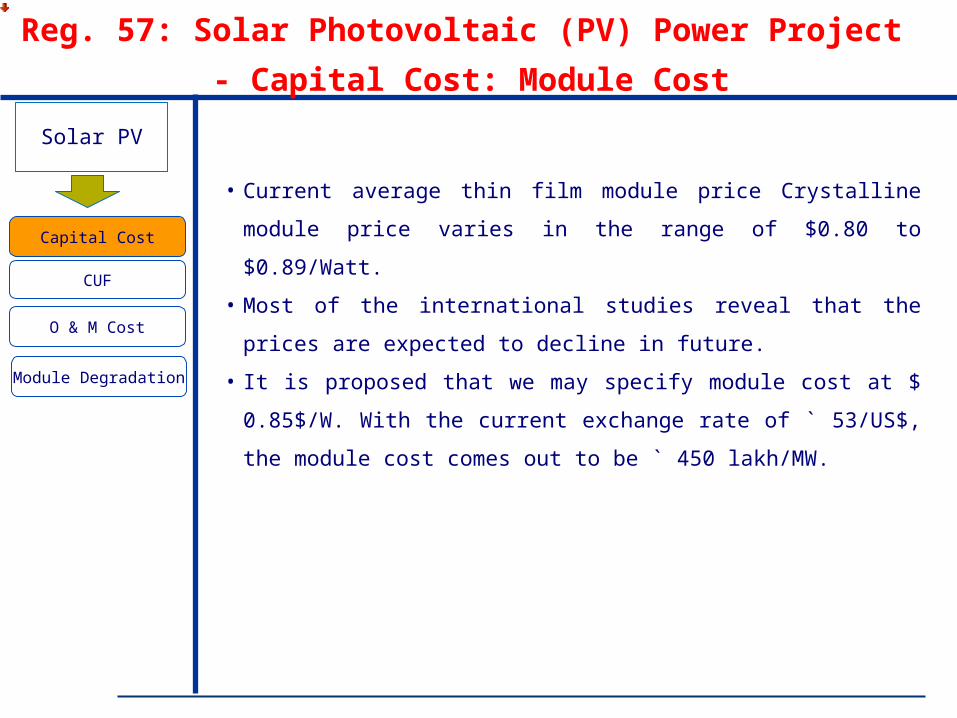
• Current average thin film module price Crystalline module
price varies in the range of $0.80 to $0.89/Watt.
• Most of the international studies reveal that the prices are
expected to decline in future.
• It is proposed that we may specify module cost at $ 0.85$/W.
With the current exchange rate of ` 53/US$, the module cost
comes out to be ` 450 lakh/MW.
Module Degradation

Solar PV
Solar Photovoltaic (PV) Power Project
- Capital Cost: Non-Module Cost
CUF
O & M Cost
Capital Cost
Non Module Cost
Benchmark project cost of Solar PV projects
• Total cost of Solar Photo voltaic power projects for the FY2012-13 as `
9.34 Crore/MW
• Taking care of degradation in the module output over a period of time,
the total cost of Solar Photo voltaic power projects for the FY2012-13
proposed at ` 10.0 Crore/MW
Sr. No. Particulars
Capital Cost Norm
FY 2011-12 (` Cr/MW)
Capital Cost Norm
FY 2012-13 (` Cr/MW)
1 Land Cost 0.15 0.162 Civil and General Works 0.95 0.903 Mounting Structures 1.05 1.004 Power Conditioning Unit 1.60 0.98
5Evacuation Cost up to Inter-connection Point (Cables and Transformers)
0.90 1.00
6
Preliminary and Pre-Operative Expenses including IDC and contingency
1.22 0.80
7 Total Non Module Cost 5.87 4.84

Solar PV
Solar Photovoltaic (PV) Power Project
- Capacity Utilization Factor
Capital Cost
O & M Cost
CUF
Proposal :Normative CUF: 19%
Comments Received• EMCO Limited :
• Normative CUF should be considered at 17-18 % as only few States like Rajasthan and Gujarat are able to achieve a CUF of 19%.
• EMCO Limited has further suggested that the auxiliary consumption for solar PV projects should be considered as 1% of the total generation as the energy consumption by inverters, air conditioning, and water treatment and pumping, lighting is high. GERC draft Sola PV Tariff order has also considered the same.
• Torrent Power Limited • Actual data from the operating site should be collected,
analyzed and be used as the basis for determination of CUF for Solar PV projects.
• Aannual degradation of 1% in CUF annually should be considered in the Regulation.
• GUVNL • CUF should be specified on zonal basis which will ensure
benefit to consumers in areas where high solar radiation are received
Solar PV
Reg. 59: Solar Photovoltaic (PV) Power Project
- Capacity Utilization Factor
Capital Cost
O & M Cost
CUF
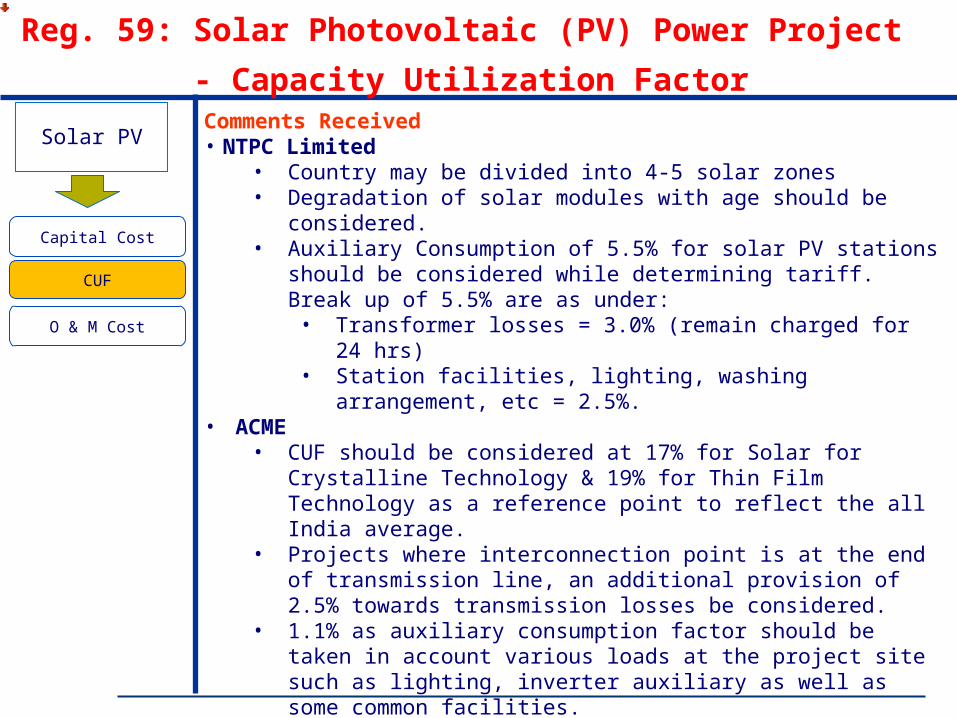
Comments Received• NTPC Limited
• Country may be divided into 4-5 solar zones • Degradation of solar modules with age should be considered. • Auxiliary Consumption of 5.5% for solar PV stations should be
considered while determining tariff. Break up of 5.5% are as under:
• Transformer losses = 3.0% (remain charged for 24 hrs)• Station facilities, lighting, washing arrangement, etc =
2.5%.• ACME
• CUF should be considered at 17% for Solar for Crystalline Technology & 19% for Thin Film Technology as a reference point to reflect the all India average.
• Projects where interconnection point is at the end of transmission line, an additional provision of 2.5% towards transmission losses be considered.
• 1.1% as auxiliary consumption factor should be taken in account various loads at the project site such as lighting, inverter auxiliary as well as some common facilities.
• Shri Shanti Prasad • Auxiliary consumption and de-ration to be considered

Solar PV
Reg. 59: Solar Photovoltaic (PV) Power Project
- Capacity Utilization Factor
Capital Cost
O & M Cost
CUF
• A study carried out by the Commission on “Performance of Solar Power Plants In India” reveals that the average CUF at more than 80% locations works out to be more than 19% for solar PV plant based on thin film technology. Similarly, the average CUF at more than 50% locations works out to be more than 19% for solar PV plants based on crystalline technology.
• Considering the same and in the absence of actual data of full one year, we to retain the benchmark CUF as proposed in the draft Regulations for the next Control Period for determination tariff.
Solar PV
Solar Photovoltaic (PV) Power Project
- O & M Expenses
Capital Cost
O & M Cost
CUF
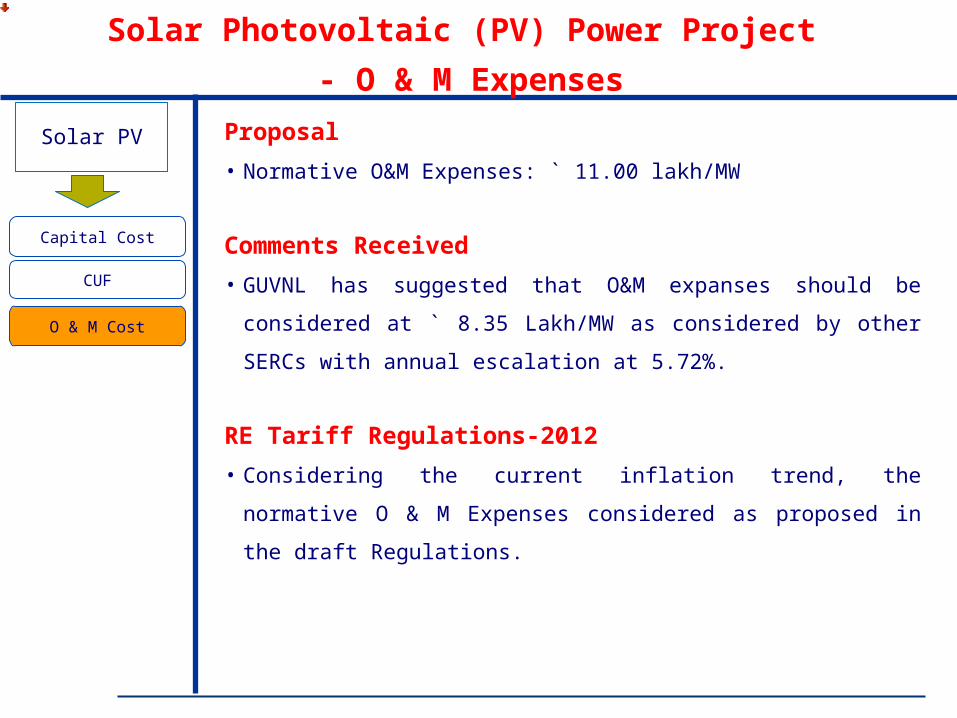
Proposal
• Normative O&M Expenses: ` 11.00 lakh/MW
Comments Received
• GUVNL has suggested that O&M expanses should be
considered at ` 8.35 Lakh/MW as considered by other SERCs
with annual escalation at 5.72%.
RE Tariff Regulations-2012
• Considering the current inflation trend, the normative O & M
Expenses considered as proposed in the draft Regulations.
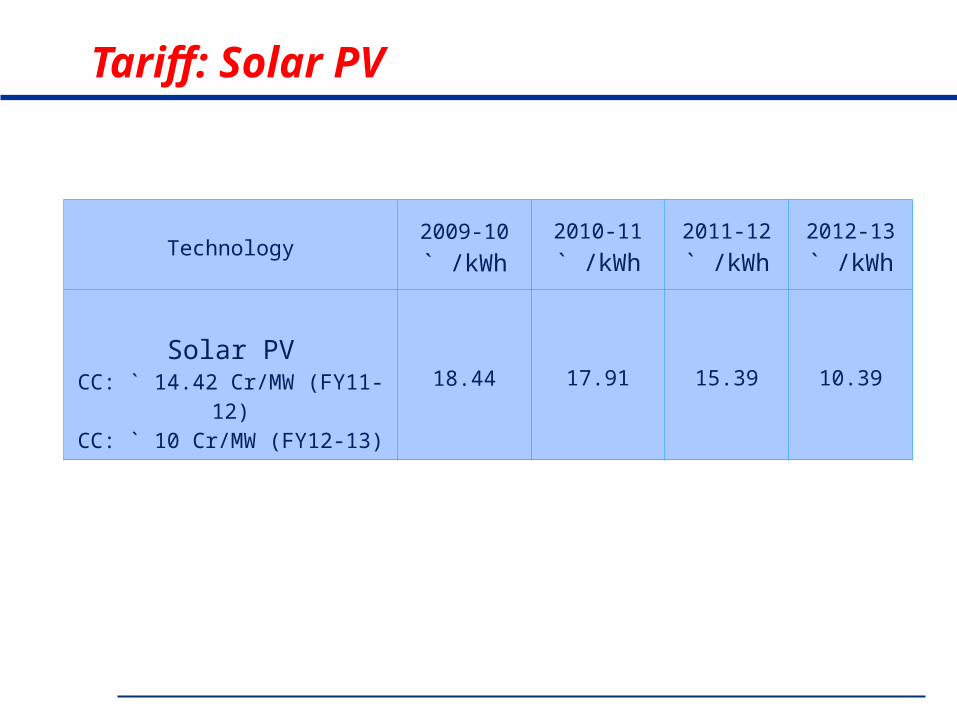
Tariff: Solar PV
Technology2009-10
` /kWh2010-11
` /kWh2011-12
` /kWh2012-13
` /kWh
Solar PVCC: ` 14.42 Cr/MW (FY11-12)
CC: ` 10 Cr/MW (FY12-13)
18.44 17.91 15.39 10.39

TECHNOLOGY SPECIFIC NORMS:
SOLAR THERMAL POWER PLANT
Solar Thermal
Solar Thermal Power Project
- Capital Cost
Module Cost
O & M Cost
C U F
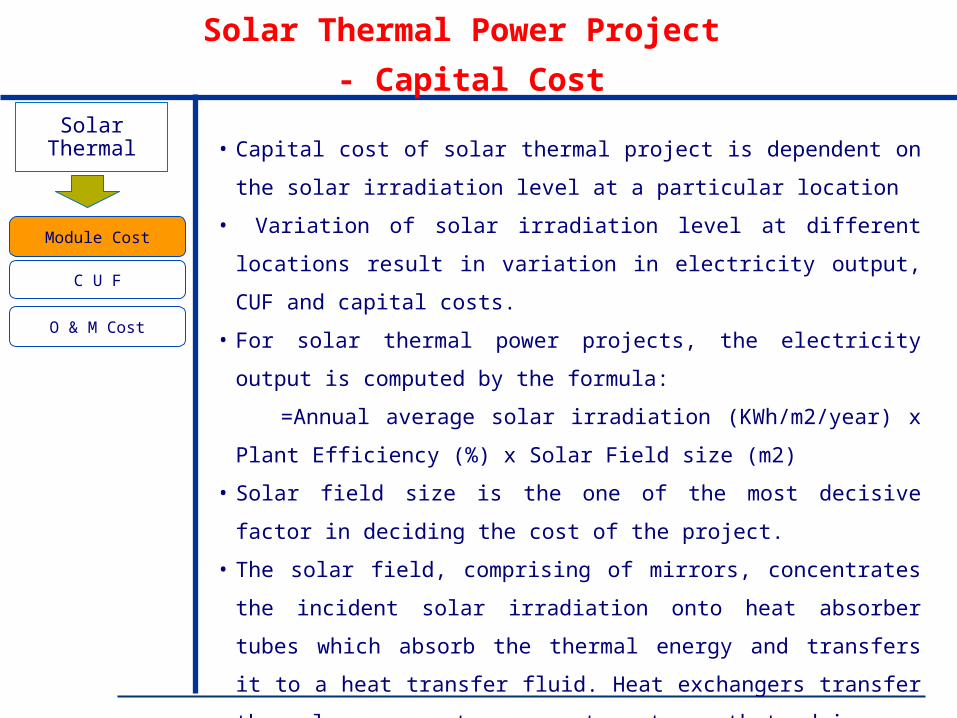
• Capital cost of solar thermal project is dependent on the solar
irradiation level at a particular location
• Variation of solar irradiation level at different locations result in
variation in electricity output, CUF and capital costs.
• For solar thermal power projects, the electricity output is
computed by the formula:
=Annual average solar irradiation (KWh/m2/year) x Plant
Efficiency (%) x Solar Field size (m2)
• Solar field size is the one of the most decisive factor in deciding
the cost of the project.
• The solar field, comprising of mirrors, concentrates the incident
solar irradiation onto heat absorber tubes which absorb the
thermal energy and transfers it to a heat transfer fluid. Heat
exchangers transfer thermal energy to generate steam that
drives a conventional turbine.

Solar Thermal
Solar Thermal Power Project - Solar Field Size
Module Cost
O & M Cost
C U F
• Designing the ‘right’ size of solar field to generate sufficient
thermal heat required to drive the turbine continually
throughout its operation is depend on the solar irradiation level
which varies according to the ‘time of day’ (maximum in the
afternoon, low in the mornings and evenings) and ‘month of
year’ (lower during monsoon, higher during summer months).
• A larger than necessary (or a smaller) solar field may result in
excess (or deficient) solar energy required to drive the turbine
thereby causing solar energy to be dumped.
• Based on the solar field efficiency, hourly incident irradiation,
and the thermal to electric plant efficiency, solar simulation
software is used to compute the thermal heat of steam required
by the system to drive the steam turbine for different solar field
sizes, along with electric output, capital costs, and CUF.

Solar Thermal
Solar Thermal Power Project
- Capital Cost & CUF
Module Cost
O & M Cost
C U F
• The CUF is dependent on solar field size and no. of hours of
storage which are optimized for minimum LOCE.
• Project cost is dependent on the CUF projected and
corresponding solar field size.
• Solar irradiation varies from location to location across the
country. Therefore field size requirement and in turn the project
cost would also vary for a particular CUF across the country.
• Parabolic Trough technology has achieved close to full
commercial status while cost data for the power Tower, Fresnel
and Dish Stirling technologies are in the process of being
established.
• Therefore, available cost data of Parabolic Trough technology is
considered for the determination of benchmark capital cost
norm for solar thermal projects for the year 2012-13.

Solar Thermal
Solar Thermal Power Project - Capital Cost & CUF
Module Cost
O & M Cost
C U F
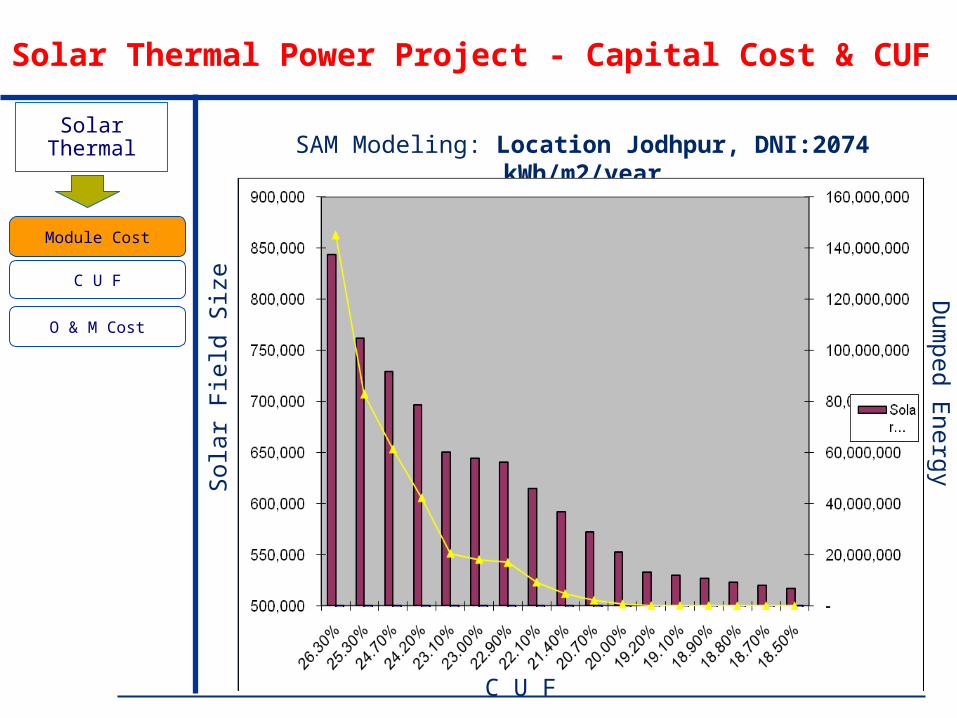
• Relation between solar field size, corresponding CUF and dumped
energy for a 111 MW plant with net generation of 100 MW
SM Solar Field Output CUF E-Dump Dump/Output
1.64 843,660 229,802,081.00 26.30% 145,249,200 63.2062%
1.48 761,910 221,261,862.00 25.30% 83,002,880 37.5134%
1.415 729,210 216,570,205.00 24.70% 61,464,410 28.3808%
1.35 696,510 211,657,613.00 24.20% 42,340,810 20.0044%
1.26 650,730 202,454,388 23.10% 20,579,080 10.1648%
1.25 644,190 200,980,390 23.00% 18,134,440 9.0230%
1.245 640,920 200,233,277 22.90% 16,970,220 8.4752%
1.195 614,760 193,631,312 22.10% 9,262,562 4.7836%
1.15 591,870 187,090,149 21.40% 4,788,951 2.5597%
1.11 572,250 181,053,466 20.70% 2,215,236 1.2235%
1.07 552,630 174,750,605 20.00% 712,963 0.4080%
1.035 533,010 168,054,750 19.20% 78,549 0.0467%
1.03 529,740 166,854,200 19.10% 39,564 0.0237%
1.02 526,470 165,810,786 18.90% 13,534 0.0082%
1.015 523,200 154,522,901 18.80% 1,392 0.0009%
1.01 519,930 163,352,776 18.70% -
1 516,660 162,145,245 18.50% -
SAM Modeling
LocationJodhpur
DNI: 2074 kWh/m2/year
Solar Thermal
Solar Thermal Power Project - Capital Cost & CUF
Module Cost
O & M Cost
C U F
SAM Modeling: Location Jodhpur, DNI:2074 kWh/m2/year
Sol
ar F
ield
Siz
e Dum
ped Energy
C U F

Solar Thermal
Reg. 61: Solar Thermal Power Project - Capital Cost & CUF
Module Cost
O & M Cost
C U F
SAM Modeling: Location Jodhpur, DNI:2074 kWh/m2/year
Sol
ar F
ield
Siz
e Dum
ped Energy
C U F

Solar Thermal
Reg. 61: Solar Thermal Power Project - Capital Cost & CUF
Module Cost
O & M Cost
C U F
SAM Modeling: Location Jodhpur, DNI:2074 kWh/m2/yearSolar Field (m2 )/MW 5804
Sr. No. Particulars € per m21 Structure 302 HCE (Absorber Tubes): 413 Mirrors 35
4 Labour charges for assembling, welding, allignment and topography 125 Solar Field Piping 206 HTF System (pumps, tanks, Heat exchangers etc.) 357 HTF Fluid 158 Electrical system 109 Control and Instrumentation 12
10 Civil Works 25 Total Solar Field cost € /m2 235A Total Solar Field cost ` Crore / MW 9.00 Power Block 1 Steam Turbine and alternator € per kW 225
2 Balance of Plant* 175 Total Power Block cost € per kW 400
B Total Power Block cost per MW ` Crore / MW 2.64 Other Cost elements 1 Land cost: (6.25 Acre/MW `3 lakh/Acre) ` Crore / MW 0.192 Site development ` Crore/MW 0.46
3 Erection and commissioning charges: 2.5% of total A+B 0.29
4 Preliminary & Pre-Operative Expenses including IDC and contingency and other costs 1.25
C Other Cost elements ` Crore / MW 2.19
Total Project Cost: A+B+C ` Crore / MW 13.83
*
Steam generation system, Cooling tower, condensation system, Auxiliary System, water treatment plant, Cooling Tower, compressed air system, water pumping from catchment area, effluent treatment, fire protection, maintenance workshop, Control and instrumentation, Civil works, Electrical substation, lines and installation

Solar Thermal
Reg. 61: Solar Thermal Power Project - Capital Cost & CUF
Module Cost
O & M Cost
C U F
http://www.shriramepc.com/pdf/Shriram-EPC-Clip-aug-24-2011.pdf

Solar Thermal
Solar Thermal Power Project – O & M Cost
Module Cost
O & M Cost
C U F
• There is hardly any operational experience of MW scale thermal
power projects in India to ascertain norms for O&M expenses.
• Regulation 63 of the RE Regulations-2009
• Normative O&M expenses for solar thermal power projects
FY2009-10: ` 13.00 Lakh/MW to be escalated at the rate of
5.72% per annum
• FY 2011-12: ` 14.53 Lakh/MW
RE Tariff Regulations-2012
• FY2012-13: ` 15 Lakh/MW

Solar Thermal
Technology2009-10
` /kWh2010-11
` /kWh2011-12
` /kWh2012-13
` /kWh
Solar ThermalCC: ` 15 Cr/MW (FY11-12)CC: ` 13 Cr/MW (FY12-13)
13.45 15.31 15.04 12.46
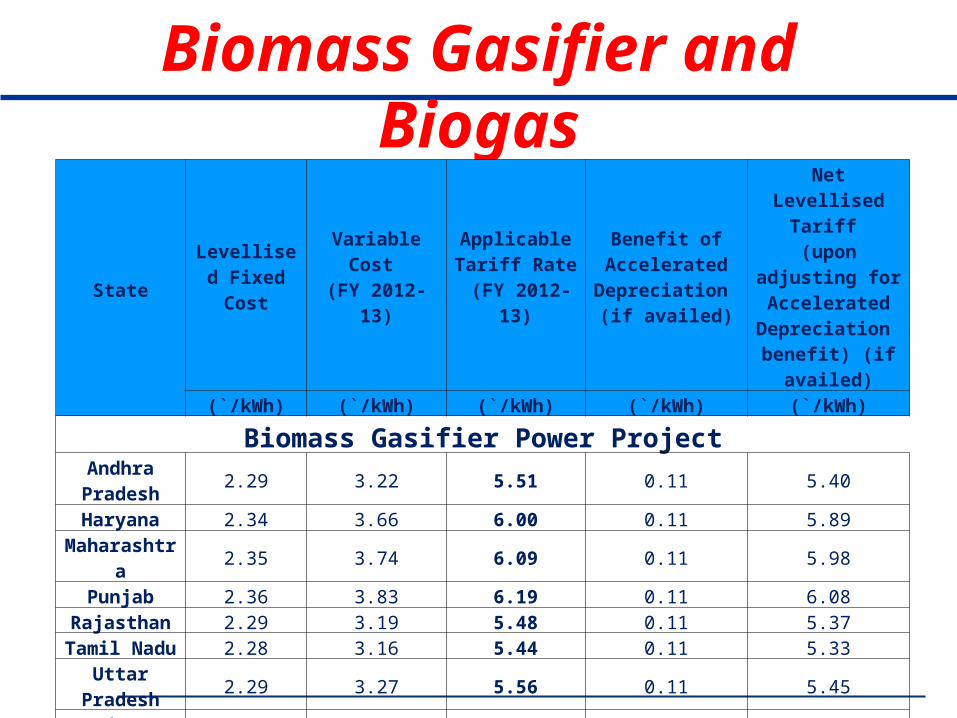
Biomass Gasifier and Biogas
StateLevellised Fixed Cost
Variable Cost (FY 2012-13)
Applicable Tariff Rate
(FY 2012-13)
Benefit of Accelerated
Depreciation (if availed)
Net Levellised Tariff
(upon adjusting for Accelerated
Depreciation benefit) (if availed)
(`/kWh) (`/kWh) (`/kWh) (`/kWh) (`/kWh)
Biomass Gasifier Power ProjectAndhra Pradesh
2.29 3.22 5.51 0.11 5.40
Haryana 2.34 3.66 6.00 0.11 5.89
Maharashtra 2.35 3.74 6.09 0.11 5.98
Punjab 2.36 3.83 6.19 0.11 6.08Rajasthan 2.29 3.19 5.48 0.11 5.37
Tamil Nadu 2.28 3.16 5.44 0.11 5.33
Uttar Pradesh 2.29 3.27 5.56 0.11 5.45
Others 2.32 3.44 5.76 0.11 5.65
Biogas based power projectBiogas 3.06 3.38 6.44 0.21 6.23

Thank You