Aberdeen Cost of Quality
20
The Cost of Quality Benchmarking Enterprise Quality Management July 2007
-
Upload
chethan626 -
Category
Documents
-
view
219 -
download
1
Transcript of Aberdeen Cost of Quality

The Cost of Quality Benchmarking Enterprise Quality Management
July 2007

The Cost of Quality: Benchmarking Enterprise Quality Management Page 2
© 2007 Aberdeen Group, Inc. Telephone: 617 723 7890 www.aberdeen.com
Executive Summary Enterprise quality management is an architectural approach to optimizing quality processes that requires transitioning from a disjointed set of quality processes to an automated set of integrated workflows based upon established best practices. Leveraging such a set of automated work flows allows manufacturers to transform disparate silos of quality data into actionable intelligence, enabling manufacturers to improve finished product quality and reduce the cost of both good and poor quality.
Best-in-Class Performance The value of enterprise quality management technologies and strategies are tied to the results attributed to their use. In the following analysis, Aberdeen uses three KPIs to distinguish Best-in-Class. Across these metrics, Best-in-Class manufacturers averaged the following performances:
• 91% First Pass Yield
• 95% Overall Yield
• 5.04 Sigma - as a measure of Defects per Million Opportunities in the production process
Competitive Maturity Assessment Survey results show that firms enjoying Best-in-Class performance share several common characteristics which include:
• Quality process workflows and escalation procedures are established and standardized at the corporate level while executed at the department level.
• Supplier, factory floor, and customer quality data is collected automatically and leveraged as actionable intelligence.
• Executive ownership of quality initiatives across the enterprise.
Required Actions To achieve Best-in-Class performance, manufacturers must:
• Measure the cost of quality. Doing so is a necessary first step to creating a Best-in-Class quality management system.
• Automate quality processes that enable Best-in-Class performance, including: Genealogy and Traceability, SPC, Quality Dashboards, and Audit Documentation.
• Implement an Enterprise-Wide Quality Management System and focus on creating real-time interoperability with plant floor automation, MES, and SCM
Voice of the Manufacturer “A quality product does many things for our company. 1) It puts a quality product in the customer’s hands and establishes our reputation for the next purchase consideration 2) If we make it right the first time we don’t get it back. Warranty costs are 10 times that which it costs to get it right the first time 3) When a distributor or sales rep sees a quality product delivered to his customer there is incentive to promote that product to their other customers 4) Pride, our company and all of our employees take pride in delivering a quality product” Carl Klinge Engineering Manager EDT Corp Bearings for Extreme Environments

The Cost of Quality: Benchmarking Enterprise Quality Management Page 3
© 2007 Aberdeen Group, Inc. Telephone: 617 723 7890 www.aberdeen.com
Table of Contents Executive Summary .....................................................................2
Best-in-Class Performance ..........................................................2 Competitive Maturity Assessment ..................................................2 Required Actions ....................................................................2 Table of Contents ...................................................................3
Chapter One: Benchmarking the Best-in-Class........................................4 Aberdeen Analysis ...................................................................4 Maturity Class Framework ..........................................................4 Best-in-Class PACE Model ..........................................................5
Chapter Two: Benchmarking Requirements for Success .............................9 Competitive Assessment ............................................................9 Organizational Capabilities and Technology Enablers............................ 10
Organization .................................................................... 10 Knowledge Management ....................................................... 10 Technology ..................................................................... 11 Performance Measurement .................................................... 12
Chapter Three: Required Actions................................................... 14 Laggard Steps to Success .......................................................... 14 Industry Norm Steps to Success .................................................. 14 Best-in-Class Steps to Success .................................................... 16
Appendix A: Research Methodology ................................................ 17 Appendix B: Related Aberdeen Research ........................................... 20
Figures Figure 1: Market Pressures Driving the Best-in-Class .................................5 Figure 2: Strategic Actions the Best-in-Class are Taking ..............................6 Figure 3: Automated Quality Tools Enabling Best-in-Class Status.................. 11 Figure 4: Automated Quality Tools Supporting Best Practices ..................... 12 Figure 5: Interoperability Enables Best-in-Class Performance ...................... 13
Tables Table 1: Top Performers Earn “Best-in-Class” Status: ................................5 Table 2: Best-in-Class PACE Framework ..............................................7 Table 3: Competitive Framework ......................................................9 Table 4: PACE Framework ........................................................... 18 Table 5: Maturity Framework ........................................................ 18 Table 6: Competitive Framework .................................................... 19 Table 7: Relationship between PACE and Competitive Framework............... 19

The Cost of Quality: Benchmarking Enterprise Quality Management Page 4
© 2007 Aberdeen Group, Inc. Telephone: 617 723 7890 www.aberdeen.com
Chapter One: Benchmarking the Best-in-Class
Aberdeen Analysis Manufacturing executives have traditionally viewed quality assurance as a mandatory line item in the cost of goods sold and that competitive advantages are simply not derived from such endeavors. In turn, such a view relegated the role of quality management and the practitioners of such initiatives to the side-lines. Without executive leadership sponsoring coordinated enterprise-wide quality management programs, many manufacturers ended up making due with disjointed quality processes that left both regulators and customers wanting.
Times have changed, and this benchmark study showcases the operational performance benefits manufacturers are currently enjoying due to the adoption of enterprise quality management strategies and technologies. These manufacturers are now focusing on quality management initiatives as a source of competitive advantages while responding to the market pressures to both reduce the cost of quality and improve finished product quality.
Maturity Class Framework The value of enterprise quality management principles and technologies is tied to the results derived from their use. In the following analysis, Aberdeen uses three KPIs to distinguish the Best-in-Class from Industry Average and Laggard manufacturers.
• First Pass Yield
• Overall Yield
• DPMO
A weighted average was defined and calculated based on these three KPIs, and the market was segmented with Best-in-Class manufacturers defined as the top 20% of performers, Industry Average manufacturers defined as the middle 50%, and Industry Laggard manufacturers defined as the bottom 30% of performers. The defined KPIs were chosen because they are standard calculations used across the manufacturing industry to measure specific aspects of product and process quality. Specifically, First Pass Yield measures what share of product conforms to specification before any re-work is conducted; Overall Yield measures the total amount of finished product that conforms with specification after re-work has be conducted, and Number of Sigma as a measure of DPMO in the production process shows how close manufacturers are to achieving 6 Sigma. When all three are considered in tandem, the overall success of enterprise quality management initiatives becomes apparent.
Fast Facts Best-in-Class Performance: • 91% First Pass Yield • 95% Overall Yield • 5.04 Sigma – as a measure of
DPMO
The top three quality modules used by Best-in-Class manufacturers: • Genealogy and Traceability • Statistical Process Control • Automated Workflows & Alerts
Best-in-Class manufacturers are 33% more likely than other manufacturers to measure the cost of quality.

The Cost of Quality: Benchmarking Enterprise Quality Management Page 5
© 2007 Aberdeen Group, Inc. Telephone: 617 723 7890 www.aberdeen.com
Table 1: Top Performers Earn “Best-in-Class” Status:
Definition of Maturity Class Mean Class Performance Best-in-Class: Top 20% of aggregate performance scorers
• 91% First Pass Yield • 95% Overall Yield • 5.04 Sigma – as a measure of DPMO
Industry Average: Middle 50% of aggregate performance scorers
• 89% First Pass Yield • 90% Overall Yield • 3.68 Sigma – as a measure of DPMO
Laggard: Bottom 30% of aggregate performance scorers
• 70% First Pass Yield • 70% Overall Yield • 1.81 Sigma – as a measure of DPMO
Source: AberdeenGroup, July 2007
Best-in-Class production processes are operating over a full sigma more consistently than Industry Average production processes and this increased consistency clearly translates into improved yields. Laggard production processes are operating almost two sigmas less consistently than Industry Average production processes, which, in this case, translates to significantly reduced yields. The following analysis will show how Best-in-Class manufacturers are gaining control of production processes to improve yields and ultimately improve finished product quality while reducing the cost of quality.
Best-in-Class PACE Model Aberdeen’s PACE framework provides Industry Average and Laggard manufacturers attempting to become Best-in-Class with a structured way to understand how Best-in-Class manufacturers achieved superior performance.
Maturity Framework Key The Aberdeen Maturity Framework defines enterprises as falling into one of the three following levels of practices and performance: Best-in-Class (20%) — practices that are the best currently being employed and significantly superior to the industry norm Industry norm (50%) —practices that represent the average or norm Laggards (30%) —practices that are significantly behind the average of the industry
Figure 1: Market Pressures Driving the Best-in-Class
0%
13%
16%
42%
55%
65%
25% 50% 75%
Adhere to government regulatory requirements.
Mitigate the risks from product recalls.
Reduce the time to market of new products.
Reduce the cost of quality.
Customers demand higher product quality.
% of responding participants
0%
13%
16%
42%
55%
65%
25% 50% 75%
13%
16%
42%
55%
65%
25% 50% 75%
Adhere to government regulatory requirements.
Mitigate the risks from product recalls.
Reduce the time to market of new products.
Reduce the cost of quality.
Customers demand higher product quality.
% of responding participants
Source: AberdeenGroup, July 2007

The Cost of Quality: Benchmarking Enterprise Quality Management Page 6
© 2007 Aberdeen Group, Inc. Telephone: 617 723 7890 www.aberdeen.com
The telling graph above shows the majority of Best-in-Class manufacturers are adopting enterprise quality management initiatives in response to both customers demanding higher levels of product quality and the need to reduce the cost of quality (respondents were asked to pick their top two market drivers). This is especially interesting because of the dynamic at play between the two pressures. First and foremost, the issue is about measurement. Manufacturers must measure both the cost of quality and finished product quality in order to effect change. Second, the two metrics are opposed; the easiest way to improve finished product quality is to increase the cost of quality. But the only way to increase the quality of finished products while decreasing the cost of ensuring such quality is to dramatically increase quality performance across the whole enterprise.
The majority of Best-in-Class manufacturers address the aforementioned pressures by providing quality visibility across the value chain. However, doing so requires interoperability between multiple systems, which is reflected in the fact that many of these manufacturers are also attempting to “build in” compliance and traceability to the production processes, synchronize quality initiatives with manufacturing, and integrate product design with quality data.
With so many manufacturers relying upon a global supply chain, visibility is necessary to identify and rectify quality gaps that can occur at any node in the supply chain, impacting both the cost of quality and finished product quality. Building in compliance and traceability is another essential way for manufacturers to improve finished product quality and reduce the cost of quality. It is virtually impossible for manufacturers to cost effectively test in finished product quality. Manufacturers must gain control of the production process itself and assure finished product quality based upon production process metrics themselves.
PACE Key Aberdeen applies a methodology to benchmark research that evaluates the business pressures, actions, capabilities, and enablers (PACE) that indicate corporate behavior in specific business processes. These terms are defined as follows: Pressures — external forces that impact an organization’s market position, competitiveness, or business operations Actions — the strategic approaches that an organization takes in response to industry pressures Capabilities — the business process competencies required to execute corporate strategy Enablers — the key functionality of technology solutions required to support the organization’s enabling business practices
Figure 2: Strategic Actions the Best-in-Class are Taking
0%
Increase employee's quality training.
Integrate product design and quality data.
Synchronize quality and manufacturing.
Build compliance and traceability into processes.
Provide quality visibility across the value chain.
26%
32%
32%
35%
58%
20% 40% 60%% of responding participants0%
Increase employee's quality training.
Integrate product design and quality data.
Synchronize quality and manufacturing.
Build compliance and traceability into processes.
Provide quality visibility across the value chain.
26%
32%
32%
35%
58%
20% 40% 60%% of responding participants
Source: AberdeenGroup, July 2007

The Cost of Quality: Benchmarking Enterprise Quality Management Page 7
© 2007 Aberdeen Group, Inc. Telephone: 617 723 7890 www.aberdeen.com
Finally, synchronizing product design, manufacturing, and quality data is needed to close the enterprise quality management loop that encompasses engineering, manufacturing, and the customer. Only when this loop is closed can quality gaps, which most likely touch each of the loops nodes, be identified and rectified.
In order for the above strategic actions to successfully improve finished product quality, while also reducing the cost of quality, certain business capabilities and technology enablers must already be in place. To lend some insight into which capabilities and enablers are truly needed, Aberdeen will identify those which Best-in-Class manufacturers are currently using. By doing so, Aberdeen can identify the entire suite of capabilities and enablers that all manufacturers should implement to achieve Best-in-Class performance, all of which are listed in Table 2 below.
Table 2: Best-in-Class PACE Framework
Pressures Actions Capabilities Enablers
• Customers demanding improved finished product quality.
• Provide visibility into quality performance across the value chain.
• Use technology to “build in” not “test in” compliance and traceability to production processes.
• Quality process workflows and escalation procedures are established and standardized at the corporate level while executed at the departmental level.
• Real time interoperability exists between plant floor automation, MES, QMS, and SCM.
• Supplier, factory floor, and customer quality data is collected automatically and used as actionable intelligence.
• SPC (statistical process control)
• Automated CAPA
• Non-Conformance Reporting
• Compliance / Quality Dashboard
• Audit Documentation
• Supplier Scorecards
• Product Traceability and Raw Material Genealogy
• Automated quality workflows and alerts
• RMA (Return Material Authorization)
• NPI (New Product Introduction)
Source: AberdeenGroup, July 2007
Voice of the Manufacturer “Our company is focusing on enterprise quality management to improve product quality in the eye of the consumer. We are investing heavily in consumer quality surveys, people, and technology to improve our focus on product quality across the value chain, from the point of raw materials to the final point of consumption. To date we have used technology to improve time management and standardize the scheduling of mandatory product and process analyses and assessments ensuring the governance of work practices. We also use SPC to trend, analyze, and identify poor performing areas across the enterprise.” Kevin Akaloo Corporate QA Manager The South African Breweries Limited
The Cost of Quality: Benchmarking Enterprise Quality Management Page 8
© 2007 Aberdeen Group, Inc. Telephone: 617 723 7890 www.aberdeen.com
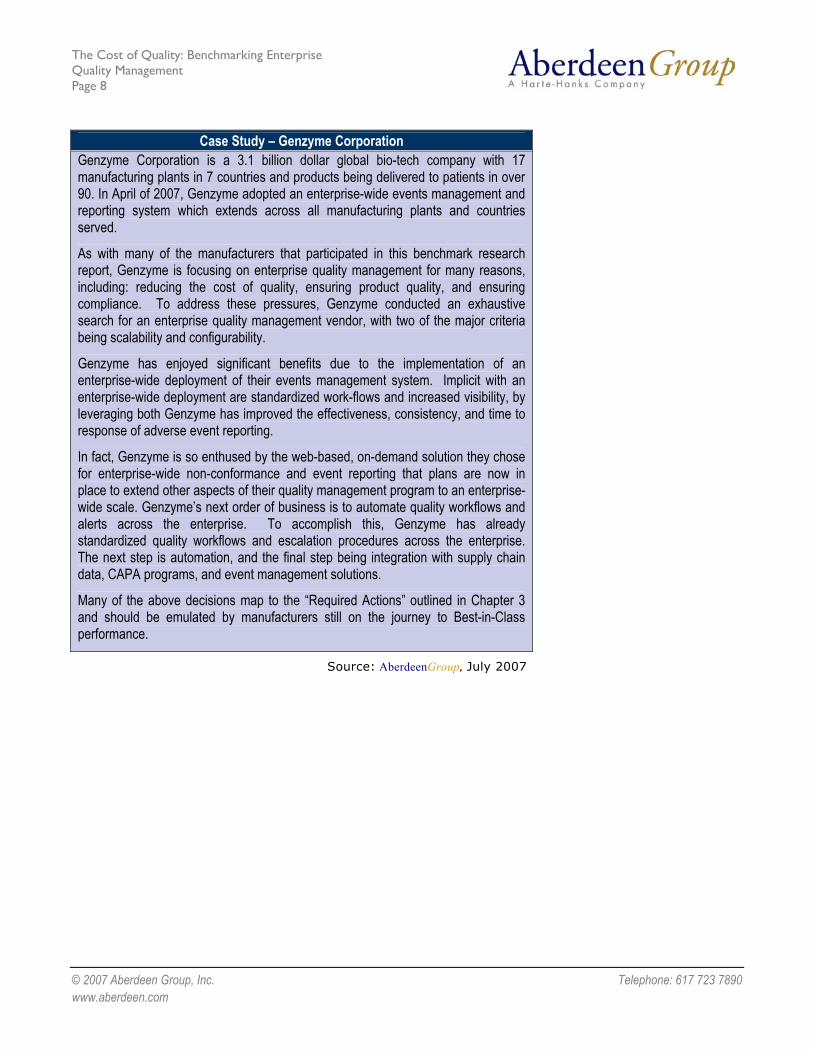
Case Study – Genzyme Corporation Genzyme Corporation is a 3.1 billion dollar global bio-tech company with 17 manufacturing plants in 7 countries and products being delivered to patients in over 90. In April of 2007, Genzyme adopted an enterprise-wide events management and reporting system which extends across all manufacturing plants and countries served.
As with many of the manufacturers that participated in this benchmark research report, Genzyme is focusing on enterprise quality management for many reasons, including: reducing the cost of quality, ensuring product quality, and ensuring compliance. To address these pressures, Genzyme conducted an exhaustive search for an enterprise quality management vendor, with two of the major criteria being scalability and configurability.
Genzyme has enjoyed significant benefits due to the implementation of an enterprise-wide deployment of their events management system. Implicit with an enterprise-wide deployment are standardized work-flows and increased visibility, by leveraging both Genzyme has improved the effectiveness, consistency, and time to response of adverse event reporting.
In fact, Genzyme is so enthused by the web-based, on-demand solution they chose for enterprise-wide non-conformance and event reporting that plans are now in place to extend other aspects of their quality management program to an enterprise-wide scale. Genzyme’s next order of business is to automate quality workflows and alerts across the enterprise. To accomplish this, Genzyme has already standardized quality workflows and escalation procedures across the enterprise. The next step is automation, and the final step being integration with supply chain data, CAPA programs, and event management solutions.
Many of the above decisions map to the “Required Actions” outlined in Chapter 3 and should be emulated by manufacturers still on the journey to Best-in-Class performance.
Source: AberdeenGroup, July 2007

The Cost of Quality: Benchmarking Enterprise Quality Management Page 9
© 2007 Aberdeen Group, Inc. Telephone: 617 723 7890 www.aberdeen.com
Chapter Two: Benchmarking Requirements for Success
Competitive Assessment
Based on the Maturity Class Framework, Aberdeen established Best-in-Class characteristics in four key categories: (1) process (ability to standardize process across the organization while maintaining the autonomy of local decision makers); (2) organization (establishing executive ownership of quality initiatives); (3) knowledge (delivering quality data as actionable intelligence); (4) technology (the use of software to support quality initiatives), (5) performance (the measurement of KPIs).
Table 3: Competitive Framework
Laggards Average Best-in-Class Quality process workflows and alerts are established and standardized at the corporate level:
37% 55% 74% Process workflows and escalations are managed at the departmental level
Process
60% 74% 87%
Executive ownership of quality initiatives across the enterprise: Organization
54% 81% 74% Quality data is collected automatically:
Knowledge 26% 38% 43% Supplier quality data is used as actionable intelligence:
56% 58% 67% Factory floor quality data is used as actionable intelligence:
57% 69% 70% Customer quality data is used as actionable intelligence:
65% 70% 73% Share of manufacturers currently using technology:
Technology √ Plant Floor
Automation: 13% √ MES: 8% √ QMS: 40% √ ERP: 44% √ SCM: 31%
√ Plant Floor Automation: 29%
√ MES: 29% √ QMS: 63% √ ERP: 61% √ SCM 43%
√ Plant Floor Automation: 30%
√ MES: 30% √ QMS: 70% √ ERP: 71% √ SCM: 70%
Share of manufacturers measuring the cost of quality: Performance 51% 52% 68%
Source: AberdeenGroup, July 2007
Fast Facts The Best-in-Class are: • Over 50% more likely than other manufacturers to have quality process workflows and alerts established and standardized at the corporate level. • Nearly a third more likely than other manufacturers to execute quality workflows and alerts at the departmental level. • Over a third more likely than other manufacturers to use QMS. • Nearly a third more likely than other manufacturers to measure the cost of quality.

The Cost of Quality: Benchmarking Enterprise Quality Management Page 10
© 2007 Aberdeen Group, Inc. Telephone: 617 723 7890 www.aberdeen.com
Organizational Capabilities and Technology Enablers Best-in-Class manufacturers use a two-tiered business process strategy. First, Best-in-Class manufacturers establish and standardize quality process workflows and escalation procedures at the corporate level. Second, Best-in-Class manufacturers allow the execution of these quality processes and escalations to be managed at the local departmental level. Such a process structure allows Best-in-Class manufacturers to build workflows based on best practices and continuous improvement principles, while still benefiting from the flexibility attributed to local execution.
Organization An interesting result reveals itself when the organizational structures of the Best-in-Class are examined. It turns out that the executive sponsorship of enterprise quality management initiatives is a necessary but non-sufficient attribute for Best-in-Class performance. Furthermore, executive sponsorship may not even be enough to pull a manufacturer out of the Laggard category. In fact, a majority of Laggard manufacturers have already established executive sponsorship of enterprise quality initiatives. The take-away here is that all manufacturers must have enterprise quality management as top of mind at the executive level but if this commitment does not extend down through the organization performance may very well linger at the Laggard or Industry Average levels indefinitely.
Knowledge Management Knowledge management is another key differentiator for Best-in-Class manufacturers and the Best-in-Class differentiate themselves in two distinct ways. First, Best-in-Class manufacturers are 34% more likely than other manufacturers to automatically collect quality data. However, it is still a minority of the Best-in-Class that actually use automated data collection, which means manufacturers looking for a way to leapfrog in performance and gain a quick competitive advantage should look towards adopting
Aberdeen Insight – Strategies for Knowledge Management Although there are many ways that manufacturers can leverage the different approaches to knowledge management, the most effective way for manufacturers to start realizing benefits is by combining the multiple capabilities. Specifically, those manufacturers that both automate data collection and use quality data from across the entire value chain as actionable intelligence are nearly 50% more likely than other manufacturers to be performing at the Best-in-Class level. This means that any manufacturer having already adopted a portion of this strategy can jump start performance by continuing along the journey and combing automated data collection with the use of such data as actionable intelligence. It should also be noted that creating “actionable intelligence” out of raw data requires linking quality data with either: automated workflows, alerts, and/or NC/ CAPA programs.

The Cost of Quality: Benchmarking Enterprise Quality Management Page 11
© 2007 Aberdeen Group, Inc. Telephone: 617 723 7890 www.aberdeen.com
automated data collection. The other major way that the Best-in-Class differentiate is by using supplier, factory floor, and customer data all as actionable intelligence in quality management initiatives.
Tied to knowledge management and the use of data collected by automated means are the different technologies that manufacturers are using in support of enterprise quality management. Through Aberdeen’s analysis of technology usage trends, it is clear that technology can impact the success of a manufacturer’s performance in many ways.
Technology Some technologies like plant floor automation and MES have relatively low adoption rates (under 30%), yet those manufacturers using them are much more likely to either be Industry Average or Best-in-Class than Laggard manufacturers. There are other technologies, like ERP and QMS, that have relatively high adoption rates (over 50%) and like the aforementioned types of technology are much more likely to enable Industry Average or Best-in-Class performance than Laggard performance. Finally, there is SCM, which again has a relatively high rate of adoption (over 50%) but in this case only the Best-in-Class are significantly more likely to be using this technology.
With so many different, yet successful, technology approaches, it becomes clear that what drives success really goes beyond which categories of technology are used. The following analysis will support this supposition and show that technology functionality and interoperability are actually more closely tied to Best-in-Class performance than the category of technology used.
Figure 3: Automated Quality Tools Enabling Best-in-Class Status
50%44% 41%
35%31% 30%
24% 24%26%
16%
39%30%
25% 26%
14% 16%
0%
20%
40%
60%
Genea
logy /
Trac
eabil
ity SPCQua
lity W
orkfl
ows
& Aler
ts
RMASup
plier
Score
card
sNC / C
APAQua
lity
Dashb
oard
Audit
Docum
entat
ion
Best in Class Industry Average
19%14%
NPI
% of responding participants having automated
Source: AberdeenGroup, July 2007
Voice of the Manufacturer “The operators were stressing out trying to do the right thing….to make sure they don’t make any errors. But manual processes for quality and execution tracking was not helping. We needed an integrated solution to execution control and quality. We addressed quality, traceability, and machine control in an integrated manner, and saw real tangible results in all key metrics in about 3 months. Most surprising was the comments from operators about “reduced stress levels” from using the system.” Herman Taylor, Focused Factory Manager South Carolina, US

The Cost of Quality: Benchmarking Enterprise Quality Management Page 12
© 2007 Aberdeen Group, Inc. Telephone: 617 723 7890 www.aberdeen.com
Performance Measurement Based on the above automation rates, it is clear that Best-in-Class manufacturers are considerably more likely than Industry Average manufacturers to automate many different quality modules. With the highest levels of differentiation between Best-in-Class and Industry Average manufacturers being found in the automation of Genealogy and Traceability, SPC, Quality Dashboards, and Audit Documentation, in fact, Best-in-Class manufactures are over 50% more likely to automate each.
In contrast to those quality modules that the Best-in-Class are more likely than the Industry Average to automate, it is also of interest to examine those quality modules and functionalities that Best-in-Class manufacturers are less likely to automate.
Resources are constrained in any organization, and the tradeoff decisions that have proved to be the most beneficial for the Best-in-Class should be emulated by those manufacturers still aspiring. This advice is well to be followed when choosing which quality modules to automate.
Based on the above Best-in-Class adoption rates, it has proven to be a best practice for manufacturers to automate those quality modules that accomplish one of two major objectives: production process control or quality process interoperability. The first objective, improving production process control, can best be accomplished with tools like SPC, quality work flows, and NC/CAPA. The second objective, increasing the interoperability of quality process, can be achieved with tools like product genealogy and traceability, RMA, supplier scorecards, quality dashboards, and NPI.
Figure 4: Automated Quality Tools Supporting Best Practices
34%
16% 15% 16%
35%27%
20% 19%
0%
20%
40%
SOP
Docum
entat
ion
Trainin
g /
Certific
ation
Risk
Manag
emen
tFMEA
Best in Class Industry Average
% of responding participants having automated
34%
16% 15% 16%
35%27%
20% 19%
0%
20%
40%
SOP
Docum
entat
ion
Trainin
g /
Certific
ation
Risk
Manag
emen
tFMEA
Best in Class Industry Average
% of responding participants having automated
Source: AberdeenGroup, July 2007
Voice of the Manufacturer At AcBel Polytech Inc. we have used Genealogy to make our traceability system stronger, which allows our quality containment plans to be completed more accurately and in shorter time. SPC has made the review of processes and product capabilities quicker, and finally, Quality Dashboards have been a means to quick feedback for the operational teams to recover from hiccups in the production process. Vicsom Lim Quality Professional AcBel Polytech Inc.

The Cost of Quality: Benchmarking Enterprise Quality Management Page 13
© 2007 Aberdeen Group, Inc. Telephone: 617 723 7890 www.aberdeen.com
However, Aberdeen has found that many manufacturers do not necessarily begin the automation process with a quality module that addresses one of the above objectives. In fact, many successful Best-in-Class initiatives have begun with automating tools like SOP Documentation and/or Employee Training. When such an approach is taken, the key to achieving Best-in-Class performance is in extending the automation beyond those quality modules in Figure 4 and automating those modules contained in the best practices identified above.
Aberdeen Insights – Technology and Interoperability
In order for any manufacturer to successfully implement an enterprise quality management architecture and eliminate disconnected quality processes, there must be some level of interoperability between quality systems and technologies. Again, when the Best-in-Class are examined, we find that there are very specific touch points of interoperability that Best-in-Class manufacturers are considerably more likely than Industry Average manufacturers to leverage.
Figure 5: Interoperability Enables Best-in-Class Performance
80%67%
50%
25%36%
25%
0%
50%
100%
PFA and QMS MES and QMS MES and SCM
Best in Class Industry Average
% of responding participants with real-time interoperability
80%67%
50%
25%36%
25%
0%
50%
100%
PFA and QMS MES and QMS MES and SCM
Best in Class Industry Average
% of responding participants with real-time interoperability Source: AberdeenGroup, July 2007
Case in Point A leading manufacturer of utility meters faced with quality issues, mounting scrap/rework, and increased warranty costs started on a journey to adopt technology solutions. With over 20,000 board builds per day, and 1500 reels consumed per day, the challenges related to quality, mis-picks, scrap/rework, and equipment setup/change was amounting to real costs in a competitive market. Within 3 months of implementing an integrated QMS and MES solution, for quality and traceability across the R&D and production line, this manufacturer was able to (i) increase OEE by 10%, (ii) reduce scrap/rework by 11%, (iii) increase First Pass Yield from 95% to over 99%, and increase functional test from 98% to 99.5%. The big surprise to executive management was the adoption of new technology and related processes by the operators stating ‘reduced stress levels’. The company realized a 6% improvement in first pass yield directly attributable to operator error as a direct result of use of the solution. The company plans to continue on this path of technology adoption integrating quality and execution to improve operational efficiency by next focusing on integration with ERP.

The Cost of Quality: Benchmarking Enterprise Quality Management Page 14
© 2007 Aberdeen Group, Inc. Telephone: 617 723 7890 www.aberdeen.com
Chapter Three: Required Actions
Whether a company is trying to move its performance from “Laggard” to “Industry Average,” or “Industry Average” to “Best-in-Class,” the following actions will help spur the necessary performance improvements:
Laggard Steps to Success • Focus on both improving finished product quality and
reducing the cost of quality when implementing enterprise quality management strategies
Enterprise quality management is a concept that may not yet be broadly understood across all markets, but the need to improve product quality and reduce the cost of quality is. If both of these are focused on when making decisions regarding quality process workflows and automating quality tools, positive operational results are soon to follow.
• Measure the cost of quality
50% of Laggard manufacturers already measure the cost of quality, but this is still woefully low. In order to positively effect change and reduce the cost of quality, results must be measured and benchmarked internally.
• Establish executive ownership of enterprise quality management initiatives
Executive ownership does not ensure Best-in-Class status on its own accord, but it is a necessary step. By establishing executive ownership, other institutional changes have a much better chance of taking hold, such as standardizing workflows and alerts across the enterprise and creating real-time interoperability between enterprise technologies.
Industry Norm Steps to Success • Standardize, across the enterprise, quality workflows
and escalation procedures that are based upon established best practices
No two organizations manage quality assurance and control in the same way. What is common among Best-in-Class manufacturers is that quality workflows and escalation procedures are based upon established best practices and extended across the enterprise. If your organization does not have a mature continuous improvement initiative to establish and validate best practices than leverage those best practices that have built into many of the QMS offerings available today.
Voice of the Manufacturer Our focus is on both finished product quality and reducing the cost of quality. Product quality is of paramount importance in maintaining market share and customer alliances that have been built over many years. Our consumer base is a tight-knit group within the oil & gas market and power generation, where quality is the main reason for return business. Performance of our products, and installations, allow our customers to generate revenue, when our products malfunction we are costing the customer dollars.
Also, the COPQ (Cost of Poor Quality) is a defined area where we can provide impact to our bottom line. The materials that make up our products are very expensive and have very long lead times for procurement. The utilization of each asset that we work on is an impact to our ability in meeting our customer’s needs, the velocity of our manufacturing process, and to the cost of our business.
Gary L. Baker Quality Engineer & Lean 6 Sigma Black Belt Solar Turbines Inc.

The Cost of Quality: Benchmarking Enterprise Quality Management Page 15
© 2007 Aberdeen Group, Inc. Telephone: 617 723 7890 www.aberdeen.com
• Use supplier, factory floor, and customer data as actionable intelligence
Based on the global nature of today’s supply chains, to truly improve product quality and reduce the cost of quality there must be visibility into quality processes across the value chain. This is especially important for supply chains operating under Lean principles. When safety stocks have been eliminated from the supply chain, the cost of poor quality can increase exponentially as stock outs on the line can result. Consequently, the ROI for avoiding such situations increases in a similar fashion.
• Automate Genealogy and Traceability, SPC, Quality Dashboards, and Audit Documentation
There is a very specific suite of quality modules and functionalities that Best-in-Class manufacturers have differentiated themselves by automating. Industry average manufacturers should follow this lead and begin by automating those tools that help to control the production process or increase the interoperability of quality processes.
Case Study – Fairchild Semiconductor International, Inc. Fairchild Semiconductor International, Inc. is a leading semiconductor manufacturer, with 2006 revenues of 1.65 billion and global operations across 4 fabrication and 3 assembly facilities. As Fairchild has grown, so has the complexity of their operations, which now includes 1000s of customers, 1000s of products, and 100s of defined quality processes. Three years ago, Fairchild determined that they had out grown the home grown solutions they were relying on and implemented an enterprise-wide quality management and compliance system. To date, Fairchild has automated and standardized the following across the enterprise:
• CAPA (corrective and preventive actions) • Non – Conformance Reporting • Process Change Notification to Customers • Internal Process Change Document Routing and Approval
As part of its Quality System, Fairchild measures the cost of total quality, the cost of poor quality, and product quality issue response cycle time. Over the past year and a half, Fairchild has seen a significant decrease in the cost of quality and a 40% decrease in product quality issue response cycle time. In both cases, Mark Rioux, Vice President of Quality at Fairchild, credited the enterprise quality management solution they chose as enabling his quality organization to make the informed and timely decisions necessary to support this improvement. Many of the above decisions map to the “Required Actions” outlined in this chapter and should be emulated by manufacturers still on the journey to Best-in-Class performance.
Fast Facts To achieve Best-in-Class status, manufacturers must: • Automate quality processes that enable Best-in-Class performance, including: Genealogy and Traceability, SPC, Quality Dashboards, and Audit Documentation. • Implement an Enterprise-Wide Quality Management System and focus on creating real time interoperability with plant floor automation, MES, and SCM
• Measure the cost of quality. Doing so is a necessary first step to creating a Best-in-Class quality management system.

The Cost of Quality: Benchmarking Enterprise Quality Management Page 16
© 2007 Aberdeen Group, Inc. Telephone: 617 723 7890 www.aberdeen.com
Best-in-Class Steps to Success • Combine automated data collection with using value
chain quality data as actionable intelligence
Best-in-Class manufacturers are already more likely than other manufacturers to either automate data collection or utilize value chain quality data as actionable intelligence. However, it is still a minority of Best-in-Class manufacturers that have managed to do both. Furthermore, those manufacturers that have done both are actually 45% more likely to be performing at the Best-in-Class level. Combining both will prove to be crucial for Best-in-Class manufacturers to maintain the competitive advantages already established.
• Establish real-time interoperability between plant floor automation, MES, QMS, and SCM
Automating workflows and escalations based upon established best practices relies heavily on interoperability between disparate technologies because each of the disparate technologies capture quality data important to the overall enterprise. Those Best-in-Class manufacturers, that have not already done so, can gain the greatest benefit by linking the above technologies to enable automated workflows. These workflows must be able to begin in engineering and extend through to the customer and/or begin at the machine operator and extend all the way to the executive suite; either way, technology interoperability is crucial to achieving the needed architecture.

The Cost of Quality: Benchmarking Enterprise Quality Management Page 17
© 2007 Aberdeen Group, Inc. Telephone: 617 723 7890 www.aberdeen.com
Appendix A: Research Methodology
In June of 2007, Aberdeen Group examined the quality management initiatives of 333 manufacturers.
Responding manufacturing executives completed an online survey that included questions designed to determine the following:
• The degree to which enterprise quality management initiatives are deployed across the operation and the performance implications of the technology.
• The structure and effectiveness of existing enterprise quality management implementations
• Current and planned use of Quality Management Systems to aid operational and promotional activities
• The benefits, if any, that have been derived from enterprise quality management initiatives
Aberdeen supplemented this online survey effort with telephone interviews with select survey respondents, gathering additional information on enterprise quality management strategies, experiences, and results.
The study aimed to identify emerging best practices for Lean scheduling and execution and provide a framework by which readers could assess their own management capabilities.
Responding enterprises included the following:
• Job title/function: The research sample included respondents with the following job titles: CxO or President (12%); Vice-President (5%); Director (15%); Manager (38%), Staff (14%), Consultant (9%), and Other (7%).
• Industry: The research sample included respondents exclusively from manufacturing industries. Automotive was the largest segment with (21%) of the sample. Life Sciences accounted for (17%) of the respondents, Industrial Equipment Manufacturing (16%), High-Tech (14%), Food and Beverage / Consumer Packaged Goods (13%), and Aerospace and Defense accounted for (11%).
• Geography: The majority of respondents (71%) were from North America. Remaining respondents were from the Asia-Pacific region (10%), and Europe, Middle East, and Africa (19%).
• Company size: 25% of respondents were from large enterprises (annual revenues above US$1 billion); 37% were from midsize enterprises (annual revenues between $50 million and $1 billion); and 38% of respondents were from small businesses (annual revenues less than $50 million).
The Cost of Quality: Benchmarking Enterprise Quality Management Page 18
© 2007 Aberdeen Group, Inc. Telephone: 617 723 7890 www.aberdeen.com
Solution providers recognized as sponsors of this report were solicited after the fact and had no substantive influence on the direction of the Lean Scheduling and Execution Benchmark Report. Their sponsorship has made it possible for Aberdeen Group to make these findings available to readers at no charge.
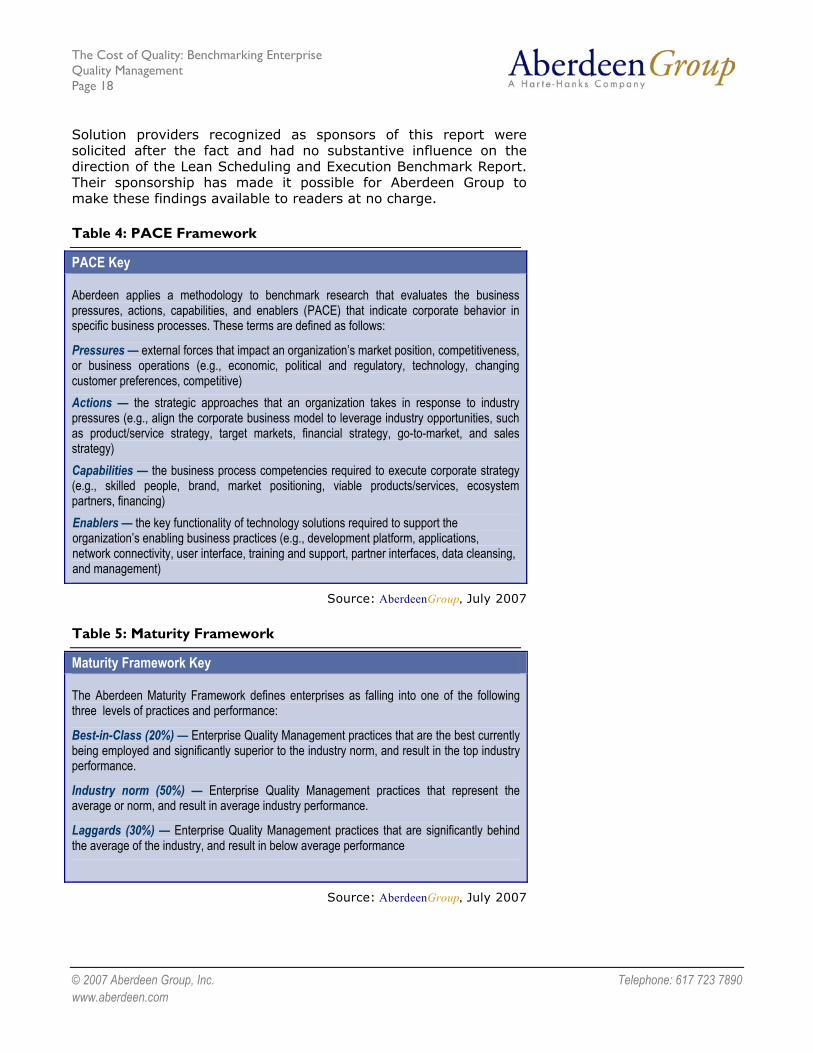
Table 4: PACE Framework
PACE Key
Aberdeen applies a methodology to benchmark research that evaluates the business pressures, actions, capabilities, and enablers (PACE) that indicate corporate behavior in specific business processes. These terms are defined as follows:
Pressures — external forces that impact an organization’s market position, competitiveness, or business operations (e.g., economic, political and regulatory, technology, changing customer preferences, competitive) Actions — the strategic approaches that an organization takes in response to industry pressures (e.g., align the corporate business model to leverage industry opportunities, such as product/service strategy, target markets, financial strategy, go-to-market, and sales strategy) Capabilities — the business process competencies required to execute corporate strategy (e.g., skilled people, brand, market positioning, viable products/services, ecosystem partners, financing) Enablers — the key functionality of technology solutions required to support the organization’s enabling business practices (e.g., development platform, applications, network connectivity, user interface, training and support, partner interfaces, data cleansing, and management)
Source: AberdeenGroup, July 2007
Table 5: Maturity Framework
Maturity Framework Key
The Aberdeen Maturity Framework defines enterprises as falling into one of the following three levels of practices and performance:
Best-in-Class (20%) — Enterprise Quality Management practices that are the best currently being employed and significantly superior to the industry norm, and result in the top industry performance.
Industry norm (50%) — Enterprise Quality Management practices that represent the average or norm, and result in average industry performance.
Laggards (30%) — Enterprise Quality Management practices that are significantly behind the average of the industry, and result in below average performance
Source: AberdeenGroup, July 2007

The Cost of Quality: Benchmarking Enterprise Quality Management Page 19
© 2007 Aberdeen Group, Inc. Telephone: 617 723 7890 www.aberdeen.com
Table 6: Competitive Framework
Competitive Framework Key Process — What is the scope of process standardization? What is the efficiency and effectiveness of this process? Organization — How is your company currently organized to manage and optimize this particular process? Knowledge — What visibility do you have into key data and intelligence required to manage this process? Technology — What level of automation have you used to support this process? How is this automation integrated and aligned? Performance — What do you measure? How frequently? What’s your actual performance?
Source: AberdeenGroup, July 2007
Table 7: Relationship between PACE and Competitive Framework
PACE and Competitive Framework How They Interact Aberdeen research indicates that companies that identify the most impactful pressures and take the most transformational and effective actions are most likely to achieve superior performance. The level of competitive performance that a company achieves is strongly determined by the PACE choices that they make and how well they execute.
Source: AberdeenGroup, July 2007

The Cost of Quality: Benchmarking Enterprise Quality Management Page 20
© 2007 Aberdeen Group, Inc. Telephone: 617 723 7890 www.aberdeen.com
Appendix B: Related Aberdeen Research
Related Aberdeen research that forms a companion or reference to this report includes:
• Compliance and Traceability in Regulated Industries
• The Product Quality Benchmark Report: Achieving Quality Across the Global Manufacturing Network
• MES Solutions and Managing Compliance
• There is No Execution without Integration
• The Lean Six Sigma Benchmark Report
• Lean Scheduling and Execution
Information on these and any other Aberdeen publications can be found at www.aberdeen.com.
Author: Matthew Littlefield, Research Analyst, Global Manufacturing Markets [email protected]
Founded in 1988, Aberdeen Group is the technology- driven research destination of choice for the global business executive. Aberdeen Group has over 100,000 research members in over 36 countries around the world that both participate in and direct the most comprehensive technology-driven value chain research in the market. Through its continued fact-based research, benchmarking, and actionable analysis, Aberdeen Group offers global business and technology executives a unique mix of actionable research, KPIs, tools, and services. This document is the result of research performed by Aberdeen Group. Aberdeen Group believes its findings are objective and represent the best analysis available at the time of publication. Unless otherwise noted, the entire contents of this publication are copyrighted by Aberdeen Group, Inc. and may not be reproduced, stored in a retrieval system, or transmitted in any form or by any means without prior written consent by Aberdeen Group, Inc.