A window on health equity for Māori
19
He matapihi ki te kounga o ngā manaakitanga ā-hauora o Aotearoa • Annual publication: the quality ‘state of the nation’ • Chapter 1: What is happening? • Chapter 2: Why is this happening? • Chapter 3: How can this change? A window on health equity for Māori
Transcript of A window on health equity for Māori
He matapihi ki te kounga o ngāmanaakitanga ā-hauora o Aotearoa
• Annual publication: the quality ‘state of the nation’
• Chapter 1: What is happening?• Chapter 2: Why is this happening?• Chapter 3: How can this change?
A window on health equity for Māori
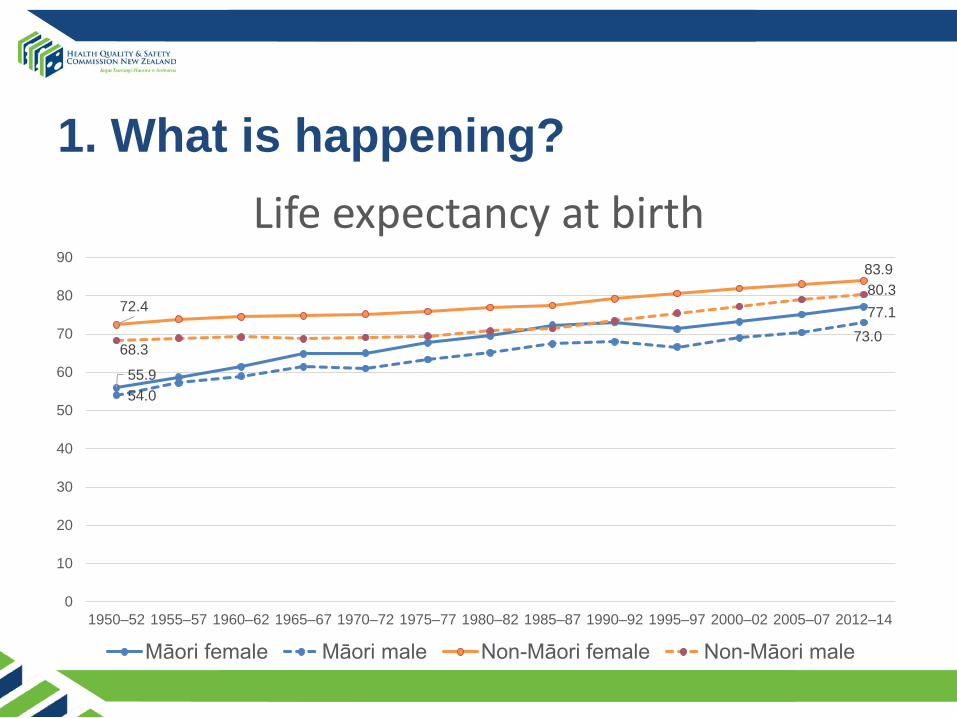
1. What is happening?
55.9
77.1
54.0
73.0
72.4
83.9
68.3
80.3
0
10
20
30
40
50
60
70
80
90
1950–52 1955–57 1960–62 1965–67 1970–72 1975–77 1980–82 1985–87 1990–92 1995–97 2000–02 2005–07 2012–14
Life expectancy at birth
Māori female Māori male Non-Māori female Non-Māori male
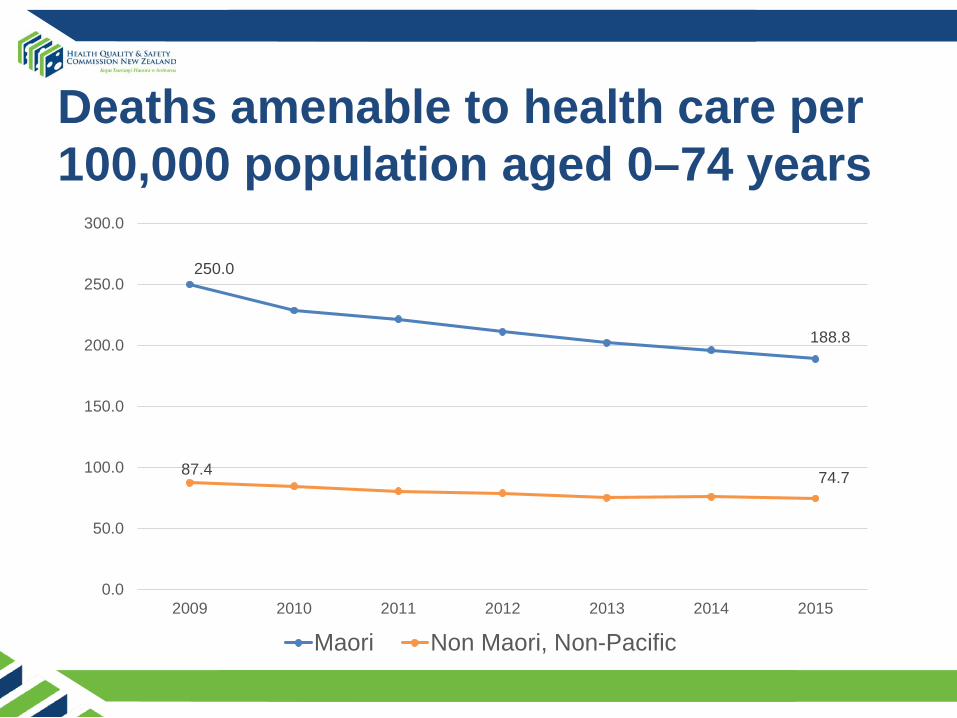
250.0
188.8
87.4 74.7
0.0
50.0
100.0
150.0
200.0
250.0
300.0
2009 2010 2011 2012 2013 2014 2015
Maori Non Maori, Non-Pacific
Deaths amenable to health care per 100,000 population aged 0–74 years

Understanding this inequity• ‘Life course’ approach over three domains: access,
quality, and improvement
• Indicators (including those from Atlas of Healthcare Variation) chosen for feasibility, robust, recent, a range of conditions or disease areas, rather than whether they showed inequity or not
• Pre-natal, childhood (0 – 14), youth (15 – 24), adult (24 –64) and older age (65 and over)

Worse access starts before birth
0%
10%
20%
30%
40%
50%
60%
70%
80%
2009 2010 2011 2012 2013 2014 2015 2016
Registration with a lead maternity clearer in the first trimester of pregnancy
Māori Non-Māori
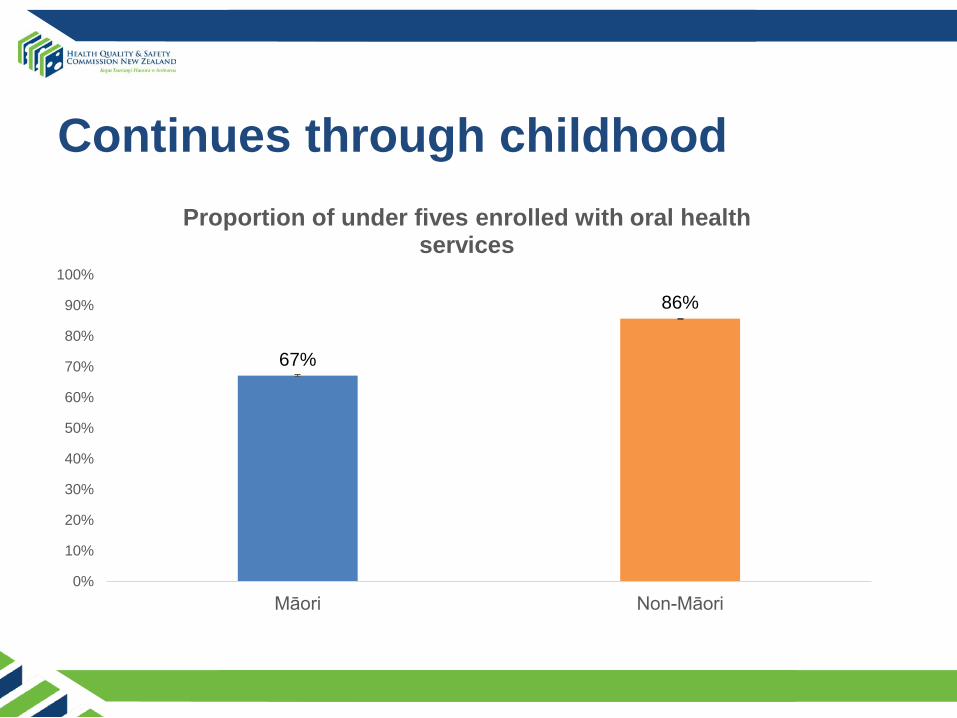
Continues through childhood
67%
86%
0%
10%
20%
30%
40%
50%
60%
70%
80%
90%
100%
Māori Non-Māori
Proportion of under fives enrolled with oral health services
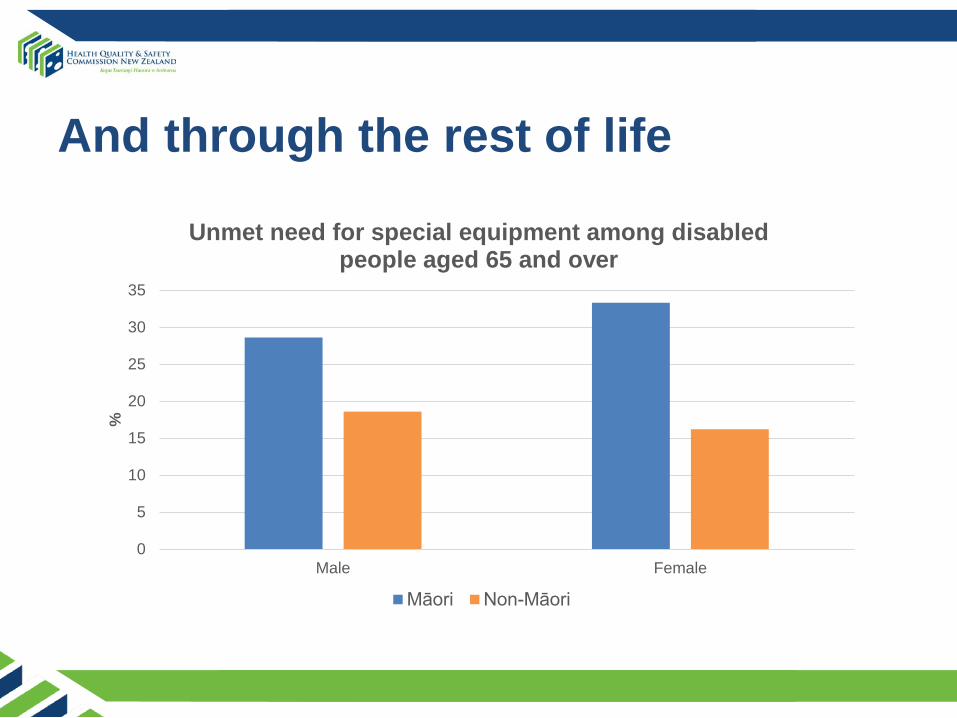
And through the rest of life
0
5
10
15
20
25
30
35
Male Female
%
Unmet need for special equipment among disabled people aged 65 and over
Māori Non-Māori
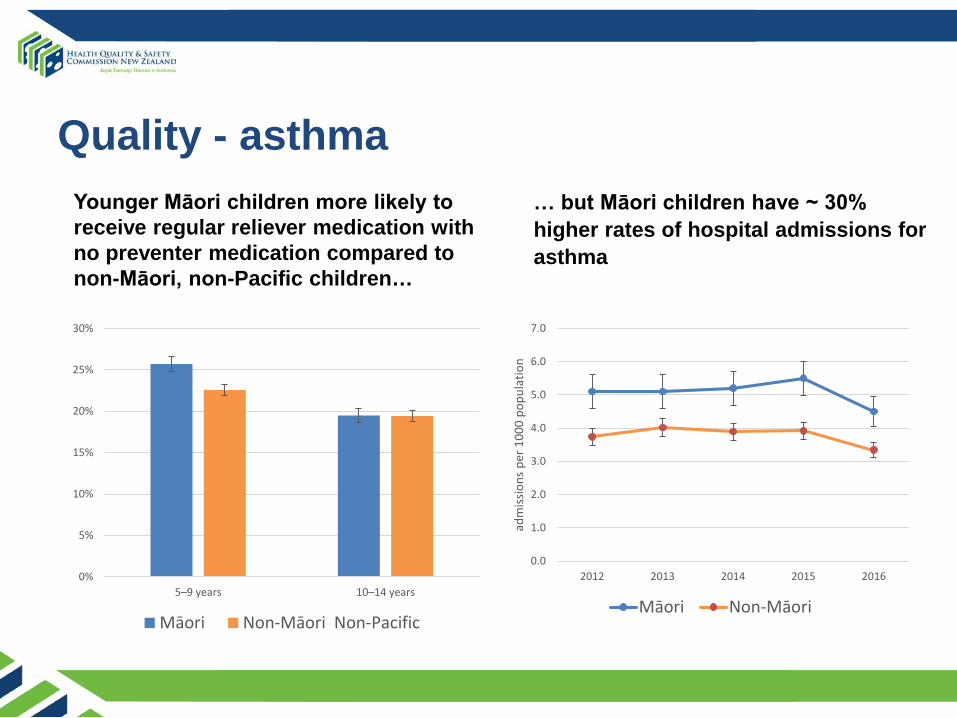
Quality - asthmaYounger Māori children more likely to receive regular reliever medication with no preventer medication compared to non-Māori, non-Pacific children…
0%
5%
10%
15%
20%
25%
30%
5–9 years 10–14 years
Māori Non-Māori Non-Pacific
0.0
1.0
2.0
3.0
4.0
5.0
6.0
7.0
2012 2013 2014 2015 2016
adm
issio
ns p
er 1
000
popu
latio
n
Māori Non-Māori
… but Māori children have ~ 30% higher rates of hospital admissions for asthma
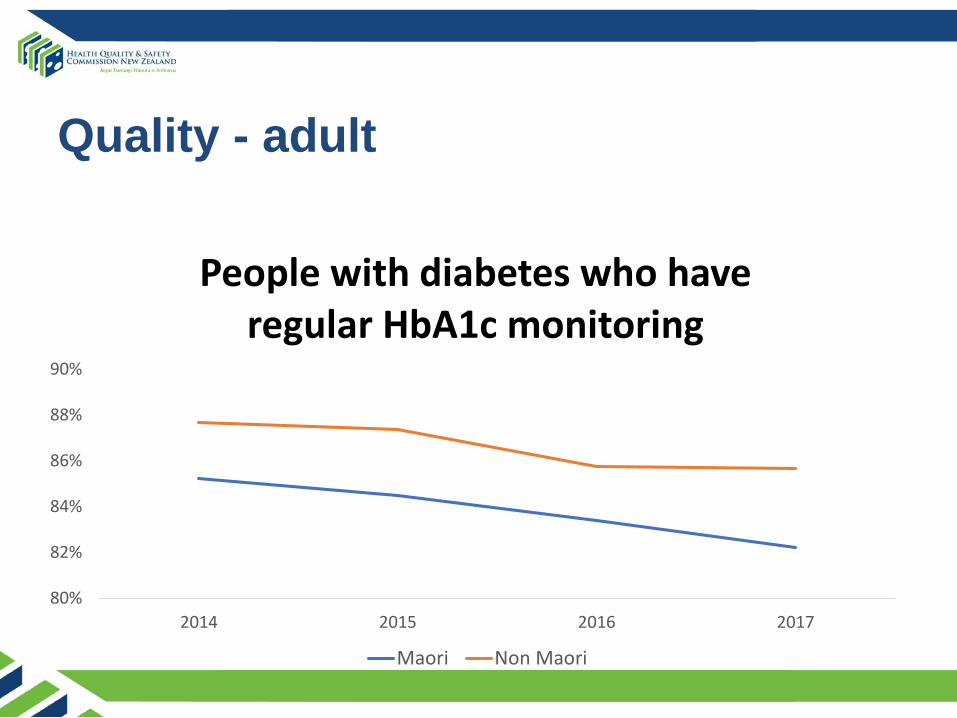
Quality - adult
80%
82%
84%
86%
88%
90%
2014 2015 2016 2017
People with diabetes who have regular HbA1c monitoring
Maori Non Maori
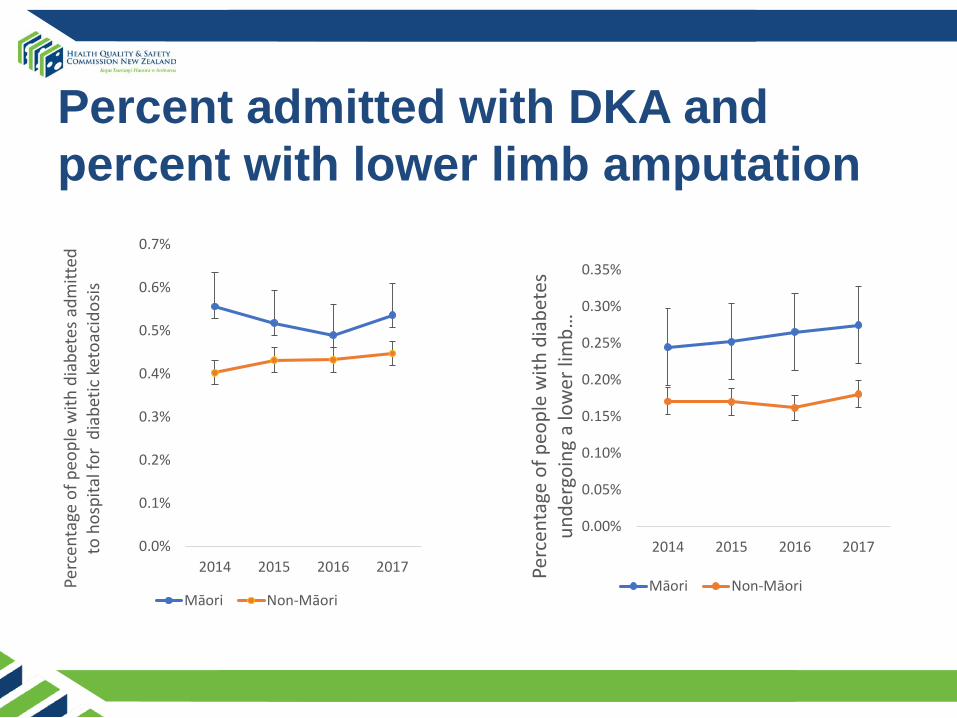
Percent admitted with DKA and percent with lower limb amputation
0.0%
0.1%
0.2%
0.3%
0.4%
0.5%
0.6%
0.7%
2014 2015 2016 2017
Perc
enta
ge o
f peo
ple
with
dia
bete
s adm
itted
to
hos
pita
l for
dia
betic
ket
oaci
dosis
Māori Non-Māori
0.00%
0.05%
0.10%
0.15%
0.20%
0.25%
0.30%
0.35%
2014 2015 2016 2017Pe
rcen
tage
of p
eopl
e w
ith d
iabe
tes
unde
rgoi
ng a
low
er li
mb …
Māori Non-Māori
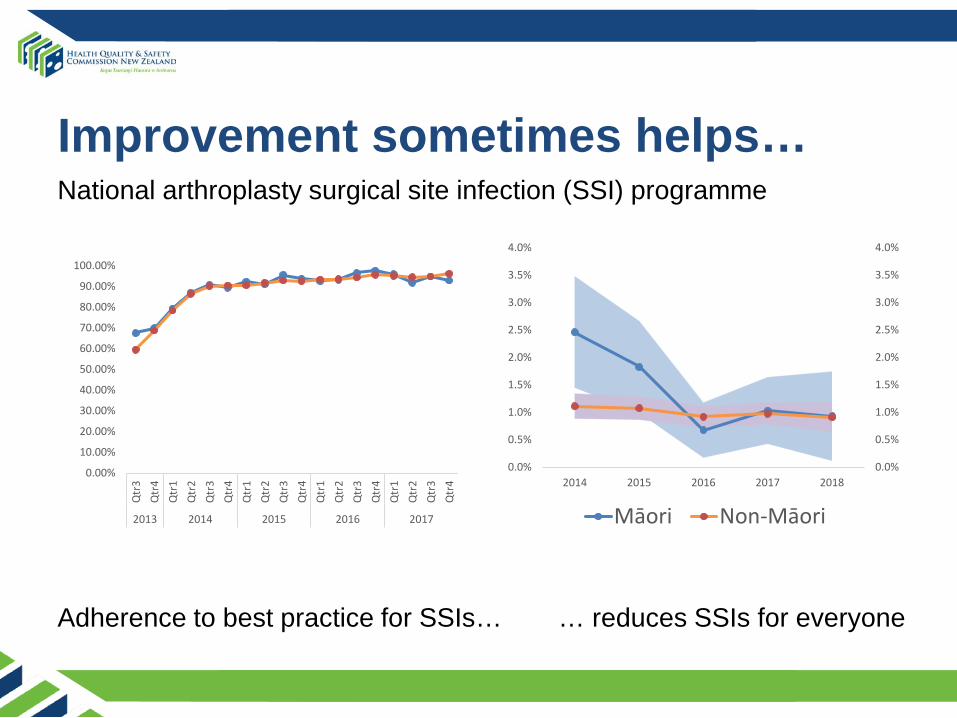
Improvement sometimes helps…
0.00%
10.00%
20.00%
30.00%
40.00%
50.00%
60.00%
70.00%
80.00%
90.00%
100.00%
Qtr
3Q
tr4
Qtr
1Q
tr2
Qtr
3Q
tr4
Qtr
1Q
tr2
Qtr
3Q
tr4
Qtr
1Q
tr2
Qtr
3Q
tr4
Qtr
1Q
tr2
Qtr
3Q
tr4
2013 2014 2015 2016 2017
0.0%
0.5%
1.0%
1.5%
2.0%
2.5%
3.0%
3.5%
4.0%
0.0%
0.5%
1.0%
1.5%
2.0%
2.5%
3.0%
3.5%
4.0%
2014 2015 2016 2017 2018
Māori Non-Māori
Adherence to best practice for SSIs… … reduces SSIs for everyone
National arthroplasty surgical site infection (SSI) programme

… but not always
80.0%
82.0%
84.0%
86.0%
88.0%
90.0%
92.0%
94.0%
96.0%
2012 2013 2014 2015 2016 2017 2018
Eight-month-olds who have complete age appropriate immunisations (percent)
Māori Non Māori
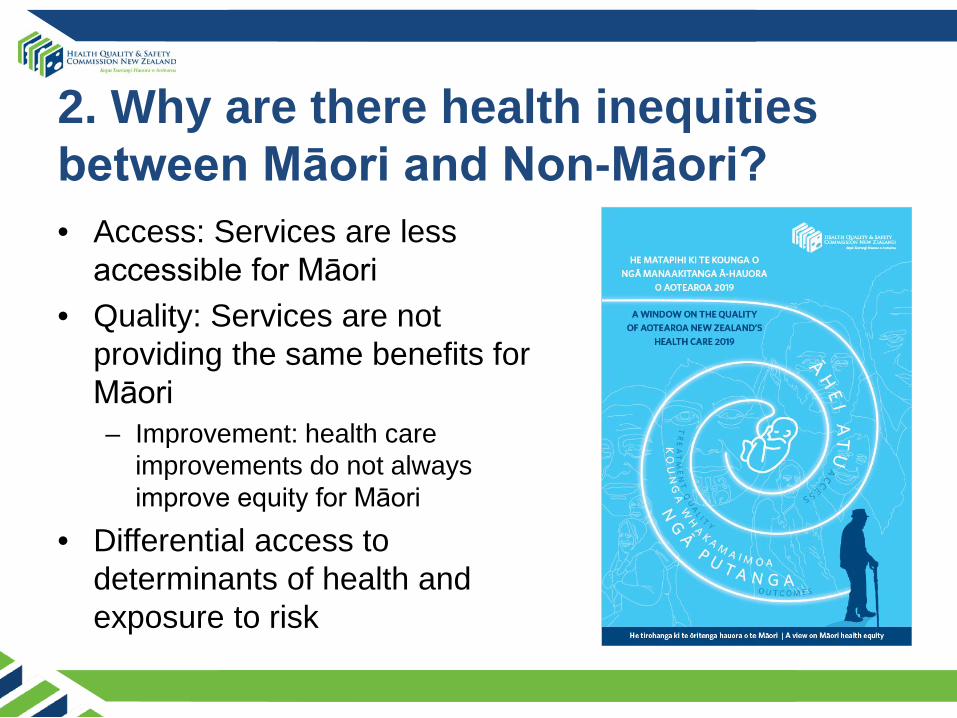
2. Why are there health inequities between Māori and Non-Māori?• Access: Services are less
accessible for Māori• Quality: Services are not
providing the same benefits for Māori– Improvement: health care
improvements do not always improve equity for Māori
• Differential access to determinants of health and exposure to risk
2. Why are there health inequities between Māori and non-Māori?Williams and Mohammed model of health inequity shows how socioeconomic determinants together with race and racism affect health: Basic causes Social status Differential access to resources and opportunities, Differential exposure to discrimination and overt racism, Different responses Different health outcomes
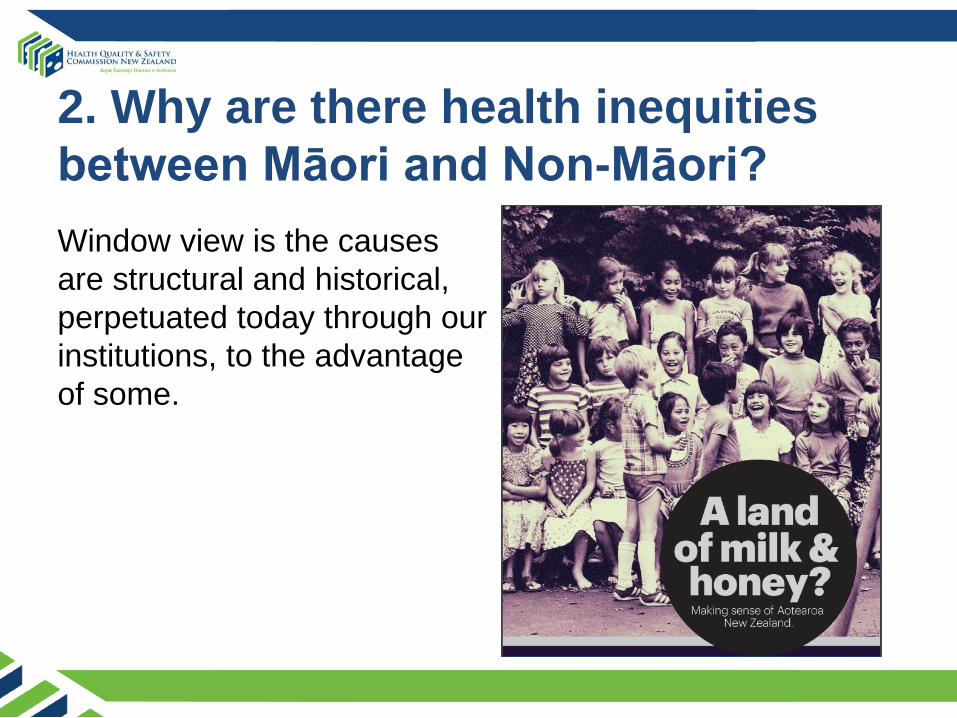
2. Why are there health inequities between Māori and Non-Māori?Window view is the causes are structural and historical, perpetuated today through our institutions, to the advantage of some.
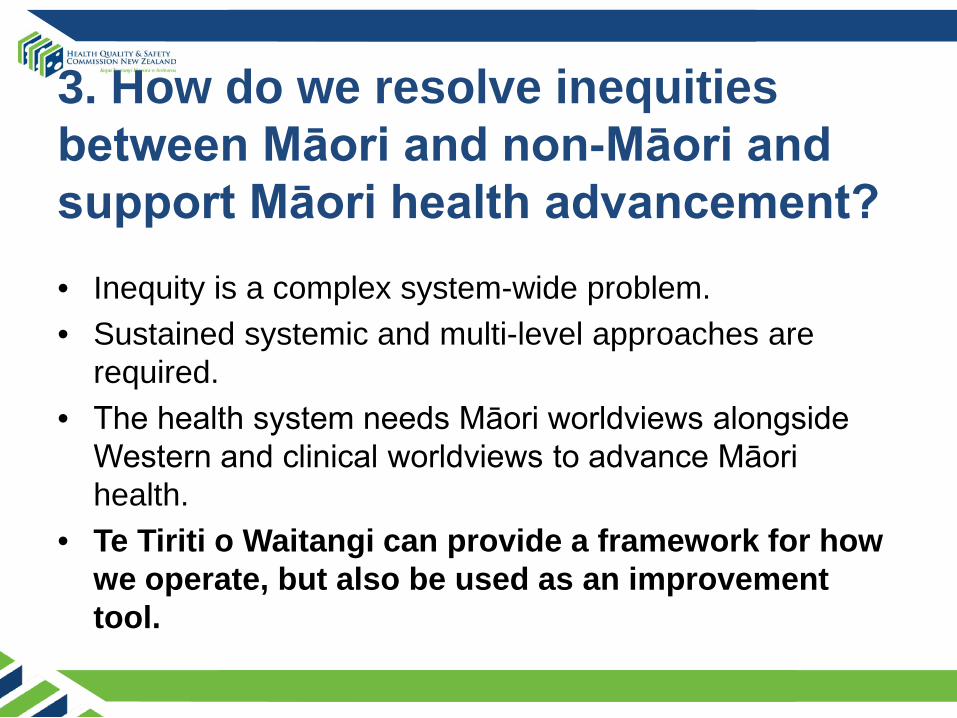
3. How do we resolve inequities between Māori and non-Māori and support Māori health advancement?• Inequity is a complex system-wide problem. • Sustained systemic and multi-level approaches are
required.• The health system needs Māori worldviews alongside
Western and clinical worldviews to advance Māori health.
• Te Tiriti o Waitangi can provide a framework for how we operate, but also be used as an improvement tool.
Tools for equity and Māori health advancement• Māori health providers• High-quality ethnicity data, eg Te Kupenga• Cultural safety education • Māori workforce development• Equity of Healthcare for Māori framework • Health Equity Assessment Tool (HEAT)
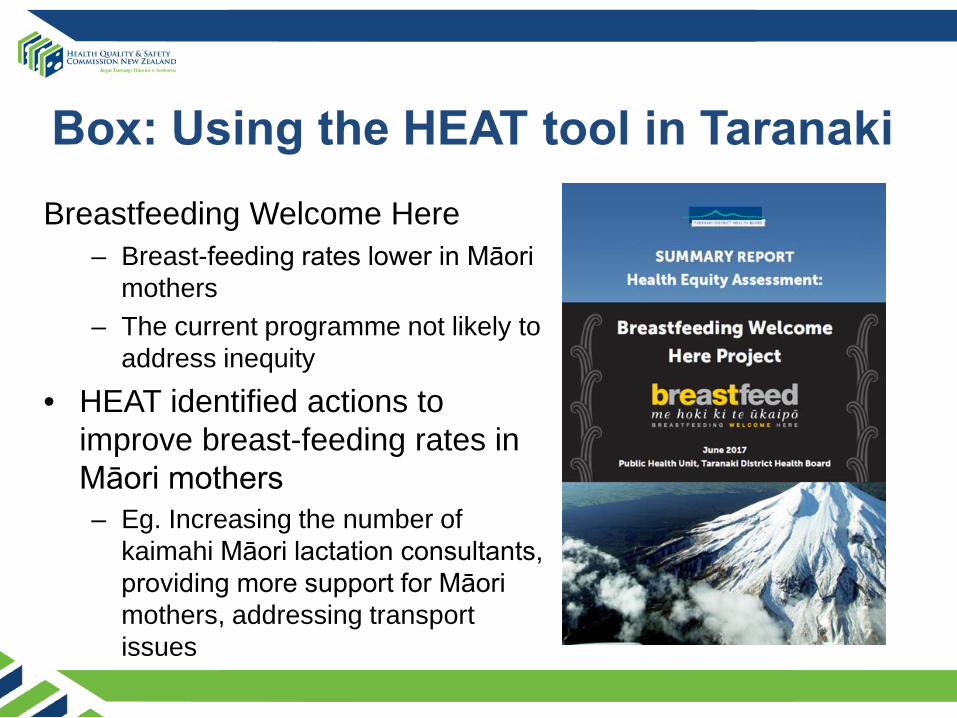
Breastfeeding Welcome Here– Breast-feeding rates lower in Māori
mothers– The current programme not likely to
address inequity• HEAT identified actions to
improve breast-feeding rates in Māori mothers – Eg. Increasing the number of
kaimahi Māori lactation consultants, providing more support for Māori mothers, addressing transport issues
Professor Sir Mason Durie: foreword
It is not a matter of favouritism, political correctness or deference to Maori; rather it is a matter of health and wellbeing and the eradication of inequities. Moreover, Maori understandings of health and wellbeing need to
be given due attention.
The report is clear. Action is needed on multiple fronts.