A Weekly Update from SMC 2013: Issue 385, Week:...
20
WISE M NEY HAPPY JANMASHTAMI 28th August, 2013 ® 2013: Issue 385, Week: 26th - 29th August A Weekly Update from SMC (For private circulation only) Brand smc 207
Transcript of A Weekly Update from SMC 2013: Issue 385, Week:...

WISE M NEY
HAPPY JANMASHTAMI28th August, 2013
®
2013: Issue 385, Week: 26th - 29th AugustA Weekly Update from SMC(For private circulation only)
Bra
nd
sm
c 2
07


(Saurabh Jain)
Contents
Equity 4-7
Derivatives 8-9
Commodity 10-13
Currency 14
IPO 15
Fixed Deposit 16
Mutual Fund 17-18
EDITORIAL STAFF
Editor Saurabh Jain
Executive Editor Jagannadham Thunuguntla
+Editorial Team
Dr. R.P. Singh Nitin Murarka
Vandana Bharti Tejas Seth
Sandeep Joon Dinesh Joshi
Vineet Sood Shitij Gandhi
Dhirender Singh Bisht Subhranil Dey
Parminder Chauhan Ajay Lakra
Mudit Goyal
Content Editor Kamla Devi
Graphic Designer Pramod Chhimwal
REGISTERED OFFICES:
11 / 6B, Shanti Chamber, Pusa Road, New Delhi 110005.
Tel: 91-11-30111000, Fax: 91-11-25754365
MUMBAI OFFICE:
Dheeraj Sagar, 1st Floor, Opp. Goregaon sports Club, Link Road
Malad (West), Mumbai 400064
Tel: 91-22-67341600, Fax: 91-22-28805606
KOLKATA OFFICE:
18,Rabindra Sarani, Poddar Court, Gate No-4, 4th & 5th Floor,
Kolkata-700001
Tel : 91-33-39847000/39801300, Fax No : 91-33-39847004
AHMEDABAD OFFICE :
10/A, 4th Floor, Kalapurnam Building, Near Municipal Market,
C G Road, Ahmedabad-380009, Gujarat
Tel : 91-79-26424801 - 05, 40049801 - 03
CHENNAI OFFICE:
2nd Floor, Mookambika Complex, 4, Lady Desikachari Road,
Mylapore, Chennai-600004
Tel: 91- 44 - 39109100 Fax: 91- 44 - 39109111
SECUNDERABAD OFFICE:
206, 3rd Floor, above CMR Exclusive, Bhuvana Towers, S.D.Road,
Secunderabad - 500003
Tel: 91-40-30780298/99, 39109536
DUBAI OFFICE:
312, Belshalat Building, Al Karama, Dubai, P.O. Box 117210, U.A.E.
Tel: 97143963120, Mobile : 971502612483
Fax : 9714 3963122
Email ID : [email protected]
Printed and Published on behalf of
Mr. Saurabh Jain @ Publication Address
11/6B, Shanti Chamber, Pusa Road, New Delhi-110005
Website: www.smcindiaonline.com
Investor Grievance : [email protected]
Printed at: S&S MARKETING
102, Mahavirji Complex LSC-3, Rishabh Vihar, New Delhi - 110092 (India)
Ph.: +91-11- 43035012, 43035014, Email: [email protected]
lobal stock markets in the week gone by came off a bit after the release of
U.S. Federal Open Market Committee (FOMC) minutes, which showed that Gthe majority of members agreed on plan to reduce bond purchases later this
year in case of continuous improvement in the economy. FOMC expects that the U.S.
economy expansion will accelerate in the year 2013 and 2014. Optimism on the
European economy is also on the rise with the data showing that the services and
manufacturing expanded more than the expectations in Germany.
China saw improvement in the manufacturing activity as PMI reading for the month of
August came at 50.1 from 47.7 in the month of July which led to firming of global
commodity prices. Metal stocks gained in the Indian stocks market on the
expectations that the metal producers would be able to raise the product prices
because of dual effect of higher global commodity prices and depreciation in rupee.
Back at home, Reserve Bank of India allowed banks to transfer securities from
Available For Sale (AFS)/ Held For Trading (HFT) to Held To Maturity (HTM) up to the
limit of 24.5 per cent of their Net Demand and Time Liabilities (NDTL) as a onetime
measure. Further banks have been allowed to do such transfer at book value or market
value whichever is lower as at the close of business of 15th July 2013. As a matter of
fact, RBI measures on 15th July and 23rd July to curb undue volatility in Rupee
resulted in hardening of long term yields which resulted in banks incurring large Mark-
To-Market (MTM) losses in their investment portfolio.
Finance Minister P. Chidambaram in a press meeting said that the Rupee has overshot
the appropriate levels and the growth will pick up as the year progresses. The fall of
Rupee from 55 levels to 65 levels is resulting in higher cost of imported goods, may put
more burden on the fiscal balances in terms of higher fuel and fertilizer subsidies,
higher cost of imported commodities and may result in firming up inflation as a result
of partial pass through of rupee depreciation in crude products like, Diesel, LPG,
Kerosine, etc.
On the commodity front, Fed minutes increased expectations that stimulus will be
scaled back gradually. It may slowdown the rally in gold but rest of the commodities
still looks promising. With a strengthening U.S. economy and Europe's moderate
recovery coupled with improved manufacturing data from China is also supporting
commodities to trade higher. There is no hope of any significant recovery in Indian
rupee and thus we can expect that commodities may trade with higher volatility in the
Indian market. Some agri commodities viz; sugar, edible oil, spices etc may augment
on festive demand in short to mid run. Durable goods, consumer confidence, GDP,
Personal consumption expenditures of US, CPI of Japan and euro zone, GDP data of
Canada etc are some of the important data scheduled this week, which may give
higher impact on the commodities prices on the international bourses. In Indian
commodities market investors should consider the movements of rupee apart from
other economic releases and events.
From The Desk Of Editor

4
NOTES:
1) These levels should not be confused with the daily trend sheet, which is sent every morning by e-mail in the name of "Morning Mantra ".
2) S1 & S2 indicate first support & second support respectively & R1 & R2 indicate first resistance and second resistance respectively.
3) Sometimes you will find the stop loss to be too far but if we change the stop loss once, we will find more strength coming into the stock. At the moment, the stop loss will be far as we are seeing the graphs on weekly basis and taking a long-term view and not a short-term view.
TREND SHEET
Stocks Closing Trend Date Rate S1 R1 S2 R2 Cl.
Price Trend Trend S/l
Changed Changed
SENSEX 18313 DOWN 01.08.13 19317 19000 19300 19600
S&P NIFTY 5408 DOWN 01.08.13 5728 5600 5700 5780
CNX IT 7778 UP 18.07.13 7306 7300 7200 7100
CNX BANK 9269 DOWN 13.06.13 11687 10000 10500 10700
ACC 999 DOWN 17.01.13 1359 1080 1120 1150
BHARTIAIRTEL 313 UP 18.07.13 324 325 315 310
BHEL 107 DOWN 01.11.12 227 120 128 135
CIPLA 401 UP 18.07.13 413 395 385 380
DLF 144 DOWN 21.03.13 239 155 160 170
HINDALCO 104 DOWN 13.06.13 97 95 100 105
ICICI BANK 831 DOWN 13.06.13 1069 920 950 980
INFOSYS 3020 UP 18.07.13 2800 2800 2750 2700
ITC 308 DOWN 07.08.13 322 325 335 345
L&T 724 DOWN 23.05.13 945 810 840 860
MARUTI 1286 DOWN 13.06.13 1457 1380 1420 1450
NTPC 131 DOWN 20.06.13 140 140 145 148
ONGC 270 DOWN 13.06.13 309 285 295 300
RELIANCE 806 DOWN 22.08.13 806 850 870 880
TATASTEEL 274 UP 22.08.13 274 255 245 235
NEWS
EX DATE SYMBOL PURPOSE26-AUG-13 NEYVELILIG DIVIDEND - RS 1.80/- PER SHARE26-AUG-13 GLOBOFFS FINAL DIVIDEND RE.0.80 PER SHARE28-AUG-13 WYETH DIVIDEND RS.17/- PER SHARE28-AUG-13 PFIZER DIVIDEND - RS 12.50/- PER SHARE + SPECIAL
DIVIDEND - RS 20/- PER SHARE28-AUG-13 LAKSHMIMIL DIVIDEND RS.12/- PER SHARE28-AUG-13 RECLTD DIVIDEND RS.1.50 PER SHARE29-AUG-13 TAKE FINAL DIVIDEND - RE 0.40/- PER SHARE29-AUG-13 UFLEX DIVIDEND RS.2.40 PER SHARE29-AUG-13 GUJALKALI DIVIDEND-RS.3.50 PER SHARE29-AUG-13 ABIRLANUVO DIVIDEND RS 6.50/- PER SHARE29-AUG-13 BANARISUG DIVIDEND RS 12.50/- PER SHARE29-AUG-13 IDBI DIVIDEND RS.3.50 PER SHARE29-AUG-13 TEXRAIL DIVIDEND RE.1/- PER SHARE30-AUG-13 HINDALCO DIVIDEND RS.1.40 PER SHARE30-AUG-13 NHPC FINAL DIVIDEND - RE 0.60/- PER SHARE30-AUG-13 OMAXAUTO DIVIDEND RE.1/- PER SHARE3-SEP-13 HEROMOTOCO DIVIDEND RS.60/- PER SHARE4-SEP-13 JINDRILL DIVIDEND - RE 0.50/- PER SHARE4-SEP-13 MAHSEAMLES DIVIDEND - RS 6/- PER SHARE4-SEP-13 SJVN DIVIDEND RE 0.96/- PER SHARE5-SEP-13 SUPREMEIND FINAL DIVIDEND - RS 5.50/- PER EQUITY SHARE5-SEP-13 NTPC FINAL DIVIDEND RE.0.75 PER SHARE AND
SPECIAL DIVIDEND RS.1.25 PER SHARE5-SEP-13 GAIL FINAL DIVIDEND - RS 5.60/- PER SHARE5-SEP-13 ASTRAL FACE VALUE SPLIT FROM RS.5/- TO RS.2/-6-SEP-13 HEG FINAL DIVIDEND RS.8/- PER EQUITY SHARE6-SEP-13 UBL DIVIDEND RE.0.70 PER SHARE6-SEP-13 BPCL DIVIDEND RS.11/- PER SHARE6-SEP-13 BHEL FINAL DIVIDEND RS.3.29 PER SHARE6-SEP-13 COALINDIA FINAL DIVIDEND RS.4.30 PER SHARE
FORTHCOMING EVENTS
DOMESTIC NEWSEconomy• India's Prime Minister Manmohan Singh said that the slow growth phase
will not last long. The measures taken recently to increase investment will show visible results in months ahead, Singh said in his address to the nation on the occasion of the Independence Day.
FMCG• Bajaj Corp has acquired NOMARKS brand from Ozone Ayurvedics. With this
acquisition Bajaj Corp has now entered skin care category worth Rs 8,500 crore which grew by 12.1% in FY13.
Oil & Gas• Indian Oil Corp (IOC) will invest about `8,000 crore to expand capacity at its
Koyali oil refinery in Gujarat to 18 million tonnes per annum by 2016-17.Information Technology• Tech Mahindra, which merged Mahindra Satyam (Satyam Computer
Services Limited) with itself a few months ago, is in the process of transferring three special economic zones that were allotted to the latter before merger.
• KPIT Cummins has joined Infor Partner Network to market, implement and service business application softwares of New York-based enterprise solution provider Infor.
• Zensar Technologies has signed multi-million dollar deals in the US including a five-year infrastructure outsourcing contract with a direct selling firm.
Automobile• Maruti Suzuki India (MSI) has launched a compact car Stingray, priced at
`4,10,000 (ex-showroom Delhi). Stingray, which is powered by a 998 cc petrol engine, is available in three variants, with price ranging between `4,10,000 to ̀ 4,67,000.
Mining/ Minerals• NMDC will set up a 500-MW power plant at UP's Gonda. The company would
invest about `3,016 crore on the project and has roped in IL&FS Energy Development Company (IEDCL) as a partner for the project, giving it a 74% stake.
Engineering• Larsen & Toubro has got a `1,500 crore engineering, procurement and
construction (EPC) order from Petroleum Development Oman LLC (PDO).Metal• Steel Authority of India (SAIL) has incurred ̀ 42,101 crore expenditure till
July this year out of its proposed `61,870 crore investment for capacity expansion during the current phase.
Healthcare• Fortis Healthcare has completed the sale of its entire 65% stake in Vietnam-
based hospital chain Fortis Hoan My Medical Corporation for $80 million.Capital Goods• Siemens has won two contracts worth `144 crore for improving power
distribution in Bangladesh. The projects are funded by Japan Bank for International Cooperation Agency (JICA) and are to be delivered on a turnkey basis.
Pharmaceuticals• Dr Reddy's Laboratories Limited has initiated a voluntary recall of a few
lots of Ranitidine Hydrochloride tablets of 150 mg strength in the US earlier this month.
INTERNATIONAL NEWS• US existing home sales jumped 6.5 percent to a seasonally adjusted
annual rate of 5.39 million in July from a downwardly revised 5.06 million in June. Economists had expected existing home sales to climb to an annual rate of 5.15 million from the 5.08 million originally reported for the previous month.
• US initial jobless claims rose to 336,000, an increase of 13,000 from the previous week's revised figure of 323,000. Economists had expected jobless claims to climb to 329,000 from the 320,000 originally reported for the previous week.
• Us industrial production was unchanged in July after rising by a downwardly revised 0.2 percent in June. Economists had expected production to increase by 0.3 percent, matching the growth originally reported for the previous month.
• US leading economic index increased by 0.6 percent in July after coming in unchanged in June. Economists had been expecting the index to increase by about 0.5 percent.
• Construction on new U.S. homes rose 5.9 percent in July to a seasonally adjusted annual rate of 896,000. The consensus forecast called for July housing starts to increase 8.9 percent to an annual rate of 910,000.
• According to a preliminary result of a survey by Markit Economics and HSBC revealed, Chinese manufacturing activity bounced back from contraction territory in August, as new orders recovered. The flash HSBC purchasing managers' index rose to 50.1 in August from a 11-month low of 47.7 in July. Economists had expected the index to increase to 48.2. Readings above 50 indicate expansion of the sector, while those below 50 suggest contraction.
*Stock price has been adjusted according to the Bonus ratio 1:2
®

5
BSE SENSEX GAINERS & LOSERS TOP (% Change) NSE NIFTY GAINERS TOP & LOSERS (% Change)
SECTORAL INDICES (% Change)
SMC Trend
SMC Trend
FMCGHealthcare
FTSE 100CAC 40
Auto BankRealty
Cap GoodsCons Durable
Oil & GasPower
NasdaqDow jonesS&P 500
NikkeiStrait times
Hang SengShanghai
INSTITUTIONAL ACTIVITY (Equity) (` Crore)
ITMetal
Down SidewaysUp
SMC Trend
Nifty BSE Midcap Nifty JuniorSensex BSE Smallcap S&P CNX 500
GLOBAL INDICES (% Change)
INDIAN INDICES (% Change)
®
-502.80
-653.50
-1364.90
-748.60
-67.80
70.50
427.10
-1600.00
-1400.00
-1200.00
-1000.00
-800.00
-600.00
-400.00
-200.00
0.00
200.00
400.00
600.00
Friday Monday Tuesday Wednesday Thursday
FII Activity MF Activity
-1.80-1.53
-2.37
-1.15
-3.69
-2.09
-4.00
-3.50
-3.00
-2.50
-2.00
-1.50
-1.00
-0.50
0.00
Nifty Sensex BSE Midcap BSE Smallcap
Nifty Junior S&P CNX 500
-4.93
-1.96
-2.80
-4.01-3.50
-4.07
-0.01
11.29
-1.21-0.86
-1.88
-6.00
-4.00
-2.00
0.00
2.00
4.00
6.00
8.00
10.00
12.00
14.00
Auto Index Bankex Cap Goods Index
Cons Durable Index
FMCG Index Healthcare Index
IT Index Metal Index Oil & Gas Index
Power Index Realty Index
-0.78
1.00
0.07
-2.09
-3.38
-2.76
-0.06
-0.82
-1.57
-4.00
-3.50
-3.00
-2.50
-2.00
-1.50
-1.00
-0.50
0.00
0.50
1.00
1.50
Nasdaq Comp. Dow Jones S&P 500 Nikkei Strait Times Hang Seng Shanghai Comp.
FTSE 100 CAC 40
16.2515.29
10.99
8.61
3.64
-7.36-6.67 -6.65 -6.09
-5.33
-10.00
-5.00
0.00
5.00
10.00
15.00
20.00
Tata Steel Sterlite Inds. Hindalco Inds.
Jindal Steel Coal India Sun Pharma.Inds.
Bharti Airtel Tata Motors NTPC M & M
19.62
16.46
12.1211.17
8.35
-13.78
-8.88-7.56 -7.42 -7.01
-20.00
-15.00
-10.00
-5.00
0.00
5.00
10.00
15.00
20.00
25.00
Sesa Goa Tata Steel JP Associates Hindalco Inds.
Jindal Steel ACC Ambuja Cem. Axis Bank Sun Pharma.Inds.
Tata Motors

Beat the street - Fundamental Analysis
6
® Above calls are recommended with a time horizon of 1 year. Source: Company Website Reuters Capitaline
Face Value (`) 2.00
52 Week High/Low 167.50 / 61.75
M.Cap (` Cr.) 2551.35
EPS (`) 9.60
P/E Ratio (times) 14.09
P/B Ratio (times) 5.07
Stock Exchange BSE
VALUE PARAMETERS
% OF SHARE HOLDING
ALEMBIC PHARMACEUTICALS LTD CMP: 135.35 Upside: 18%Target Price: 159
Investment Rationale sales is expected to get ramp up in the next few quarters. The current market size for Pristiq is •Alembic Pharmaceuticals is a vertically integrated approximately US$ 538 million, based on industry research and development pharmaceutical sales data.company. The company manufactures and
•Net sales up 16% at `429 crores for the quarter markets generic pharmaceutical products all over the world. It has USFDA, MCC, MHRA, ANVISA, ended June 2013 against `368 crores in TPD approved formulations facility at Panelav for corresponding quarter last year. Net profit after tax its generic business and USFDA, EDQM, TGA, grew by 51% at `47 crores vis-à-vis `31 crores in WHO approved API facility at Panelav (2 units) and corresponding quarter last year.at Karkhadi (1 unit) for API (Active Pharmaceutical ValuationIngredients) business. The company has reported robust growth both in
•The Company partially commissioned its new International Generic Business and branded Formulation facility and expects full plant to be Formulation Business in the last few years. Going operational in FY14, which will augment its forward, the Launch of 20-25 new products in the capacity from 2.6 billion tablets /capsules to 5 Branded Formulation Business and Expanded annual billion. This will help business in driving significant production capacity in International Generics growth in International Generics. business would help the company to boost sales
•The company has entered into a development and momentum and brand build up. On the estimated l i c e n s e a g r e e m e n t w i t h A c c u - B r e a k FY14E EPS of Rs 10.63 and target P/Ex of 15x, we Pharmaceuticals, Inc, USA (ABP) to develop new expect the stock to see a price target of `159 in one brand products that will use ABP's innovative Accu-
year time frame. Break tablet technologies. ABP is a technology licensing and product development company. It currently has 48 patents issued and 22 patents pending worldwide.
•During the quarter ended June 2013 the company received two ANDA approvals. With this the cumulative ANDA/NDA approvals now stands at 26. The cumulative ANDA/NDA filings of the company stand at 57.
•It has Alliances with leading generic players in USA, Canada, Europe, Australia,Brazil and South Africa.
•According to the management “Desvenlafaxine Base Extended Release tablets” has started receiving attention from key customers in US and
` in cr
Particular Mar 2013 2014(E) 2015
Revenue 1,517.25 1,755.45 2,046.74
EBITDA 251.96 305.01 373.69
EBIT 216.99 285.68 337.35
Pre-Tax Profit 206.35 257.07 329.67
Net Profit 165.25 200.23 253.01
EPS 8.77 10.63 13.63
BVPS 26.68 39.31 50.56
ROE 36.81 31.20 30.77
Mar Mar (E)
P/BV Chart
Face Value ( ) 1.00
52 Week High/Low 241.10/120.00
M.Cap (` Cr.) 11796.21
EPS (`) 8.67
P/E Ratio (times) 23.15
P/B Ratio (times) 5.18
Dividend Yield (%) 1.00
Stock Exchange BSE
`
` in cr
Particular Mar 2013 Mar 2014 Mar 2015
Revenue 25,225.30 29,373.02 33,544.74
EBITDA 1,781.23 2,479.82 3,053.90
EBIT 1,066.72 1,810.99 2,377.94
Pre-Tax Profit 834.21 1,490.85 2,018.21
Net Profit 444.54 791.63 1,060.56
EPS 7.56 13.46 18.04
BVPS 38.93 48.85 63.71
ROE 21.37 31.26 31.72
(E) (E)
VALUE PARAMETERS
% OF SHARE HOLDING
Investment Rationale •Company's key customer includes Volkswagen,
Hyundai, Maruti Suzuki, BMW, Renault Nissan, •Motherson Sumi Systems supplies components, Ford, Mercedes-Benz, General Motors, Tata modules and systems to the automotive sector. Its Motors, Volvo, Mahindra & Mahindra and Toyota.business portfolio encompasses Electrical
Distribution System (EDS), polymer products and •The company has reported healthy revenue
complete module solutions. It is the largest growth across segments, despite an uncertain
supplier of EDS to the Indian automotive industry. macro environment. The company reported eight
At present, the company has spread to 25 fold rise in net profit on a 11% growth in topline.
countries with 124 plants. The quarter was also marked by good
improvement in margins.•The company plans to invest `800 crore in four-
five new manufacturing plants. Of the total, ̀ 650 Valuation
crore is earmarked for overseas markets such as The company has been receiving new orders across Germany, China and the US, where it has got segments /geographies and steadily improving several new orders from the automakers like profitability at global subsidiaries, despite an Volkswagen. uncertain macro environment. We, thus, expect the
•The company is adding one new plant in India — in stock to see a price target of `320 in one year time
Gujarat for Ford — while expanding capacity at frame, based on estimated FY14E EPS of 13.46 on the
other locations in Bangalore, Chennai and current target P/Ex of 23.15.
Tapukara (Rajasthan). It has also procured land
for a new plant at Gujarat for Maruti, but other
new plants in India will come up from next year.
•Company's order book is very healthy. A lot of new
orders have already being bagged by the
Samvardhana Motherson Reflectec Group
Holdings Limited (SMR), Samvardhana Motherson
Peguform (SMP) and Motherson Sumi divisions.
•The company is more focused on Return on
Capital Employed (ROCE). It is targeting to
achieve a 40% ROCE in next two year, in FY13 the
ROCE is at 14.24%.
P/E Chart
MOTHERSON SUMI SYSTEMS LIMITED CMP: 200.65 Upside: 55%Target Price: 312
15.29
9.84
3.57
65.59
5.72 Foreign
Institutions
Non Promoter Corporate Holding
Promoters
Public & Others
8.09
1.37
1.2
74.13
15.22
Foreign
Institutions
Non Promoter Corporate Holding
Promoters
Public & Others

Charts by Spider Software India Ltd
7
The stock closed at 99.05 on 22nd August 2013.. It made a 52-week low at
`83.55 on 27th June 2013 and a 52-week high at ̀ 119.40 on 18th December 2012.
The 200 days Exponential Moving Average (EMA) of the stock on the weekly chart
is currently at ̀ 111.78.
It has formed an Inverted head and shoulder with the support of volumes and last
week it managed to have a positive closing, which is a sign of strength. One can
Buy in the range of 97-99 levels with closing below stop loss of 93 levels for the
target of 108-112 levels.
`
EQUITY
Above calls are recommended with a time horizon of 1-2 months
The stock closed at 104.00 on 22nd August 2013. It made a 52-week low at
`83.10 on 07th August 2013 and a 52-week high of ̀ 137.10 on 02nd January 2013.
The 200 days Exponential Moving Average (EMA) of the stock on the weekly chart
is currently at ̀ 129.41
After making 52 week low of 83 levels, it rebounded sharply by forming a
reversal bar, which shows that bargain hunting is there due to which it gave a
closing on positive note on weekly basis. One can Buy in the range of 100-102
levels with closing below stop loss of 95 levels for the target of 112-115 levels.
`
The stock closed at 366.40 on 22nd August 2013. It made a 52-week low at
`308.10 on 12th September 2012 and a 52-week high at `531.90 on 28th May
2013. The 200 days Exponential Moving Average (EMA) of the stock on the weekly
chart is currently at ̀ 301.49.
After a marginal fall, it has formed reversal bar on the weekly charts, which
could be anticipated as a sign of rebound in the near term in this particular scrip.
One can Buy 368-372 levels with closing below stop loss of 350 levels for the
target of 395-405 levels.
`
FORTIS HEALTHCARE LIMITED
INDUSIND BANK LIMITED
HINDALCO INDUSTRIES LIMITED
®

DERIVATIVES
BASIS GAP IN NIFTY
Markets remained volatile throughout the week. Hereafter, the range of 5400-5600 will remain crucial for current expiry and the move is expected to remain
volatile. If Nifty slips below the 5400 mark, it could slide to 5300 levels due to increased selling pressure. On the other hand, the index may face stiff resistance
at 5500-5550 levels. The put-call ratio of open interest decreased last week and closed at 0.85 levels. The options open interest concentration continued to be at
the 5600-strike call with the highest open interest of above 80 lakh shares. Among put options, the 5300-strike has the highest open interest of 70 lakh shares.
Nifty put options' implied volatility (IV) increased to 25.50%, while Nifty call options' IV closed at 24.90%. Nifty VIX closed at 25.75%. It is currently trading above
its 20-day EMA and is expected to rise from current levels. It has a strong support around 22 levels Nifty August futures are trading at discount; however,
September futures closed at a premium of 20.00 points. Short term indicators are indicating sideways move for the current expiry. Nifty is expected to expire in a
broad range of 5300-5600 levels, with an intermediary support at around 5400 levels.
WEEKLY VIEW OF THE MARKET
NIFTY TOTAL OPEN INTEREST (in share)
FIIs ACTIVITY IN INDEX FUTURE (F&O) IN LAST WEEK
(Derivative segment)
®
FIIs ACTIVITY IN F&O IN LAST TEN SESSIONS
(Derivative segment) `(Cr)
BPCL (AUG FUTURE)
Buy: Above `307
Target: `319
Stop loss: `302
IBREALESTBuy AUG 62.50 CALL 1.20Buy AUG 57.50 PUT 0.95
Lot size: 4000Upside BEP: 60.35Downside BEP: 55.35Max. Profit: UnlimitedMax. Loss: 8600.00 (2.15*4000)
OPTIONSTRATEGY
FUTURESTRATEGY
TATAPOWERBuy AUG. 80. CALL 1.20
Lot size: 4000BEP: 81.20Max. Profit: UnlimitedMax. Loss: 4800.00 ( 1.20*4000)
DLF (AUG FUTURE)
Sell: `134
Target: `117
Stop loss: `143
Below
IDEABuy AUG 160 CALL 2.25Buy AUG 155 PUT 2.65
Lot size: 2000Upside BEP: 164.90Downside BEP: 150.10Max. Profit: UnlimitedMax. Loss: 9800.00 (4.90*2000)
BULLISH STRATEGY
DERIVATIVE STRATEGIES
PFC (AUG FUTURE)
Buy: `122
Target: `130
Stop loss: `118
Above
VOLATILITY BASED STRATEGY
259750 368400
1374950
3305550
4858900
6844100 6893450
6119150
5042000
4058700
4978550
3454200
4323350
7290950
7955600
5458000
3020150
2020750
2391150
2095550
1101400 951250
0
1000000
2000000
3000000
4000000
5000000
6000000
7000000
8000000
9000000
5000 5100 5200 5300 5400 5500 5600 5700 5800 5900 6000
Call Put
BUY6.0%
SELL94.0%
-20
-10
0
10
20
30
40
06-Aug 07-Aug 08-Aug 12-Aug 13-Aug 14-AUg 16-Aug 19-Aug 20-Aug 21-Aug 22-Aug
-
451.51
847.29
1555.561294.98 1286.38
2013.62
-805.87
-2301.73
-450.23-326.80
-2500.00
-2000.00
-1500.00
-1000.00
-500.00
0.00
500.00
1000.00
1500.00
2000.00
07-Aug 08-Aug 12-Aug 13-Aug 14-AUg 16-Aug 19-Aug 20-Aug 21-Aug 22-Aug
8

9
BHARTIARTL 10267000 12170000 18.54 0.87 0.70 -0.17 42.56 52.77 10.21
DLF 33903000 32763000 -3.36 0.87 0.77 -0.10 87.24 87.22 -0.02
HINDALCO 23448000 24348000 3.84 0.77 1.12 0.35 57.62 73.85 16.23
HINDUNILVR 6758500 8055000 19.18 0.92 0.92 0.00 25.06 32.15 7.09
ICICIBANK 9242000 10927000 18.23 0.61 0.42 -0.19 40.15 43.72 3.57
IDEA 9374000 9766000 4.18 0.65 0.47 -0.18 53.94 52.87 -1.07
INFY 2677125 3364500 25.68 1.26 1.42 0.16 23.67 24.40 0.73
ITC 17367000 26425000 52.16 0.52 0.49 -0.03 37.31 47.45 10.14
JPASSOCIAT 80068000 71172000 -11.11 0.45 0.48 0.03 84.96 102.24 17.28
NTPC 9522000 11072000 16.28 0.70 0.49 -0.21 35.22 36.51 1.29
ONGC 8201000 10925000 33.22 0.36 0.45 0.09 46.76 60.51 13.75
RANBAXY 4487000 5543000 23.53 1.35 1.41 0.06 56.46 103.85 47.39
RCOM 28336000 32316000 14.05 0.52 0.62 0.10 81.19 77.81 -3.38
RELIANCE 8167000 10156750 24.36 0.51 0.47 -0.04 32.42 35.03 2.61
NIFTY 17616800 23545950 33.66 0.97 0.85 -0.12 22.36 25.50 3.14
SAIL 16136000 15124000 -6.27 0.51 0.71 0.20 67.33 70.02 2.69
SBIN 6348375 6407500 0.93 0.51 0.42 -0.09 45.03 44.78 -0.25
TATASTEEL 17547000 16567000 -5.59 0.85 1.27 0.42 61.18 76.69 15.51
UNITECH 66352000 65464000 -1.34 0.67 0.65 -0.02 89.71 99.95 10.24
IMPORTANT INDICATORS OF NIFTY AND OTHER ACTIVE FUTURE CONTRACTS
OPEN INTEREST PCR RATIO IMPLIED VOLATILITY
SCRIPTS PREV. CURRENT % PREV. CURRENT PREV. CURRENT WEEK WEEK CHANGE WEEK WEEK CHANGE WEEK WEEK CHANGE
DERIVATIVES
Put Call Ratio Analysis : The Put-Call open interest ratio of Nifty has decreased
to 0.85 from 0.97. At the end of the week, the maximum stocks had a positive of
change in put call open interest ratio.
Implied Volatility Analysis : The Implied Volatility (IV) for Nifty futures this week
has increased to 25.50% from 22.36%. The IV of the stock futures has changed this
week ranging from -3.38% to 47.39%.
Open Interest Analysis : The open interest for the index at the end of this week
has increased by 33.66% as compared to the previous week. All future stocks saw
changes in their open interest ranging from -11.11% to 52.16%. ITC has the
maximum increase in open interest as compared to other stocks.
Statistical Analysis·
Open 5716.60 High 5725.00
Low 5200.00 Close 5414.30
NIFTY & IV CHART NIFTY ANALYSIS
®
22
23
24
25
26
27
28
5100
5200
5300
5400
5500
16-Aug 19-Aug 20-Aug 21-Aug 22-Aug
Nifty Close IV

10
®
Massive depreciation in the local currency rupee which is making fresh low
Vs dollar every week will continue to keep the bullish sentiment intact in the
bullion counter in near term. Local currency slipped below another fresh
low of 65 as the steps taken by finance minister failed to curb its slide. Gold
may trade in the range of $1330-1430 in COMEX and 30500-32000 in MCX.
White metal silver can also trade in the range of 50000-53000 in near term.
The physical demand for gold and silver in China and India continue to
support the prices. Sales of jewelry, coins and bars will reach as much as
1,000 metric tonnes in India and China in 2013, valued at a combined $87.6
billion. While investors from John Paulson to George Soros sold after the
bear market began in April as some investors lost their faith in gold as a store
of value, the slump boosted sales in Asia. Investors sold 23.2 tonnes from
gold backed ETPs since the start of August, set for the smallest outflow since
January. That took this year's drop to 683.6 tonnes, close to the 700 tonnes.
According to U.S. Commodity Futures Trading Commission Hedge funds and
other large speculators reduced bearish bets by 17 percent. Central bank
demand is also helping to compensate for the sales from ETPs. Nations
added 534.6 tonnes to reserves last year, the most since 1964, and may buy
another 350 tonnes this year, the gold council estimates. Official reserves
total 31,910 tonnes, 16 times more than metal held in ETPs.
BULLIONS
Crude oil may remain sideways with upside bias in the range of 6650-6950 in
MCX and $103-108 in NYMEX. Recently, weak greenback and Middle East
tensions gave support to the prices. Tensions in Syria, Libya and Egypt
continue to underpin the crude sentiments. The US and Russian diplomats
would meet in Hague on Wednesday to discuss ending Syria's civil war, in
what would be the first such meeting since allegations of the chemical
attack. The United Nations demanded Syria give its chemical weapons
expert's immediate access to rebel held Damascus suburbs where poison gas
killed hundreds just a few miles from the UN team's hotel. Libyan tribesmen
stepped up efforts to persuade oil port guards to end protests that curtailed
the North African nation's crude exports. Meanwhile, according to EIA total
fuel demand in the U.S. rose 1.3 percent last week to 19.3 million barrels a
day. Bounce back in the natural gas may persist as it can trade in the range of
215-238 in MCX. U.S. natural-gas stockpiles rose 57 billion cubic feet last
week. Natural gas inventories now stand at 3.063 trillion cubic feet, 1.5%
above the five year average but still 7.2% below last year's level. Weather
forecasters have been calling for a hot end to summer. This week hottest
weather can prevail in US central to western Midwest. U.S. natural gas
production remains near record highs, but demand for the fuel from utilities
would siphon off some of that supply.
ENERGY COMPLEX
Base metals complex may trade with upside bias on strong China imports data and weak local currency rupee. Red metal copper can trade in the range of 460-490. Copper output in China, the largest producer, may grow at a slower pace than expected this year on tightening supplies of imported scrap metal, according to Beijing Antaike Information Development Co. Premiums for imported copper remained near an all time high in China as the domestic output slumped on tight supplies of scrap metal and smelter maintenance. Copper imports by the world's biggest consumer rose for a third month in July, touching a 10-month high. Scrap copper imports dropped 19 percent to 349,405 tonnes in July, while arrivals of concentrates jumped to a record 938,503 tonnes. Aluminum prices may move in the range of 115-122 levels while Zinc prices can hover in the range of 120-130 in MCX. Russia's Rusal , the world's largest aluminium producer by output, may delay the start of production at one of its biggest projects, seeking to ease a global glut of the metal. Nickel prices can trade in the range of 900-1000 in MCX. According to INSG “the global nickel market was in surplus by 74,200 tonnes in the first six months of the year”. It showed world primary nickel consumption totalled 874,200 tonnes in January to June, while primary nickel output was 948,400 tonnes for the period. Nickel mine production in January to June totalled 1,085.8 million tonnes. Battery metal lead can move in the range of 137-147.
BASE METALS
Turmeric futures (Sept) is likely to remain stable taking support above 4800 levels. The market participants are in an anticipation that the exporters are to receive bulk orders from the upcountry traders. The supply side fundamentals show that in Andhra Pradesh district Turmeric sowing area reported till 14th August 2013, 45101 hectares as compared to the last year same period 46708 hectares. Jeera futures (Sept) will maintain a consolidation, managing to stay above 13000 levels. In the current scenario, the export demand is good and is expected to remain firm in the short term because of supplies from the other leading producers are negligible. For Singapore, Indian cumin with an allowance for 1% foreign matter was offered at $2,250-2300/tonne free on board Mumbai. For Europe, the price was quoting at $2,500-$2,600/tonne on cost and freight basis. Any upside gain in cardamom futures (Sept) may remain capped near 800 levels. The counter is losing its aroma on the heaps of higher supply at the spot market. The exporters are not seen covering their requirements as the availability of exportable variety of 7 mm and above capsules is thin. The exportable varieties of capsules would come from the second round of picking, which is expected to commence by the month-end. Chilli futures (Sept) is expected to consolidate in the range of 5200-5600 levels. In Madhya Pradesh, Nimar region chilli sowing area increased around 20-25% due to good weather condition, however due to incessant rainfall current season has damaged the present crop.
SPICES
OTHER COMMODITIES
Wheat futures (Sept) will continue to witness a consolidation in the range of 1560-1600 levels. The spot prices are at almost unchanged previous levels due to lack of fresh cues of demand. As export opportunity for India is diminishing fast due to widening price gap, we expect easy supply side to continue in the local market. It seems that there is no wheat export opportunity from India as of now due to higher prices despite of weak rupee. Ukraine and Russia is exporting wheat at $240-244/MT, FOB Black sea region, U.S is selling wheat at $260-270/MT. On the international market, the European Union this week granted export licenses for 579,000 tonnes of soft wheat, taking the total since the beginning of the 2013/14 (July-June) season to 3.23 million tonnes. Chana futures (Sept) is expected to maintain its upside bias taking support above 2950 levels. The sustained weakness in Rupee, making import costlier is likely to add cushion to the counter. On the contrary, the special margin of 5% on the short side in chana has been withdrawn w.e.f August 23rd, 2013. Guar complex are seen making a way to the upside as the recent weakness in local currency is giving an opportunity to the importers to buy the guar gum at competitive rates. The upside gains in sugar futures (Sept) will remain capped near 3065 levels. The continuous supply from mills kept stockists away from fresh bulk buying. In overseas market, ICE raw sugar futures slipped to a four-week low, pressured by the stronger dollar.
Mustard futures (Sept) is likely to trade higher surpassing 3450 levels. At the spot market, the counter ruled firm at `4,100-Rs 4,250 a quintal (up Rs 50 from last week), while raida ruled at `3,050-3,100. Plant deliveries in mustard seeds for Jaipur line also ruled higher at ̀ 3,600-3,620 on improved demand from crushers. Soybean futures (Oct) is seen to continue its bullish upside & test 3500 levels. There are reports that the crop has suffered this year due to heavy rains in Jabalpur, Hoshangabad, Harda, Ujjain and Raisen districts. As cited by the weather department, Madhya Pradesh has received a total of 103 cm rains this year against 67 cm in normal condition. The Soybean Processors Association of India (SOPA) has also estimated 5-7% losses to the crop. On the international market, the Midwest Tour showed that there is more yield loss than expected from unusually cool, dry weather in July & the U.S. Department of Agriculture probably will cut its soybean-crop estimates. On the contrary, a stronger dollar is potentially dampening the sentiments of U.S soybean exports. Sales of 345,000 tonnes are needed each week to reach the USDA forecast. CPO futures are likely to maintain its upside bias, pushed by a weaker rupee-making imports costlier. In Malaysian market, a weakening Malaysian currency would boost exports from the world's second-largest producer. The ringgit, which touched its weakest level against the U.S. dollar in three years, has depreciated 7.5% this year.
OIL AND OILSEEDS

Closing as on 22.08.2013
11
NOTES : 1) Buy / Sell 25% of Commodity at S1/R1 respectively & rest 75% at S2/R2 respectively.2) S1 & S2 indicate first support & second support & R1 & R 2 indicate first resistance & second resistance. 3) Sometimes you will find the stop loss to be too far but if we change the stop loss once, we will find more strength coming into the commodity. At the moment, the stop loss will be far as we are seeing the graphs on weekly
basis and taking a long-term view and not a short-term view.4) These levels should not be confused with the daily trend sheet, which is sent every morning by e-mail in the name of Daily report- commodities.
TECHNICAL RECOMMENDATIONS
EXCHANGE CONTRACT CLOSING DATE TREND
PRICE CHANGED CHANGED STOP/LOSS
NCDEX SOYABEAN (OCT) 3278.00 25.07.13 DOWN 2884.50 - 3350.00 3500.00 3700.00
NCDEX JEERA (SEP) 13320.00 11.04.13 UP 13795.00 12400.00 - 12000.00 - 11500.00
NCDEX RED CHILLI (SEP) 5348.00 17.04.13 DOWN 6362.00 - 5800.00 6000.00 6100.00
NCDEX RM SEEDS (SEP) 3397.00 25.07.13 DOWN 3099.00 - 3600.00 3700.00 3800.00
MCX MENTHA OIL (SEP) 879.20 13.06.13 SIDEWAYS
MCX CARDAMOM (SEP) 762.00 28.02.13 DOWN 965.00 - 820.00 850.00 900.00
MCX SILVER (SEP) 51195.00 14.08.13 UP 46573.00 48000.00 - 46000.00 - 45000.00
MCX GOLD (OCT ) 31140.00 14.08.13 UP 29186.00 29700.00 - 29000.00 - 28000.00
MCX COPPER (NOV) 475.30 30.05.13 UP 414.55 450.00 - 435.00 - 420.00
MCX LEAD (SEP) 141.00 30.05.13 UP 122.90 135.00 - 130.00 - 125.00
MCX ZINC (SEP) 125.25 30.05.13 UP 107.55 120.00 - 115.00 - 110.00
MCX NICKEL (SEP) 934.00 14.08.13 UP 909.30 870.00 - 840.00 - 810.00
MCX ALUMINUM (SEP) 120.00 14.08.13 UP 114.00 112.00 - 107.00 - 104.00
MCX CRUDE OIL (SEP) 6729.00 06.06.13 UP 5404.00 6500.00 - 6300.00 - 6200.00
MCX NATURAL GAS (SEP) 231.30 22.08.13 UP 231.30 215.00 - 205.00 - 200.00
TREND RATE TREND S1 R1 S2 R2 CLOSING
*
TREND SHEET
COMMODITY
TURMERIC NCDEX (SEPTEMBER) contract closed at 4956.00 on 22nd August '13. The contract made its
high of ̀ 6378.00 on 2nd July '13 and a low of ̀ 4620.00 on 6th August '13. The 18-day Exponential Moving
Average of the commodity is currently at ̀ 4997. On the daily chart, the commodity has Relative Strength Index (14-day) value of 46. One can buy 4900-
4800 the range with the stop loss of ̀ 4630 for a target of ̀ 5300.
`
RMSEED NCDEX (SEPTEMBER) contract closed at 3397.00 on 22nd Aug '13. The contract made its high
of `3622.00 on 24th June '13 and a low of `3060.00 on 30th July '13.The 18-day Exponential Moving
Average of the Commodity is currently at ̀ 3344..
On the daily chart, the commodity has Relative Strength Index (14-day) value of 58.One can buy in the
range 3380-3350 with the stop loss of ̀ 3310 for target of ̀ 3550.
`
CORIANDER NCDEX (SEPTEMBER) contract closed at 5660.00 on 22nd August '13.The contract made
its high of `6853.00 on 25th June '13 and a low of `5072.00 on 2nd August '13.The 18-day Exponential
Moving Average of the Commodity is currently at ̀ 5633.
On the daily chart, the commodity has Relative Strength Index (14-day) value of 50. One can buy in the
range 5650-5550 with the stop loss of ̀ 5400 for a target of ̀ 5900.
`
®
TURMERIC NCDEX (SEPTEMBER)
RMSEED NCDEX (SEPTEMBER)
CORIANDER NCDEX (SEPTEMBER)
COMMODITY
NEWS DIGEST
It was a magical movement in Indian commodity markets owing to the historical rise in rupee as
against dollar. It shunned the range trading in the international market and saw upside in most of
the commodities on rupee depreciation, which breached the mark of `65 per dollar. Most of the
commodities from metals, energy and agri counters showed more volatility in the week gone by.
Yellow metal traded with big swings in both the sides, finally closed up in the domestic market
whereas international gold traded down on profit booking. Steep downside in equity market
pushed up gold prices in past few trading sessions on safe haven buying. Silver narrated the same
story, continued the uptrend of last to last week, while it closed down in the international
market. Energy pack traded on quite note ahead of minutes of FOMC. There was a little change in
trade in international market when the minutes released in which members were “broadly
comfortable” with Chairman Ben S. Bernanke's plan to start curbing bond buying later this year if
the economy improves. Copper led gains in the industrial metals after a manufacturing index in
China increased in August from an 11-month low, adding to the signs the world's second-biggest
economy is stabilizing. But again local currency gave additional thrilling ride to industrial metals,
especially copper which made new high last week. Crude also traded up. An Energy Information
Administration report showed crude stockpiles shrank by 1.4 million barrels last to last week
whereas U.S. gasoline inventories declined 4 million barrels. However, on Thursday, metals and
energy counter saw profit booking.
Soybean futures rose to a two-month high and corn gained on concern that dry weather in the U.S.
Midwest will reduce yields after rain delayed crop development. Comparatively poor supply amid
rain in many areas also pushed up soyabean prices in the domestic market. Guar counter surged
last week owing to the good demand from overseas. Recent weakness in Rupee opens an
opportunity for the foreign buyers to buy the guar gum at cheap rates. In spices, mostly steady to
weak sentiment was witnessed in chili. Lean season supply pushed up jeera prices in both spot
and futures market. With good export inquiries cardamom saw some recovery in the prices.
However, adequate stocks in the physical market capped the upside. Steady sentiments were
recorded in key sugar spot markets. Weak rupee scenario gave exporters an opportunity to send
sugar abroad keeping in view increasing the international sugar prices.
WEEKLY COMMENTARY
WEEKLY STOCK POSITIONS IN WAREHOUSE (NCDEX)
COMMODITY UNIT 13.08.13 21.08.13 DIFFERENCEQTY.
BARLEY MT 25456 24564 -892
CASTOR SEED MT 120168 117478 -2690
CHANA MT 136495 126032 -10463
CHILLI MT 7695 6612 -1083
COTTONSEED OILCAKE MT 48164 42785 -5379
JEERA MT 5365 4796 -569
MAIZE MT 8936 8928 -8
RAPE MUSTARD SEED MT 67018 57755 -9263
SOYA BEAN SEEDS MT 41 41 0
SUGAR M MT 6904 6824 -80
WHEAT MT 15897 15397 -500
COMMODITY UNIT 14.08.13 22.08.13 DIFFERENCE
QTY. QTY.
CARDAMOM MT 52.50 57.80 5.30
COTTON BALES 87500.00 0.00 -87500.00
GOLD KGS 309.00 290.00 -19.00
GOLD MINI KGS 29.20 29.20 0.00
GOLD GUINEA KGS 6.19 6.22 0.02
MENTHA OIL KGS 2277708.25 2523084.35 245376.10
MILD STEEL MT 1045.70 1045.70 0.00
SILVER (30 KG Bar) KGS 25358.22 19208.74 -6149.48
•Scrap gold supply in India could race to at least 300
tonnes topping flows seen in the recent years.
•China's July production of refined copper fell by
5.93% from the previous month to a 5 month low.
•US existing home sales jumped to three year high of
6.5% to an annual rate of 5.39 million units.
•Flash HSBC Purchasing Managers' Index rose to 50.1
from July's final reading of 47.7 in China.
•China will overtake the United States as the world's
biggest crude oil importer by 2017 as Chinese
motorists drive domestic oil demand higher.
•The International Sugar Organization (ISO) expects
the global sugar surplus to fall to 4.5 million tonnes in
2013/2014 from 10.3 million tonnes in 2012/2013.
•India monsoon rains 26% above average in the week to
August 21, 2013.
•Special Margin of 5% on the Short Side in Chana has
been withdrawn with effect from August 23, 2013.
•Indonesia has cut its export tax for crude palm oil to
9% for September down from 10.5% in August, 2013.
WEEKLY STOCK POSITIONS IN WAREHOUSE (MCX)
12
®
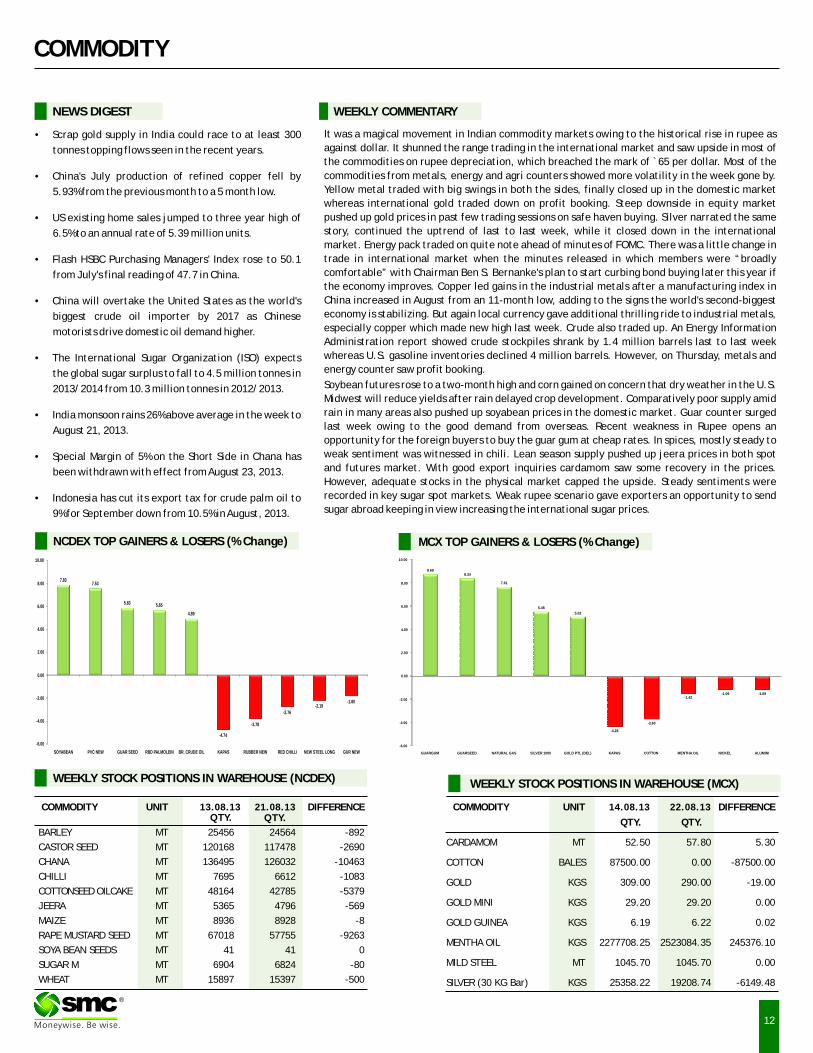
NCDEX TOP GAINERS & LOSERS (% Change) MCX TOP GAINERS & LOSERS (% Change)
QTY.
7.837.53
5.83 5.65
4.89
-4.74
-3.78
-2.76
-2.19-1.80
-6.00
-4.00
-2.00
0.00
2.00
4.00
6.00
8.00
10.00
SOYABEAN PVC NEW GUAR SEED RBD PALMOLEIN BR. CRUDE OIL KAPAS RUBBER NEW RED CHILLI NEW STEEL LONG GUR NEW
8.698.34
7.61
5.48
5.02
-4.28
-3.60
-1.42-1.09 -1.09
-6.00
-4.00
-2.00
0.00
2.00
4.00
6.00
8.00
10.00
GUARGUM GUARSEED NATURAL GAS SILVER 1000 GOLD PTL (DEL) KAPAS COTTON MENTHA OIL NICKEL ALUMINI

The Indian Rupee…………Becomes Senior Citizen
13
SPOT PRICES (% change)
COMMODITY
WEEKLY STOCK POSITIONS IN LME (IN TONNES)
COMMODITY STOCK POSITION STOCK POSITION DIFFERENCE
15.08.13 22.08.13
ALUMINIUM 5452125 5440275 -11850
COPPER 588450 566925 -21525
NICKEL 205812 209346 3534
LEAD 195025 189600 -5425
ZINC 1042525 1028625 -13900
INTERNATIONAL COMMODITY PRICES
COMMODITY EXCHANGE CONTRACT UNIT 15.08.13 22.08.13 CHANGE(%)
Soya CBOT NOV Cent per Bushel 1265.50 1286.75 1.68
Maize CBOT SEPT Cent per Bushel 481.50 487.50 1.25
CPO BMD NOV MYR per MT 2299.00 2356.00 2.48
Sugar LIFFE OCT 10 cents per MT 504.50 482.20 -4.42
COMMODITY EXCHANGE CONTRACT 15.08.13 22.08.13 CHANGE%
ALUMINIUM LME 3 MONTHS 1908.00 1884.00 -1.26
COPPER LME 3 MONTHS 7309.00 7320.00 0.15
LEAD LME 3 MONTHS 2207.00 2209.00 0.09
NICKEL LME 3 MONTHS 14725.00 14430.00 -2.00
ZINC LME 3 MONTHS 1960.00 1974.00 0.71
GOLD COMEX DEC 1360.90 1370.80 0.73
SILVER COMEX SEPT 22.94 23.04 0.44
LIGHT CRUDE OIL NYMEX OCT 106.09 104.33 -1.66
NATURAL GAS NYMEX SEPT 3.42 3.55 3.69
PRICES OF METALS IN LME/ COMEX/ NYMEX (in US $)
Moving from bad to worse the Indian rupee, which was at par with the American currency at the time of independence in 1947, hit a historic record low of below 65.00 against a dollar on Thursday on sluggish local stocks and continued dollar demand from importers. This means the Indian currency has depreciated by more than 65 times against the greenback in the past 66 years.
The currency has witnessed a large volatility in the past two years. This volatility became severe in the past three months affecting major macro-economic data, including growth, inflation, trade and investment.
Managing volatility in the currency markets has become a big challenge for the economic policy makers in the country. Despite of a series of measures taken by the central bank as well as the government to curb the volatility in the markets, the rupee continues to depreciate. And the trend is unlikely to reverse any time soon. This rupee depreciation is badly hurting Indian economy. It is fuelling inflation and has hurt economic growth.
Journey since Independence
The Indian currency has witnessed a slippery journey since independence. Many geopolitical and economic developments have affected its movement in the last 66 years.
• When India got freedom on Aug 15, 1947, the value of Indian rupee was at par with the American dollar. There were no foreign borrowings on India's balance sheet.
• But to finance welfare and development activities, especially with the introduction of the Five-Year Plan in 1951, the government started external borrowings. This required the devaluation of the rupee.
• After independence, India had chosen to adopt a fixed rate currency regime. The rupee was pegged at 4.79 against a dollar between 1948 and 1966.
• Two consecutive wars, one with China in 1962 and another one with Pakistan in 1965, resulted in a huge deficit on India's budget, forcing the government to devalue the currency to 7.57 against the dollar.
• The rupee's link with the British currency was broken in 1971 and it was linked directly to the US dollar.
• In 1975, value of the Indian rupee was pegged at 8.39 against a dollar.
• In 1985 it was further devalued to 12 against a dollar.
• In 1991, India faced a serious balance of payment crisis and was forced to sharply devalue its currency. The country was in the grip of high inflation, low growth and the foreign reserves were not even worth to meet three weeks of imports. Under these situations, the currency was devalued to 17.90 against a dollar.
• Year 1993 was very important in Indian currency history. This year currency was let free to flow with the market sentiments. The exchange rate was freed to be determined by the market, with provisions of intervention by the central bank under the situation of extreme volatility. In 1993, the currency was devalued to 31.37 against a dollar.
• The rupee traded in the range of 40-50 between 2000-2010. It was mostly at around 45 against a dollar. It touched a high of 39 in 2007.
• The Indian currency has gradually depreciated since the global 2008 economic crisis.
• Liberalizing the currency regime led to a sharp jump in foreign investment inflows and boosted the economic growth.
®
- 5.15
-2.09
-0.55
-0.08
-0.02
0.00
0.00
0.17
0.29
0.54
1.24
2.15
2.42
2.84
2.86
3.45
4.97
6.54
6.82
9.34
11.73
-6.00 -4.00 -2.00 0.00 2.00 4.00 6.00 8.00 10.00 12.00 14.00
RUBBER (KOCHI)
RAW JUTE (KOLKATA)
GUR (MUZAFFARNGR.)
CHILLI (GUNTUR)
TURMERIC (NIZAMABAD)
MILD STEEL INGOTS (GHAZIABAD)
WHEAT (DELHI)
CARDAMOM (VANDANMEDU)
BARLEY (JAIPUR)
JEERA (UNJHA)
PEPPER MALABAR GAR (KOCHI)
CORIANDER (KOTA)
SOYABEAN (INDORE)
REFINED SOYA OIL (INDORE)
MUSTARD (JAIPUR)
MASOOR (INDORE)
MENTHA OIL (CHANDAUSI)
GOLD KG (MUMBAI)
CRUDE PALM OIL (KANDLA)
CHANA (DELHI)
SILVER (DELHI)

CURRENCY
Currency Table
Currency Pair Open High Low Close
USD/INR 62.54 65.58 62.32 64.78
EUR/INR 82.71 87.51 82.71 86.10
GBP/INR 97.77 102.33 97.25 100.62
JPY/INR 63.62 66.73 63.62 65.66
(Source: FX Central, Open: Monday 9.00 AM IST, Close: Thursday (5.00 PM IST)
News Flows of last week
21st Aug: Applications for U.S. home loans fell for a second straight week
21st Aug: U.S. home re-sales jumped in July to their highest level in over three years,
21st Aug: Few clues on timing of QE3 reduction in Fed minutes
22nd Aug: U.S. manufacturing activity hit a five-month high in August
22nd Aug: U.S. leading economic indicators rose more than forecast
22nd Aug: U.S. Fed balance sheet shrank in latest week
22nd Aug: The number of Americans filing new claims for jobless benefits last week held near a six-year low
EUR/INR (AUGUST) contract closed at 86.10 on 22nd August'13. The contract made its high of `87.51 on 22nd August'13 and a low of `82.71 on 19th August'13 (Weekly Basis). The 14-day Exponential Moving Average of the EUR/INR is currently at ̀ 83.60.
On the daily chart, EUR/INR has Relative Strength Index (14-day) value of 81.946. One can buy around 84.90 for a target of 86.00 with the stop loss of 84.30.
`
JPY/INR (AUGUST) contract closed at 65.66 on 22nd August'13. The contract made its high of `66.73 on 22ndAugust'13 and a low of `63.62 on 19thAugust'13 (Weekly Basis). The 14-day Exponential Moving Average of the JPY/INR is currently at ̀ 64.00.
On the daily chart, JPY/INR has Relative Strength Index (14-day) value of 65.87. One can buy around 64.20 for a target of 65.40 with the stop loss of ̀ 63.60.
`
Market Stance
In the week gone by, the Indian rupee extended falls to a new low of 65.50 to the
dollar as heavy demand from importers along with weak domestic equities
continued to weigh on sentiment. Weakness was also seen after Federal Reserve
minutes hinted that the United States was on course to begin tapering stimulus
as early as next month. Moreover, continuing its slide, the rupee also made all
time low against British pound and breached the 102-mark on local bourses. With
this, British pound has become the first major foreign currency to cross 100
levels against rupee. However, steps taken by the Reserve Bank and the
government to curb volatility in the exchange rate have had little effect so far.
The government is now exploring structural measures to narrow the current
account deficit, Finance Minister P Chidambaram said, adding, there is no plan
to introduce capital controls.
EUR/INR
USD/INR (AUGUST) contract closed at 64.78 on 22nd August'13. The contract made its high of `65.58 on 22nd August'13 and a low of `62.32 on 19thAugust'13 (Weekly Basis). The 14-day Exponential Moving Average of the USD/INR is currently at ̀ 62.75.
On the daily chart, the USD/INR has Relative Strength Index (14-day) value of 81.00. One can buy around 63.50 for a target of 64.75 with the stop loss of 62.90.
`
GBP/INR (AUGUST) contract closed at 100.62 on 22nd August'13. The contract made its high of ̀ 102.33 on 22nd August'13 and a low of ̀ 97.25 on 19th August'13 (Weekly Basis). The 14-day Exponential Moving Average of the GBP/INR is currently at ̀ 97.43
On the daily chart, GBP/INR has Relative Strength Index (14-day) value of 80.40. One can buy around 99.50 for a target of ̀ 100.50 with the stop loss of ̀ 98.90.
`
USD/INRTechnical Recommendation
GBP/INR JPY/INR
14
®
Economic gauge for the next week
Date Currency Event PREVIOUS
26th Aug: USD Durable Goods Orders 4.20%
27th Aug: USD Consumer Confidence 80.3
28th Aug: USD Pending Home Sales (YoY) 10.90%
29th Aug: EUR Unemployment Change -7K
29th Aug: EUR Unemployment Rate s.a. 6.80%
29th Aug: EUR Consumer Price Index (MoM) 0.50%
29th Aug: EUR Consumer Price Index (YoY) 1.90%
29th Aug: EUR Harmonised Index of Consumer Prices (YoY) 1.90%
29th Aug: USD Gross Domestic Product Annualized 1.10%
29th Aug: USD Initial Jobless Claims 336K
29th Aug: USD Personal Consumption Expenditures Prices (QoQ) 1.10%
30th Aug: USD Core Personal Consumption Expenditure - Price Index (YoY) 1.20%
30th Aug: USD Personal Income (MoM) 0.30%
30th Aug: USD Personal Spending 0.50%

IPOIPO
INDIAN IPO NEWS
Government looking at allowing unlisted companies to launch IPOs overseasFaced with the sliding rupee, the government is considering allowing unlisted companies to launch public offers in overseas markets and raise funds in
foreign currency. Under the current norms, only those companies that are listed on the domestic stock exchanges are permitted to list on bourses overseas.
The move is expected to help the companies meet their foreign exchange requirements and at the same time ease pressure on the domestic currency, which
has been touching new lows over the past couple of months. The proposal will also help companies gain access to other markets at a time when the domestic
stock market is witnessing massive sell-offs.
Six SMEs launch IPOs despite weak market trendsDespite sluggish market conditions, as many as six small and medium sized companies have launched their initial public offers (IPOs) worth ̀ 70 crore, on the
BSE's SME platform in the past one month. However, big companies continue to find it difficult to raise capital via IPOs and the last IPO by a major company
was that of Just Dial in May, through which the internet firm mopped-up about ̀ 900 crore. These IPOs, in the range of ̀ 2 crore to ̀ 28 crore, were launched
on the BSE SME (small and medium enterprises) platform. Moreover, a host of other companies have filed their draft documents and planning to launch their
offerings in the coming weeks.
NHPC to buy back shares worth ̀ 1,600 croreThe government had earlier planned to disinvest 11.36 per cent stake in NHPC through OFS in the domestic market, which is in the doldrums. Government
currently holds 86.36 per cent stake in NHPC. The company will have to seek approval from its Board for the share buy back, after which the Power Ministry
will approach the Cabinet for the final nod. NHPC got listed on bourses in 2009 after the government divested 5 per cent stake, while company issued 10 per
cent fresh equity. The government plans to raise ̀ 40,000 crore in the current financial year (2013-14) through disinvestment.
Government shelves BHEL divestment on valuation, order book concernsThe disinvestment department has shelved plans to sell a stake in power equipment maker Bharat Heavy Electricals Ltd (BHEL), citing valuation concerns
and a depleting order book. The plan to offload the government's 5 % stake in BHEL through a follow-on public offer was approved by the Cabinet in August
2011. The government holds a 67.72 % stake in the Navratna Company. The government plans to garner ̀ 40,000 crore through disinvestment in the current
fiscal.However, market conditions led to a delay in the issue and the company in April 2012 withdrew the draft prospectus filed with market regulator Sebi.
®
Just Dial service provider 4665.57 950.11 41430.00 530.00 590.00 667.75 25.99
Repco Home Fin Finance 1465.42 270.39 41365.00 172.00 165.00 235.75 37.06
V-Mart Retail Trading 306.40 123.00 41325.00 210.00 216.00 170.60 -18.76
Bharti Infra. Telecom 26434.18 4533.60 41271.00 220.00 200.00 139.95 -36.39
PC Jeweller Jewellary 1399.67 609.30 41270.00 135.00 135.50 78.15 -42.11
CARE Rating Agency 1583.53 540.00 41269.00 750.00 949.00 554.65 -26.05
Tara Jewels Jewellary 214.46 179.50 41249.00 230.00 242.00 87.25 -62.07
VKS Projects Engineering 276.57 55.00 41108.00 55.00 55.80 4.39 -92.02
Speciality Restaruants Restaurants 596.39 181.96 41059.00 150.00 153.00 127.00 -15.33
T B Z Jewellary 931.80 210.00 41038.00 120.00 115.00 139.70 16.42
MT Educare Miscellaneous 371.15 99.00 41011.00 80.00 86.05 93.30 16.63
NBCC Construction 1381.20 124.97 41011.00 106.00 100.00 115.10 8.58
Olympic card. Media 82.04 24.75 40996.00 30.00 29.95 50.30 67.67
Multi Comm. Exc. Exchange 1419.84 663.31 40977.00 1032.00 1387.00 278.40 -73.02
Indo Thai Sec. Finance 9.27 29.60 40849.00 74.00 75.00 9.27 -87.47
Vaswani Inds. Steel 10.40 49.00 40840.00 49.00 33.45 3.81 -92.22
M and B Switch. Capital Goods 315.00 93.00 40836.00 186.00 180.00 15.75 -91.53
Flexituff Intl. Packaging 487.06 104.63 40835.00 155.00 155.00 211.95 36.74
Prakash Constro. Construction 11.82 60.00 40820.00 138.00 145.00 0.94 -99.32
PG Electro. Cons. Durables 138.91 120.65 40812.00 210.00 200.00 84.65 -59.69
Company Sector M.Cap(In Cr.) Issue Size(in Cr.) List Date Issue Price List Price Last Price %Gain/Loss(from Issue price)
*
IPO TRACKER
*Closing prices as on 22-08-2013
15

16
®
MUTUAL FUND
NEWS
HSBC MF introduces Fixed Term Series 95
HSBC Mutual Fund has launched the New Fund Offer (NFO) of HSBC Fixed Term Series 95, a Close Ended income scheme. The NFO opens for subscription on August
23, 2013, and closes on Aug 26, 2013. The investment objective of the scheme is to seek generation of returns by investing in a portfolio of fixed income
instruments which mature on or before the maturity date of the Plan(s).
Pramerica MF introduces Fixed Duration Fund- Series 10
Pramerica Mutual Fund has launched the New Fund Offer (NFO) of Pramerica Fixed Duration Fund - Series 10, a Close Ended income scheme. The NFO opens for
subscription on August 23, 2013, and closes on Aug 28, 2013. The investment objective of the scheme is to generate returns by investing in a portfolio constituted
of money market and debt instruments which mature on or before the date of the maturity of each series of the Scheme. However, there is no assurance that the
investment objective shall be realized.
LIC Nomura MF introduces Fixed Maturity Plan Series 69
LIC Nomura Mutual Fund has launched the New Fund Offer (NFO) of LIC Nomura MF Fixed Maturity Plan Series 69, a Close Ended income scheme. The NFO opens
for subscription on August 22, 2013, and closes on August 27, 2013. The investment objective of the scheme is to minimize interest rate risk by investing in a
portfolio of fixed income securities which mature on or before the date of the maturity of the scheme.
IDFC MF introduces Fixed Term Plan Series –28
IDFC Mutual Fund has launched the New Fund Offer (NFO) of IDFC Fixed Term Plan Series –28, a Close Ended income scheme. The NFO opens for subscription on
Aug 22, 2013, and closes on Aug 29, 2013. The investment objective of the scheme is to generate income by investing in a portfolio of debt and money market
instruments maturing on or before the maturity of each Plan(s) under the scheme. There is no assurance or guarantee that the objectives of the scheme will be
realized.
Birla Sun Life MF introduces Fixed Term Plan- Series HO (91 days)
Birla Sun Life Mutual Fund has launched the New Fund Offer (NFO) of Birla Sun Life Fixed Term Plan - Series HO (91 days), a Close Ended income scheme. The NFO
opens for subscription on Aug 23, 2013, and closes on Aug 29, 2013. The investment objective of the scheme is to generate income by investing in a portfolio of
fixed income securities maturing on or before the duration of the scheme.
HDFC MF introduces FMP 1875D August 2013 (1)
HDFC Mutual Fund has launched the New Fund Offer (NFO) of HDFC FMP 1875D August 2013 (1), a Close Ended income scheme. The NFO opens for subscription on
August 23, 2013, and closes on Sep 3, 2013. The investment objective of the scheme is to generate income through investments in Debt / Money Market
Instruments and Government Securities maturing on or before the maturity date of the respective Plan(s).
Religare Invesco MF declares dividend under Arbitrage Fund
Religare Invesco Mutual Fund has declared dividend under the dividend option and direct plan-dividend option under Religare Invesco Arbitrage Fund, an open
ended equity scheme. The record date for dividend is August 26, 2013. The quantum of dividend will be Rs 0.10 per unit under each option on the face value of Rs
10 per unit. The investment objective of the scheme is to gnerate income through arbitrage opportunities emerging out of mis-pricing between the cash market
& the derivatives market & through deployment of surplus cash in fixed income instruments
IDFC MF declares dividend under Capital Protection Oriented Fund-Series III
IDFC Mutual Fund has declared dividend under the dividend option of IDFC Capital Protection Oriented Fund-Series III. The record date for dividend is August 26,
2013. The quantum of dividend will be entire distributable surplus as on record date i.e. August 26, 2013 on the face value of `10 per unit. The investment
objective of the scheme is to protect the capital by investing in high quality fixed income securities as the primary objective and generate capital appreciation
by investing in equity and equity related instruments as a secondary objective. However, there can be no assurance that the investment objective of the scheme
will be realized.
Birla Sun Life MF declares dividend under Fixed
Birla Sun Life Mutual Fund has declared dividend under dividend option of Birla Sun Life Fixed Term Plan -Series EL. The record date for dividend is August 27,
2013. The rate of dividend will be ̀ 0.1000 per unit on the face value of Rs 10 per unit. The investment objective of the scheme is to generate income by investing
in a portfolio of fixed income securities maturing on or before the duration of the scheme.
17
®
NFOs WATCH
Fund Name NFO NFO Scheme Objective Fund Type Fund Class Fund Manager MinimumOpens on Closes on Amount
12-Aug-2013 26-Aug-2013 Close-Ended Growth `5000/-ICICI Prudential Capital Protection Oriented-Sr IV Plan B (36M)-
Rajat Chandak / Rahul Goswami /Atul Patel
To seek to protect capital by investing a portion of the portfolio in highest rated debt securities and money market instruments and also to provide capital appreciation by investing the balance in equity and equity related securities. The debt securities would mature on or before the maturity of the Scheme.

18
MUTUAL FUND Performance Charts
Returns (%) Risk Market Cap (%)
Scheme Name NAV Launch AUM 3M 6M 1Y 3Y Since Std.Dev Beta Jenson LARGE MID SMALL DEBT &
(`) Date (` Cr.) Launch CAP CAP CAP OTHER
ICICI Prudential Service Industries Fund - G 21.45 30-Nov-2005 140.95 10.06 10.85 28.52 6.51 10.37 1.67 0.60 0.35 61.58 28.64 2.05 7.73
Axis Equity Fund - Growth 11.76 05-Jan-2010 547.42 -9.26 -3.21 7.89 1.43 4.57 1.72 0.83 0.13 75.91 8.51 4.75 10.83
BNP Paribas Equity Fund - Growth 37.73 23-Sep-2004 119.26 -5.63 -3.58 7.89 4.37 16.06 1.55 0.71 0.09 79.41 13.28 NA 7.30
Tata Ethical Fund - Plan A - Growth 72.11 24-May-1996 103.22 -2.42 -1.34 7.42 2.58 15.93 1.27 0.49 0.14 69.37 18.91 NA 11.73
Birla Sun Life India GenNext Fund - G 28.58 05-Aug-2005 150.15 -12.49 -6.78 6.64 4.49 13.93 1.83 0.77 0.12 49.98 38.65 5.05 6.32
Franklin India High Growth Companies Fund - G 13.04 26-Jul-2007 523.62 -9.27 -8.59 5.27 -0.67 4.46 1.73 0.69 0.06 47.66 36.54 4.60 11.20
ICICI Prudential Dynamic Plan - Growth 110.64 31-Oct-2002 3571.82 -3.01 -3.84 4.44 2.41 24.89 1.55 0.64 -0.01 58.85 17.90 3.98 19.28
EQUITY (Diversified)
BALANCED
INCOME FUND
Note: Indicative corpus are including Growth & Dividend option. The above mentioned data is on the basis of 22/08/2013Beta, Sharpe and Standard Deviation are calculated on the basis of period: 1 year, frequency: Weekly Friday, RF: 7%
ULTRA SHORT TERM
SHORT TERM FUND
Due to their inherent long term nature, the following 3 categories have been sorted on the basis of 1 year returns
Due to their inherent short term nature, the following 2 categories have been sorted on the basis of 6month returns
Returns (%) Risk Market Cap (%)
Scheme Name NAV Launch AUM 3M 6M 1Y 3Y Since Std.Dev Jenson LARGE MID SMALL DEBT &
(`) Date (` Cr.) Launch CAP CAP CAP OTHER
SBI Magnum Balanced Fund - Growth 53.48 09-Oct-1995 398.82 -8.19 -5.30 7.14 1.08 15.04 1.24 0.62 0.08 30.97 30.52 9.1729.34
ICICI Prudential Balanced - Growth 52.64 03-Nov-1999 501.94 -7.14 -5.07 5.64 6.10 12.78 1.24 0.67 0.03 45.83 18.08 1.9434.15
FT India Balanced Fund - Growth 51.01 10-Dec-1999 206.99 -9.27 -6.31 1.77 1.85 12.62 1.32 0.74 -0.02 52.87 14.21 0.2432.68
Birla Sun Life 95 - Growth 318.15 10-Feb-1995 585.45 -9.45 -7.30 1.06 0.65 20.51 1.44 0.82 NA 51.60 13.60 0.7334.07
UTI Balanced Fund - Growth 79.86 20-Jan-1995 913.59 -8.60 -7.02 0.59 -0.24 15.43 1.30 0.73 -0.02 53.88 16.78 1.5327.81
Tata Balanced Fund - Plan A - Growth 90.44 08-Oct-1995 545.88 -9.22 -6.07 0.29 3.13 15.08 1.44 0.79 0.02 55.14 17.54 0.5626.76
Returns (%) RiskAverage Yield till
Scheme Name NAV Launch AUM Since Std. SharpeMaturity (Days) Maturity
1W 2W 1M 6M 1Y 3Y(`) Date (`Cr.) Launch Dev.
Tata Dynamic Bond Fund - Plan A - G 18.06 03-Sep-2003 323.68 158.54 55.08 22.25 8.75 11.41 8.28 6.10 0.49 NA 1664.00 9.89
Morgan Stanley Active Bond Fund - Reg - G 12.55 03-Jun-2009 411.42 8.23 -13.93 -3.54 7.62 11.31 7.33 5.52 0.49 0.11 1051.00 7.95
BNP Paribas Flexi Debt Fund - Growth 20.28 23-Sep-2004 611.40 113.92 26.73 19.89 6.86 10.09 7.89 8.25 0.50 0.03 1705.00 9.64
IDFC SSIF - Invt. Plan - Plan F - Growth 13.01 16-Jul-2010 2480.44 80.18 -7.10 -0.66 4.77 9.99 9.29 8.83 0.53 0.03 2789.00 9.48
IDFC SSIF - Invt Plan - Reg - Growth 28.89 14-Jul-2000 2480.44 80.18 -7.09 -0.66 4.57 9.80 8.72 8.43 0.53 0.02 2789.00 9.48
IDFC D B F- Plan A - Growth 24.10 25-Jun-2002 6885.78 80.46 -6.81 -1.05 4.32 9.58 9.69 8.19 0.53 0.02 2789.00 9.50
Templeton India IBA - Growth 40.70 23-Jun-1997 1372.28 78.50 -8.96 -3.68 6.93 9.37 9.61 9.07 0.57 0.02 2610.00 10.05
Annualised
Returns (%) Risk Average Yield tillScheme Name NAV Launch AUM Since Std. Sharpe Maturity (Days) Maturity
1W 2W 1M 6M 1Y 3Y(`) Date (`Cr.) Launch Dev.
Birla Sun Life Short Term Opportunities Fund - Reg - G 19.14 24-Apr-2003 675.56 -5.55 -11.16 -4.06 7.81 8.80 9.40 6.48 0.23 0.25 N.A 11.29
Birla Sun Life Medium Term Plan - Reg - G 14.12 25-Mar-2009 825.96 -7.35 -15.07 -6.82 7.54 8.37 9.34 8.13 0.25 0.19 N.A 12.50
JPMorgan India Short Term Income Fund - G 13.12 25-Mar-2010 1282.78 21.70 12.26 3.68 6.40 8.15 8.69 8.28 0.13 0.17 825.00 10.62
Morgan Stanley Short Term Bond Fund - Reg - G 13.51 26-May-2009 431.16 -0.64 -8.10 -3.04 6.18 7.69 8.38 7.43 0.20 0.11 361.00 9.21
Tata Short Term Bond Fund - Plan A - G 22.09 08-Aug-2002 270.97 15.85 0.63 -0.59 6.15 7.93 8.20 7.44 0.19 0.09 489.00 10.50
Canara Robeco Short Term Fund - Reg - G 13.69 31-Mar-2009 444.78 9.62 -1.49 0.77 5.84 7.37 8.20 7.40 0.17 0.06 369.00 10.63
DWS Short Maturity Fund - Reg - G 21.37 21-Jan-2003 1331.26 17.79 -1.23 -0.40 5.62 7.57 8.03 7.44 0.19 0.06 584.00 10.56
Annualised
Returns (%) Risk Average Yield tillScheme Name NAV Launch AUM Since Std. Sharpe Maturity (Days) Maturity
1W 2W 1M 6M 1Y 3Y(`) Date (`Cr.) Launch Dev.
Union KBC Ultra Short Term Debt Fund - G 1122.09 24-Apr-2012 209.08 14.44 11.72 9.01 8.64 8.70 N.A 9.06 0.05 0.64 63.00 N.A
Templeton India Ultra Short Bond Fund - Retail - G 15.43 18-Dec-2007 4477.75 9.15 7.27 6.43 8.36 8.56 8.81 7.94 0.05 0.53 66.00 11.71
UTI Treasury Advantage Fund - Reg - G 3047.19 12-Jul-1999 9965.58 9.49 8.36 7.43 8.20 8.36 8.54 8.21 0.05 0.54 57.00 N.A
Templeton India Low Duration Fund - G 13.08 26-Jul-2010 2367.30 7.79 5.03 4.17 8.19 8.68 9.21 9.13 0.08 0.40 110.00 11.69
Principal Debt Opportunities Fund - Conservative - G 1918.42 14-Sep-2004 313.06 8.57 6.90 6.40 8.09 8.52 8.89 7.56 0.05 0.57 87.00 11.56
Birla Sun Life Ultra Short Term Fund - Ret - G 217.77 19-Apr-2002 838.18 8.30 8.45 6.88 7.90 8.31 8.68 7.10 0.07 0.38 N.A 11.37
Tata Floater Fund - Plan A - Growth 1808.74 06-Sep-2005 3599.26 8.39 7.27 6.34 7.87 8.40 8.85 7.72 0.06 0.45 90.00 10.96
Annualised
®

Mr Anurag Bansal (Director, SMC Group) during 'India's Top Banks and Banking Awards 2013'
organised by Dun & Bradstreet at Mumbai
SMC participating in the 16th JRD Tata Memorial Lecture organised by ASSOCHAM at New Delhi


![ResearchReports … · 2019. 11. 12. · ResearchReports InterculturalProfilesandAdaptationAmongImmigrantandAutochthonous Adolescents CristianoInguglia*a,PasqualeMussoa [a]DepartmentofPsychological](https://static.fdocuments.net/doc/165x107/60817c6fdf091e14725176e4/researchreports-2019-11-12-researchreports-interculturalprofilesandadaptationamongimmigrantandautochthonous.jpg)