A User Guide to International Student Data International Student Data User Guide December 2008 1 A...
34
AEI International Student Data User Guide December 2008 www.aei.gov.au 1 A User Guide to International Student Data December 2008
Transcript of A User Guide to International Student Data International Student Data User Guide December 2008 1 A...
AEI International Student Data User Guide December 2008 www.aei.gov.au 1
A User Guide to International Student Data December 2008

AEI International Student Data User Guide December 2008 www.aei.gov.au 2
Contact
Australian Education International (AEI) GPO Box 9880 Canberra ACT 2601
AEI enquiry hotline: 1300 363 079 Email: [email protected]
Disclaimer
The Commonwealth of Australia, its officers, employees or agents disclaim any responsibility for any loss howsoever caused whether due to negligence or otherwise from the use of information in this publication. No representation expressed or implied is made by the Commonwealth of Australia or any of its officers, employees or agents as to the currency, accuracy or completeness of the information contained in this report. The reader should rely on their own enquiries to independently confirm the information and comment on which they intend to act.
Copyright
© Commonwealth of Australia 2008
This work is copyright. Apart from any use as permitted under the Copyright Act 1968, no part may be reproduced by any process without prior written permission from the Commonwealth. Requests and inquiries concerning reproduction and rights should be addressed to the Commonwealth Copyright Administration, Attorney General’s Department, Robert Garran Offices, National Circuit, Barton ACT 2600 or posted at www.ag.gov.au/cca.

AEI International Student Data User Guide December 2008 www.aei.gov.au 3
Contents Introduction...................................................................................................................................................... 4
AEI’s role and goals........................................................................................................................... 4 What AEI does .................................................................................................................................. 4
Policy development and advice....................................................................................................... 4 International and government-to-government engagement ................................................................ 4 Quality assurance and consumer protection..................................................................................... 4 Qualifications recognition ............................................................................................................... 4 Market research and analysis ......................................................................................................... 4 Stakeholder engagement ............................................................................................................... 5 Student mobility ............................................................................................................................ 5
About this guide ................................................................................................................................ 5 Prerequisites................................................................................................................................. 5 Guide objectives............................................................................................................................ 5
The AEI Online website ................................................................................................................................... 7
Navigating to the AEI data.................................................................................................................. 7 International student data ................................................................................................................... 9 Other Reports and Statistics ............................................................................................................. 10
Monthly Time Series of Student Enrolments—Summaries by Sector ................................................ 11 Pivot Tables.................................................................................................................................... 12
Downloading AEI pivot tables and using Zip files ............................................................................ 12 Detailed Monthly Tables (PDF and Excel formats) .......................................................................... 14
Other Useful Information on the AEI website ...................................................................................... 15 Research and Market Data Snapshots .......................................................................................... 15 Research papers......................................................................................................................... 15
Using Pivot Tables in Excel .............................................................................................................. 15 Understanding Grouping .............................................................................................................. 15
Structure of a Pivot Table................................................................................................................. 17 Fields ......................................................................................................................................... 17 Page Area .................................................................................................................................. 18 Data Area ................................................................................................................................... 18 Row Area ................................................................................................................................... 18 Column Area............................................................................................................................... 18 Pivot Table Field List ................................................................................................................... 19
Using Fields to summarise data ........................................................................................................ 20 Moving Fields.............................................................................................................................. 20 Stacking Fields............................................................................................................................ 20 Filtering Data .............................................................................................................................. 21 Drill Through ............................................................................................................................... 23 Sorting Items and Data ................................................................................................................ 23
Summarising Data in Pivot Tables..................................................................................................... 24 Creating and using Pivot Charts........................................................................................................ 28 Interpreting Data in Pivot Tables ....................................................................................................... 31 Copying Data from Pivot Tables........................................................................................................ 33

AEI International Student Data User Guide December 2008 www.aei.gov.au 4
Introduction
AEI’s role and goals
Australian Education International (AEI) provides leadership across all levels of government and industry to support the sustainable development of a world-class and globally connected international education and training system in Australia.
As the international arm of the Australian Government’s Department of Education, Employment and Workplace Relations (DEEWR), we are well placed to work with governments and industry to realise for Australia the intellectual, cultural, economic and security benefits of internationalisation.
We seek to achieve this goal through an integrated approach to policy, regulation, international engagement and promotion.
We encourage and facilitate Australian activity through our national office in Canberra and 25 offices in Australian diplomatic missions in 17 economies.
What AEI does
Policy development and advice
With strong links to all education sectors and all levels of government, AEI provides a national focus for debate and policy development.
International and government-to-government engagement AEI represents Australia’s interests in international and multilateral bodies, and in negotiating agreements with governments around the world. We work with state and territory governments to coordinate international education policy and practice.
Quality assurance and consumer protection
Through the Education Services for Overseas Students (ESOS) legislation, AEI helps safeguard the quality and reputation of Australia’s courses and institutions. We administer world’s best practice in student consumer protection.
Qualifications recognition
AEI provides information on how Australian and overseas qualifications compare, and helps overseas qualified people study and work in Australia.
Market research and analysis
AEI produces research and analysis to provide industry with intelligence and advice on education markets around the world.
AEI International Student Data User Guide December 2008 www.aei.gov.au 5
Stakeholder engagement
Through comprehensive stakeholder engagement, its international network and its communication tools, AEI makes sure the world knows about the quality and diversity of Australian education.
Student mobility
AEI supports student and professional mobility into and out of Australia through Endeavour Award scholarships, subsidies and international representation.
About this guide
This guide was developed by AEI’s International Research and Analysis Unit (IRAU).
The purpose of this guide is to assist the Australia international education industry to understand the publicly available International Student Data released by AEI. The guide will also provide information on how to manipulate the data using the Pivot Tables published on the AEI Online website.
The AEI data is published in the AEI Online website in a series of pivot tables (Microsoft Excel files). The data provides an up-to-date time series from 2002 to the current month of onshore enrolments by international students studying in Australia on a student visa. The data is updated monthly and is generally available within six weeks of the end of a reporting month.
Prerequisites
A working knowledge of Microsoft Office Excel is required to use the AEI pivot tables. Excel versions from 2003 provide the greatest range of pivot table options. Pivot tables will work on earlier versions of excel, but not all options will be available. Pivot tables are supported by Apple Macintosh versions of excel, but some of the functionality may be different to the windows version and some options my not be available.
Note: AEI continually develops and improves the Pivot Tables. As a result pivot table content may change without notice.
Guide objectives
Once you have completed this guide you should:
• Be able to find the data on the AEI website
• Understand the source of the data
• Understand how the data are derived
• Be able to extract data from the AEI Pivot Table on the AEI website
• Be aware of the various AEI statistical products.

AEI International Student Data User Guide December 2008 www.aei.gov.au 6
Throughout this manual you will see activities designed to guide you through the course. These are formatted as in the example below:
⇒ Open the AEI website in your browser.
If you are viewing this manual electronically, there are many links embedded into the file you can click on to take you to web pages.
If you are viewing this manual as a hard copy, simply copy the link details into the address bar of your internet browser.
AEI International Student Data User Guide December 2008 www.aei.gov.au 7
The AEI Online website
Before you start using the AEI data, familiarise yourself with the AEI Online website:
www.aei.gov.au
⇒ Click the link above to open the AEI Online website in your browser.
This website is AEI’s portal for disseminating market intelligence on international student activity, and includes the range of AEI statistical material. As well as pivot tables, the website includes many reports, newsletters, explanatory notes and snapshots of AEI data.
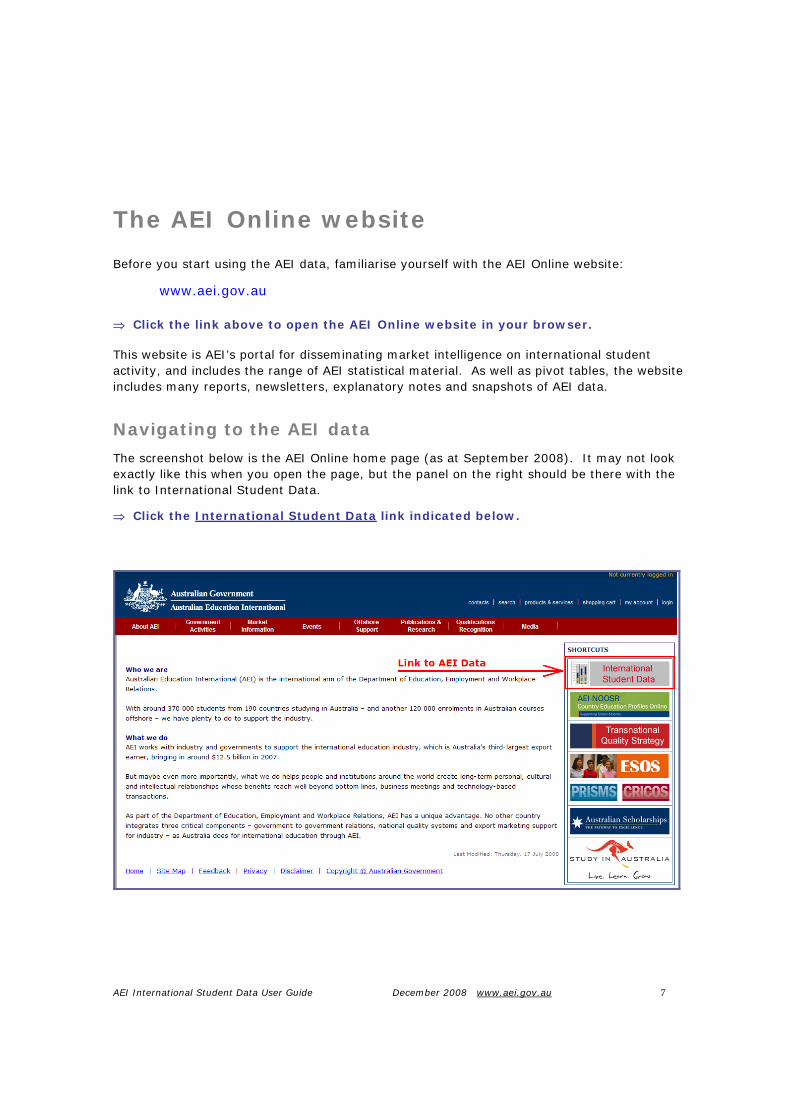
Navigating to the AEI data
The screenshot below is the AEI Online home page (as at September 2008). It may not look exactly like this when you open the page, but the panel on the right should be there with the link to International Student Data.
⇒ Click the International Student Data link indicated below.
AEI International Student Data User Guide December 2008 www.aei.gov.au 8
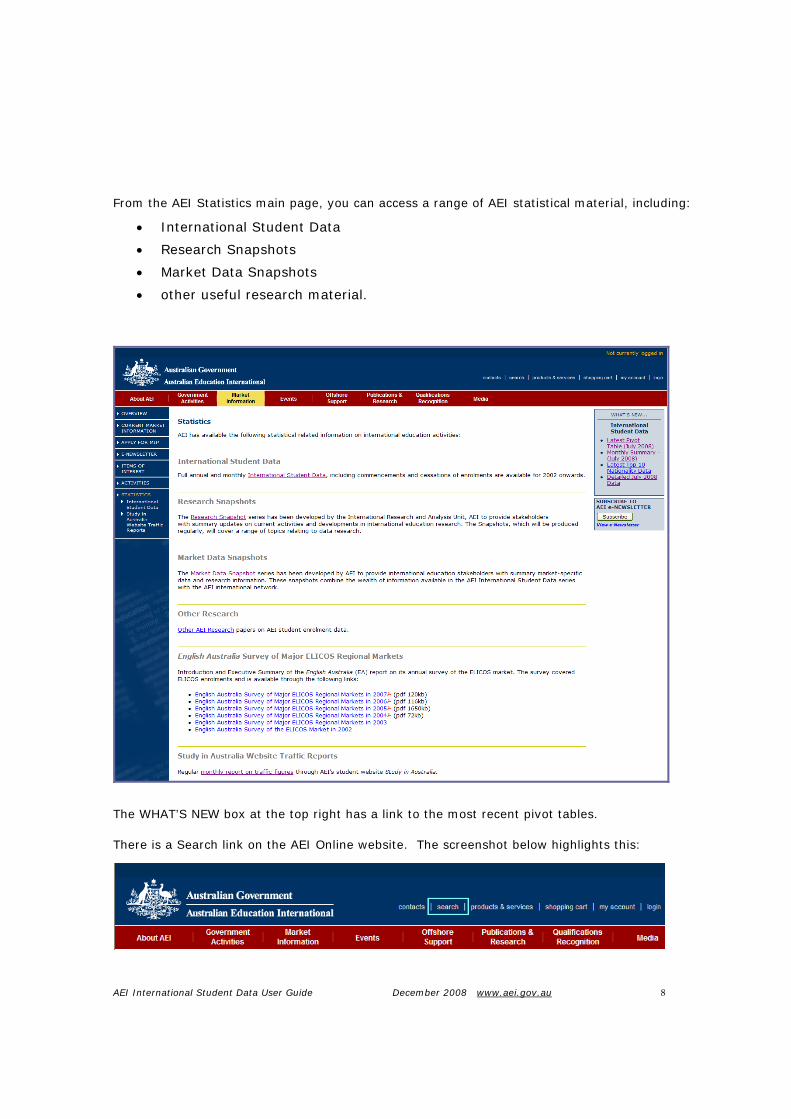
From the AEI Statistics main page, you can access a range of AEI statistical material, including:
• International Student Data
• Research Snapshots
• Market Data Snapshots
• other useful research material.
The WHAT’S NEW box at the top right has a link to the most recent pivot tables.
There is a Search link on the AEI Online website. The screenshot below highlights this:

AEI International Student Data User Guide December 2008 www.aei.gov.au 9
International student data
The International Student Data page includes:
Monthly Summaries of International Student Enrolment Data
• These summaries are published monthly and provide a commentary on the latest AEI data and trends.
• They are available as PDF files (requires Acrobat Reader), or as RTF files (requires Microsoft Word or similar).
• Reports are available for elapsed months of the current year and for months of previous years by clicking the year links.

AEI International Student Data User Guide December 2008 www.aei.gov.au 10
Other Reports and Statistics
• These links lead to the monthly pivot tables for the current year and for previous years. Data for previous years can be accessed by clicking on the year of interest.
• They also provide a suite of detailed data from 2002 onwards, by a range of variables including Nationality, State, Sector and Month.
• The Explanatory Notes clarify common data related terms such as enrolments, commencements, nationality, sector, provider type, level and field of study, counting methodology, and describe AEI data sources.
⇒ Click the link under International Student Data to the current year.

AEI International Student Data User Guide December 2008 www.aei.gov.au 11
Monthly Time Series of Student Enrolments—Summaries by Sector
• These tables give a month by month analysis of international student enrolments and commencements by sector, and for all sectors combined. You can either:
o Click on the charts individually to view them in a new browser window, or
o Click the tables 1 to 6 link highlighted in the red box above. This opens a freely available PDF file containing data and charts of AEI data up to the current reference month.

AEI International Student Data User Guide December 2008 www.aei.gov.au 12
Pivot Tables
The Basic Pivot Table
• is available for free to all users of the internet
• contains a limited number of variables, but provides sufficient information to understand the major trends in Australia’s international education enrolments and commencements since 2002.
The Standard Pivot Table and Detailed Pivot Table
• contain additional variables as detailed in the boxes to the right of the links
• Access to these files is restricted to subscribers to the Market Information Package (MIP).
Downloading AEI pivot tables and using Zip files
Notes: This part of the manual applies to computers using windows operating systems only. WinZip must be installed on the destination computer.
The excel files available on the AEI website are converted into zip files.

AEI International Student Data User Guide December 2008 www.aei.gov.au 13
A zip file is contains all the information in a normal file, but is a fraction of the size of the normal file. This minimises the space the file takes up on the AEI server and reduces the volume of data that is downloaded.
When you download a pivot table file off the AEI website, the file needs to be “unzipped” or uncompressed before it can be used. WinZip is the program used to do this.
To download, unzip and use AEI pivot tables:
• Navigate to the AEI website page with the pivot tables
• Click the pivot table for downloading. In this example it’s the Basic Pivot Table
The dialogue box below opens:

AEI International Student Data User Guide December 2008 www.aei.gov.au 14
Click Open. This will activate WinZip:
The pivot table file can be seen in the WinZip window.
To unzip and open the pivot table file, just double click the file name. The file will automatically unzip and open.
Detailed Monthly Tables (PDF and Excel formats)
⇒ Click the link to the most recently available Tables 7 to 12.

AEI International Student Data User Guide December 2008 www.aei.gov.au 15
Note: PDF files required Adobe Acrobat Reader to open. This can be downloaded at:
www.adobe.com
Other Useful Information on the AEI website
Research and Market Data Snapshots
The Research Snapshot series was developed to provide stakeholders with one-page summary updates on current activities and developments in international education data and research. The series provide examples of the ways in which Detailed Pivot Table data can be manipulated to meet an individual users needs.
Similarly, Market Data Snapshots present a one-page summary of market-specific data together with local insights from AEI’s International Network to help explain trends in enrolment data from overseas markets.
Research papers
A number of research papers have been developed by AEI to provide international education industry stakeholders with the findings of more detailed analysis of AEI’s international student database.
Using Pivot Tables in Excel
Pivot Tables are a powerful, yet easy to use, data analysis tool that enables you to reorganise, filter, group and summarise data by dragging and dropping variables into and out of a table.
The data can be located within the excel file itself, or the pivot table can be linked to an external data source such as an Access database.
In this part of the manual some of the information is presented as text and images, and other information is presented in the form of exercises.
Understanding Grouping
Before starting to use Pivot Tables, it is important to understand the concept of grouping.
Consider the list below of fictional office staff:
Name Gender Eye Colour
Barnsey Male Blue
Tezza Female Brown
Kazza Female Hazel
Davo Male Blue

AEI International Student Data User Guide December 2008 www.aei.gov.au 16
Robbo Male Blue
Shazza Female Brown
Jono Male Brown
Wazza Male Hazel
Damo Male Blue
Fifi Female Green
There are 10 records in the list. The name column indentifies individuals, but the gender and eye colour columns do not.
The name column means we must have one record per individual.
For analysis purposes we may not need to know the names of individuals, so we can group the data and count the records for each entry:
Grouping based on Gender: Grouping based on Eye Colour:
Gender Count Eye Colour Count
Female 4 Blue 4
Male 6 Brown 3
Total 10 Hazel 2
Green 1
Total 10
Now, instead of 10 rows, we have 2 rows for Gender and 4 rows for Eye Colour (but we can no longer see which individual is which gender or eye colour). To add more value, we can construct different groupings of eye colours and genders, summing the number of records at each intersection:
Eye Colour Gender Count Female 0 Blue Male 4 Female Male Total Female 2 Blue 0 4 4 Brown Male 1 OR Brown 2 1 3 Female 1 Hazel 1 1 2 Hazel Male 1 Green 1 0 1 Female 1 Total 4 6 10 Green Male 0
Total 10
Importantly, in every case the total number of records equals 10.
We would not usually group on the names because this would not summarize our data. We would still end up with 10 rows.
⇒ Open the Basic Pivot table on the AEI website

AEI International Student Data User Guide December 2008 www.aei.gov.au 17
Structure of a Pivot Table
Diagram 1—Structure of a Pivot Table
The following points refer to the example above.
Fields • In the pivot table you will see a series of fields, such as Month, State,
Nationality, Sector, Year and Sum of DATA YTD Enrolments.
• Within the fields are Items. For example the items of the field called Sector are:
o ELICOS
o Schools
o VET
o Higher Education
o Other
• Fields enable the data to be either filtered or summarised.
• There must also be at least one data field in the table to provide the numbers for the summary. In the example above it is DATA YTD Enrolments.
• All of the fields can be moved with the mouse to different areas in the pivot table to give different summaries of the data.
• Clicking the down-arrow at the right of the field name will reveal the item selector of the field, showing the items that make it up.
AEI International Student Data User Guide December 2008 www.aei.gov.au 18
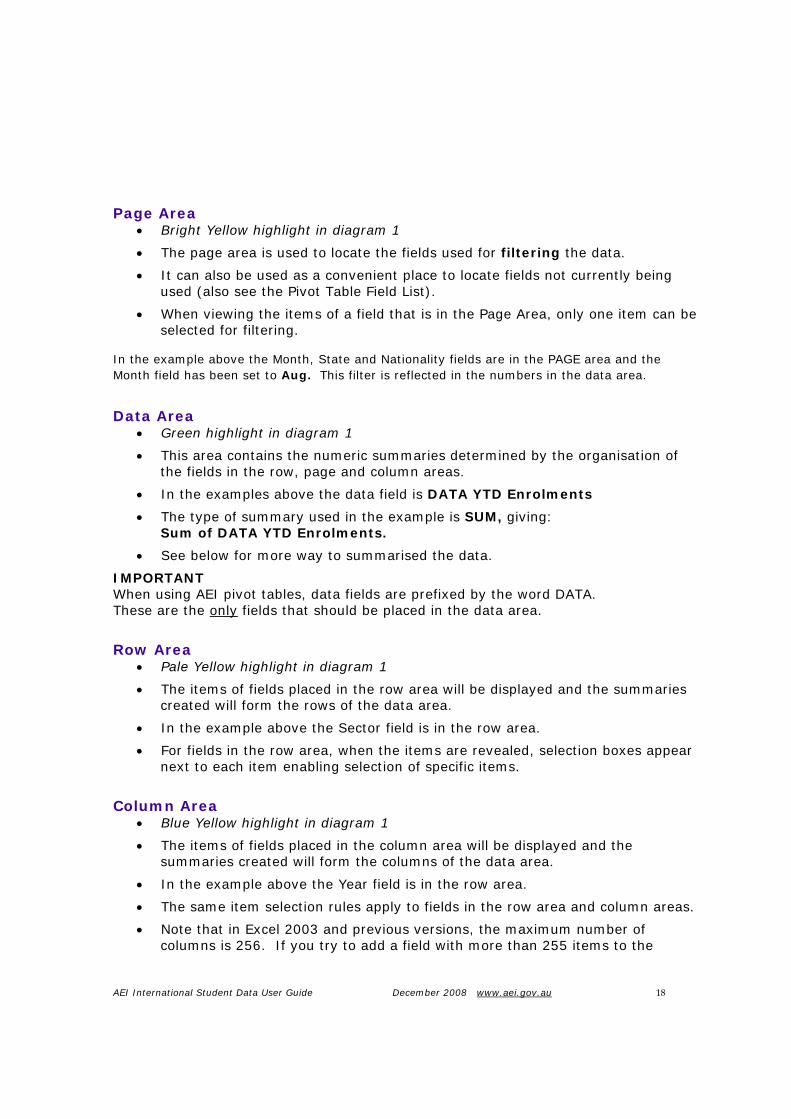
Page Area • Bright Yellow highlight in diagram 1
• The page area is used to locate the fields used for filtering the data.
• It can also be used as a convenient place to locate fields not currently being used (also see the Pivot Table Field List).
• When viewing the items of a field that is in the Page Area, only one item can be selected for filtering.
In the example above the Month, State and Nationality fields are in the PAGE area and the Month field has been set to Aug. This filter is reflected in the numbers in the data area.
Data Area • Green highlight in diagram 1
• This area contains the numeric summaries determined by the organisation of the fields in the row, page and column areas.
• In the examples above the data field is DATA YTD Enrolments
• The type of summary used in the example is SUM, giving: Sum of DATA YTD Enrolments.
• See below for more way to summarised the data.
IMPORTANT When using AEI pivot tables, data fields are prefixed by the word DATA. These are the only fields that should be placed in the data area.
Row Area • Pale Yellow highlight in diagram 1
• The items of fields placed in the row area will be displayed and the summaries created will form the rows of the data area.
• In the example above the Sector field is in the row area.
• For fields in the row area, when the items are revealed, selection boxes appear next to each item enabling selection of specific items.
Column Area • Blue Yellow highlight in diagram 1
• The items of fields placed in the column area will be displayed and the summaries created will form the columns of the data area.
• In the example above the Year field is in the row area.
• The same item selection rules apply to fields in the row area and column areas.
• Note that in Excel 2003 and previous versions, the maximum number of columns is 256. If you try to add a field with more than 255 items to the

AEI International Student Data User Guide December 2008 www.aei.gov.au 19
column area, the following dialogue box will appear:
• In this case the data will not be very useful or readable. You should reorganise the fields so the data is more usefully displayed.
Pivot Table Field List
Not all available fields need to be shown in the Page, Row, Column or Data areas. To simplify using the pivot table, only those fields currently being used need to be displayed.
• A full list of all the fields available can be seen in the Pivot Table Field List.
• To open the Pivot Table Field List:
o Hover over the pivot table with the mouse pointer and right-click to reveal the Pivot Table Sub-Menu
o Select Show Field List
• Fields that are currently displayed on the pivot table are shown in bold
• Fields that are not displayed are shown in normal font
• To display a field not already on the pivot table:
o Use the mouse to select the field from the Pivot Table Field List
o Drag/Drop it to the appropriate area on the pivot table
o The field will now be shown in bold in the field list
• To remove a field that is currently displayed on the pivot table:
o Select the field to be removed with the mouse
o Drag it out of the pivot table area until you see a red X beside the mouse icon
o Drop the field icon
o The field will now appear in the Pivot Table field List in normal font.
• The Pivot Table Field List can be locked to the sides of the screen. Drag the box to the left or right and when positioned correctly it will snap to the side and expand out. In this position it will remain displayed while a cell in the pivot table is selected.

AEI International Student Data User Guide December 2008 www.aei.gov.au 20
⇒ Identify the Page, Row, Column, Data Areas on the AEI Basic Pivot table, and open the Pivot Table Field List.
Using Fields to summarise data
Moving Fields • Fields in any part of the pivot table can be moved to any other part of the pivot
table.
• To move fields simply select them with the mouse and drag/drop them in the new location.
• When you move fields around, you will see the cursor change indicating the area into which the field is to be dropped.
• Be careful where you locate data fields—they should only be in the data area.
Stacking Fields • Fields can be stacked in the row or column areas, enabling more complex
summaries of the data
• To stack fields, select the fields and drag/drop them in the appropriate area.
• You can stack several fields in the row and/or column areas, but stacking too many fields can make the data difficult to read.
• In the example below, the State (blue highlight) and Sector (yellow highlight) fields are stacked in the Row Area, providing a breakdown of enrolments data by State and Sector (Row) and Year (Column), for year-to-date August (Page Area).

AEI International Student Data User Guide December 2008 www.aei.gov.au 21
Filtering Data
Fields in the PAGE area can be used to filter the data. For example you may just want to analyse data for one particular sector. To apply a filter, do the following:
• Make sure the field to be filtered is in the Page Area (If the Sector field is not in the page area, use the mouse to drag it there)
• Click the down-arrow at the right of the field box. This will reveal the items of the field. Because the field is in the page area, only one item can be selected
• Click the item to be filtered on, and click OK
• The data and summaries will now reflect the filter applied
• The field will show the value of the filter applied
• To remove the filter, follow the same procedure, but select (All).
• In the example below you can see that the items of the Sector field are (All) and ELICOS, Schools, VET, Higher Education and Other. Higher Education is selected and this is reflected in the Sector field on the pivot table.
Selecting Data
When fields are displayed in the row or column areas you can use the Item Selector to limit what data is displayed. This is similar to applying a filter, but you can select more than one item from the field to display.
• The Item Selector is a good way to see what items are contained within a Field, if the filed name is ambiguous
• In the example below, the Sector field items are shown with just ELICOS and VET selected
• When specific selections are made the summaries in the data area and grand totals reflect these selections

AEI International Student Data User Guide December 2008 www.aei.gov.au 22
• The (Show All) option enables you to over-ride an existing selection. Clicked once it will SELECT ALL items. Clicked a second time it will DE-SELECT ALL items
• The example below shows the items of the Sector field with just ELICOS and VET selected and displayed
IMPORTANT
o If you make a selection of items in a field that is in the row or column area, and then MOVE this field to the Page Area, the selection will be retained and the data will be filtered based on this
o In the example above if the Sector field is moved to the Page Area, the selection (ELICOS and VET) will be retained and the data and summaries displayed will reflect this
o The Sector page field item will show (Multiple Items)
o To change the selection of items or to include all items, you must move the field to the row or column area and open the item selector to make you new selection
AEI International Student Data User Guide December 2008 www.aei.gov.au 23
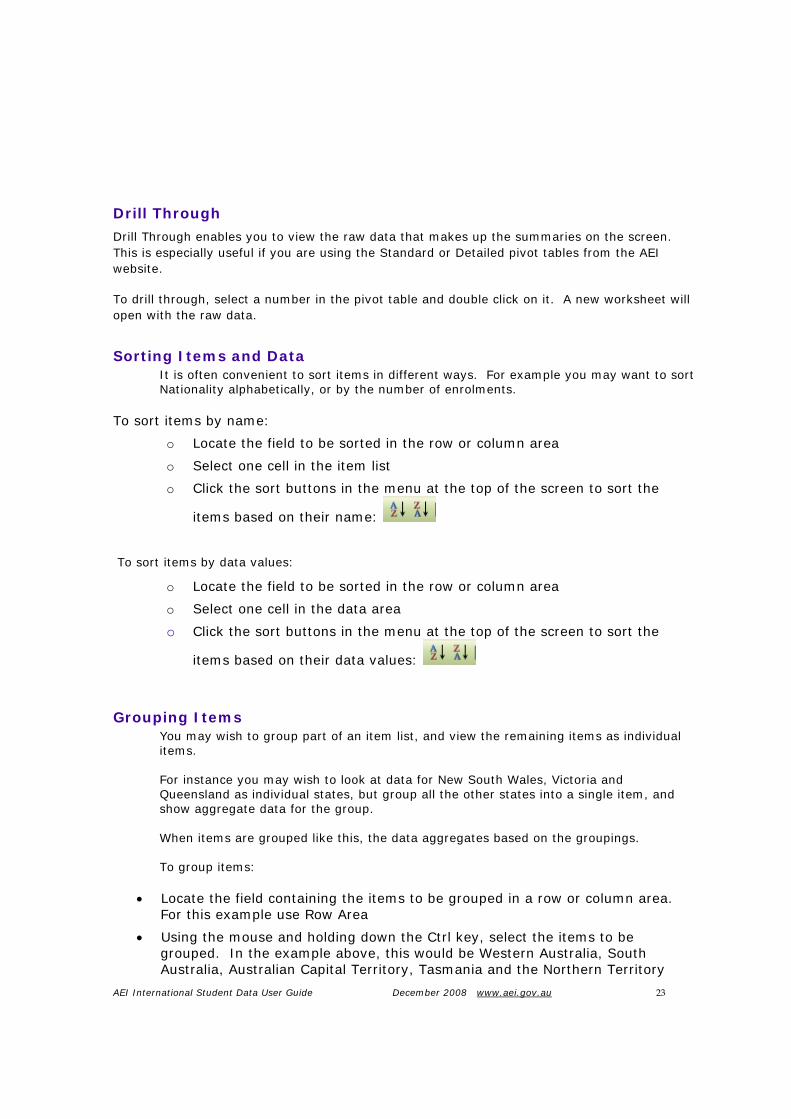
Drill Through
Drill Through enables you to view the raw data that makes up the summaries on the screen. This is especially useful if you are using the Standard or Detailed pivot tables from the AEI website.
To drill through, select a number in the pivot table and double click on it. A new worksheet will open with the raw data.
Sorting Items and Data It is often convenient to sort items in different ways. For example you may want to sort Nationality alphabetically, or by the number of enrolments.
To sort items by name:
o Locate the field to be sorted in the row or column area
o Select one cell in the item list
o Click the sort buttons in the menu at the top of the screen to sort the
items based on their name:
To sort items by data values:
o Locate the field to be sorted in the row or column area
o Select one cell in the data area
o Click the sort buttons in the menu at the top of the screen to sort the
items based on their data values:
Grouping Items You may wish to group part of an item list, and view the remaining items as individual items. For instance you may wish to look at data for New South Wales, Victoria and Queensland as individual states, but group all the other states into a single item, and show aggregate data for the group. When items are grouped like this, the data aggregates based on the groupings. To group items:
• Locate the field containing the items to be grouped in a row or column area. For this example use Row Area
• Using the mouse and holding down the Ctrl key, select the items to be grouped. In the example above, this would be Western Australia, South Australia, Australian Capital Territory, Tasmania and the Northern Territory
AEI International Student Data User Guide December 2008 www.aei.gov.au 24
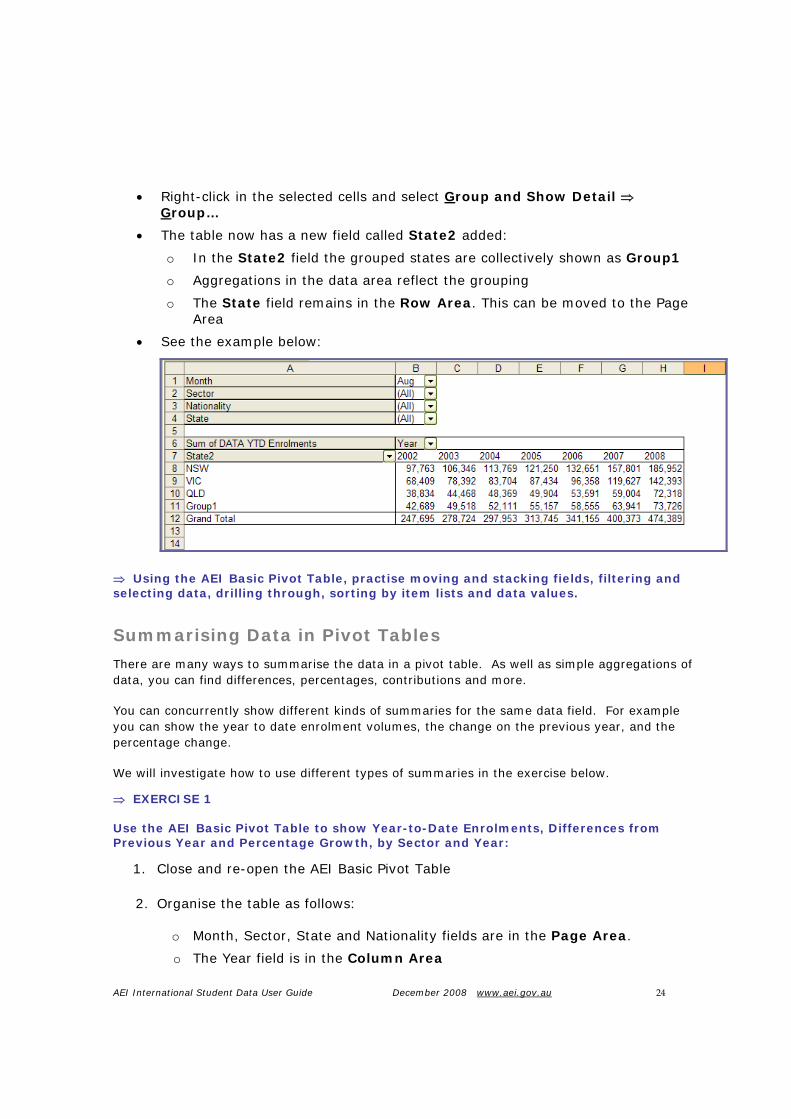
• Right-click in the selected cells and select Group and Show Detail ⇒ Group…
• The table now has a new field called State2 added:
o In the State2 field the grouped states are collectively shown as Group1
o Aggregations in the data area reflect the grouping
o The State field remains in the Row Area. This can be moved to the Page Area
• See the example below:
⇒ Using the AEI Basic Pivot Table, practise moving and stacking fields, filtering and selecting data, drilling through, sorting by item lists and data values.
Summarising Data in Pivot Tables
There are many ways to summarise the data in a pivot table. As well as simple aggregations of data, you can find differences, percentages, contributions and more.
You can concurrently show different kinds of summaries for the same data field. For example you can show the year to date enrolment volumes, the change on the previous year, and the percentage change.
We will investigate how to use different types of summaries in the exercise below.
⇒ EXERCISE 1 Use the AEI Basic Pivot Table to show Year-to-Date Enrolments, Differences from Previous Year and Percentage Growth, by Sector and Year:
1. Close and re-open the AEI Basic Pivot Table
2. Organise the table as follows:
o Month, Sector, State and Nationality fields are in the Page Area.
o The Year field is in the Column Area
AEI International Student Data User Guide December 2008 www.aei.gov.au 25
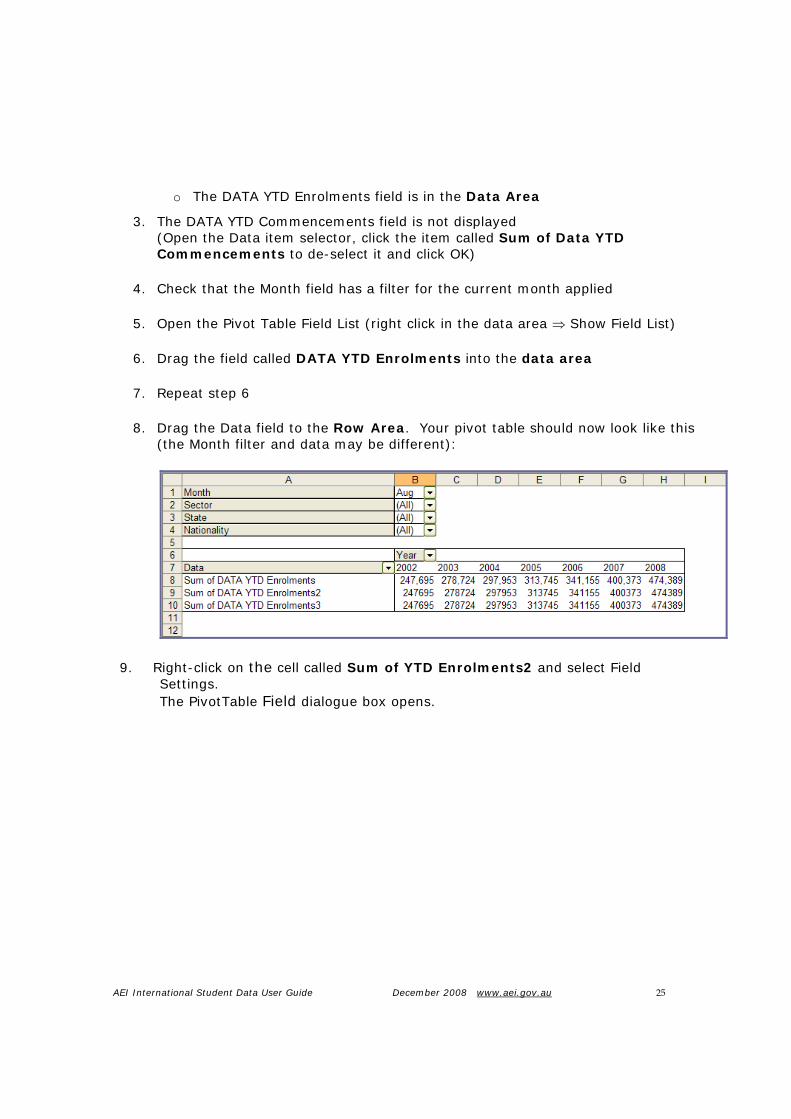
o The DATA YTD Enrolments field is in the Data Area
3. The DATA YTD Commencements field is not displayed (Open the Data item selector, click the item called Sum of Data YTD Commencements to de-select it and click OK)
4. Check that the Month field has a filter for the current month applied
5. Open the Pivot Table Field List (right click in the data area ⇒ Show Field List)
6. Drag the field called DATA YTD Enrolments into the data area
7. Repeat step 6
8. Drag the Data field to the Row Area. Your pivot table should now look like this (the Month filter and data may be different):
9. Right-click on the cell called Sum of YTD Enrolments2 and select Field Settings. The PivotTable Field dialogue box opens.

AEI International Student Data User Guide December 2008 www.aei.gov.au 26
10. In the Name: box type “Growth”
11. Click the Options >> button This reveals the Show data as: component
12. Click the drop-down button (currently set to Normal)
13. Select “Difference From” from the “Show data as” box
14. Select Year from the Base field box
15. Select (Previous) from the Base item box
16. Click OK
17. Right-click on the cell called Sum of YTD Enrolments3 and select Field Settings The PivotTable Field dialogue box opens
18. In the Name: box type “% Growth”
19. Click the Options >> button This reveals the Show data as: component

AEI International Student Data User Guide December 2008 www.aei.gov.au 27
20. Click the drop-down button (currently set to Normal)
21. Select “% Difference From” from the “Show data as” box
22. Select Year from the Base field box
23. Select (Previous) from the Base item box
24. Click OK.
Your pivot table should now look like this (the Month filter and data may be different):
25. Finally, move the Sector field into the row area, to the left of the Data fields to break the data down by sectors.
Your pivot table should now look like this (the Month filter and data may be different):

AEI International Student Data User Guide December 2008 www.aei.gov.au 28
The table now shows:
• Enrolment volumes (Sum of Data YTD Enrolments) Volume growth on the previous year (Growth) Percentage growth on the previous year (% Growth)
• For year to date August of each year displayed (Month filter = “Aug”)
• By Sector and Year (no filters applied to these fields)
Creating and using Pivot Charts
Pivot Charts are a powerful and flexible way of visually representing data contained in pivot tables. The look and feel of the chart can be changes and the fields represented in the chart can be dragged and dropped, and filtered in the same way as in the pivot table.
Pivot Charts are linked to pivot tables. They are usually created in a separate worksheet in the pivot table file.
We will investigate how to use different types of summaries in the exercise below.
⇒ EXERCISE 2 Create a Pivot Chart to show Year-to-Date Enrolments by Year and Sector:
1. Close and re-open the AEI Basic Pivot Table
2. Organise the table as follows:
o Month, State and Nationality fields are in the Page Area.
o The Year field is in the Column Area
o The Sector field is in the Row Area
o The DATA YTD Enrolments field is in the Data Area
o The DATA YTD Commencements field is not displayed (Open the Data item selector, click the item called Sum of Data YTD Commencements to de-select it and click OK)
3. Check that the Month field has a filter for the current month applied.

AEI International Student Data User Guide December 2008 www.aei.gov.au 29
4. Your pivot table should now look like this (the Month filter and data may be different):
5. Now the data for the chart is set up. Next notice the Pivot Table tool bar:
You may have to click inside the pivot table to expose the Pivot Table tool bar. If you cannot see it, go to the top menus in Excel and select: View ⇒ Toolbars ⇒ PivotTable
6. Select one cell inside the pivot table, and click the chart icon ⇒
AEI International Student Data User Guide December 2008 www.aei.gov.au 30
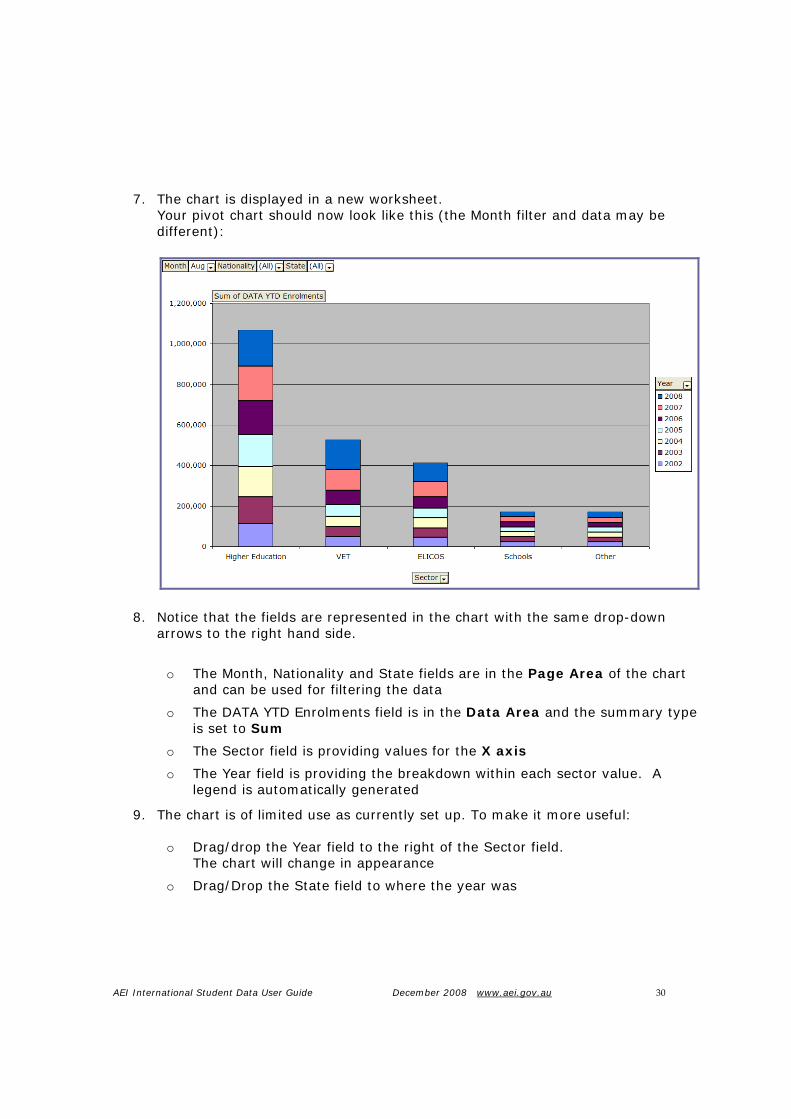
7. The chart is displayed in a new worksheet. Your pivot chart should now look like this (the Month filter and data may be different):
8. Notice that the fields are represented in the chart with the same drop-down arrows to the right hand side.
o The Month, Nationality and State fields are in the Page Area of the chart and can be used for filtering the data
o The DATA YTD Enrolments field is in the Data Area and the summary type is set to Sum
o The Sector field is providing values for the X axis
o The Year field is providing the breakdown within each sector value. A legend is automatically generated
9. The chart is of limited use as currently set up. To make it more useful:
o Drag/drop the Year field to the right of the Sector field. The chart will change in appearance
o Drag/Drop the State field to where the year was

AEI International Student Data User Guide December 2008 www.aei.gov.au 31
10. Your pivot chart should now look like this (the Month filter and data may be different):
We now have a chart showing Enrolment Growth as at Year-to-date August, by Year and Sector, with a breakdown by State. We can see from this that:
VET sector enrolments are growing quickly
ELICOS enrolments are also growing, but at a slower rate and from a smaller base
Higher Education enrolments are growing at a decreasing rate
Schools and Other sector enrolments are relatively stable
To finish the exercise, manipulate the fields to determine which state is growing the fastest.
This is a very brief summary of how to use Pivot Charts. There are many other things you can do such as change the chart type, show 2 types of summary on the same chart, manipulate colours, use calculated fields and more.
Interpreting Data in Pivot Tables
Understanding the fields in a pivot table is a critical aspect of their successful use. Invalid interpretations of data can occur when field are not properly understood.

AEI International Student Data User Guide December 2008 www.aei.gov.au 32
This is particularly the case when using the data fields in the AEI pivot tables. The data fields are aggregated each month through the year. So the March Enrolment and Commencements data is the sum of the January, February and March data.
So you would not sum the year-to-date enrolments or commencements data over 2 months (say July and August) because you would them be adding together the data from January to July AND January to August, giving a highly inflated result.
Therefore in most cases you would locate the Month field in the Page Area, and filter on the month required. For year to date information it would be the month of the most recent data update. For calendar year data you would set the month to December. In this case you would not see any data for the current year.
Looking at the fields we have we have used so far:
Type Field Name Interpretation
Month The month in which the enrolments occurred
Sector The sector in which the enrolments occurred
State The state in which the enrolments occurred
Nationality The nationality of the students enrolling
Display
Year The year in which the enrolments occurred
Sum of YTD Enrolments The number of enrolments from 01 January to the end of the reference month in the reference year.
Growth
This is the difference between the enrolments in one year and enrolments in the previous year.
There is no figure for 2002 because there is no data for years prior to 2002. Data
% Growth
This is the percentage difference between the enrolments in one year and enrolments in the previous year.
There is no figure for 2002 because there is no data for years prior to 2002.
AEI International Student Data User Guide December 2008 www.aei.gov.au 33
Copying Data from Pivot Tables
It is often useful to copy data summaries from a pivot table to another excel file for archiving, presentation or further analysis.
Care should be taken when copying data from a pivot table to another spreadsheet, especially if the new spreadsheet is to be subsequently emailed.
Depending on how you copy and paste the data, you can inadvertently copy all the data underlying the pivot table as well, which will increase the size of the excel file many-fold, although you may not be able to see the data.
To copy data from a pivot table to another excel file:
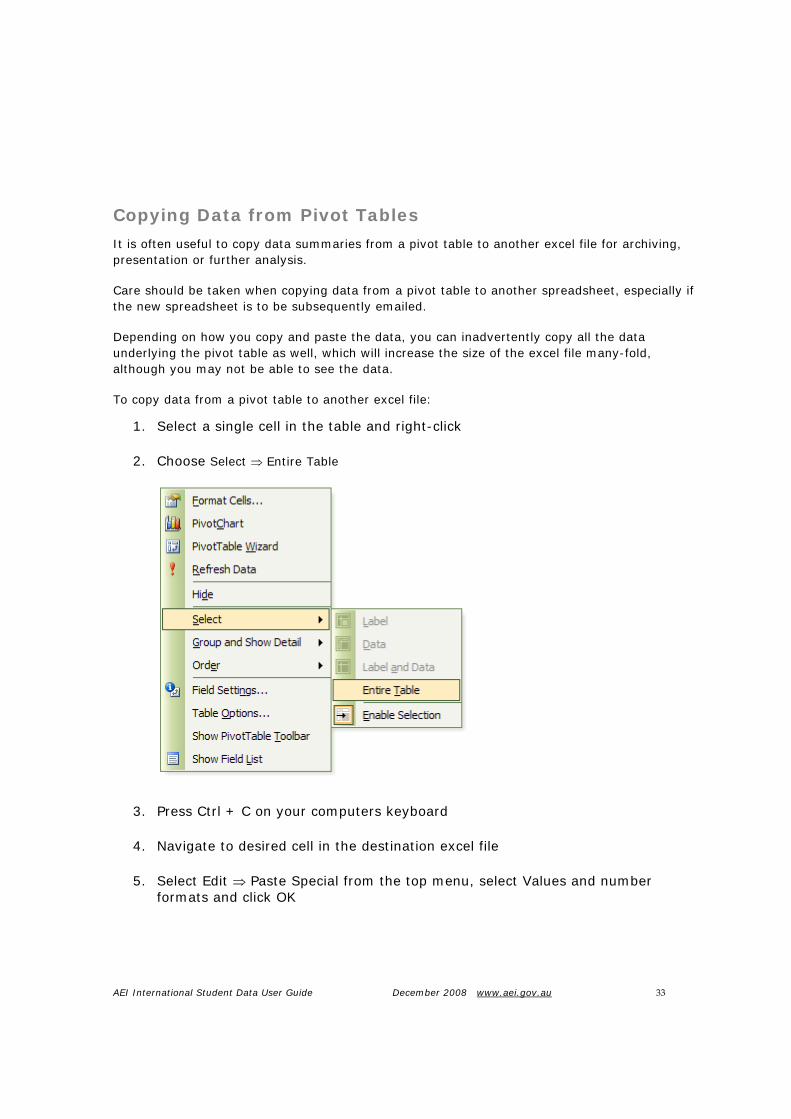
1. Select a single cell in the table and right-click
2. Choose Select ⇒ Entire Table
3. Press Ctrl + C on your computers keyboard
4. Navigate to desired cell in the destination excel file
5. Select Edit ⇒ Paste Special from the top menu, select Values and number formats and click OK

AEI International Student Data User Guide December 2008 www.aei.gov.au 34
The data values will be pasted as unformatted values. The underlying data will not be pasted resulting in a smaller destination file.
See the result below:
This method also the advantage that fields in the page area of the source file are copied across with the data, so users can see what filters are applicable to the data.


![FOR INTERNATIONAL STUDENT [FRESHMEN]isen.yu.ac.kr/user/isen/download/...Admission_Guideline_Freshmen.pdf · International Student Services ... • Issued within 30 days of ... 50%Tuition](https://static.fdocuments.net/doc/165x107/5b7fdb9c7f8b9a35788cb3e8/for-international-student-freshmenisenyuackruserisendownloadadmissionguideline.jpg)