
Comparative Analysis of Non Performing Assets of Public Sector, Private Sector & Foreign Banks
Upload
abhishek-duttaguptaCategory
view
57download
0
A Trend Analysis of Non- Performing Assets (NPAs) of Selected
Commercial Banks in India

INTRODUCTION
Non-performing assets (NPAs) is affecting the performance of the credit institutions both financially and psychologically.
• Prevents or delays recycling of funds.• Denies income from the asset by way of interest
• Decreases profit by way of provisions.

• NPA is a disorder resulting in non-performance of a portion of loan portfolio leading to
• No recovery or less recovery / income to the lender.
• NPAs represent the quantified “Credit Risk”. • It also affects the mental capability of the banker towards lending

• NPAs are an inevitable burden on the banking industry.
• Hence, the success of a bank depends upon the methods of managing NPAs and keeping them within tolerance level.

Aim of the study
• To analyze the trends in NPAs• Gross and net NPAs as a percentage of gross advances and net advances,
• Gross and net NPAs as a percentage of Total Assets respectively.

METHODOLOGY
• Secondary data have been used• The study spans the period starting from 2003-2004 to 2012-2013.
• The data from Reserve Bank of India(RBI) bulletins, statistical tables relating to banks in India
• Report on trend and progress of banking in India, issued by the RBI.

CONCEPTUAL FRAMEWORK OF NPAs
• On the recommendations of the Narashimam Committee in the year 1992-93.
• As per the RBI norms an asset is considered as “Non performing” if the asset ceases to generate income for more than 90 days period.
• With a view to moving towards international best practices

• Interest and /or installment of principal remain overdue for a period of more than 90 days, in repect of a term loan.
• The account remain out of order, in respect of overdraft/cash credit.
• The bill remain overdue for a period of more than 90 days in case of bill purchased and discounted.
• interest and or installment of principal remains overdue for two harvest seasons but for a period not exceeding two half years in the case of an advance granted for agricultural purposes.

Provisions RequirementsPeriod for which the advance has remained in Doubtful category
Provision requirements (%)
Up to one year 20One to three years 30More than three yearsI. Outstanding stock of NPAs as on March31,2004
- 60 percent with effect from March31,2005-75 percent with effect from March 31, 2006.
-100 percent with effect from March31,2007
II. Advances classified as doubtful for more than three years on or after April1,2004
100 percent with effect from March 31,2005

Reasons for NPAs in Banks• Internal Factors • Diversion of funds for Expansion/diversification/modernization. Taking up new projects. Helping/promoting associate concerns.• Time/cost overrun during the project implementation.• Inefficient management. • Strained labour relations.• Inappropriate technology/technical problems. • Product obsolescence, etc.• Poor credit Appraisals, monitoring and follow up

External Factors
• Recession.• Input or power shortage.• Price escalation. • Exchange rate fluctuation.• Accidents and natural calamities. • Changes in government policy.• Willful defaulters have been there because they
knew that legal recourse available to the lenders is time consuming and slow.
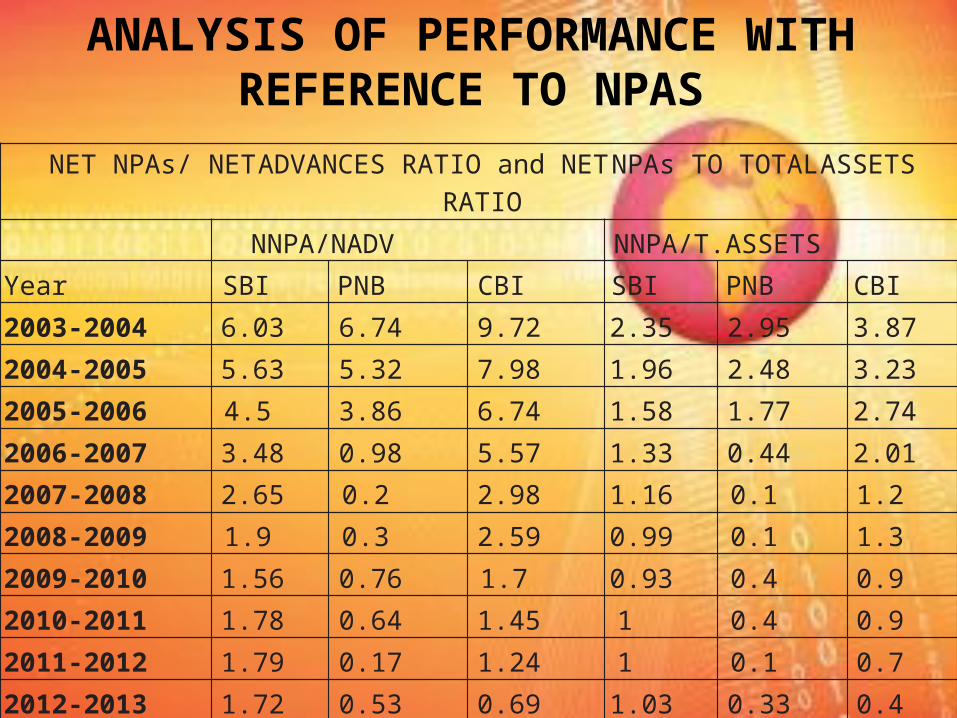
ANALYSIS OF PERFORMANCE WITH REFERENCE TO NPAS
NET NPAs/ NETADVANCES RATIO and NETNPAs TO TOTALASSETS RATIO
NNPA/NADV NNPA/T.ASSETSYear SBI PNB CBI SBI PNB CBI2003-2004 6.03 6.74 9.72 2.35 2.95 3.872004-2005 5.63 5.32 7.98 1.96 2.48 3.232005-2006 4.5 3.86 6.74 1.58 1.77 2.742006-2007 3.48 0.98 5.57 1.33 0.44 2.012007-2008 2.65 0.2 2.98 1.16 0.1 1.22008-2009 1.9 0.3 2.59 0.99 0.1 1.32009-2010 1.56 0.76 1.7 0.93 0.4 0.92010-2011 1.78 0.64 1.45 1 0.4 0.92011-2012 1.79 0.17 1.24 1 0.1 0.72012-2013 1.72 0.53 0.69 1.03 0.33 0.4Source: Compiled from Statistical Tables Relating to Banks in India, Various issues
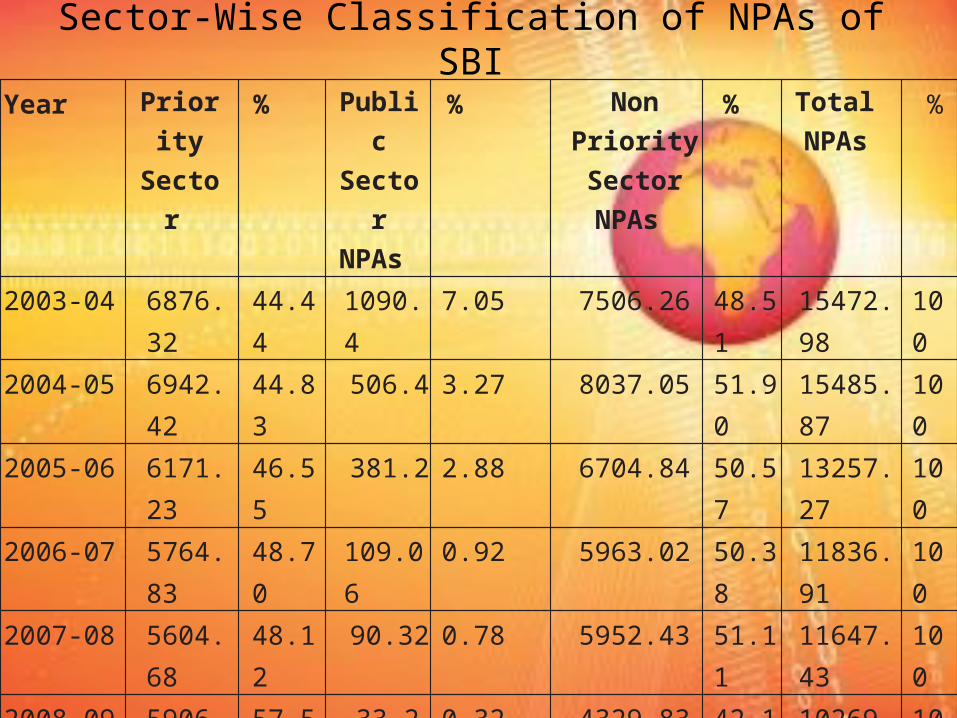
Sector-Wise Classification of NPAs of SBIYear Priorit
y Sector
% Public Sector NPAs
% Non Priority Sector NPAs
% Total NPAs
%
2003-04 6876.32 44.44 1090.4 7.05 7506.26 48.51 15472.98 1002004-05 6942.42 44.83 506.4 3.27 8037.05 51.90 15485.87 1002005-06 6171.23 46.55 381.2 2.88 6704.84 50.57 13257.27 1002006-07 5764.83 48.70 109.06 0.92 5963.02 50.38 11836.91 1002007-08 5604.68 48.12 90.32 0.78 5952.43 51.11 11647.43 1002008-09 5906.49 57.51 33.2 0.32 4329.83 42.16 10269.52 1002009-10 5810.19 58.86 149.32 1.51 3911.5 39.63 9871.01 1002010-11 7561.28 60.12 91.16 0.72 4923.64 39.15 12576.08 1002011-12 7010 46.41 163 1.08 7932 52.51 15105 1002012-13 9073 50.87 235 1.32 8529 47.82 17837 100r * 0.82 0.51 0.94r** -0.54 0.39 0.52r* =Coefficient of Correlation between the amounts of different sectors to the total amounts.r** =Coefficient of Correlation between the proportion of different sectors to the total amounts.
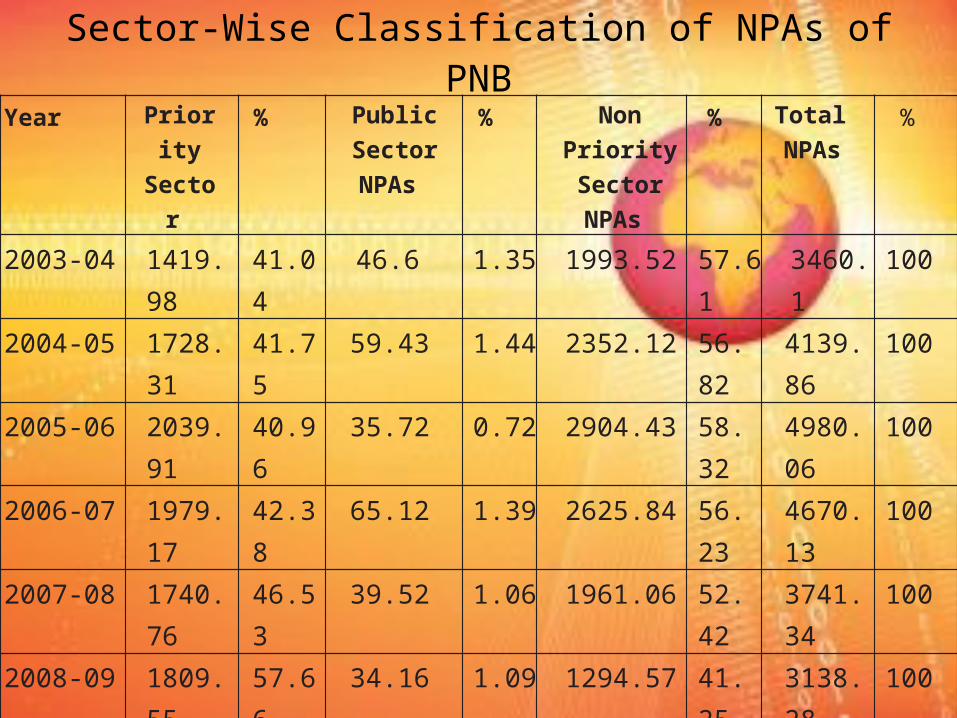
Sector-Wise Classification of NPAs of PNBYear Priority
Sector % Public
Sector NPAs
% Non Priority Sector NPAs
% Total NPAs
%
2003-04 1419.98 41.04 46.6 1.35 1993.52 57.61 3460.1 1002004-05 1728.31 41.75 59.43 1.44 2352.12 56.82 4139.86 1002005-06 2039.91 40.96 35.72 0.72 2904.43 58.32 4980.06 1002006-07 1979.17 42.38 65.12 1.39 2625.84 56.23 4670.13 1002007-08 1740.76 46.53 39.52 1.06 1961.06 52.42 3741.34 1002008-09 1809.55 57.66 34.16 1.09 1294.57 41.25 3138.28 1002009-10 2511.6 74.08 90.16 2.66 788.51 23.26 3390.27 1002010-11 2761.59 83.20 52.84 1.59 504.87 15.21 3319.3 1002011-12 2436 88.01 1 0.04 331 11.96 2768 1002012-13 2471 76.88 4 0.12 739 22.99 3214 100r* -0.33 0.37 0.90r** -0.84 0.16 0.83r* =Coefficient of Correlation between the amounts of different sectors to the total amounts.r** =Coefficient of Correlation between the proportion of different sectors to the total amounts.

Sector-Wise Classification of NPAs of CBIYear Priority
Sector % Public
Sector NPAs
% Non Priority Sector NPAs
% Total NPAs
%
2003-04 1583.6 48.68 26.96 0.83 1642.77 50.50 3253.33 1002004-05 1708.99 50.63 25.01 0.74 1641.69 48.63 3375.69 1002005-06 1721.04 53.06 123 3.79 1399.41 43.15 3243.45 1002006-07 1724.59 55.78 21.14 0.68 1346.19 43.54 3091.92 1002007-08 1585.44 60.48 12.71 0.48 1023.26 39.03 2621.41 1002008-09 1597.68 59.52 6.47 0.24 1080.03 40.24 2684.18 1002009-10 1598.86 62.16 10.15 0.39 962.97 37.44 2571.98 1002010-11 1651.44 70.28 0.81 0.03 697.59 29.69 2349.84 1002011-12 1587 68.38 59 2.54 675 29.08 2321 1002012-13 1658 67.45 8 0.33 792 32.22 2458 100r* 0.53 0.39 0.98r** -0.97 0.31 0.94r* =Coefficient of Correlation between the amounts of different sectors to the total amounts.r** =Coefficient of Correlation between the proportion of different sectors to the total amounts.

Priority Sector NPAs of SBI
Year Agriculture % SSI % Others % Total Priority Sector
%
2003-04 2351.18 34.19 2898.42 42.15 1626.72 23.66 6876.32 1002004-05 2520.49 36.31 2794.22 40.25 1627.71 23.45 6942.42 1002005-06 2369.39 38.39 2302.57 37.31 1499.27 24.29 6171.23 1002006-07 2124.26 36.85 1741.07 30.20 1899.5 32.95 5764.83 1002007-08 1912.68 34.13 1371.97 24.48 2320.03 41.39 5604.68 1002008-09 1929.21 32.66 1238.89 20.98 2738.39 46.36 5906.49 1002009-10 1977.18 34.03 1074.78 18.50 2758.23 47.47 5810.19 1002010-11 2915.12 38.55 1260.11 16.67 3386.05 44.78 7561.28 1002011-12 1789 25.52 1712 24.42 3509 50.06 7010 1002012-13 2322 25.59 2168 23.90 4583 50.51 9073 100
R 0.48 0.34 0.68R² 0.23 0.12 0.46r = Coefficient of Correlation,R2 =Coefficient of Determination

Priority Sector NPAs of PNB
Year Agriculture % SSI % Others % Total Priority Sector
%
2003-04 384.81 27.10 568.88 40.06 466.29 32.84 1419.98 1002004-05 443.9 25.68 687.09 39.76 597.32 34.56 1728.31 1002005-06 512.23 25.11 929.91 45.59 597.77 29.30 2039.91 1002006-07 474.05 23.95 928.17 46.90 576.95 29.15 1979.17 1002007-08 354.46 20.36 908.3 52.16 478.6 27.48 1741.36 1002008-09 432.17 23.88 796.94 44.04 580.5 32.08 1809.61 1002009-10 647.39 25.78 991.32 39.47 872.89 34.75 2511.6 1002010-11 1011.61 36.63 910.51 32.97 839.47 30.40 2761.59 1002011-12 537 22.04 1000 41.05 899 36.90 2436 1002012-13 977 39.55 1165 47.17 328 13.28 2470 100r 0.84 0.76 0.56R² 0.73 0.41 0.26r = Coefficient of Correlation,R2 =Coefficient of Determination

Priority Sector NPAs of CBIYear Agricultu
re (i)% SSI(ii) % Others(ii
i)% Total
Priority Sector
%
2003-04 346.78 21.90 737.71 46.58 499.11 31.52 1583.6 1002004-05 396.34 23.19 789.37 46.19 523.28 30.62 1708.99 1002005-06 441.1 25.63 746.75 43.39 533.19 30.98 1721.04 1002006-07 459.78 26.66 683.39 39.63 581.42 33.71 1724.59 1002007-08 356.34 22.48 627.55 39.58 601.55 37.94 1585.44 1002008-09 413.39 25.87 607.46 38.02 576.83 36.10 1597.68 1002009-10 450.67 28.19 519.47 32.49 628.72 39.32 1598.86 1002010-11 535.83 32.45 636.3 38.53 479.31 29.02 1651.44 1002011-12 417 26.26 659 41.50 512 32.24 1588 1002012-13 421 25.39 922 55.61 315 19.00 1658 100r 0.40 0.46 -0.16R² 0.08 0.30 0.04r = Coefficient of Correlation,R2 =Coefficient of Determination

CONCLUSION• The credit management skills have become more
important for improving the bottom-line of the banking sector.
• The various global risks associated with the banking industry will expose the credit assets to greater risks while serious efforts need to be taken for recovery measures.
• Banks need to be equipped with necessary risk appraisal system to minimize credit defaults.
• Several experiments have been tried to curb NPAs (viz., BIFR/SICA, lok adalats, DRTs, OTS, SARFAESI etc) but nothing has hit the mark in tackling NPAs.

Suggestions
• Improving the recovery management• Monitoring accounts• Keeping regular contact with borrowers• Fixing recovery targets• Arranging recovery camps• BOD are the key players in the management of
banks but they are granted little autonomy.• The nominees of Government /RBI dominate the
banks boards due to their vast powers.

• Upgrading Technology Computerization can further help the management in
getting required information in order to take proper decisions while granting loans/advances.
• Inculcating ethics in borrowers NGO’s and other voluntary organizations to educate the
borrowers regarding the importance of timely repayment of credit.
• A separate statement should be made so that all stakeholders are aware to what extent their profits were affected due to the write-off.

• Credit information Bureau of India Limited (CIBIL) it was set up in the year 2001, by SBI, HDFC, and two foreign technology partners.

REFERENCES
• http://rbi.org.in.• https://rbi.org.in/Scripts/PublicationsView.aspx?id=15518
• http://iba.org.in• Report on Trend and Progress of banking in India, Various Issues.
• Statistical Tables relating to Banks in India, Various Issues.

Thank You


