
A STUDY ON NON PERFORMING ASSETS MANAGEMENT WITH REFERENCE ... · A STUDY ON NON PERFORMING ASSETS...
14
30 Journal of Management and Science ISSN: 2249-1260 | e-ISSN: 2250-1819 | Vol.5. No.1 | March’2015 A STUDY ON NON PERFORMING ASSETS MANAGEMENT WITH REFERENCE TO PUBLIC SECTOR BANKS, PRIVATE SECTOR BANKS AND FOREIGN BANKS IN INDIA Mayur Rao a and Ankita Patel b a Research Scholar, Business Studies Dept., Sardar Patel University and Assistant Professor, AIM , Anand-388001, India b Assistant Professor, Anand Law College , Anand-388001, India ABSTRACT: Non Performing Assets (NPA‟s) are one of the major areas of concern for the Indian banking industry. Non-Performing Assets are like a double edged sword. They do not generate any income, whereas, the bank is required to make provisions such as assets. (Olekar and Talawar, 2012). NPAs do not just reflect badly in a bank‟s account books, the y adversely impact the national economy. There are many research conducted on the topic of Non- Performing Assets (NPA) Management, concerning particular bank, comparative study of public and private banks etc. This paper considers the aggregate data of public sector, private sector and foreign banks and attempts to compare analyze and interpret the NPA management from the year 2009 -2013. On the conceptual side, it gives an overview of NPA, Types of NPA, causes and on the calculation side, it covers various NPA related ratios, use of Least square method for estimating Gross NPAs in the year 2014, and also application of ANOVA test to judge the presence of any significant difference between ratio of Gross NPA to Gross Advances. The findings reveals the percentage of Gross NPA to Gross advances is increasing for public banks, ratio of Loss Advances to Gross Advances are higher in foreign banks, the Estimated Gross NPA for 2014 is also more in public banks as compared to private and foreign banks and from the ANOVA test, it is concluded Ratio of Gross NPA to Gross Advances for public sector, private Sector and foreign Banks does not have significant difference between 2009 to 2013 Keywords: Non Performing Asset (NPA), Public Banks, Private Banks, Foreign Banks 1. INTRODUCTION It has been argued by a number of economists that a well-developed financial system enables smooth flow of savings and investments and hence, supports economic growth (see King and Levine, 1993, Goldsmith, 1969). Banking industry is a major sector of the economy that has achieved renewed focus after financial sector reforms and the entry of private sector banks. This sector is the foundation of modern economic development. The primary function of banks is to lend funds as loans to various sectors such as agriculture, industry, personal and housing etc. and to receive deposits. Receiving deposit involves no risk, since it is the banker who owes a duty to repay the deposit, whenever it is demanded. On the other hand lending always involves much risk because there is no certainty of repayment. In recent times the banks have become very careful in extending loans, the reason being rising non-performing assets. Non-performing assets had been the single largest cause of frustration of the banking sector of India. Amongst the various desirable characteristics of a well-functioning financial system, the maintenance of a few non-performing assets (NPA) is an important one.
Transcript of A STUDY ON NON PERFORMING ASSETS MANAGEMENT WITH REFERENCE ... · A STUDY ON NON PERFORMING ASSETS...
30
Journal of Management and Science ISSN: 2249-1260 | e-ISSN: 2250-1819 | Vol.5. No.1 | March’2015
A STUDY ON NON PERFORMING ASSETS MANAGEMENT
WITH REFERENCE TO PUBLIC SECTOR BANKS, PRIVATE
SECTOR BANKS AND FOREIGN BANKS IN INDIA Mayur Rao
a and Ankita Patel
b
aResearch Scholar, Business Studies Dept., Sardar Patel University and Assistant Professor, AIM ,
Anand-388001, India bAssistant Professor, Anand Law College , Anand-388001, India
ABSTRACT: Non Performing Assets (NPA‟s) are one of the major areas of concern for the Indian
banking industry. Non-Performing Assets are like a double edged sword. They do not generate any
income, whereas, the bank is required to make provisions such as assets. (Olekar and Talawar, 2012).
NPAs do not just reflect badly in a bank‟s account books, they adversely impact the national
economy. There are many research conducted on the topic of Non- Performing Assets (NPA)
Management, concerning particular bank, comparative study of public and private banks etc. This
paper considers the aggregate data of public sector, private sector and foreign banks and attempts to
compare analyze and interpret the NPA management from the year 2009 -2013. On the conceptual
side, it gives an overview of NPA, Types of NPA, causes and on the calculation side, it covers
various NPA related ratios, use of Least square method for estimating Gross NPAs in the year 2014,
and also application of ANOVA test to judge the presence of any significant difference between ratio
of Gross NPA to Gross Advances. The findings reveals the percentage of Gross NPA to Gross
advances is increasing for public banks, ratio of Loss Advances to Gross Advances are higher in
foreign banks, the Estimated Gross NPA for 2014 is also more in public banks as compared to
private and foreign banks and from the ANOVA test, it is concluded Ratio of Gross NPA to Gross
Advances for public sector, private Sector and foreign Banks does not have significant difference
between 2009 to 2013
Keywords: Non Performing Asset (NPA), Public Banks, Private Banks, Foreign Banks
1. INTRODUCTION
It has been argued by a number of economists that a well-developed financial system enables smooth
flow of savings and investments and hence, supports economic growth (see King and Levine, 1993,
Goldsmith, 1969). Banking industry is a major sector of the economy that has achieved renewed
focus after financial sector reforms and the entry of private sector banks. This sector is the
foundation of modern economic development. The primary function of banks is to lend funds as
loans to various sectors such as agriculture, industry, personal and housing etc. and to receive
deposits. Receiving deposit involves no risk, since it is the banker who owes a duty to repay the
deposit, whenever it is demanded. On the other hand lending always involves much risk because
there is no certainty of repayment. In recent times the banks have become very careful in extending
loans, the reason being rising non-performing assets. Non-performing assets had been the single
largest cause of frustration of the banking sector of India. Amongst the various desirable
characteristics of a well-functioning financial system, the maintenance of a few non-performing
assets (NPA) is an important one.

31
Journal of Management and Science ISSN: 2249-1260 | e-ISSN: 2250-1819 | Vol.5. No.1 | March’2015
2. NON –PERFORMING ASSET- CONCEPT
A Non-Performing Asset (NPA) is defined as a credit facility in respect of which the interest and/or
installment of principal has remained „past due‟ for a specified period of time.
In India, the definition of NPAs has changed over time. According to the Narasimham Committee
Report (1991), those assets (advances, bills discounted, overdrafts, cash credit etc.) for which the
interest and/or installment of principal remains due for a period of four quarters (180 days) should
be considered as NPAs.
With an aim of moving towards the international best practices and ensuring greater transparency, a
standard criterion of ‟90 days‟ overdue norm was fixed for identification of NPA from the FY ending
March, 2004 in the Indian financial system. Thus, as per present convention, a non-performing asset
refers to a loan or an advance where:
Interest and/or installment of principal remain overdue for a period of more than 90 days in
respect of a term loan,
The account remains „out of order‟ for a period of more than 90 days, in respect of an
Overdraft/Cash Credit (OD/CC),
The bill remains overdue for a period of more than 90 days in the case of bills purchased and
discounted,
Interest and/or installment of principal remains overdue for two harvest seasons but for a
period not exceeding two half years in the case of an advance granted for agricultural
purposes, and
Any amount to be received remains overdue for a period of more than 90 days in respect of
other accounts
3. NORMS FOR ASSET CLASSIFICATION/ CLASSIFICATION OF NPA
The loan accounts in Banks are classified into four categories. Out of these four categories, the
following three categories are considered as NPAs:-
a) Sub-standard Assets
Before 31 March 2001, sub-standard asset was classified as NPA for a period not exceeding
two years but with effect from 31 March 2001, a sub-standard asset which has remained NPA
for a period less than or equal to 18 months. With effect from 31 March 2005 the norms have
been further squeeze and a sub-standard asset would be one, which has remained NPA for a
period less than or equal to 12 months.
In such cases, the current net worth of the borrower/ guarantor or the current market value of
the security charged is not enough to ensure recovery of the dues to the banks in full.
b) Doubtful Assets
Before 31 March 2001, doubtful asset was remained NPA for a period exceeding two years
but with effect from 31 March 2001, it had remained NPA for a period exceeding 18 months.
With effect from March 31, 2005, the norms have been further squeeze, and an asset would
be classified as doubtful if it remained in the sub-standard category for 12 months.

32
Journal of Management and Science ISSN: 2249-1260 | e-ISSN: 2250-1819 | Vol.5. No.1 | March’2015
c) Loss Assets:
A loss asset is one where loss has been identified by the bank or internal or external auditors
or the RBI inspection but the amount has not been written off wholly. In other words, such an
asset is considered uncollectible and of such little value that its continuance as a bankable
asset is not warranted although there may be some salvage or recovery value.
However, only those advances are classified as loss assets where no security is available. In
accounts where some security / ECGC /DICGC cover is available, these accounts are not
reported under loss assets.
The fourth category of loan accounts, which is not included in NPA categories - is Standard Assets.
Standard Asset is one which does not disclose any problems and which does not carry only normal
risk attached to the business.
According to the RBI guidelines, as and when an asset becomes a NPA, such advances would be first
classified. However, it needs to be noted that the asset classification is only for the purpose of
computing the amount of provision that needs to be made with respect to bank advances.
4. CAUSES FOR NPA
Table 1. Causes for Non Performing Asset (NPA)
Borrower Bank Other
Too ambitious
Project
Heavy borrowing
Poor credit
collection
Poor quality
management
Willful Default
Depend on Single
customer
Fail to bring
required Fund
Lack of Proper
Planning
Poor credit appraisal
Non inspection of unit
Defective lending
process
Lack of trained staff
System overloaded
Lack of commitment
to recovery
Lack of technical
support
Inefficient recovery
system
Lack of infrastructure
Lack of Government support
Government policies
Changes related to Banking
amendments
Natural Calamities
Recession and variation in
economic conditions.

33
Journal of Management and Science ISSN: 2249-1260 | e-ISSN: 2250-1819 | Vol.5. No.1 | March’2015
5. LITERATURE REVIEW
There are many studies conducted on the issue of Non Performing Asset Management in Indian
Banks, following is the review of few literatures about the NPA Practices and Management
conducted for Banks in India.
Narula and Singla (2014) evaluate the non – performing assets of Punjab National Bank and its
impact on profitability & to see the relation between total advances, Net Profits, Gross & Net NPA.
The study uses the annual reports of Punjab National Bank for the period of six years from 2006-07
to 2011-12. These papers conclude that there is a positive relation between Net Profits and NPA of
PNB. It is because of the mismanagement on the side of bank.
Arora and Ostwal (2014) conducted study on “Unearthing the Epidemic of Non-Performing Assets:
A Study of Public and Private Sector Banks” which deals with the concept of Non-performing assets
and analyze the classification of loan assets of public and private sector banks. It also explores the
comparison of loan assets of Public sector and private sector banks. The study concluded that private
sectors improving due to decline in NPAs ratio compare to Public sector banks due to recovery
management done in NPAs and suggest that there is need to check the NPAs of public sector banks
so that Indian banking system becomes efficient.
Srinivas K T (2013) emphasis on identify the Non-performing assets at Commercial banks in India.
This paper highlights the various general reasons which convert advances/ assets into NPA and also
give suitable suggestion on findings to overcome the mentioned problem.
Sikdar and Makkad (2013) this paper provide insight on the role of NPA in risk frame work of
selected Indian commercial banks and try to put forward the means of interpreting credit risk from
existing levels of bank NPAs. Further, research highlights the significant steps taken and procedures
implemented by major Indian commercial banks, within the public and private sector, towards
recovery of loans and advances falls into the NPA bracket. The research for the present paper is
based on extensive study of annual publications on performance of public sector and private sector
commercial banks by the Indian Banks Association (IBA). Further, annual reports of commercial
banks in focus for the year ending March 2012 have been studied. The study conclude that problem
of NPAs can be tackled only with proper credit assessment and risk management mechanism.
Olekar and Talawar (2012) studied NPA management with reference to Karnatak central co-
operative bank ltd., where they described conceptual data about NPA and on the other hand, they
calculated few NPA related ratios and used trend projection method to predict next year advances for
the bank. Their finding includes the considerable reduction of NPA for the bank and some
suggestions for recovery of NPA.
Malyadri and Sirisha (2011) this study examine the NPA of Public Sector banks and Private
sector banks of weaker sections for the period seven years in India. The secondary data compiled
from Report on Trends and Progress of Banking in India, 2004-10 which has been analyzed by

34
Journal of Management and Science ISSN: 2249-1260 | e-ISSN: 2250-1819 | Vol.5. No.1 | March’2015
statistical tool such as percentages and compound Annual Growth rate. This study reveals that the
public sector banks have achieved a greater penetration compared to the private sector banks.
Kaur and Saddy (2011) in the research paper entitled “A Comparative Study of Non-Performing
Assets of Public and Private Sector Banks” an attempt is made to clarify the concept of NPA, the
factors contributing to NPAs, the magnitude of NPAs, reasons for high NPAs and their impact on
Indian banking operations. Besides capital to risk weight age assets ratio of Public and Private sector
banks, management of credit risk and measures to control the threat of NPAs are also discussed.
Hosmani and Hudagi (2011) conducted study on “Unearthing the Epidemic of Non Performing
Assets with Reference to Public Sector Banks in India” an empirical and descriptive in nature which
shows the magnitude and trend of Public Sector banks in India and found that there is a slight
improvement in the asset quality reflected by decline in the diverse NPA percentage. The study
concluded that NPA is an important parameter for assessing financial performance of banks in terms
of profitability, liquidity and economies of scale in operation and banks has to take timely action
against degradation of good performing assets.
Meenakshi and Mahesh (2010) this exploratory paper examines the trends of NPAs at global level -
One interesting observation is that most of the countries that fall under the higher „NPA/Total Loan‟
ratio Category are in the Asian region & Also examine India from various magnitudes and also
identification of the problem & recovery mechanism to a great extent. It also show that NPA in the
priority sector is higher than non – priority sector. The paper also discusses the role of joint liability
groups (JLGs) or self help groups (SHGs) in enhancing the loan recovery rate.
6. OBJECTIVES OF THE STUDY
1. To study the concept, types, causes of Non Performing Assets (NPA) in Banks.
2. To analyze and interpret various NPA related ratios for aggregates of Public Sector, Private
Sector and Foreign Banks in India from 2009-2013.
3. To use Least Square method for projecting the amount of NPA in the year 2014 for Public
Sector, Private Sector and Foreign Banks in India and interpret the same.
4. To test that is there any significant differences between ratio of Gross NPA to Gross
Advances for aggregates of Public Sector, Private Sector and Foreign Banks in India from
2009-2013.
5. To summarize the findings derived from the study.
7. HYPOTHESIS
Null Hypothesis (H0): The Ratio of Gross NPA to Gross Advances for Public sector, Private Sector
and Foreign Banks does not differ significantly from the year 2009 to 2013
Alternate Hypothesis (H1): The Ratio of Gross NPA to Gross Advances for Public sector, Private
Sector and Foreign Banks differ significantly from the year 2009 to 2013
35
Journal of Management and Science ISSN: 2249-1260 | e-ISSN: 2250-1819 | Vol.5. No.1 | March’2015
8. METHODOLOGY OF STUDY
The Analysis in the paper is done on the total i.e. aggregate data starting from 2009 to 2013 for
making comparison between Public sector Banks, Private Sector Banks and Foreign Banks on the
overall basis. This helped us to derive the findings and conclusions -sector wise.
8.1 Population: Banking industry is taken for the study, where aggregate data related to NPA for
Public sector Banks, Private Sector Banks and Foreign Banks is used.
8.2 Research Design
Descriptive research design is used for the study
8.3 Data Collection
Data used in the paper is secondary, which is compiled from Reserve Bank of India (RBI) website,
and from review of Literature.
8.4 Data Analysis Tools
Tools include Ratio analysis, application of Least Square Method and use of SPSS.
8.5 Time- Period of the Paper
5year‟s Aggregate data from 2009 to 2013 is used for the study
9. ANALYSIS AND INTERPRETATION
9.1 Ratios Related to Non Performing Asset (NPA)
9.1.1 Total Gross NPA to Total Gross Advances

36
Journal of Management and Science ISSN: 2249-1260 | e-ISSN: 2250-1819 | Vol.5. No.1 | March’2015
Table 2: Total Gross NPA to Total Gross Advances (Rs In Billions) As on 31st
March
Bank Name Year Gross
NPAs
Total Gross
Advances Percent Share
Public Sector
Banks
2009 440.32 20,986.33 2.1
2010 572.93 25,124.39 2.28
2011 710.8 30,599.53 2.32
2012 1,124.89 35,503.89 3.17
2013 1,558.90 40,558.74 3.84
Private Sector
Banks
2009 168.9 5,200.77 3.25
2010 173.87 5,851.10 2.97
2011 179.75 7,329.53 2.45
2012 183.21 8,812.16 2.08
2013 199.92 10,466.65 1.91
Foreign Banks
2009 72.94 1,697.14 4.3
2010 71.28 1,674.39 4.26
2011 50.65 1,993.21 2.54
2012 62.92 2,347.32 2.68
2013 79.72 2,686.12 2.97
(Source: http://www.rbi.org.in/scripts/PublicationsView.aspx?id=15501)
9.1.1.1 Interpretation:
The Ratio of Gross NPA to Gross Advances for Public sector banks is increasing and decreasing
ratio of Private sector Banks, while the phenomenal decrease in ratio is observed for Foreign Banks
too, it can be seen the ratio in Private sector banks for 2012 and 2013 as compared to other banks is
less, showing the efforts taken by Private Banks.

37
Journal of Management and Science ISSN: 2249-1260 | e-ISSN: 2250-1819 | Vol.5. No.1 | March’2015
9.1.2 Sub Standard Advances to Total Gross Advances
Table 3. Sub Standard Advances to Total Gross Advances (Rs in Billions) As on 31st March
Bank Name Year Sub-Standard
Advances
Total Gross
Advances
Percent
Share
Public Sector Banks
2009 195.21 20,986.33 0.93
2010 276.85 25,124.39 1.1
2011 336.12 30,599.53 1.1
2012 603.76 35,503.89 1.7
2013 765.89 40,558.74 1.89
Private Sector
Banks
2009 105.27 5,200.77 2.02
2010 86.78 5,851.10 1.48
2011 44 7,329.53 0.6
2012 51.33 8,812.16 0.58
2013 58.54 10,466.65 0.56
Foreign Banks
2009 58.74 1,697.14 3.46
2010 49.3 1,674.39 2.94
2011 18.65 1,993.21 0.94
2012 20.78 2,347.32 0.89
2013 28.82 2,686.12 1.07
(Source: http://www.rbi.org.in/scripts/PublicationsView.aspx?id=15501)
9.1.2.1 Interpretation:
The Ratio of sub- standard advances to Gross Advances is showing increasing trend for Public
sectors against decreasing trend for Private sector Banks and also for Foreign Banks (except in
2013). Still the situation for Private Banks is better than other Banks, considering the ratio nearby 0.6
from three consecutive years starting from 2011.

38
Journal of Management and Science ISSN: 2249-1260 | e-ISSN: 2250-1819 | Vol.5. No.1 | March’2015
9.1.3 Doubtful Advances to Total Gross Advances
Table 4. Doubtful Advances to Total Gross Advances (Rs in Billions) As on 31st March
Bank Name Year Doubtful Advances Total Gross Advances Percent Share
Public Sector Banks
2009 207.08 20,986.33 0.99
2010 246.79 25,124.39 0.98
2011 319.55 30,599.53 1.04
2012 470.75 35,503.89 1.33
2013 734.85 40,558.74 1.81
Private Sector Banks
2009 50.18 5,200.77 0.96
2010 65.43 5,851.10 1.12
2011 107.36 7,329.53 1.46
2012 103.16 8,812.16 1.17
2013 110.69 10,466.65 1.06
Foreign Banks
2009 10.04 1,697.14 0.59
2010 14.41 1,674.39 0.86
2011 21.13 1,993.21 1.06
2012 22.32 2,347.32 0.95
2013 27.51 2,686.12 1.02
(Source: http://www.rbi.org.in/scripts/PublicationsView.aspx?id=15501)
9.1.3.1 Interpretation:
The Ratio of Doubtful advances to Gross Advances for Public, Private and Foreign Sector Banks is
showing increasing trend, while the ratio started decreasing since 2012 in case of Private Banks and
some reduction is also observed in 2012 for Foreign Banks. Overall the situation of Foreign Banks is
better against other Banks.

39
Journal of Management and Science ISSN: 2249-1260 | e-ISSN: 2250-1819 | Vol.5. No.1 | March’2015
9.1.4 Loss Advances to Total Gross Advances
Table 5. Loss Advances to Total Gross Advances (Rs in Billions) As on 31st March
Bank Name Year Loss Advances Total Gross Advances Percentage
Public Sector Banks
2009 38.03 20,986.33 0.18
2010 49.28 25,124.39 0.2
2011 55.14 30,599.53 0.18
2012 50.37 35,503.89 0.14
2013 58.15 40,558.74 0.14
Private Sector Banks
2009 13.45 5,200.77 0.26
2010 21.66 5,851.10 0.37
2011 28.39 7,329.53 0.39
2012 28.72 8,812.16 0.33
2013 30.69 10,466.65 0.29
Foreign Banks
2009 4.16 1,697.14 0.25
2010 7.57 1,674.39 0.45
2011 10.87 1,993.21 0.55
2012 19.82 2,347.32 0.84
2013 23.39 2,686.12 0.87
9.1.4.1 Interpretation:
The Ratio of Loss Advances to Gross Advances is showing increasing trend in case of Foreign Banks
and is fluctuating for Private Banks, while stabilized for Public Banks for 2012 & 2013. Overall it is
observed the ratio of loss advances to Gross advances is lesser in Public Banks against other Banks.
9.2 Least Square method
9.2.1 Use of Least Square Method for Predicting Gross NPAs for 2014
Table 6 Public Sector Banks
Year Y
Gross NPAs (Rs. Billions) X (Year - 2011) XY X
2
2009 440.32 -2 -880.64 4
2010 572.93 -1 -572.93 1
2011 710.8 0 0 0
2012 1,124.89 1 1124.89 1
2013 1,558.90 2 3117.8 4
4,407.84 2789.12 10

40
Journal of Management and Science ISSN: 2249-1260 | e-ISSN: 2250-1819 | Vol.5. No.1 | March’2015
n=5
Straight line Equation
y = a + b x
b= ΣXY / ΣX
2 = 278.912
a= Σy / n = 881.568
y = a + b x
y= 881.568 + 278.912 x
y 2014= 881.568 + 278.912(3)
y 2014 = Rs. 1718.304 Billion
9.2.1.1 Interpretation:
From the use of least square method the Gross NPA for Public Sector Banks will rise by Rs.
1718.304 Billion for the year 2014, which was 1,558.90 Billion for the year 2013.
9.2.2 Use of Least Square Method for Predicting Gross NPAs for 2014
Table 7 Private Sector Banks
Year Y
Gross NPAs (Rs. Billions) X (Year - 2011) XY X
2
2009 168.9 -2 -337.8 4
2010 173.87 -1 -173.87 1
2011 179.75 0 0 0
2012 183.21 1 183.21 1
2013 199.92 2 399.84 4
905.65 71.38 10
n=5
Straight line Equation
y = a + b x
b= ΣXY / ΣX
2 = 7.138
a= Σy / n = 181.13
y = a + b x
y= 181.13 + 7.138 x
y 2014= 181.13 + 7.138(3)
y 2014 = Rs. 202.544 Billion

41
Journal of Management and Science ISSN: 2249-1260 | e-ISSN: 2250-1819 | Vol.5. No.1 | March’2015
9.2.2.1 Interpretation:
From the use of least square method the Gross NPA for Private Sector Banks will rise by Rs.
202.544 Billion for the year 2014, which was 199.92 Billion for the year 2013.
9.2.3 Use of Least Square Method for Predicting Gross NPAs for 2014
Table 8 Foreign Banks
Year Y
Gross NPAs (Rs. Billions) X (Year - 2011) XY X
2
2009 72.94 -2 -145.88 4
2010 71.28 -1 -71.28 1
2011 50.65 0 0 0
2012 62.92 1 62.92 1
2013 79.72 2 159.44 4
337.51 5.2 10
n=5
Straight line Equation
y = a + b x
b= ΣXY / ΣX
2 = 0.52
a= Σy / n = 67.502
y = a + b x
y= 67.502+ 0.52 x
y 2014= 67.502 + 0.52(3)
y 2014 = Rs. 69.062 Billion
9.2.3.1 Interpretation:
From the use of least square method the Gross NPA for Foreign Banks will rise by Rs. 69.062
Billion for the year 2014, which was 79.72 Billion for the year 2013.
9.3 Analysis of Variance (ANOVA)
Table 9 Ratio of Total Gross NPA to Total Gross Advances
Year Public sector Bank Private sector Bank Foreign sector Bank
2009 2.1 3.25 4.3
2010 2.28 2.97 4.26
2011 2.32 2.45 2.54
2012 3.17 2.08 2.68
2013 3.84 1.91 2.97
42
Journal of Management and Science ISSN: 2249-1260 | e-ISSN: 2250-1819 | Vol.5. No.1 | March’2015
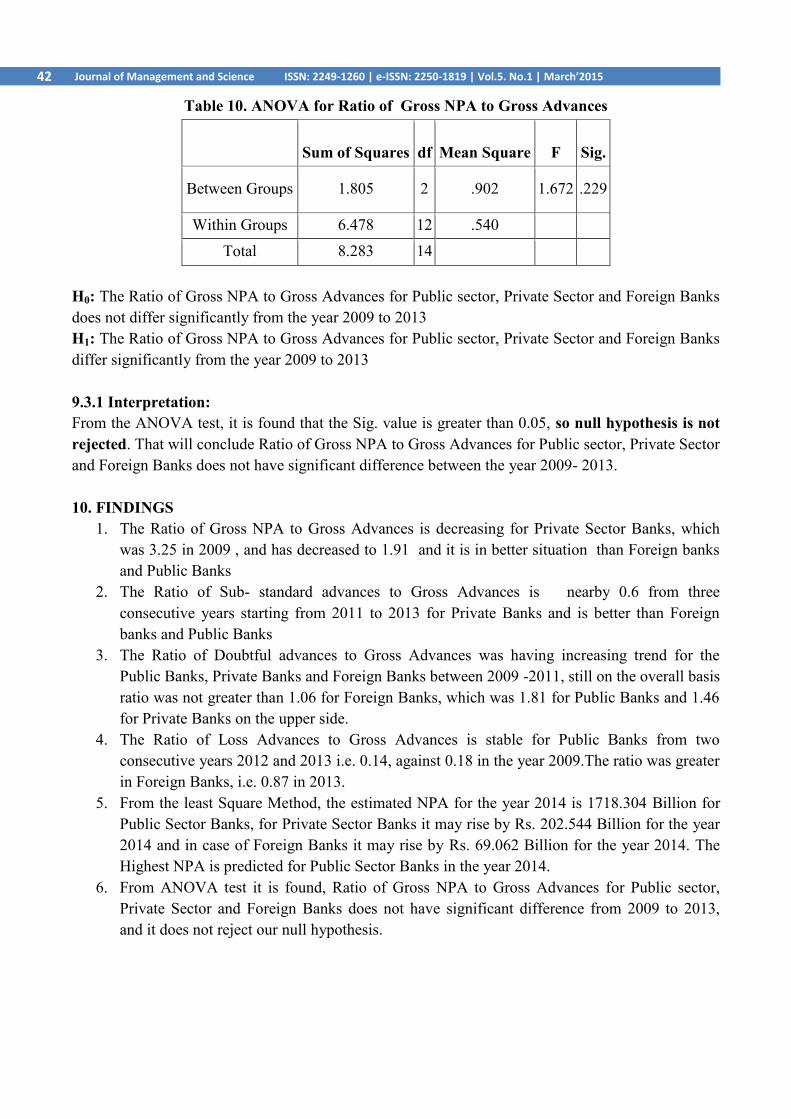
Table 10. ANOVA for Ratio of Gross NPA to Gross Advances
Sum of Squares df Mean Square F Sig.
Between Groups 1.805 2 .902 1.672 .229
Within Groups 6.478 12 .540
Total 8.283 14
H0: The Ratio of Gross NPA to Gross Advances for Public sector, Private Sector and Foreign Banks
does not differ significantly from the year 2009 to 2013
H1: The Ratio of Gross NPA to Gross Advances for Public sector, Private Sector and Foreign Banks
differ significantly from the year 2009 to 2013
9.3.1 Interpretation:
From the ANOVA test, it is found that the Sig. value is greater than 0.05, so null hypothesis is not
rejected. That will conclude Ratio of Gross NPA to Gross Advances for Public sector, Private Sector
and Foreign Banks does not have significant difference between the year 2009- 2013.
10. FINDINGS
1. The Ratio of Gross NPA to Gross Advances is decreasing for Private Sector Banks, which
was 3.25 in 2009 , and has decreased to 1.91 and it is in better situation than Foreign banks
and Public Banks
2. The Ratio of Sub- standard advances to Gross Advances is nearby 0.6 from three
consecutive years starting from 2011 to 2013 for Private Banks and is better than Foreign
banks and Public Banks
3. The Ratio of Doubtful advances to Gross Advances was having increasing trend for the
Public Banks, Private Banks and Foreign Banks between 2009 -2011, still on the overall basis
ratio was not greater than 1.06 for Foreign Banks, which was 1.81 for Public Banks and 1.46
for Private Banks on the upper side.
4. The Ratio of Loss Advances to Gross Advances is stable for Public Banks from two
consecutive years 2012 and 2013 i.e. 0.14, against 0.18 in the year 2009.The ratio was greater
in Foreign Banks, i.e. 0.87 in 2013.
5. From the least Square Method, the estimated NPA for the year 2014 is 1718.304 Billion for
Public Sector Banks, for Private Sector Banks it may rise by Rs. 202.544 Billion for the year
2014 and in case of Foreign Banks it may rise by Rs. 69.062 Billion for the year 2014. The
Highest NPA is predicted for Public Sector Banks in the year 2014.
6. From ANOVA test it is found, Ratio of Gross NPA to Gross Advances for Public sector,
Private Sector and Foreign Banks does not have significant difference from 2009 to 2013,
and it does not reject our null hypothesis.

43
Journal of Management and Science ISSN: 2249-1260 | e-ISSN: 2250-1819 | Vol.5. No.1 | March’2015
11. REFERENCES
[1] Narula, S., & Singla, M. (2014). Empirical Study on Non Performing Assets of Bank.
International Journal of Advance Research in Computer Science and Management
Studies,2(1), 194-199, retrieved on February 2nd 2015 from
www.ijarcsms.com/docs/paper/volume2/issue1/v2i1-0032.pdf
[2] Arora, N., & Ostwal, N. (2014). Unearthing the Epidemic of Non-Performing Assets: A
Study of Public and Private Sector Banks. Management Insight, 10(1), 47-52, retrieved on
February 3rd 2015 from www.inflibnet.ac.in/ojs/index.php/MI/article/download/2242/1847
[3] Srinivas, K. T. (2013). A Study on Non- Performing Assets of Commercial Banks in India.
International Monthly Refereed Journal of Research in Management & Technology, 2, 61-69,
retrieved on February 3rd 2015 from
http://www.abhinavjournal.com/images/Management_&_Technology/Dec13/10.pdf
[4] Sikdar, P., & Makkad, M. (2013). Role of Non Performing Assets in the Risk Framework of
Commercial Banks – A Study of Select Indian Commercial Banks. AIMA Journal of
Management & Research, 7(2/4), 1-19, retrieved on February 2nd 2015 from
https://apps.aima.in/ejournal_new/articlesPDF/PallabSikdar.pdf
[5] Olekar, R., & Talawar, C. (2012). Non Performing Assets Management in Karnatak Central
Co-operative Bank ltd. Dharawad, International Journal of Research in Commerce &
Management, 3(12), 126-130, retrieved on February 2nd 2015 from
http://ijrcm.org.in/download.php?name=ijrcm-1-vol-3_issue-12-art-
28.pdf&path=uploaddata/ijrcm-1-vol-3_issue-12-art-28.pdf
[6] Malyadri, P., & Sirisha, S. (2011). A Comparative Study of Non Performing Assets in Indian
Banking Industry. International Journal of Economic Practices and Theories, 1(2), 77-87,
retrieved on February 3rd
2015 from www.ijept.org/index.php/ijept/article/download/15/15
[7] Kaur, H., and Saddy, N. K. (2011). A Comparative Study of Non-Performing Assets of
Public and Private Sector Banks. International Journal of Research in Commerce &
Management, 2(9), 82-89, retrieved on February 2nd
2015 from
http://ijrcm.org.in/download.php?name=ijrcm-1-vol-2_issue-9-art
15.pdf&path=uploaddata/ijrcm-1-vol-2_issue-9-art-15.pdf.
[8] Hosmani, A.P., and Hudagi, J. (2011). Unearthing the Epidemic of Non-Performing Assets:
A Study with reference to Public Sector Banks in India. International Journal of
Multidisciplinary Research, 1 (8), 447-459, retrieved on February 2nd
2015 from
http://www.zenithresearch.org.in/images/stories/pdf/2011/Dec/zijmr/37_VOL%201_ISSUE8
_ZEN.pdf
[9] Meenakshi, R., and Mahesh, H. P. (2010). Banking Sector Reforms and NPA: A study of
Indian Commercial Banks. Institute for Social and Economic Change, 1-15 retrieved on
February 3rd
2015 from
http://www.isec.ac.in/WP%20252%20%20Meenakshi%20Rajeev%20and%20H%20P%20M
ahesh.pdf
*****