
A transformation of human operation approach to inform ...
20
Journal of Intelligent Manufacturing (2021) 32:201–220 https://doi.org/10.1007/s10845-020-01568-z A transformation of human operation approach to inform system design for automation Simon Micheler 1 · Yee Mey Goh 1 · Niels Lohse 1 Received: 15 March 2019 / Accepted: 28 March 2020 / Published online: 5 June 2020 © The Author(s) 2020 Abstract Design of automation system relies on experts’ knowledge and experience accumulated from past solutions. In designing novel solutions, however, it is difficult to apply past knowledge and achieve design right -first -time, therefore wasting valuable resources and time. SADT/IDEF0 models are commonly used by automation experts to model manufacturing systems based on the manual process. However, function generalisation without benchmarking is difficult for experts particularly for complex and highly skilled-based tasks. This paper proposes a functional task abstraction approach to support automation design specification based on human factor attributes. A semi-automated clustering approach is developed to identify key functions from an observed manual process. The proposed approach is tested on five different automation case studies. The results indicate the proposed method reduces inconsistency in task abstraction when compared to the current approach that relies on the experts, which are further validated against the solutions generated by automation experts. Keywords Task analysis · Human factors · Clustering · Task function · Process design · Automation · Manufacturing Introduction The current manufacturing sector is experiencing transfor- mational changes. New paradigms like Industry 4.0, Robotic and Autonomous Systems (RAS) and a decentralisation of decision-making driven by implementation of agent-based intelligent systems have the potential to significantly enhance the capabilities of manufacturing (Foresight 2013; Zhong et al. 2017). Adapting to technical challenges and skill short- ages is of crucial importance for modern manufacturing businesses to stay competitive in a globalised market (Sungur et al. 2016). A potential solution is through increasing the use of sensors to enhance flexibility and intelligence of automa- tion solutions in applications beyond repetitive, dangerous and traditional automation tasks, and decrease in the total cost of ownership. However, more efficient ways to support the implementation of automation into manufacturing busi- nesses are required in the context of Industry 4.0 (Yao et al. 2019; Kong et al. 2019). B Yee Mey Goh [email protected] 1 Intelligent Automation Centre, Wolfson School of Mechanical, Electrical and Manufacturing Engineering, Loughborough University, Loughborough, Leicestershire LE11 3TU, UK Many industries, particularly in the UK, have not embraced automation due to the uncertainty and difficulty to design solutions that are flexible and meet the current produc- tivity of manual processes. Root causes for feasibility related problems dealing with the automation of human tasks have been recognised (Bainbridge 1983; Reason 1987; Xiao et al. 1997), in particular related to the requirement for deep knowl- edge of the tasks for automation. (Goodrich and Boer 2003) stated “a lesson learned from process automation is that, in the absence of human factors consideration, even state-of- the-art technological systems can be more problematic than beneficial”. Part of the challenges is describing human tasks in a useful way as the basis for implementing automation (Everitt et al. 2015). The investigation of human factors is the subject of exten- sive research in complementary areas. Examples are the investigation of trust-through-transparency impact on per- formance (Oduor and Wiebe 2008) or the impact of system complexity on trust (Bailey and Scerbo 2007). Even though the analysis of human tasks for automation has been investi- gated, for example Caird-Daley et al. (2013), no reliable way to automatically abstract human tasks has been identified when decision-makers evaluate automation business cases. In this paper, a clustering-based approach is proposed to identify automation functions from a human task analysis 123
Transcript of A transformation of human operation approach to inform ...

Journal of Intelligent Manufacturing (2021) 32:201–220https://doi.org/10.1007/s10845-020-01568-z
A transformation of human operation approach to inform systemdesign for automation
Simon Micheler1 · Yee Mey Goh1 · Niels Lohse1
Received: 15 March 2019 / Accepted: 28 March 2020 / Published online: 5 June 2020© The Author(s) 2020
AbstractDesign of automation system relies on experts’ knowledge and experience accumulated from past solutions. In designingnovel solutions, however, it is difficult to apply past knowledge and achieve design right-first-time, therefore wasting valuableresources and time. SADT/IDEF0models are commonly used by automation experts tomodelmanufacturing systems based onthe manual process. However, function generalisation without benchmarking is difficult for experts particularly for complexand highly skilled-based tasks. This paper proposes a functional task abstraction approach to support automation designspecification based on human factor attributes. A semi-automated clustering approach is developed to identify key functionsfrom an observed manual process. The proposed approach is tested on five different automation case studies. The resultsindicate the proposed method reduces inconsistency in task abstraction when compared to the current approach that relies onthe experts, which are further validated against the solutions generated by automation experts.
Keywords Task analysis · Human factors · Clustering · Task function · Process design · Automation · Manufacturing
Introduction
The current manufacturing sector is experiencing transfor-mational changes. New paradigms like Industry 4.0, Roboticand Autonomous Systems (RAS) and a decentralisation ofdecision-making driven by implementation of agent-basedintelligent systems have the potential to significantly enhancethe capabilities of manufacturing (Foresight 2013; Zhonget al. 2017). Adapting to technical challenges and skill short-ages is of crucial importance for modern manufacturingbusinesses to stay competitive in a globalisedmarket (Sunguret al. 2016). A potential solution is through increasing the useof sensors to enhance flexibility and intelligence of automa-tion solutions in applications beyond repetitive, dangerousand traditional automation tasks, and decrease in the totalcost of ownership. However, more efficient ways to supportthe implementation of automation into manufacturing busi-nesses are required in the context of Industry 4.0 (Yao et al.2019; Kong et al. 2019).
B Yee Mey [email protected]
1 Intelligent Automation Centre, Wolfson School ofMechanical, Electrical and Manufacturing Engineering,Loughborough University, Loughborough, LeicestershireLE11 3TU, UK
Many industries, particularly in the UK, have notembraced automation due to the uncertainty and difficulty todesign solutions that are flexible andmeet the current produc-tivity of manual processes. Root causes for feasibility relatedproblems dealing with the automation of human tasks havebeen recognised (Bainbridge 1983; Reason 1987; Xiao et al.1997), in particular related to the requirement for deepknowl-edge of the tasks for automation. (Goodrich and Boer 2003)stated “a lesson learned from process automation is that, inthe absence of human factors consideration, even state-of-the-art technological systems can be more problematic thanbeneficial”. Part of the challenges is describing human tasksin a useful way as the basis for implementing automation(Everitt et al. 2015).
The investigation of human factors is the subject of exten-sive research in complementary areas. Examples are theinvestigation of trust-through-transparency impact on per-formance (Oduor and Wiebe 2008) or the impact of systemcomplexity on trust (Bailey and Scerbo 2007). Even thoughthe analysis of human tasks for automation has been investi-gated, for example Caird-Daley et al. (2013), no reliable wayto automatically abstract human tasks has been identifiedwhen decision-makers evaluate automation business cases.
In this paper, a clustering-based approach is proposed toidentify automation functions from a human task analysis
123

202 Journal of Intelligent Manufacturing (2021) 32:201–220
Bill of Materials Structured Analysis and Design Technique (IDEF0) Requirement Engineering Total Cost of Ownership,
Investment Costs,...
Standard Operating Procedure (SOP)
Demonstration
Hierarchical Task Analysis
Sub-Goal-Template (SGT)
Petri Nets, Markov Models
System Dynamics
Process Modelling Language
Design Structure Matrix
Cognitive Analysis
Technology Selection
Product Planning
Multi-Attribute Analysis
Database Approach
Program Evaluation and Review Technique, Graphical Process
Representation, …
Quality Function Deployment, Failure Mode and Effect Analysis,
ABC-Analysis, …
Integrational Risk, Complexity,...
Quality
Strategic Alignment
Non-Monetary Benefits
Human Factors
Process Modelling for Automation Determination and AssessmentHuman Task AnalysisInform
a�on flow
Fig. 1 Stages in automating a manual manufacturing process
enabling a more comprehensive and consistent specifica-tion of automation design for business case evaluation. Theunderlying assumption is that the automated solution is notnecessarily like the manual task due to different skills andcapabilities of humans and robots (de Winter and Dodou2014). Nevertheless, the ability to identify the functionsprovided by manual processes will enhance and widen thesolution search space in the early design phase prior to tech-nology selection.
The paper starts with a literature review (“Literaturereview” section) to identify the research gap and the method-ology (“Proposed method” section) describes how a func-tional abstraction of human tasks is developed and introducesthe proposed method before case studies are used to evalu-ate and compare the results to industrial experts’ solutions(“Results” section). Finally, the last section discusses andconcludes the paper reflecting on the contributions to theresearch topic (“Discussion and conclusions” section).
Literature review
Research in manufacturing automation has highlighted theneed to consider human factors (Goodrich and Boer 2003).The general process of automating a manufacturing processconsists of the creation of a process representation modelderived from a manual task to design and create a technicalsolution. Figure 1 summarises the current methods and toolsto support the automation design from the human task analy-sis to the evaluation and assessment. In this paper, the authorsassume an automation process would generically follow thedemonstrated stages:
1. Understanding the human task2. Formalising the process representation
3. Synthesising the process representation model forautomation
4. Evaluating the proposed automation solution
Starting with the collection of information about the humantask via a human task analysis (HTA), process representationmodels are used to formalise the production process. Thereview of literature suggests there is a disconnect due to aweak link between HTA performed by human factors expertsand process representation models typically constructed byengineers. Furthermore, the transition of a task analysis intothe process representation model is exposed to the expert’sinterpretation. A solution is then created by synthesising theprocessmodel to specify the appropriate automation solution,relying on the accuracy and completeness of the formalisedrepresentation.
Each of the steps in this process, as well as the overallprocess, may be conducted iteratively until a desired level ofusability is attained. However, iterations are expensive andtime consuming. The first three stages of this process arereviewed for the methods and tools used to date. The finalstage is an evaluation of the designed solution against thebusiness case, considering economic and other factors beforethe solution is commissioned. For brevity, the readers arereferred to other publications (Ketipi et al. 2014;Koulouriotisand Ketipi 2014) for more detail.
Human task analysis
Human factors has been studied widely in the manufacturingdomain but their focus is wide-ranging and not necessarilyon automation. For automation, the literature ranges fromapplications of artificial intelligence to automatically trans-fer human skills via demonstration to automation systems
123

Journal of Intelligent Manufacturing (2021) 32:201–220 203
Table 1 Efficiency, effectiveness and empirical evidence in task analysis research derived and extended from Crystal and Ellington (2004)
Perspective Technique Efficiency Effectiveness Evidence
Continuous Machine learning Task demonstration Works rather on action thanon process level
Zhao et al. (2016)
Learning from demo
Discrete Hierarchical task analysis(HTA)
Decompose complex tasksinto subtasks
Improves problemdiagnosis and useful forconcurrent operations
Sheperd (2005) and Annetand Stanton (2004)
Complex activities demandextensive hierarchyconstruction
Does not account forsystem dynamics
Discrete-elemental Sub-Goal Template (SGT) Builds upon HTA Improves the level of detail Ormerod et al. (1998)
Decompose tasks intoactions using elementalbuilding blocks
Irreproducible results due tolack of user expertisepossible
Cognitive Cognitive task analysis(CTA)
Defines a coherentknowledge representationof the domain beingstudied
Increases the understandingof cognitive aspects of thetask
Salmon et al. (2010)
Captures task expertise
Fails to fully incorporatelearning, contextual andhistorical factors
Humanist Activity theory Analyse the activity, not thetask, implying apotentially great increasein scope and complexity
Accounts for learningeffects
Kuutti (1995)
Requires in-depthknowledge of culture andsocial aspects
Extents scope of technology
Requires a high level ofabstraction
No disciplined set ofmethods
Difficult to applysystematically
Demanding Competency assessment Analyse the required workskills needed for a specifictask
Improves understanding ofthe workers’ skill setsneeded for a specific task.
Green et al. (2016), Perryand Helmschrott (2014)
Literacy, numeracy andproblem-solving skillsanalysed
Does not consider processorder
(Chuck et al. 2017) and automation component mapping,for example a humanoid task-component mapping (Hanaiet al. 2016). Other studies contribute towards the mentalassessment and strains on humans combined with relateddecision-making for automation (Caird-Daley et al. 2013).
In this paper, the focus will be on a comprehensive taskanalysis and decomposition informing later processes ofautomation. The current state-of-the-art covers task decom-position (Phipps et al. 2011) from a physical and mentalperspective. Other literature discusses the analysis of humantasks illustrating the importance of learning via demonstra-tion, the hierarchical task analysis (HTA), the Sub-Goal
Template (SGT), the Conceptual Task Analysis (CTA), andthe work-process and Program for the International Assess-ment of Adult Competencies (PIAAC) approach. Table 1summarises the efficiency and effectiveness for a selectionof commonly referred methods to date.
The automation research community recognised the issuerelated to the abstraction of tasks without losing substantialinformation. Some researchers have investigated the HTAand cognitive work analysis to produce a comprehensivepicture of manufacturing task analysis and present a vari-ety of different applications (Stanton 2006; Salmon et al.2010). The first approach by Phipps et al. (2011) extended the
123

204 Journal of Intelligent Manufacturing (2021) 32:201–220
HTA by adding cognitive elements of tasks and informationdesign requirements adding significant detail to the currentknowledge ofmanufacturing task analysis. Caird-Daley et al.(2013) executed a task decomposition based on an HTA tocapture physical and cognitive tasks to include the physicalanalysis for automation. Fasth-Berglund and Stahre (2013)confirmed the need to consider cognitive as well as a physi-cal task as part of the automation strategies for reconfigurableand sustainable systems. Based on an HTA analysis, Everittand Fletcher (2016) tackled the goal of a “robust, formal skillcapture for assessing the feasibility and implementation ofintelligent automation”. Their dual methodology approachcombines the existing HTA methodology with a classifica-tion system aimed to further increase the understanding ofwhat an automated solution might look like. They extendedthe analysis with human perception senses, and a specifictask classification, as well as a description of the decisions.
The research literature demonstrates the transfer of humantasks into automated tasks is essential. Yet, a transfer hasnot been achieved without substantial effort for the user incombination with a limited area of applications requiringdetailed domain knowledge (Wong and Seet 2017; Pedersenet al. 2016; Wantia et al. 2016). In short, Zhao et al. (2015)pointed out a knowledge gap, where the transition from anextended HTA process towards automation system design isstill missing.
Process representationmethod
A model is used to systematically represent the inner rela-tions and functions of a system in an abstract way, accordingto a certain perspective, and to reduce the complexity. Akey aspect of production research is the development ofprocess representation models. Numerous standard process-representationmodels have been developed. Existing processrepresentation models in manufacturing are divided into fourdifferent categories: production layout, production informa-tion, production schedule, and production optimisation:
• Production layout represents a category for process rep-resentation tools capturing the setup of the productionsystem. Models are used to describe the dimension of theproduction system, as well as skills and capabilities andthe components of the production system.
• Production information refers to the related models usedto provide information about the manufacturing system.Thesemodels often display requirements of the productionprocess. The process models can inform various aspectssuch as the representation of knowledge, dependenciesbetween tasks, or the workflow and value stream withinthe production system.
• Production scheduling describes a category of representa-tions for modelling the schedule of a production system.
The representations are used to provide information aboutthe time structure of a production process, the overlapwithin the production, as well as the transition from oneproduction moment to another. The results can later be fedinto optimisation tools or inform the design of the produc-tion system.
• Production optimisation methods are used to improve thecurrent situation by using a model that describes a pro-duction reality. An improvement of the situation can beachieved by predicting a future outcome, identifying bot-tlenecks, or optimising the service at production stations.
The current landscape of existing production representationmodels is analysed, and the outcomes are summarised inTable 2. The third column is provided to indicate whetherthe models will require the input of a task analysis, whichwas described in “Human task analysis” section.
The results presented in Table 2 indicate a lack of con-nection between the manual task analysis and the processrepresentation models. As evident from the table, many ofthese models do not require a task analysis to be completed,which suggests that the process models are usually made bythe opinion/understanding of engineers and not necessarilybased on observation of how the tasks are being performedby the operators. This is important in automation becauseany decisions/variations performed by the operators that isnot captured in the process models will be missed whenspecifying automation solution. Therefore, for a successfultranslation of a human task into an automation solution, thisgap needs to be overcome.
Automation design specification
Four common ways are generally used to specify automa-tion systems, namely requirements engineering, databaseapproaches, technology selection, and generic design mod-els. Requirements engineering is the development of anautomation system based on anticipated requirements fromthe previous manual production process (Kaindl et al. 2009).The basis of this production process is an observation ofrequirements. The requirements can be recorded or extracteddifferently like, for example, via demonstration or require-ments analysis as well as a via a combination with processrepresentation models (Park et al. 2009). Examples forrequirements engineering can be found throughout the liter-ature related to design and architecture for holistic solutions(Hegenberg et al. 2012), functional requirements for recon-figurability andflexibility (Boschi et al. 2016), vision systems(Sitte and Winzer 2007), or software testing (Chung andHwang 2007). Database approaches have been used toimprove the design of automation solutions driven by CADand composite structural data (Mayer et al. 1992; Huntenet al. 2013; Sanders et al. 2016). The overall use of multi-
123

Journal of Intelligent Manufacturing (2021) 32:201–220 205
Table 2 Process representation models
Process representation model Abbrev. Task analysis required Productionlayout
Productioninformation
Productionschedule
Productionoptimisation
Control theory models CTM (Ragazzini and Bergen1954)
No
Goals, operators, methods,selection
GOMS Yes/No
HAMSTERS HAMSTERS No
Task (-RELATED)KNOWLEDGE STRUCTure
TKS (Johnson et al. 1988) Yes/No
Signposting SP (Clarkson and Hamilton2000)
No
Activity Networks (Flowcharts, PERT) (Kelley Jrand Walker 1959)
No
Activity/phase overlapping AO, PO (Krishnan et al. 1997) No
Generalised precedencerelation
GPR (Elmaghraby andKamburowski 1992)
No
Graphical evaluation andreview technique
GERT (Pritsker 1966) No
Petri nets PN (Zhou 1995) No
Markov models MM (Doltsinis et al. 2014) No
System dynamics SD (Forrester 1997) No
Design structure matrix DSM (Radice et al. 1985) Yes/No
Structured analysis and designtechnique
SADT, IDEF0 (Ross andSchoman 1977)
Yes
Business process modelling BPM (White and I B M Corp.2005)
Yes/No
Input-process-output,entry-task-validation-exit
IPO, ETVX (Radice et al.1985)
Yes/No
Process grammars/languages UML,SysML, YAWL,… (RyoHanai et al. 2012)
Yes/No
Value stream mapping VSM No
Queuing theory No
Research aim ESDS Yes
123

206 Journal of Intelligent Manufacturing (2021) 32:201–220
Fig. 2 Applied methodology
attribute analysis in the context of technology selection is adecision-making support based onmultiple criteria. Formostof the models, the criteria may also be qualitative or subjec-tive. The number of multi-criteria decision-making tools hassteadily increased since the last decades and commonly usedapproaches include the Analytic Hierarchy Process (AHP),Analytic Network Process (ANP), and the Weighted SumModel (WSM) (Roy 1968; Ketipi et al. 2014; Koulouriotisand Ketipi 2014). Other generic design methods that can beused for the system design can be found in the tools Qual-ity Function Deployment (QFD), Failure Mode and EffectsAnalysis (FMEA) and Activity Based Costing (ABC) anal-ysis to select different processes for manufacturing based oncost, quality and risk aspects (Hassan et al. 2010). Thesemethods require robust input information from the processrequirements.
Summary
Although significant progress has been made regarding theanalysis of a production task, the issue of transferring andmapping of human tasks against automation has not yetbeen tackled sufficiently. Several authors have contributedto the decomposition of human tasks and adding detail tothe HTA. However, the additional detail were reliant onthe experts leading to a higher variance and reduced repro-ducibility (Sheperd 2005). The problem is a reliable andsystematic transfer of the qualitative human factors intorequirements engineering. One could envisage the automa-tion of the task analysis, using technology such as trackingand activity recognition (Rude et al. 2018), could be per-formed in the future. Therefore, the identified research gap inmanufacturing literature is to provide an approach to bridgethe gap between task analysis and the automation systemdesign based on the identified task functions. The next sectionpresents themethodology adopted in this paper to address thecurrent knowledge gap.
Proposedmethod
The methodology presented in Fig. 2 is used to develop theapproach to bridge the gap between the manual task anal-ysis and automation system design. The authors propose asemi-automated approach using a clustering algorithm toclassify and map the manufacturing tasks against automa-tion functions. More specifically, after the analysis of human
Table 3 HTA example—welding case study reported by Sanchez-Salas(2016)
HTA level Process hierarchy level
1 Setup Process
1.1 Select filler rod Task with 1 operation
1.2Set up welding torch Task with 4 operations
1.2.1 Select electrode Operation
1.2.2 Grand tip of the electrode Operation
1.2.3 Select collet and ceramic nozzle Operation
1.2.4 Assemble torch Operation
1.3 Prepare the parent metal for welding Task
1.3.1 Remove grinding leftovers Operation
1.3.2 Setup welding pieces in a weldingfixture
Operation
… …
2 Simulate laying a weld Process
2.1 Place foot on foot pedal, and depress Task with 1 operation
2.2 Put on gloves Task with 1 operation
… …
tasks, the paper presents a classification scheme allowing taskbreakdown from a process to be mapped against automationfunctions. Those functions can later be linked to automationcomponents.
Hierarchical task analysis (HTA)
For each case study, multiple methods currently used forthe decomposition of human tasks are combined. The initialinput to the proposed approach is a hierarchical task analysis(HTA) as presented in Table 3. The table shows a fraction ofthe task analysis for the welding case study (the full opera-tional structure is shown in Table 5). The task is decomposedinto operations performed during a manufacturing process.At the same time, the operations are sorted with respect totime in a chronological manner starting with the first task(only operations are used in the clustering process in “Clus-tering” section).
The data structure established of the operation analysis isshown in Fig. 3, based on a defined decomposition structure.The hierarchical task structures of five case studies presentedin “Results” section are used initially and extended to includethe different SGT elements based on Ormerod et al. (1998).Every operation is labelledwith a name and a specific sequen-tial ID. The operation contains not only physical actions but
123

Journal of Intelligent Manufacturing (2021) 32:201–220 207
Operation
- LogisticProcess: Boolean-OperationName: String<< Sequence ID>>-OperationNumber: int
CognitiveOperation PhysicalOperation
- BodypartsNumber: int
CognitiveAction(Tool)
- CTTNumber: int
PhysicalAction(LeftHand)PhysicalAction(RightHand)
- SubGoalTemplateCode: string
PTRNumber: int
- CTParameter: string- CTSense: string- SubGoalTemplateCode: string<< SequenceID>>
CognitiveAction(Object)
- CTTNumber: int
- CTParameter: string- CTSense: string- SubGoalTemplateCode: string<< SequenceID>> <<SequenceID>>
- SubGoalTemplateCode: string<<SequenceID>>PTRNumber: int
• Cognitive Sense • Cognitive Parameter• Cognitive Action
• Physical Action
Task
-TaskName: String
<< Sequence ID>>-TaskNumber: int
Fig. 3 Extended HTA data structure for operation analysis
also cognitive actions performed during amanufacturing pro-cess. The cognitive activity is related to the object or the tool,whereas the physical activity is related to specific multiplebody parts.
After the HTA is performed on the process, the clusteringalgorithm is applied to identify the task functions.
Clustering
The application of clustering is to create task functions basedon a HTA. The necessary requirement to enable clustering isa database to represent specific operation attributes of a spe-cific action. Those attributes should be used to differentiateamong dissimilar task functions. Before the clustering algo-rithm can be applied, however, a decision had to be madeon the granularity as well as the factors of interest for theapplication. In this case, the clustering algorithm is abstract-ing manufacturing functions to define automation solutions.Therefore, a classification scheme is developed based onexisting standards and the existing literature to attribute theprocess operations.
Classification scheme
The first task in developing a classification scheme is toidentify existing classifications to enable a structured sep-aration of manufacturing operations. At this point, differentattributes according to the current literature of human factorsare feasible for the classification process. For the application
of a classification in this paper, the author has selected man-ufacturing attributes to create a functional task abstraction.
A careful analysis of the environment in this case has ledthe authors to the DIN8580 standard, which is (numerically)followed by other more specific standards. The applicationcategories represent sub-levels of the manufacturing maincategories joining, forming, etc. presented in DIN 8580.It is noted that the presented manufacturing classificationconsiders physical manufacturing operations only. Support-ing operations related to the perception mechanisms (visualperception, haptic feedback) are not covered in the relatedclassification.
Hence, the authors have extended the existingmanufactur-ing classification standards with perception mechanisms. Acombination of research by Groover (2007) with Ledermanand Klatzky (1987) informed the classification scheme. Thefirst adapted part by Groover presents a categorisation ofvisual perception mechanisms for robotic automation. Thesecond part incorporated the research by Lederman et al.focuses on the tactile perceptionof the humans. In accordancewith their findings, a classification containing multiple per-ception attributes for a specific operation has been developed.The result is a combination of tactile and visual perceptionsenses as a decision criterion to identify the required sensorialrequirements (see Fig. 4). Examples of resulting operationattributes are Visual Perception Object Shape or Tactile Per-ception Temperature.
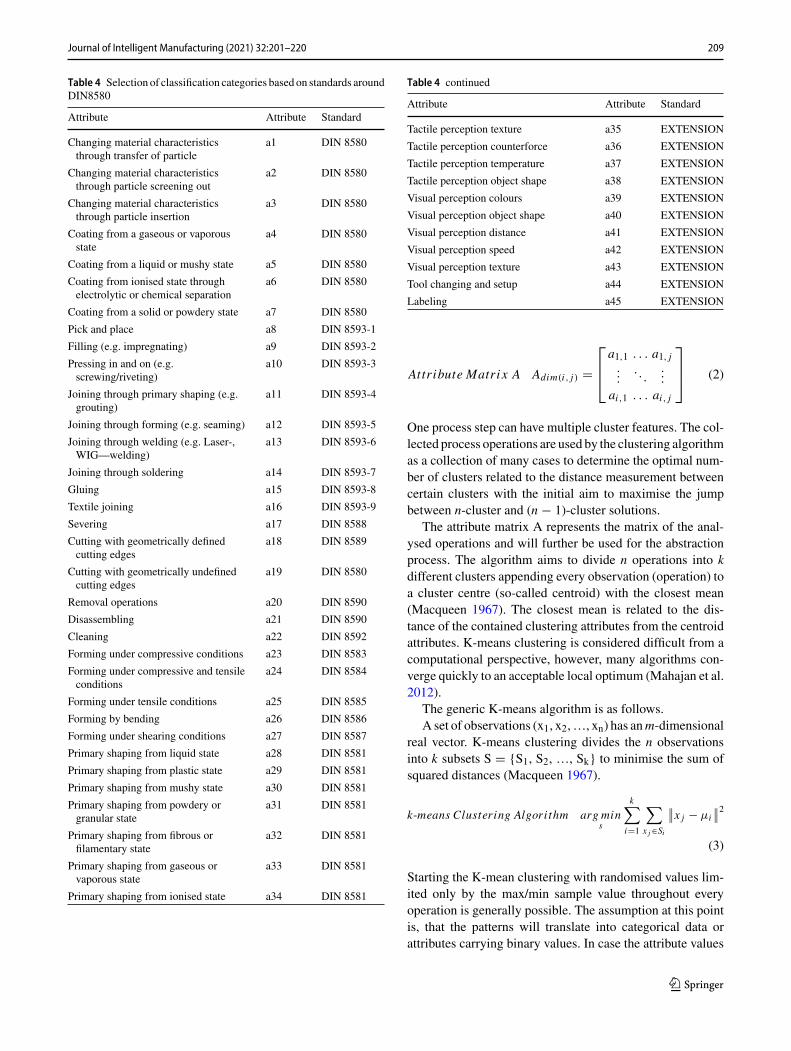
Table 4 presents the detailed developed classification usedfor this work. As it can be seen it demonstrates both percep-
123

208 Journal of Intelligent Manufacturing (2021) 32:201–220
Human Task Derived Parameter Automated Mechanism ATTRIBUTE
Lateral Mo�onLateral Mo�on
Pressure
Sta�c Contact
Contact Measurement
Non-contact measurement
Contact Measurement
Contact Measurement
Visual Percep�on Texture
Tac�le Percep�on Texture
Tac�le Percep�on Counterforce
Non-contact measurement
Tac�le Percep�on Temperature
Contour Following
Op�cal
Tac�le Percep�on Object Shape
Visual Percep�on Object Shape
Non-op�cal Use of other energy sources
Lateral Mo�onTexture
Counterforce
Temperature
Object Shape
Visual Percep�on Colors
Contact Measurement
Human Eye Colours
Object Shape
Distance
Speed
Non-contact measurementNon-contact
measurementNon-contact
measurementNon-contact
measurement
Visual Percep�on ColorsVisual Percep�on Object
ShapeVisual Percep�on Distance
Visual Percep�on Speed
Texture Non-contact measurement Visual Percep�on Distance
AccelerometerContact measurement
Fig. 4 Tactile and visual perception senses as extension for DIN8580
tional and operational classification for the identification ofautomation functions.
Clustering for automated function identification
The manufacturing classification against the operation asmany-to-many relationship is expressed by binary variables.One operation can have multiple attributes and one attributecan be connected to multiple operations. Consequently, adatabase is created. The user will identify the attributes forevery operation as depicted in Table 5 for welding case study(see “Results” section).
The user will enter as many different attributes to theman-ufacturing operations as the HTA requires. Every operationmust be fully determined with the physical and perceptionalattributes defined in the classification scheme. One operationcan require multiple attributes for an operation. An example
is grinding tip of the electrode operation (Operation 1.2.2)performed by an operator. In reality, the grinding operationis not just determined by an attribute responsible for grind-ing (cutting with geometrically undefined cutting edges), butalso requires human-haptic feedback to control the produc-tion process (auxiliary operation).
For every process operation i recorded via the HTA anal-ysis, the process attribute aij related to the manufacturingclassification attribute j is represented as a binary value.
Process Attribute ai, j ai, j ∈ {0, 1} (1)
The binary value expresses, whether the specific process stepincorporates operations that fulfil the criteria/pattern of a spe-cific distribution of attributes. The different process attributesresult in an attributematrixA,which can be created as a resultof the previous Eq. (1):
123
Journal of Intelligent Manufacturing (2021) 32:201–220 209
Table 4 Selection of classification categories based on standards aroundDIN8580
Attribute Attribute Standard
Changing material characteristicsthrough transfer of particle
a1 DIN 8580
Changing material characteristicsthrough particle screening out
a2 DIN 8580
Changing material characteristicsthrough particle insertion
a3 DIN 8580
Coating from a gaseous or vaporousstate
a4 DIN 8580
Coating from a liquid or mushy state a5 DIN 8580
Coating from ionised state throughelectrolytic or chemical separation
a6 DIN 8580
Coating from a solid or powdery state a7 DIN 8580
Pick and place a8 DIN 8593-1
Filling (e.g. impregnating) a9 DIN 8593-2
Pressing in and on (e.g.screwing/riveting)
a10 DIN 8593-3
Joining through primary shaping (e.g.grouting)
a11 DIN 8593-4
Joining through forming (e.g. seaming) a12 DIN 8593-5
Joining through welding (e.g. Laser-,WIG—welding)
a13 DIN 8593-6
Joining through soldering a14 DIN 8593-7
Gluing a15 DIN 8593-8
Textile joining a16 DIN 8593-9
Severing a17 DIN 8588
Cutting with geometrically definedcutting edges
a18 DIN 8589
Cutting with geometrically undefinedcutting edges
a19 DIN 8580
Removal operations a20 DIN 8590
Disassembling a21 DIN 8590
Cleaning a22 DIN 8592
Forming under compressive conditions a23 DIN 8583
Forming under compressive and tensileconditions
a24 DIN 8584
Forming under tensile conditions a25 DIN 8585
Forming by bending a26 DIN 8586
Forming under shearing conditions a27 DIN 8587
Primary shaping from liquid state a28 DIN 8581
Primary shaping from plastic state a29 DIN 8581
Primary shaping from mushy state a30 DIN 8581
Primary shaping from powdery orgranular state
a31 DIN 8581
Primary shaping from fibrous orfilamentary state
a32 DIN 8581
Primary shaping from gaseous orvaporous state
a33 DIN 8581
Primary shaping from ionised state a34 DIN 8581
Table 4 continued
Attribute Attribute Standard
Tactile perception texture a35 EXTENSION
Tactile perception counterforce a36 EXTENSION
Tactile perception temperature a37 EXTENSION
Tactile perception object shape a38 EXTENSION
Visual perception colours a39 EXTENSION
Visual perception object shape a40 EXTENSION
Visual perception distance a41 EXTENSION
Visual perception speed a42 EXTENSION
Visual perception texture a43 EXTENSION
Tool changing and setup a44 EXTENSION
Labeling a45 EXTENSION
Attribute Matri x A Adim(i, j) �⎡⎢⎣a1,1 . . . a1, j...
. . ....
ai,1 . . . ai, j
⎤⎥⎦ (2)
One process step can have multiple cluster features. The col-lected process operations are used by the clustering algorithmas a collection of many cases to determine the optimal num-ber of clusters related to the distance measurement betweencertain clusters with the initial aim to maximise the jumpbetween n-cluster and (n − 1)-cluster solutions.
The attribute matrix A represents the matrix of the anal-ysed operations and will further be used for the abstractionprocess. The algorithm aims to divide n operations into kdifferent clusters appending every observation (operation) toa cluster centre (so-called centroid) with the closest mean(Macqueen 1967). The closest mean is related to the dis-tance of the contained clustering attributes from the centroidattributes. K-means clustering is considered difficult from acomputational perspective, however, many algorithms con-verge quickly to an acceptable local optimum (Mahajan et al.2012).
The generic K-means algorithm is as follows.A set of observations (x1, x2,…, xn) has anm-dimensional
real vector. K-means clustering divides the n observationsinto k subsets S � {S1, S2, …, Sk} to minimise the sum ofsquared distances (Macqueen 1967).
k-means Clustering Algori thm arg mins
k∑i�1
∑x j∈Si
∥∥x j − µi∥∥2
(3)
Starting the K-mean clustering with randomised values lim-ited only by the max/min sample value throughout everyoperation is generally possible. The assumption at this pointis, that the patterns will translate into categorical data orattributes carrying binary values. In case the attribute values
123

210 Journal of Intelligent Manufacturing (2021) 32:201–220
Table 5 Process attribute matrix for human operation analysis—welding
Operation name; attributes → # Joiningthroughwelding
Cutting withgeometricallyundefinedcutting edges
Pick and place Tool changingand setup
Visualinspection
Visualperceptiondistance
1.1 Select filler rod 1 0 0 0 1 0 0
1.2.1 Select electrode 2 0 0 0 1 0 0
1.2.2 Grind tip of the electrode 3 0 1 0 0 0 0
1.2.3 Select collet and ceramicnozzle
4 0 0 0 1 0 0
1.2.4 Assemble torch 5 0 0 0 1 0 0
1.3.1 Remove grindingleftovers
6 0 1 0 0 0 0
1.3.2.1 Place based on holderon bench
7 0 0 1 0 0 0
1.3.2.2 Attach gas supply 8 0 0 0 1 0 0
1.3.2.3 Secure welding piece 9 0 0 1 0 0 0
2.1 Place foot on foot pedal,and depress
10 1 0 0 0 0 0
2.2 Put on gloves 11 1 0 0 0 0 0
2.3 Hold torch in right handusing pen grip
12 1 0 0 0 0 0
2.4 Hold filler rod in left hand 13 1 0 0 0 0 0
2.5 Move torch and filler rod 14 1 0 0 0 0 0
2.6 Adjust equipment position 15 0 0 0 0 0 1
2.7 Remove objects impedingmovement
16 0 0 1 0 0 0
3.1.1 Set and turn on power atthe welding set
17 1 0 0 0 0 0
3.1.2 Turn on gas at the gascylinder
18 1 0 0 0 0 0
3.1.3 Put on welding mask(visor raised)
19 1 0 0 0 0 0
3.2.1 Position torch at tacklocation
20 1 0 0 0 0 1
3.2.2 Pull down visor 21 1 0 0 0 0 0
3.2.3 Pick up and position fillerrod
22 1 0 0 0 0 0
3.2.4 Fully depress foot pedal 23 1 0 0 0 0 0
3.2.5 Dip filler rod in centre ofthe weld pool
24 1 0 0 0 0 0
3.2.6 Remove rod 25 1 0 0 0 0 0
3.2.7 Gradually release footpedal
26 1 0 0 0 0 0
4.1 Position torch at weld start 27 1 0 0 0 0 1
4.2 Pick up and position fillerrod
28 1 0 0 0 0 0
4.3 Fully depress foot pedal 29 1 0 0 0 0 0
4.4.1 Stroke filler rod in andout of weld pool
30 1 0 0 0 0 0
4.4.2 Feed filler rod through thefingers
31 1 0 0 1 0 0
123

Journal of Intelligent Manufacturing (2021) 32:201–220 211
Table 5 continued
Operation name; attributes → # Joiningthroughwelding
Cutting withgeometricallyundefinedcutting edges
Pick and place Tool changingand setup
Visualinspection
Visualperceptiondistance
4.5 Control torch movement 32 1 0 0 0 0 1
4.6 Modulate current 33 1 0 0 0 0 0
4.7 Control foot pedal 34 1 0 0 0 0 0
5.1 Take off equipment 35 1 0 0 1 0 0
5.2 Turn off power and gassupply
36 0 0 0 1 0 0
5.3 Remove welding platesfrom piece holder
37 0 0 1 0 0 0
5.4.1 Visually inspect topsurface of weld
38 0 0 0 0 0 1
5.4.2 Visually inspect undersurface of weld
39 0 0 0 0 0 1
are all binary, the identity matrix Ij,n can be used to representthe starting centroids for the clustering process to advancethe centroid handling algorithm explained in detail in thefollowing paragraph.
Centroid Matri x C Cdim( j,n) �
⎡⎢⎢⎢⎢⎢⎣
1 0 00 1 00 0 1
. . . 0
.... . .
...0 . . . 1
⎤⎥⎥⎥⎥⎥⎦
� I j,n
(4)
K-means minimises the distance between the centroids cj,nand the attribute matrix by manipulating the centroid matrixC to reduce the distance vector Dopt values over all distances.The following functions show a detailed description of thesteps needed to achieve the aim of Eq. (3).
Distance di,n di,k �(
i∑(ai,k − c j,k
)2)1/2
(5)
The distance matrix D can be expressed according to thefollowing equation:
Distance Matri x D D �⎡⎢⎣d1,1 . . . d1,k...
. . ....
di,1 . . . di,k
⎤⎥⎦ (6)
Table 6 depicts an example of a distance matrix for the weld-ing case study.
The created distancematrix can nowbe optimised in awaythat the distances are being minimised for different sizes ofk. The value k represents the number of different cluster-centres used. The optimal solution creates a distance vector
Dopt, which can beminimised using the sumof distances. Theoptimised distances in the previous table are marked by a (*).The distance vector represents the smallest distance of everycolumn distance (di,1, …, di,n) according to the followingequation.
Minimum Distance min Dopt min Dopt �n∑
i�1
(min1≤k≤n
di,k
)
(7)
The results of the equation are the minimum distances ofdifferent centroids. Table 7 shows different accumulated dif-ferences for specific k.
Five different centroids are used to cluster the existingsample. An increase of the cluster number k leads to anoverrepresentation of centroids as the distances convergeto zero. A comparison of the distances is an indication ofthe k-effectiveness. Once the distances are all zero for k,the centroids are purely a representation of all the singlecases available (in terms of attribute distribution) and did notachieve the goal of reducing the dimension of the operation.
A possible solution to address this issue is a selection ofan optimal k via an investigation of the distances betweenmin Dopt . As seen in Table 7, the optimal distances can besummarised to understand how well a specific number ofcentroids k covers the attribute vectors of the created attributematrix A. Two criteria should be respected for the evaluationof a suitable cluster number k:
• Firstly, k cannot be chosen in a way that allows the pro-duction of a trivial solution. A trivial solution means theselection of different cluster centroids k reproducing theoriginal operations. Such an approach would not effec-tively reduce or cluster the operations.
123

212 Journal of Intelligent Manufacturing (2021) 32:201–220
Table 6 Distance matrix (k�5)—example welding Distances d1 d2 d3 d4 d5
1.1 Select filler rod 1.4142 1.4142 1.4142 0* 1.4142
1.2.1 Select electrode 1.4142 1.4142 1.4142 0* 1.4142
1.2.2 Grind tip off the electrode 1.4142 0* 1.4142 1.4142 1.4142
… 1.4142 1.4142 1.4142 0* 1.4142
… 1.4142 1.4142 1.4142 0* 1.4142
1* 1 1 1 1
1.4142 1.4142 1.4142 0* 1.4142
1.7321 1.7321 1* 1.7321 1
0* 1.4142 1.4142 1.4142 1.4142
… 0* 1.4142 1.4142 1.4142 1.4142
5.4.2 Visually inspect under surface 0* 1.4142 1.4142 1.4142 1.4142
Table 7 Minimum distancematrix DOpt—welding casestudy
Minimum distance Min2 Min3 Min4 Min5 … … Min n
1.1 Select filler rod 1.4142 1.4142 0 0 … 0 0
1.2.1 Select electrode 1.4142 1.4142 0 0 … 0 0
1.2.2 Grind tip of the electrode 0 0 0 0 … 0 0
… 1.4142 1.4142 0 0 … 0 0
… 1.4142 1.4142 0 0 … 0 0
… 1 1 1 1 … 1 0
… 1.4142 0 0 0 … 0 0
… 1.4142 1.4142 0 0 … 0 0
… 1.7321 1 1 1 … 1 0
… 0 0 0 0 … 0 0
… … … … … … … …
… … … … … … … …
… … … … … … … …
… … … … … … … …
… 1.4142 1.4142 1.4142 1.4142 … 0 0
… 1.4142 0 0 0 … 0 0
… 0 0 0 0 … 0 0
… 0 0 0 0 … 0 0
… 1.4142 1.4142 1.4142 1.4142 … 1.4142 0
… … … … … … … …
Sum 25.945 20.971 13.899* 12.485 … 6.8284 0
• Secondly, k should be pointing out the biggest ‘jump’ inthe sum of optimal distances related to the chosen attributematrix and cluster number k.
As seen in Table 7, the accumulated optimal distancesdecrease with a growing k. However, a rapid decrease ofthe optimised distance vector at a specific time is noticeable.This step points to several clusters significantly reducing thedistance to the dataset’s attribute distribution. The centroidsindicate the main characteristics of the dataset. The next stepconsiders the biggest jump in the optimised solution.
In this case, the biggest jump occurs for the optimal num-ber of cluster centroids k � 4 (Table 7, the largest differencebetweenmin Dopt from k� 3 to k� 4). Particularly the deter-mination of k is a research field itself. The authors havemodified the Bayes Information Criterion (BIC) idea to finda possible solution to the depicted problem. The presentedsolution shows sufficient results for the application. Differentreasons are responsible for that:
• Firstly, an HTA generally has a dataset length (number ofoperations) considerably smaller than what is considereda large dataset in the data analysis community.
123

Journal of Intelligent Manufacturing (2021) 32:201–220 213
Table 8 Hierarchical task structure and allocated centroid—weldingexample
HTA structure Allocated centroid Sequential helper
1.1 Select filler rod 4 Keep
1.2.1 Select electrode 4 Keep
1.2.2 Grind tip of theelectrode
2 Keep
1.2.3 Select collet andceramic nozzle
4 Keep
… … …
2.4 Hold filler rod in lefthand
1 Keep
2.6 Adjust equipmentposition
1 Keep
2.7 Remove objectsimpeding movement
3 Keep
… … …
• Secondly, the attribute values are binary (ai,j � {0,1}) and,therefore, the created distances will be in similar dimen-sions and do not require a manipulation of the dataset.
• Thirdly, the number of different attributes accumulatedwithin operations is limited.
A combination of those factors reduces the number of casesin all dimensions of the dataset and the minimum distancessignificantly. For the case studies, the presented criterion wasproven to deliver sufficient results, as reported in “Results”.
The determination of a specific k, representing the numberof centroids, enables the allocation of specific attribute distri-butions to a specific cluster centre. Based on this distribution,a table (see for example Table 10) can be created present-ing the percentage distribution of manufacturing attributeswithin the clusters. The clusters identified will be assignedas a process function.
The deliverable for this part of the work is a functionaltask abstraction. Based on the functional task abstraction,where specific manufacturing operation attributes have beenallocated to specific centroids.
Before the results of the clusters can be finally demon-strated, the user must also determine whether the specificprocesses can be allocated in a specific cluster consider-ing sequential criteria. If a process must be performed afteranother process (for instance grinding on different scales),sequential information must be provided. Therefore, the useris asked to answer for every process step, whether specificoperations should be allocated in a stand-alone function dueto a sequential importance or it should be kept in the existingcluster (“Keep”, see Table 8). This step allows the tool toshow the final process function considering sequential con-straints.
Results
The proposed approachwas tested on five industry processes,detailed descriptions of the cases studies can be found in thecited literature in Table 9. All of them are currently manualprocesses that are being considered for automation by thecompanies motivated by efficiency, skill shortage, flexibilityand quality. The advanced automation solutions require sen-sors and intelligence to deal with process variabilities dueto the highly skilled nature of the tasks. All studies wererecorded and the HTA and IDEF0 representations were pro-duced by the researchers for those processes.
IDEF0 results
First, the IDEF0 results are presented (see Fig. 5) before theresults from the clustering algorithms are displayed in thenext section. The IDEF0 have been produced by researchers
Table 9 Advanced automationcase studies requiring in-depthtask analysis
Case study Description DIN 8580 Main investigator
Welding MIG welding Joining throughwelding
Sanchez-Salas (2016)
Grinding Grinding and polishingof complex-shapedsurfaces
Cutting withgeometricallyundefined cuttingedges
Kalt et al. (2016) andKalt (2016)
Beater winding Production process ofdrum beaters
Textile joining Zhao et al. (2016)
Threaded fastenerassembly
Automated freeformassembly of threadedfasteners
Assembly Dharmaraj (2015)
Deburring Removing defects/burrsfrom manufacturedparts
Cutting withgeometricallyundefined cuttingedges
Sanchez-Salas (2016)
123

214 Journal of Intelligent Manufacturing (2021) 32:201–220
WELDING
GRINDING
DEBURRING
A1
A10
Part Inspec�on and Tool Setup
A1
A13
Welding
A1
A13
Final Inspec
Safety Standards
Part
Standard
Operating
Procedures
Tool
Post-processing
Proceed
A1
A11
Posi�oning of Workpiece
A1
A12
Posi�oning of Welding
Equipment
Operator
A1
A11
Grinding
A2
A21
Visual Inspec
A0
A01
Visual InspecPart
Standard Operating Procedure
Safety Standards
2D/3DVision
Abrasive Belt
Controller
Multi-Axis Force/Torque
SensorRobotic
Controller
Tool Changer
A1
A11
Winding
A1
A12
Secure Top Bo�om
S�tching
A1
A13
Pa�ern S�tching
Safety
Standards
Part
Standard
Operating
Procedures
Operator
Fin
ish
ed
Pa
rt
Equipment
Proceed
BEATER WINDING
Fin
ish
ed
Pa
rt
Fin
ish
ed
Pa
rt
THREADED FASTNER ASSEMBLY
A1
A11
Setup
A1
A12
Approach and
Alignment
A1
A13
Fastening
Safety
Standards
Part
Standard
Operating
Procedures
Operator
Fin
ish
ed
Pa
rt
Equipment
Proceed
A1
A11
Inspec�on and Setup
A1
A12
Deburring
Safety
Standards
Part
Standard
Operating
Procedures
Operator
Fin
ish
ed
Pa
rt
Equipment
Proceed
Fig. 5 SADT/IDEF0 results from experts
123

Journal of Intelligent Manufacturing (2021) 32:201–220 215
Table 10 Clustering results—welding
Processfunction
Joiningthroughwelding (%)
Cutting withgeometricallyundefinedcutting edge(%)
Pick and place(%)
Tool changingand setup (%)
Visualperceptiontexture (%)
Visualperceptiondistance (%)
Automationfunction
1 100 0 0 25 100 100 Welding +inspection
2 0 100 0 0 0 0 Grinding
3 0 0 100 0 0 0 Pick and place
4 0 0 0 75 0 0 Tool changer
Table 11 Clustering results—grinding
Process function Cutting withgeometricallyundefined cuttingedge (%)
Visual perceptiontexture (%)
Pick and place (%) Tactile perception(%)
Tool changingand setup (%)
Automationfunction
1 100 0 0 100 20 Grinding
2 0 100 0 0 0 Visual inspection
3 0 0 100 0 0 Object orientation
4 0 0 0 0 80 Tool changer
Table 12 Clustering results—beater winding
Processfunction
Textile joining(%)
Pick and place(%)
Tool changing(%)
Visualperceptiontexture (%)
Tactileperception (%)
Cutting withgeometricallydefined cuttingedge (%)
Automationfunction
1 100 0 0 100 0 100 Sewing
2 0 100 0 0 100 0 Threadwinding
3 0 0 100 0 0 0 Tool changer
Table 13 Clustering results—threaded fastener assembly
Process Function Pressing in andon (%)
Pick and place (%) Tool changingand setup (%)
Visual perceptiondistance (%)
Visual perceptionobject shape (%)
Automationfunction
1 100 0 0 50 20 Fastening
2 0 100 0 50 80 Pick and place
3 0 0 100 0 0 Tool changer
who studied the processes for automation, which is the cur-rent and widely adopted approach.
Clustering results
The clustering results are presented as a percentage distri-bution of individual attributes among different process func-tions for the operations identified in the HTA. In Tables 10,11, 12, 13 and 14, the process functions (identified clusters)are displayed on the left-hand side and the manufacturingprocess attributes on top of the table. The manufacturing
process attributes are as defined in Table 4, which could beexpanded for customised attributes as appropriate to the pro-cess.
Analysis and validation
Table 15 compares the functional abstraction with IDEF0produced by the experts, clustering results and with theactual solutions implemented in the original case studies.The results for each case study are discussed in turn next.
123

216 Journal of Intelligent Manufacturing (2021) 32:201–220
Table 14 Clustering results—deburring
Processfunction
Cutting withgeometri-callyundefinedcuttingedges (%)
Tactileperceptiontexture (%)
Tactileperceptionobject shape(%)
Visualperceptionobject shape(%)
Visualperceptiontexture (%)
Visualperceptiondistance (%)
Toolchangingand setup(%)
Cleaning (%) Automationfunction
1 100 0 0 20 20 100 0 100 Grinding
2 0 100 100 40 40 0 0 0 Visual–tactilecontrol
3 0 0 0 40 40 0 0 0 Visualcontrol
4 0 0 0 0 0 0 100 0 Tool changer
Table 15 Comparison of clustering and IDEF0—results summary
Process Manual abstraction (IDEF0) Clustering Actual solution
Welding 5 functions (preparation � toolsetup, positioning, positioning 2,welding, inspection)
4 functions (welding + inspection,grinding, pick and place, toolchanger)
4 functions (welding, inspection,tool setup, pick and place)
Grinding 3 functions (part geometryfollowing + visual detection, beltfeed rate control + grinding &force/torque, visual inspection)
4 functions (grinding withforce/torque sensor, visualinspection, object orientation,tool changer)
2 function (auto-grinding + withmanipulator force/torque sensorand gripper, part inspection)
Beater winding 3 functions (winding, secure topbottom stitching, patternstitching)
3 functions (stitching, customisedprocess � winding, tool changing
3 functions (stitching, winding,tool changing)
Threaded fastener assembly 3 functions (approach andalignment, fastener insertion,torque control)
3 functions (auto-fastening, pickand place, tool changer)
3 functions (auto-fastening, pickand place, tool changer)
Deburring 2 functions (selection of tool � toolsetup, removing � deburring)
4 functions (grinding, visual–hapticprocess control, visual inspection,tool changer)
Not-automated (–)
Welding
The welding process was divided by the automation expertinto 5 different functions (Fig. 5), whereas the clusteringalgorithm has identified 4 key functions (Table 10). The algo-rithm clustered welding (100%) and inspection (100% fortexture and distance) into one function. A grinding processwas identified as a function (Function 2) because in the man-ual process (and the HTA) the tip of the welding tool wasground by the operator. This step does not occur in the actualautomation solution. Despite this, the 4 functions identifiedfrom clustering algorithmwere accurate. The IDEF0methoddivided the process functions in a repetitive pattern of toolpreparation and setup but visual inspection and grinding thewelding tip were neglected by the experts.
Grinding
Thegrindingprocesswasmanually abstracted into 5 differentfunctions (Fig. 5), in contrast to 4 according to the cluster-ing algorithm (Table 11). The clustering algorithm combines
cutting with a geometrically undefined cutting edge (100%)with a tactile force perception (100%) and a tool chang-ing attribute (20%). The second function contains a visualperception of the part surface/texture (100%). The turningof the workpiece in between the grinding processes wasattributed to the pick and place function (100%). The remain-ing function is related to a tool changing attribute (80%).The automation system implemented consists of a grindingapplication (abrasive belt) and a separate gripper containingthe force/torque sensor element. In addition to that, a visualinspection system was suggested although not implemented.The tool changer was not needed as the actual solution doesnot require a change of the abrasive belt, due to a differenttype of component and it was only a prototype solution. Thetactile feedback of force and torquewas allocated to the grip-ping system since commercial grippers typically come withforce and torque sensors.
123

Journal of Intelligent Manufacturing (2021) 32:201–220 217
Beater winding
The beater winding process was manually translated into 3different functions (Fig. 5). The clustering algorithm alsoproduces 3 functions (Table 12). The first function containsthree attributes: textile joining (100%), visual perception ofthe texture (100%), and cutting with a geometrically definedcutting edge for the thread (100%). This function can beinterpreted as the sewing function of the process. The secondfunction contains the attribute for pick and place (100%)extended by ameasuring device for the counterforce based ontactilemeasurements. This function represents thewindingofthe thread. After the winding process is finished, the operatorused to cover winding gaps in the pattern. This results in avisual inspection to identify the texture and correct the errors.To switch between both functions, a tool changer has beenidentified in function 3. However, the clustering algorithmhas attributed the visual inspection to the sewing function.
Threaded fastener assembly
The results for threaded fastener assembly process were sim-ilar fromboth the expert (Fig. 5) and the algorithm (Table 13).The expert identified approach and alignment, which wasidentified by the clustering algorithm as the pick and placefunction. The process function included 100% of the pickand place attribute as well as 50% of visual determination ofa distance and 80% of the visual perception to recognise anobject shape. The fastening function (Function 1) accumu-lated the remaining visual shares (distance and object shape)and 100% of the ‘pressing in and on’ attributes. The remain-ing percentages were connected to the tool changer. Thistool changer is used to switch from a pick and place to a fas-tening process function. The auto-fastening function includeboth insertion and torque control, which were identified bythe experts as separate functions.
Deburring
The deburring process has not been automated. A possiblereason was due to the complexity of the automated solution.This complexity is not specifically indicated by the manualprocess abstraction (Fig. 5). The manual process abstractionidentified three different functions. The functions are a selec-tion of the appropriate tool and the deburring process. Theclustering algorithm results (Table 14), however, indicate thata complex tool is needed requiring a visual–haptic processcontrol and a decoupled visual inspection process after that.Those two automation functions require an in-depth knowl-edge and indicate a high complexity from a programmingperspective.
Discussion and conclusions
Twomajor limitations associatedwith the current approachesin automation requirements engineeringwere identified. Firstof all, approaches related to manual task analysis processeshave been criticised throughout the current literature as unre-liable (Olsen and Shorrock 2010) and highly influenced bythe level of expertise of the analyst (Sheperd 2005). Secondly,the way a task is fulfilled by a human operator might differhighly from the way that the automation system performsthe task. Consequently, the method proposed in this paperassumes that a comparison and mapping must take place ona functional level leading to the research aim to provide anapproach to bridge the gap between task analysis and theautomation system design based on the identified task func-tions.
The clustering algorithm overcomes the influence of anHTA hierarchy as perceived by the expert, which overcomesthe chronological structure and sequential dependenciesunless indicated of the task performance. This means that anattribute of themanufacturing process could be allocated, fol-lowing the determination of its nearest centroid, independentof the HTA hierarchy thus reducing the expert’s influence inthe function allocation process. The results indicate that theclustering algorithm achieves the goal of a functional taskabstraction and, in some of the cases, the functions identi-fied through the clustering algorithm are closer to the optimalfunctions required in the actual automation solution.
Based on this functional task abstraction, the issuewhereby the functions performed by automation may dif-fer from the manual process is addressed by separating themapping of HTA to functional task abstraction to automa-tion requirements (Fig. 6). Amapping between the functionalabstraction and requirements engineering can be produced tocomplete the requirements engineering,which is a subject forfuture work. One possible approach is using an ontology tomatch functional requirements with the skill set of a specificautomation system, see Lohse (2006).
These findings are comparable with the earlier findings,for example Everitt et al. (2015) highlighting the functionalapproach (Bullock et al. 2013) related to a robotic manipula-tor as very practical.More detail, in contrast to that, increasesthe chance of human deviation and, therefore, decreases therepeatability and quality of a task analysis.
Due to the complexity of the individual case studies, onlykey parts of the results have been presented in this paper.Therefore, the HTA being used in the case studies presentedhere are reduced for testing the clustering algorithm and itis possible that some iterations were not being captured.An important basis for the method to be transitioned intoindustrial applications would involve elaborate testing withmultiple observations to avoid missing key process informa-tion.
123

218 Journal of Intelligent Manufacturing (2021) 32:201–220
Fig. 6 Mapping from HTA tofunctions to requirementsengineering HTA Func�ons
abstrac�on Automa�on skill
set Clustering algorithm
Ontology
Acknowledgements The authors acknowledge support from theEPSRC Centre for Innovative Manufacturing in Intelligent Automa-tion in undertaking this research work under Grant Reference No.EP/IO33467/1.
Compliance with ethical standards
Conflict of interest The authors declare no conflict of interest is arisingfrom the submitted publication.
Open Access This article is licensed under a Creative CommonsAttribution 4.0 International License, which permits use, sharing, adap-tation, distribution and reproduction in any medium or format, aslong as you give appropriate credit to the original author(s) and thesource, provide a link to the Creative Commons licence, and indi-cate if changes were made. The images or other third party materialin this article are included in the article’s Creative Commons licence,unless indicated otherwise in a credit line to the material. If materialis not included in the article’s Creative Commons licence and yourintended use is not permitted by statutory regulation or exceeds thepermitted use, youwill need to obtain permission directly from the copy-right holder. To view a copy of this licence, visit http://creativecommons.org/licenses/by/4.0/.
References
Annet, J., & Stanton, N. A. (2004). Task analysis. In J. Annett & N. A.Stanton (Eds.), Taylor & Francis E-Library 2004. London: Taylor& Francis.
Bailey, N. R., & Scerbo, M. W. (2007). Automation-induced compla-cency for monitoring highly reliable systems: The role of taskcomplexity, system experience, and operator trust. TheoreticalIssues in Ergonomics Science, 8(4), 321–348. https://doi.org/10.1080/14639220500535301.
Bainbridge, L. (1983). Ironies of automation. Automatica, 19(6),775–779. https://doi.org/10.1016/0005-1098(83)90046-8.
Boschi, F., Zanetti, C., Tavola, G., & Taisch, M. (2016). Functionalrequirements for reconfigurable and flexible cyber-physical sys-tem. In IECON proceedings (industrial electronics conference)(pp. 5717–5722). https://doi.org/10.1109/IECON.2016.7794018.
Bullock, I. M., Ma, R. R., & Dollar, A. M. (2013). A hand-centricclassification of human and robot dexterous manipulation. IEEETransactions on Haptics, 6(2), 129–144. https://doi.org/10.1109/TOH.2012.53.
Caird-Daley, A., Fletcher, S., & Baker, W. (2013). Automating humanskills: Preliminary development of a human factors methodologyto capture tacit cognitive skills. In 11th International Conferenceon Manufacturing Research (ICMR2013) (pp. 288–295). Cran-field University Press.
Chuck, C., Laskey, M., Krishnan, S., Joshi, R., Fox, R., & Goldberg,K. (2017). Statistical data cleaning for deep learning of automa-tion tasks from demonstrations. In IEEE international conferenceon automation science and engineering (pp. 1142–1149). Xi’an,China: IEEE. https://doi.org/10.1109/COASE.2017.8256258.
Chung, Y. K., & Hwang, S.-M. (2007). Software testing for intelligentrobots. In 2007 international conference on control, automationand systems (pp. 2344–2349). https://doi.org/10.1109/ICCAS.2007.4406752.
Clarkson, P. J., & Hamilton, J. R. (2000). Design ‘signposting’,A parameter-driven task-based model of the design process.Research in Engineering Design, 12(1), 18–38.
Crystal, A., & Ellington, B. (2004). Task analysis and human-computerinteraction: Approaches, techniques, and levels of analysis. InAMCIS 2004 Proceedings (vol. 391).
deWinter, J. C. F., & Dodou, D. (2014). Why the Fitts list has persistedthroughout the history of function allocation. Cognition, Technol-ogy & Work, 16(1), 1–11. https://doi.org/10.1007/s10111-011-0188-1.
Dharmaraj, K. (2015). Automated freeform assembly of threaded fas-teners. Loughborough: Loughborough University.
Doltsinis, S., Ferreira, P., & Lohse, N. (2014). An MDP model-basedreinforcement learning approach for production station ramp-upoptimization: Q-learning analysis. IEEETransactions on Systems,Man, and Cybernetics: Systems, 44(9), 1125–1138. https://doi.org/10.1109/TSMC.2013.2294155.
Elmaghraby, S. E., & Kamburowski, J. (1992). The analysis of activitynetworks under generalized precedence relations (GPRs). Man-agement Science, 38, 1245–1263. https://doi.org/10.1287/mnsc.38.9.1245.
Everitt, J., & Fletcher, S. (2016). Theoretical issues in ergonomicsscience task analysis of discrete and continuous skills: A dualmethodology approach to human skills capture for automation.Theoretical Issues inErgonomics Science, 16(5), 513–532. https://doi.org/10.1080/1463922X.2015.1028508.
Everitt, J., Fletcher, S., & Caird-Daley, A. (2015). Task analysis ofdiscrete and continuous skills: A dual methodology approachto human skills capture for automation. Theoretical Issues inErgonomics Science, 16(5), 513–532. https://doi.org/10.1080/1463922X.2015.1028508.
Fasth-Berglund, Å., & Stahre, J. (2013). Cognitive automation strategyfor reconfigurable and sustainable assembly systems. AssemblyAutomation, 33(3), 294–303. https://doi.org/10.1108/AA-12-2013-036.
Foresight. (2013). The future of manufacturing: A new era of opportu-nity and challenge for the UK Summary report. The GovernmentOffice for Science, Project Report, London.
Forrester, J. W. (1997). Industrial dynamics. Journal of the Opera-tional Research Society, 48(10), 1037–1041. https://doi.org/10.1057/palgrave.jors.2600946.
Goodrich, M. A., & Boer, E. R. (2003). Model-based human-centeredtask automation: A case study inACC system design. IEEETrans-actions on Systems, Man, and Cybernetics Part A: Systems andHumans, 33(3), 325–336. https://doi.org/10.1109/TSMCA.2003.817040.
Green, F., Felstead, A., Gallie, D., & Henseke, G. (2016). Skills andwork organisation in Britain: A quarter century of change. JLabour Market Res, 49, 121–132. https://doi.org/10.1007/s12651-016-0197-x.
Groover, M. P. (2007). Automation, production systems, and computerintegrated manufacturing. Edited by Pearson Education India.Prentice Hall. Tsinghua: Pearson Education India. https://doi.org/10.1108/aa.2009.03329dae.001.
123

Journal of Intelligent Manufacturing (2021) 32:201–220 219
Hanai, R., Saito, H., Nakabo, Y., Fujiwara, K., Ogure, T., Mizuguchi,D., et al. (2012). RT-component based integration for IEC61508ready system using SysML and IEC61499 function blocks. In2012 IEEE/SICE international symposium on system integration,SII 2012 (pp. 105–110). https://doi.org/10.1109/SII.2012.6426952.
Hanai, R., Suzuki, H., Nakabo, Y., & Harada, K. (2016). Modelingdevelopment process of skill-based system for human-like manip-ulation robot. Advanced Robotics, 30(10), 676–690. https://doi.org/10.1080/01691864.2016.1156575.
Hassan, A., Siadat, A., Dantan, J., & Martin, P. (2010). Roboticsand computer-integrated manufacturing conceptual process plan-ning—An improvement approach using QFD, FMEA, and ABCmethods. Robotics and Computer Integrated Manufacturing,26(4), 392–401. https://doi.org/10.1016/j.rcim.2009.12.002.
Hegenberg, J., Cramar, L., & Schmidt, L. (2012). Task- and user-centered design of a human–robot system for gas leak detec-tion: from requirements analysis to prototypical realization. InIFACProceedings Volumes (IFAC-PapersOnline) (Vol. 45). IFAC.https://doi.org/10.3182/20120905-3-HR-2030.00076.
Hunten, K. A., Feeney, A. B., & Srinivasan, V. (2013). Recentadvances in sharing standardized STEP composite structuredesign and manufacturing information. CAD Computer AidedDesign, 45(10), 1215–1221. https://doi.org/10.1016/j.cad.2013.05.001.
Johnson, P., Johnson, H., Waddington, R., & Shouls, A. (1988).Task-related knowledge structures : Analysis, modelling andapplication. In BCS HCI 2001 (pp. 35–62).
Kaindl, H., Arnautovic, E., Ertl, D., & Falb, J. (2009). Iterativerequirements engineering and architecting in systems engineer-ing. InProceedings of the 4th international conference on systems,ICONS 2009 (pp. 216–221). https://doi.org/10.1109/ICONS.2009.33.
Kalt, E. (2016).Development of an integrated robotic polishing system.Loughborough: Loughborough University. https://doi.org/10.1115/1.2757629.
Kalt, E., Monfarad, R. P., & Jackson, M. R. (2016). Towards an auto-mated polishing system—Capturingmanual polishing operations.International Journal of Research inEngineering andTechnology,05(07), 182–192.
Kelley Jr, J. E, & Walker, M. R. (1959). Critical-path planning andscheduling. Papers Presented at the December 1–3, 1959, East-ern Joint IRE-AIEE-ACM computer conference (pp. 160–173).https://doi.org/10.1145/1460299.1460318.
Ketipi, M. K., Koulouriotis, D. E., & Karakasis, E. G. (2014). Robotevaluation and selection part B: A comparative analysis. Interna-tional Journal of Advanced Manufacturing Technology, 71(5–8),1395–1417. https://doi.org/10.1007/s00170-013-5526-4.
Kong, X. T. R., Luo, H., Huang, G. Q., & Yang, X. (2019). Indus-trialwearable system:Thehuman-centric empowering technologyin industry 4.0. Journal of Intelligent Manufacturing, 30(8),2853–2869. https://doi.org/10.1007/s10845-018-1416-9.
Koulouriotis, D. E., & Ketipi, M. K. (2014). Robot evaluation andselection part A: An integrated review and annotated taxonomy.International Journal of Advanced Manufacturing Technology,71(5–8), 1371–1394. https://doi.org/10.1007/s00170-013-5525-5.
Krishnan, V., Eppinger, S. D., Whitney, D. E., Krishnan, V., Eppinger,S.D.,&Whitney,D. E. (1997).Amodel-based framework to over-lap product development activities. Management Science, 43(4),437–451.
Kuutti, K. (1995). Activity theory as a potential framework forhuman–computer interaction research. Context and Conscious-ness: Activity Theory and Human-Computer Interaction, 17–44.
Lederman, S. J., & Klatzky, R. L. (1987). Hand movements: A win-dow into haptic object recognition. Cognitive Psychology, 19(3),342–368. https://doi.org/10.1016/0010-0285(87)90008-9.
Lohse, N. (2006). Towards an ontology framework for the integrateddesign of modular assembly systems. System.
Macqueen, J. (1967). Some methods for classification and analysis ofmultivariate observations. InProceedings of the fifthBerkeley sym-posium on mathematical statistics and probability (pp. 281–297).Berkeley: University of California Press.
Mahajan, M., Nimbhorkar, P., & Varadarajan, K. (2012). The pla-nar—means problem is NP-Hard. Theoretical Computer Science,442, 13–21. https://doi.org/10.1016/j.tcs.2010.05.034.
Mayer, R. J., Chuan Jun, S., & Keen, A. K. (1992). An IntegratedManufacturing Planning Assistant—IMPA. Journal of IntelligentManufacturing, 3(2), 109–122. https://doi.org/10.1007/BF01474750.
Oduor, K. F., & Wiebe, E. N. (2008). The effects of automated deci-sion algorithm modality and transparency on reported trust andtask performance. In Proceedings of the 52nd human factors andergonomics society annual meeting (pp. 302–306).
Olsen, N. S., & Shorrock, S. T. (2010). Evaluation of the HFACS-ADFsafety classification system: Inter-coder consensus and intra-coderconsistency. Accident Analysis and Prevention, 42(2), 437–444.https://doi.org/10.1016/j.aap.2009.09.005.
Ormerod, T. C., Richardson, J., & Shepherd, A. (1998). Enhancing theusability of a task analysis method: A notation and environmentfor requirements specification. Ergonomics, 41(11), 1642–1663.https://doi.org/10.1080/001401398186117.
Park, J. L., Jin, H. S., Kim, K. H., & Kim, J. J. (2009). A study onreal-time progress management system modeling using goal &scenario based requirements engineering. In ICCIT 2009—4thinternational conference on computer sciences and convergenceinformation technology (pp. 262–265). https://doi.org/10.1109/ICCIT.2009.281.
Pedersen, M. R., Nalpantidis, L., Andersen, R. S., Schou, C., Krueger,V., & Madsen, O. (2016). Robot skills for manufacturing:From concept to industrial deployment. Robotics and Computer-Integrated Manufacturing, 37, 282–291. https://doi.org/10.1016/j.rcim.2015.04.002.
Perry, A., &Helmschrott, S. (2014).User guide for the German PIAACScientific Use File (Vol. 23).
Phipps, D. L., Meakin, G. H., & Beatty, P. C. W. (2011). Extend-ing hierarchical task analysis to identify cognitive demands andinformation design requirements. Applied Ergonomics, 42(5),741–748. https://doi.org/10.1016/j.apergo.2010.11.009.
Pritsker, B. (1966). Graphical evaluation and review technique. RM-4973-NASA (Vol. RM-4973-NA). Washington DC.
Radice, R. A., Roth, N. K., O’Hara, A. C., & Ciarfella, W. A. (1985). Aprogramming process architecture. IBM Systems Journal, 24(2),79–90.
Ragazzini, J. R., & Bergen, A. R. (1954). A mathematical techniquefor the analysis of linear systems. Proceedings of the IRE, 71,1645–1651.
Reason, J. (1987). Cognitive aids in process environments: Prosthesesor tools? International Journal ofMan-Machine Studies, 27(5–6),463–470. https://doi.org/10.1016/S0020-7373(87)80010-X.
Ross, D. T., & Schoman, K. E. (1977). Structured analysis for require-ments definition. IEEE Transactions on Software Engineering SE,3(1), 6–15. https://doi.org/10.1109/TSE.1977.229899.
Roy,B. (1968).Classement etChoixEnPrésence dePoints deVueMul-tiples. RAIRO Operations Research Recherche Opérationnelle,2(V1), 57–75.
Rude, D. J., Adams, S., & Beling, P. A. (2018). Task recognition fromjoint tracking data in an operational manufacturing cell. Journalof Intelligent Manufacturing, 29(6), 1203–1217. https://doi.org/10.1007/s10845-015-1168-8.
123

220 Journal of Intelligent Manufacturing (2021) 32:201–220
Salmon, P., Jenkins, D., Stanton, N., & Walker, G. (2010). Hierar-chical task analysis vs. cognitive work analysis: Comparison oftheory, methodology and contribution to system design. Theoreti-cal Issues in Ergonomics Science, 11(6), 504–531. https://doi.org/10.1080/14639220903165169.
Sanchez-Salas,A. (2016).A framework to support automation inmanu-facturing through the study of process variability. Loughborough:Loughborough University.
Sanders, A., Elangeswaran, C., & Wulfsberg, J. (2016). Industry 4.0implies lean manufacturing: Research activities in industry 4.0function as enablers for lean manufacturing. Journal of IndustrialEngineering and Management, 9(3), 811–833. https://doi.org/10.3926/jiem.1940.
Sheperd, A. (2005). Hierarchical task analysis. In Taylor & FrancisE-Library 2005. Vol. e-Book. London: Taylor & Francis. https://doi.org/10.1017/CBO9781107415324.004.
Sitte, J., & Winzer, P. (2007). Methodic design of robot vision sys-tems. In Proceedings of the 2007 IEEE international conferenceon mechatronics and automation, ICMA 2007 (pp. 1758–1763).https://doi.org/10.1109/ICMA.2007.4303816.
Stanton, N. A. (2006). Hierarchical task analysis: Developments, appli-cations, and extensions. Applied Ergonomics, 37(1 SPEC. ISS.),55–79. https://doi.org/10.1016/j.apergo.2005.06.003.
Sungur, C. T., Breitenbücher, U., Leymann, F., & Wieland, M. (2016).Context-sensitive adaptive production processes. Procedia CIRP,41, 147–152. https://doi.org/10.1016/j.procir.2015.12.076.
Wantia, N., Esen, M., Hengstebeck, A., Heinze, F., Rossmann, J.,Deuse, J., & Kuhlenkoetter, B. (2016). Task planning for humanrobot interactive processes. In IEEE international conference onemerging technologies and factory automation, 2016 (Vol. 21,pp. 1–8). IEEE.
White, S., & I B M Corp. (2005). Using BPMN to model a BPELprocess. Business, 3(March), 1–18.
Wong, C. Y., & Seet, G. (2017). Workload, awareness and automationin multiple-robot supervision. International Journal of AdvancedRobotic Systems, 14(3), 1–16. https://doi.org/10.1177/1729881417710463.
Xiao, Y., Milgram, P., & John Doyle, D. (1997). Planning behavior andits functional role in interactions with complex systems. IEEETransactions on Systems, Man, and Cybernetics Part A: Systemsand Humans, 27(3), 313–324. https://doi.org/10.1109/3468.568740.
Yao, X., Zhou, J., Lin, Y., Li, Y., Yu, H., & Liu, Y. (2019). Smart man-ufacturing based on cyber-physical systems and beyond. Journalof Intelligent Manufacturing, 30(8), 2805–2817. https://doi.org/10.1007/s10845-017-1384-5.
Zhao,Y. C., Al-Yacoub,A., Goh,Y.M., Justham, L., Lohse, N.,& Jack-son, M. R. (2016). Human skill capture: A hidden Markov modelof force and torque data in peg-in-a-hole assembly process. In2016 IEEE international conference on systems, man, and cyber-netics (SMC) (pp. 000655–000660). IEEE. https://doi.org/10.1109/SMC.2016.7844315.
Zhao, Y. C, Johson, T., Goh, Y. M., &Mike, J. (2015). A sensor designand data analysis for automatic drum beater winding. In Interna-tional conference on engineering design, IDED 2015 (pp. 1–10).
Zhong, R. Y., Xun, X., Klotz, E., & Newman, S. T. (2017). Intelligentmanufacturing in the context of industry 4.0: A review. Engineer-ing, 3(5), 616–630. https://doi.org/10.1016/J.ENG.2017.05.015.
Zhou, M. (1995). Petri nets in flexible and agile automation. Boston,MA: Springer. https://doi.org/10.1007/978-1-4615-2231-7.
Publisher’s Note Springer Nature remains neutral with regard to juris-dictional claims in published maps and institutional affiliations.
123


