A Thesis on Utilizing High Altitude Platforms (HAPs) To ...
118
Washington University in St. Louis Washington University Open Scholarship All eses and Dissertations (ETDs) January 2010 A esis on Utilizing High Altitude Platforms (HAPs) To Provide Wirelss Communications Coverage To Close Coverage Gaps - Case Study: Providing UMTS Service to the Non-Radar Coverage Area in e Gulf of Mexico (GOMEX) Amad El-Disi Washington University in St. Louis Follow this and additional works at: hps://openscholarship.wustl.edu/etd is esis is brought to you for free and open access by Washington University Open Scholarship. It has been accepted for inclusion in All eses and Dissertations (ETDs) by an authorized administrator of Washington University Open Scholarship. For more information, please contact [email protected]. Recommended Citation El-Disi, Amad, "A esis on Utilizing High Altitude Platforms (HAPs) To Provide Wirelss Communications Coverage To Close Coverage Gaps - Case Study: Providing UMTS Service to the Non-Radar Coverage Area in e Gulf of Mexico (GOMEX)" (2010). All eses and Dissertations (ETDs). 437. hps://openscholarship.wustl.edu/etd/437
Transcript of A Thesis on Utilizing High Altitude Platforms (HAPs) To ...

Washington University in St. LouisWashington University Open Scholarship
All Theses and Dissertations (ETDs)
January 2010
A Thesis on Utilizing High Altitude Platforms(HAPs) To Provide Wirelss CommunicationsCoverage To Close Coverage Gaps - Case Study:Providing UMTS Service to the Non-RadarCoverage Area in The Gulf of Mexico (GOMEX)Amad El-DisiWashington University in St. Louis
Follow this and additional works at: https://openscholarship.wustl.edu/etd
This Thesis is brought to you for free and open access by Washington University Open Scholarship. It has been accepted for inclusion in All Theses andDissertations (ETDs) by an authorized administrator of Washington University Open Scholarship. For more information, please [email protected].
Recommended CitationEl-Disi, Amad, "A Thesis on Utilizing High Altitude Platforms (HAPs) To Provide Wirelss Communications Coverage To CloseCoverage Gaps - Case Study: Providing UMTS Service to the Non-Radar Coverage Area in The Gulf of Mexico (GOMEX)" (2010).All Theses and Dissertations (ETDs). 437.https://openscholarship.wustl.edu/etd/437

WASHINGTON UNIVERSITY IN ST. LOUIS
School of Engineering and Applied Science
Department of Computer Science and Engineering
Thesis Examination Committee: Paul Min, Chair Heinz Shaettler
J.T. Shen A THESIS ON UTILIZING HIGH ALTITUDE PLATFORMS (HAPs) TO PROVIDE
WIRELESS COMMUNICATIONS COVERAGE TO CLOSE COVERAGE GAPS –
CASE STUDY: PROVIDING UMTS SERVICE TO THE NON-RADAR COVERAGE
AREA IN THE GULF OF MEXICO REGION (GOMEX)
by
Amad Y. El-Disi
A thesis presented to the School of Engineering and Applied Science
of Washington University in partial fulfillment of the
requirements for the degree of
MASTER OF SCIENCE
May 2010
Saint Louis, Missouri

copyright by
Amad Y. El-Disi
2010

ii
ABSTRACT
A Thesis on Utilizing High Altitude Platforms (HAPs) to Provide Wireless
Communication Coverage to Close Coverage Gaps – Case Study: Providing UMTS
Service to the Non-Radar Coverage Area in the Gulf of Mexico Region (GOMEX)
by
Amad Y. El-Disi
Master of Science in Computer Science
Washington University in St. Louis, 2010
Research Advisor: Professor Paul Min
The increase in demand for high-capacity wireless services has posed great challenges to
telecommunication service providers, especially for delivery of the ‘last mile’. Terrestrial
networks are limited in some regions and costly, requiring a large number of base-
stations to provide good wireless communication services. Satellite based
telecommunication services have many capacity and performance limitations in voice
and video communication applications. High Altitude Platforms (HAPs) have gained
considerable interest in the past few years due to their potential to exploit the best
aspects of terrestrial and satellite-based systems, while offering advantageous
propagation characteristics. This thesis proposes utilizing High Altitude Platforms
(HAPs) to provide affordable, efficient and robust telecommunication coverage for
remote and oceanic regions. These platforms can carry multipurpose communications
payloads that allow them to function either as a cellular base station or low satellite
system. When fully deployed, they are able to provide services and applications ranging

iii
from broadband wireless access, navigation and positioning systems, remote-sensing
and weather observation/monitoring systems, future generation mobile telephony, etc.
The proposed system, named Gulf Of Mexico High Altitude Platforms Network
(GOMEX-HAPs Net), will focus on the Gulf of Mexico because of its vital importance
to the US and there is an area of approximately 240 square mile gap where there is no
wireless coverage of any kind. GOMEX-HAPs Net will include a set of interconnected
unmanned airships flying at high altitudes over 70,000 feet to achieve maximum
footprint per HAP, minimize wind effects and ensure that it will be flying above all
classes of commercial air planes (under 55,000 ft). Although this system is able to
provide a variety of wireless communication service, the thesis will focus on providing
3G coverage to the coverage gap in the gulf. The thesis will begin with an introduction
to wireless communication and the challenges in providing the “last mile” coverage in
remote regions, followed by a comprehensive discussion about HAPs systems including
their categories and advantages, and a comparison of HAPs with both terrestrial and
satellite based communication networks. The proposed system architecture will be
discussed and the system performance as a 3G backhaul will be explained.

iv
Acknowledgments Thanks to Professor Paul Min for his support and his guidance.
Amad Y. El-Disi
Washington University in St. Louis
May 2010

v
Contents ABSTRACT ................................................................................................................ ii Acknowledgments ......................................................................................................iv List of Figures............................................................................................................vii 1. Introduction ........................................................................................................... 1 1.1 Thesis Objective .............................................................................................................. 1 1.2 GOMEX Overview..........................................................................................................2 1.2.1 Non-Radar Coverage Problem in GOMEX...................................................2 1.3 Wireless Communication Overview ..............................................................................3 1.3.1 Wireless Networks Categories ..........................................................................5 1.4 Mobile Networks Evolution ...........................................................................................9 1.4.1 First-Generation System (Analog)..................................................................10 1.4.2 Second-Generation System (Digital)..............................................................10 1.4.3 Third-Generation System (3G).......................................................................10 1.4.4 Fourth-Generation System (All-IP Network)...............................................11 1.5 Satellite Networks Technology.....................................................................................11 1.5.1 Geostationary Earth Orbit Satellites (GEO) ................................................12 1.5.2 Medium Earth Orbit Satellites (MEO)..........................................................13 1.5.3 Low Earth Orbit Satellites (LEO)..................................................................13 1.6 Last-Mile Coverage.........................................................................................................13 2. High Altitude Platforms (HAPs) ......................................................................... 15 2.1 Overview..........................................................................................................................15 2.2 Categories of HAPs........................................................................................................16 2.2.1 Unmanned Airship ...........................................................................................16 2.2.2 Unmanned Aircraft...........................................................................................18 2.2.3 Manned Aircraft ................................................................................................19 2.3 Comparing the Terrestrial, Satellite and Stratospheric Communication
Systems.............................................................................................................................20 2.4 HAPS Applications ........................................................................................................21 2.5 HAPS-Based Cellular Communication .......................................................................21 2.6 HAPS Links Types .........................................................................................................23 2.6.1 Standalone Platform Links ..............................................................................23 2.6.2 Network of Platforms Connected via Ground Stations .............................24 2.6.3 Network of Platforms Connected via Inter-Platform Links (IPLs) ..........25 2.6.4 Network of Platforms Connected with Satellites (PSLs) ............................27 2.7 UMTS-HAP Networks..................................................................................................28 3. GOMEX-HAPs Communication Network (GOMEX-HAPs Net) ....................29 3.1 Network Functional Specification ...............................................................................29 3.1.1 Network Services ..............................................................................................29

vi
3.1.2 System Availability and Efficiency .................................................................30 3.1.3 Internetworking Requirements .......................................................................33 3.1.4 Handover ...........................................................................................................35 3.1.5 GOMEX-HAP Quality of Service (QoS) Requirements............................37 3.1.6 GOMEX-HAP Network Management.........................................................37 3.2 System Architecture .......................................................................................................38 3.2.1 Stratospheric Segment......................................................................................38 3.2.2 Ground Segment...............................................................................................42 3.3 GOMEX-HAP Network Topology ............................................................................43 3.4 HAPS Antenna Subsystems..........................................................................................45 3.4.1 HAPS Antennas Recommendations for 2.1 GHz ..........................................46 3.5 Rain Attenuation.............................................................................................................47 3.5.1 Platforms Interconnection..................................................................................48 3.5.2 Integrating GOMEX-HAP with Satellite and Terrestrial Networks ...........49 4. System Modeling.................................................................................................. 51 4.1 Geometric Footprint Analysis ......................................................................................51 4.1.1 Flat Surface Analysis............................................................................................51 4.1.2 Curved Surface Analysis .....................................................................................53 4.2 GOMEX-HAPs Link Budget.......................................................................................57 4.2.1 Free-Space Propagation and Path Loss Theory ..............................................57 4.3 Channel Modeling ..........................................................................................................60 4.3.1 HAPS Downlink Analysis ..................................................................................63 5. MAT-LAB Results ...............................................................................................69 5.1 Footprint Results ............................................................................................................69 5.2 Channel Modeling Results.............................................................................................85 5.3 System Capacity Results ................................................................................................89 6. Advantages and Future Challenges .....................................................................96 6.1 Advantages of Integrating HAPS with Terrestrial UMTS........................................96 6.2 Future Challenges ...........................................................................................................97 6.3 Conclusion.......................................................................................................................99 Appendix A .............................................................................................................. 100 References................................................................................................................ 103 Vita….. ..................................................................................................................... 106

vii
List of Figures Figure 1.1: GOMEX Non-Radar area ..........................................................................3 Figure 1.2: Example of Two-Point Wireless Communications Link ..........................4 Figure 1.3: Categories of Wireless Network ................................................................6 Figure 1.4: Evolution of Mobile Networks ..................................................................9 Figure 1.5: Basic Architecture of Satellite Communication System.......................... 12 Figure 2.1: Wind velocity with respect to the Altitude .............................................. 16 Figure 2.2: Solar Power Unmanned Airships ............................................................ 17 Figure 2.3: Solar Power Unmanned Aircraft ............................................................. 18 Figure 2.4: Long Range-High Altitude Manned Aircraft ......................................... 19 Figure 2.5: General comparison of airships solar powered unmanned and manned aircrafts ........................................................................................................20 Figure 2.6: Typical HAPs Cellular Network Architecture ........................................22 Figure 2.7: Stand-Alone High Altitude Platform Scenario........................................24 Figure 2.8: Network of Platforms connected via ground station ..............................25 Figure 2.9: Network of platforms connected via interplatform links........................26 Figure 2.10: Network of High Altitude Platforms connected via Satellite................27 Figure 3.1: Impact of Lower Elevation Angle on Path Loss ..................................... 31 Figure 3.2: Example of downlink data rates at 28GHz for various types of user......32 Figure 3.3: Signal strength and hysteresis between two adjacent HAPs for potential handover. ....................................................................................................36 Figure 3.4: The Subsystems of the Stratospheric Segment .......................................39 Figure 3.5: Lighter than air high altitude platform ...................................................40

viii
Figure 3.6: A Typical HAPS Transponder Architecture Applied to GOMEX-HAP…........................................................................................................................ 41 Figure 3.7: The Elements of an Electrical Power Subsystem ..................................42 Figure 3.8: Cellular System of a Ground Segment ....................................................43 Figure 3.9: GOMEX-HAP Net topology...................................................................45 Figure 3.10: Parameters for Empirical Rain Attenuation Model ..............................47 Figure 3.11: HAPS Inter-Platform Link (IPL) ..........................................................48 Figure 3.12: Proposed Integration of GOMEX-HAP, Satellite and UMTS Network ....................................................................................................................50 Figure 4.1: HAP Cell Footprint .................................................................................52 Figure 4.2: Flat Surface..............................................................................................52 Figure 4.3: Curved Surface ........................................................................................54 Figure 4.4: Channel Model .......................................................................................60 Figure 4.5: Downlink Analysis of a UMTS-HSDPA ................................................64 Figure 4.6: Required CNIR at 1 dB loss....................................................................68 Figure 5.1 : Variations of the cell major axes ( y ) with the beam direction θo at
different beamwidths Bθ for flat surface ( Fy ) coverage models using directional
antennas. ....................................................................................................................69 Figure 5.2: Variations of the cell major axes ( y ) with the beam direction θo at
different beamwidths Bθ for curved surface ( Cy ) coverage models using
directional antennas...................................................................................................70 Figure 5.3: Absolute error variation between major access flat surface model and curved surface model with beam direction at different beamwidths........................ 71 Figure 5.4: Relative error variation between major access flat surface model and curved surface model with beam direction at different beamwidths........................72

ix
Figure 5.5: Variations of the cell minor axes ( x ) with the beam direction θo at
different beamwidths Bθ for flat surface ( Fx ) coverage models using directional
antennas.) ..................................................................................................................73 Figure 5.6: Variations of the cell minor axes ( x ) with the beam direction θo at
different beamwidths Bθ for curved surface ( Cx ) coverage models using
directional antennas. .................................................................................................74 Figure 5.7: Absolute error variation between minor access flat surface model and curved surface model with beam direction at different beamwidths........................75 Figure 5.8: Relative error variation between major access flat surface model and curved surface model with beam direction at different beamwidths........................76 Figure 5.9: 3-D illustration of flat surface major access variation with beam direction at different beamwidths .............................................................................77 Figure 5.10: 3-D illustration of curved surface major access variation with beam direction at different beamwidths .............................................................................78 Figure 5.11: Major access absolute error variations represented in 3-D ...................79 Figure 5.12: Major access relative error variations represented in 3-D. ....................80 Figure 5.13: 3-D illustration of flat surface minor access variation with beam direction at different beamwidths ............................................................................. 81 Figure 5.14: 3-D illustration of curved surface minor access variation with beam direction at different beamwidths .............................................................................82 Figure 5.15: Minor access absolute error variations represented in 3-D...................83 Figure 5.16: Minor access relative error variations represented in 3-D.....................84 Figure 5.17: Excess delay cumulative distribution with 0.15m sτ µ= , h=21 m,
0 20kmz = , and x varying from 0 to 100 Km with step 20 Km.....................................85
Figure 5.18: Excess delay cumulative distribution with 0.15m sτ µ= , 0 40kmx = ,
0 17kmz = , and varying from 1m to 51 with step 10m..................................................86
Figure 5.19: BER for a 4-DPSK transmission scheme obtained over AWGN, frequency-°at Ricean and stratospheric channel with a C/M ratio of 18 dB, at a bit rate of 0.25, 1, 4 Mb/s. ..........................................................................................87

x
Figure 5.20: BER for a 4-DPSK modulation transmission scheme obtained over AWGN, frequency-°at Ricean and stratospheric channel with a C/M ratio of 6 dB, at a bit rate of 0.25, 1, 4 Mb/s. ............................................................................88 Figure 5.21: /bE N as a function of the HSDPA user distance from the cell centre
when h = 20km, R = 2km, Φ = 0.1, N=1, fully loaded cell (Φ is the non-orthogonality factor, N is the number of users. ........................................................89 Figure 5.22: /bE N as a function of the HSDPA user distance from the cell centre
when h = 20km, R = 2km, Φ = 0.1, N=2, fully loaded cell ......................................90 Figure 5.23: /bE N as a function of the HSDPA user distance from the cell centre
when h = 20km, R = 2km, Φ = 0.5, N=1, fully loaded cell ...................................... 91 Figure 5.24: /bE N as a function of the HSDPA user distance from the cell centre
when h = 20km, R = 2km, Φ = 0.5, N=2, fully loaded cell ......................................92 Figure 5.25: /bE N as a function of the HSDPA user distance from the cell centre
when h = 20km, R = 2km, Φ = 0.5, N=1, medium loaded cell ...............................93 Figure 5.26: /bE N as a function of the HSDPA user distance from the cell centre
when h = 20km, R = 2km, Φ = 0.5, N=2, medium loaded cell ...............................94 Figure 5.27: /bE N as a function of the HSDPA user distance from the cell centre
when h = 20km, R = 2km, Φ = 0.1, N=2, medium loaded cell ...............................95

1
1. Introduction
The wireless communication market continues to experience phenomenal growth rates
which accompany an increase in the demand for several types of services, multimedia
environment applications, high capacity systems and broader urban coverage. Both
scientific and business analysis indicates that this demand is expected to continue to
increase due to the greater reliance of the private and public sectors on wireless
technologies in enhancing and simplifying its operations and services. This demand has
led to the successful and rapid deployment of terrestrial and satellite wireless networks
and the development and efficient utilization of spectrum and advanced multiple access
techniques. However, as both schemes are not expected to keep up with the needed
capacity for future wireless applications and services, the telecommunication industry
stakeholders in both commercial and defense sectors started to look into aggressive
solutions to resolve this perceived challenge.
The provision of wireless services via High Altitude Platform Stations (HAPS), which
operate in the stratosphere at altitudes from 17 to 22 km; provides telecommunication
providers an emerging solution that can exploit the best features of both terrestrial and
satellite schemes. This thesis will discuss the utilization of high altitude platforms as a
backhaul for wireless communication networks.
1.1 Thesis Objective
The need for wireless communication in remote regions, the increase in human offshore
operations, the demand for high-capacity wireless services and the added delivery
challenges of the “last mile” wireless service created an environment where utilization of
HAPS as a backbone for wireless communication is an affordable solution to provide
coverage where terrestrial and satellite based backhauls might not be a feasible

2
solutions. This thesis explores the utilization of High Altitude Platform Stations (HAPS)
for wireless communication coverage to the Gulf of Mexico (GOMEX) region.
1.2 GOMEX Overview
This thesis proposes that there is an exigency for providing enhanced communication
infrastructure in the Gulf of Mexico (GOMEX) region, and the method by which to do
so. The reasons for this pressing need are not only because GOMEX is the ninth largest
body of water in the world, but there are at least three other compelling reasons. Firstly,
it borders five coastal states in the southern United States which are witnessing a
dramatic increase of 40% [17] in population growth, from 44.2 million in 1995 to 61.4
million in 2025. Second, it is integral to regional commerce; it includes two regional
ports (Port of Louisiana in New Orleans and Port of Houston), both ports are
considered of the ten busiest ports in the world by cargo volume.
The Gulf of Mexico is considered an important source for marine resources such as oil
and gas, oysters and shells, and a medium for marine-based activities such as navigation,
recreation, and commercial fishing.
1.2.1 Non-Radar Coverage Problem in GOMEX
The non-radar airspace (NRA) of the GOMEX was the inspiration for providing HAPS
wireless communication coverage to this region. NRA is the likely reason for poor
communication between pilots and air traffic controllers and flight delays. The dark-
region in the middle shown in Figure 1.1 indicates the NRA where aircrafts fly outside
of the range of air-traffic controlled radars, which can results in many air traffic control
quality issues. For one, VHF radio is not available so communication is only available
through HF radio. The HF radios have its own disadvantages, namely, a lower voice
quality which in turn can cause miscommunication, and a delay in the control loop.

3
Figure 1.1 GOMEX Non-Radar Area [19]
1.3 Wireless Communication Overview
A communications system essentially consists of three basic components: a transmitter,
a receiver, and a communication channel (link-medium). In any given communication
system, the bi-directional conversation between points A and B can only occur if both
points have the ability to communicate via a wireless channel. Figure 1.2 illustrates the
main elements needed to establish a form of communication between two locations.

4
Figure 1.2 Example of Two-Point Wireless Communications Link
The main function of the transmitter is to transmit the message/signal over the
communication channel. Quite often the original signal is not suitable for transmission
over the communication channel to the receiver; therefore a transducer converts the
original signals into a time varying electrical signal called a message signal. The
transmitter assures the matching of the message signal to the wireless channel by a
process called modulation. There are other functions that are performed by the
transmitter like the filtering of the information-bearing signal, signal amplification, and
signal radiation.
The communication channel is the physical medium that is used to convey information
from a transmitter to a receiver. The medium could be a transmission line (telephone
and telegraph) air, water or the vacuum of space. The specific mediums may contain
various obstructions such as natural terrestrial features like mountainous terrain or
bodies of water, manmade features such as buildings, or motor vehicles, or even space
features such as planets or space debris, depending on the medium. Regardless of the
deployed transmission medium, the transmitted signals usually suffer some level of
degradation.
The third element of the wireless communication system is the receiver. The main
responsibility of the receiver is to capture the transmitted signal and perform signal
processes that are vital in order to change the signal format from a channel transmission
signal into the more common form of images, sounds, or data. The sequence of

5
processes that take place in order to remove the modulation from the received signal to
get the original baseband signal is called demodulation. Besides the receiver’s main role of
demodulation, it also performs signal filtering and noise suppression.
The communication system and the signal processing of its components introduce
degradation to the transmitted signals. There are many technologies and methods that
are aimed to increase the efficiency of the communication system by minimizing signal
degradation and maximizing the number of transmitted signals at a rate of one time per
channel.
1.3.1 Wireless Networks Categories
Networking technologies has developed rapidly due to the evolution of new generations
which yield faster and more efficient services due to the implementations of wireless
systems in a vast array of applications. There are many methods that could be applied to
categorize wireless communication networks. These include networks that can be
distinguished by usage, technology, bandwidth, frequency and range. In this section, we
will define the categories of wireless networks based on geographic area coverage of the
service. Figure 1.3 depicts the categories of wireless networks.

6
Figure 1.3 Categories of Wireless Networks
Wireless Personal Area Network (W-PAN)
The wireless personal area network is a computerized network of devices around an
individual interconnected through a radio frequency. WPAN also could support the
connectivity of its owner to a local internet service provider. Typically, a wireless
personal area network with operating frequencies around 2.4 GHz in digital mode,
facilitates wireless communications within about 10 meters. In ideal cases, however; it is
possible to achieve a range of up to 100 meters. W-PAN’s have unique characteristics
such as short-range data rates of up 55Mb/s, peer-to-peer connectivity, a small number
of nodes in the network. It is also able to run at ultra low power and at a relatively low
cost.
There are several new technologies developed to operate in WPAN. Bluetooth®,
standardized on the basis of IEEE 802.15, is one of the most commonly used WPAN
specifications for wireless communications among portable digital devices. IEEE 802.15
is the standard for a small size radio chip that can be plugged into individual’s devices
such as mobile phones, Blackberry solutions, computers, printers etc. Other wireless
technology that fits in the WPAN category is ZigBee (802.15.4), IrDA and UWB.

7
Currently, the WPAN technologies are undergoing rapid development to achieve the
objective of facilitating seamless automated operations with different types of functions
among an individual’s body, home and business devices and service provider systems.
In order to accomplish this objective, every device in a WPAN should be able to
interact with any other device in the same network. Further research efforts are
underway to study the technical feasibility and advantages of ad hoc meshed WPAN
topologies.
Wireless Local Area Network (W-LAN)
Local area network (LAN) is defined as the connectivity of two or more computers in
network within a limited area. Wireless LANs (WLANs) is to utilize the connectivity
between computers in a limited area without using wires and the ability to provide
networking capabilities using wireless communication technologies to transfer
information between devices in the area. In a typical WLAN environment, devices
enable the nodes of the network to communicate wirelessly via access points within 100
meters of the devices. The continued growth of applying WLAN technologies in homes
and business is due to its convenience, mobility, productivity, ease of deployment,
scalability and affordability.
There are many competing technologies that provide WLAN connectivity, including
Home RF, Wi-Fi, HiperLAN and Bluetooth. Standards of WLAN are identified by
IEEE 802.11 which uses Ethernet protocol and Carrier Sense Multiple Accesses with
Collision Avoidance (CSMA/CA) for path sharing and data encryption. Wi-Fi networks
are commonly used in several consumer applications operating in frequencies ranging
from 2.4-GHz to 5.8 GHz.
In WLAN technologies, the standards of qualities of service (QoS) are addressed. QoS
enables the packets prioritization in order to provide different priorities to different
applications, users, or to guarantee a certain level of performance to a data flow. Further

8
studies are in the process especially in the realm of networking security issues. The next-
generation WLAN standard which is known as 802.11n is expected to support data rate
applications exceeding 100 Mbps. This feature will be accomplished by applying the
wideband radio frequency (RF) channels, Multiple-Input, Multiple-Output (MIMO)
radio technology, and advanced and efficient networking protocols.
Wireless Metro Area Network (W-MAN)
A wireless metro area network is a network that serves a geographical area that is larger
than a LAN, ranging from networks connected within several blocks of buildings to
networks that cover entire cities. In some cases, WMAN could be formed due to the
connectivity of several WLANs through a central network operation center (NOC).
WMAN might be owned and operated by a single organization or it might be formed by
integrating heterogeneous networks owned and operated by different organizations.
Metropolitan area networks can span up to 50km by utilizing repeaters, modems and
wire/cable.
The air interfaces for WMAN are defined by technologies standards IEEE 802.16, also
known as WirelessMAN. WiMax, identified as IEEE 802.16d, operates in the 2-to-11
GHZ frequency range and is one of the newest and most famous of these technologies.
WiMax maximum data rates can reach up to 70 Mbps and cover a range of up to 50
kilometers when operated within line of sight and under ideal conditions. Future
developments are in progress on the mobility standards of WMAN. Many researches of
the telecommunication industry are focused on developing efficient mobile WMAN
systems that provide broadband internet and telecommunication services.
Wireless Wide Area Network (W-WAN)
Wireless wide area networks are digital cellular networks that are capable of providing
regional, nationwide, or even global mobile communications connectivity that can

9
include voice, data and video services. The usage of the cellular network gives the
WWAN a greater mobility which allows a broader availability of connectivity, faster
access to information, and an avoidance of the physical constraints of cables and wires.
The most famous WWAN technologies are the Global System for Mobile
Communications (GSM) and Code Division Multiple Access (CDMA). The mobile
network which is currently the main infrastructure for WWAN is explained in the next
section.
1.4 Mobile Networks Evolution
The rapid developments and advancements in the wireless technologies and market
demand have contributed to the revolutionary expansions of mobile networks and
services. Mobile networks evolution has gone through several stages categorized into
“generations” as it is shown in Figure 1.4. A brief overview of each generation will be
explained in this section.
Figure 1.4 Evolution of Mobile Networks

10
1.4.1 First-Generation System (Analog)
It was basically composed of different types of analog networks of distributed
transceivers communicated to provide connectivity to users with the mobile phones.
First-Generation mobile systems were basically used for voice communications only.
These systems typically allocated two different 25 MHz frequency bands for downlink
and uplink messages. The voice signals were transmitted by the method of frequency
modulation. In order to maximize the network capacity, re-using the same frequency in
different cells and Frequency Division Multiple Access (FDMA) schemes were applied.
1.4.2 Second-Generation System (Digital)
The monumental success of the analog system resulted in rapid growth rates of cellular
subscribers, causing an insufficient spectrum to support the quality of service required.
This happened during the time of substantial advancement in the digital systems; this
led to the next step in the evolution of a variety of digital mobile networks.
Europe developed a system that resulted in 26 telecommunications companies working
together. These systems included the Groupe Speciale Mobile (GSM), and were later to
be known as the Global System for Mobile communications.
Applying Time Division Multiple Access (TDMA) scheme in 2G allowed up to eight
users to share the same channel spaced 200 kHz apart. The basic system used
frequencies in the 900 MHz band, but other bands in the 1800 and 1900 MHz (USA)
bands were added. New bands in the 850 MHz region were also added.
1.4.3 Third-Generation System (3G)
The third generation of mobile phone standards and technology was first developed in
Europe; it was called UMTS (Universal Terrestrial Mobile System). IMT-2000 is the

11
ITU-T name for 3G system, while cdma2000 is the American 3G variant. Unlike IEEE
802.11 networks, 3G networks are wide area cellular telephone networks which evolved
to incorporate high-speed internet access and video telephony. IEEE 802.11 (common
home Wi-Fi) networks are short range, high-bandwidth networks primarily developed
for data. The UMTS system will be explained in more detail in the next chapter.
1.4.4 Fourth-Generation System (All-IP Network)
The fourth generation (4G) is still in the development process. It involves assuring the
interoperability and compatibility of all networks with the Internet Protocol (IP), what is
referred to as an All-IP Network. This approach will assure a common platform for all
the technologies, allow open system development and upgrade of the mobile networks,
and introduce many of the internet based services and applications into the mobile
communication business. The all IP open system architecture would transform the
cellular communication systems into network-centric operations architecture which
would enhance the accessibility of cellular networks into most of the World Wide Web
networks.
One of the unique features of 4G is the multicasting. This would allow wide spectrum
of services and service providers with 4G capability to provide connectivity to each
other and proved an always –on service with higher bit rate and lower cost.
1.5 Satellite Networks Technology
Communication satellites provide an effective platform to relay radio signals between
points on the ground. Users who employ these signals enjoy a broad spectrum of
telecommunication services on the ground, sea and in the air. Recently, such systems
have become practical to a point where a typical household can have its own satellite
dish. The satellite services initially was used for aerospace and defense communications,
12
but later the technology was applied to use by the average consumer in the areas of TV
and radio broadcasting, telephony systems, and broadband internet connection link. The
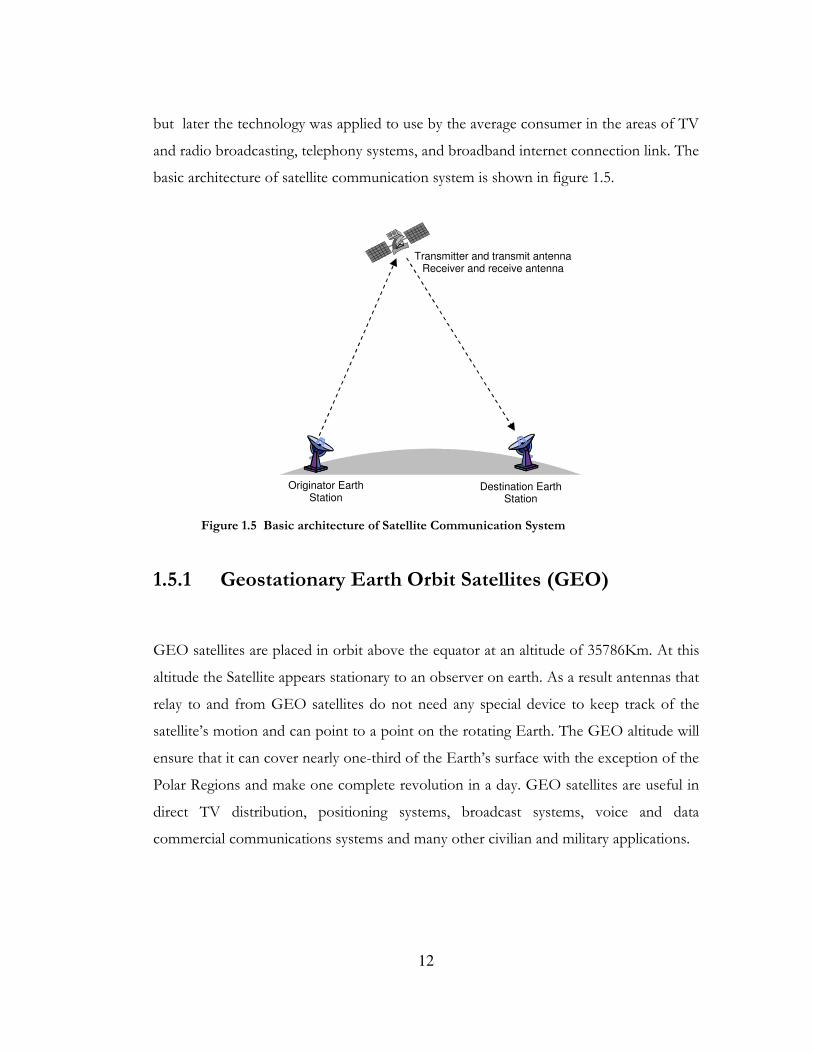
basic architecture of satellite communication system is shown in figure 1.5.
Figure 1.5 Basic architecture of Satellite Communication System
1.5.1 Geostationary Earth Orbit Satellites (GEO)
GEO satellites are placed in orbit above the equator at an altitude of 35786Km. At this
altitude the Satellite appears stationary to an observer on earth. As a result antennas that
relay to and from GEO satellites do not need any special device to keep track of the
satellite’s motion and can point to a point on the rotating Earth. The GEO altitude will
ensure that it can cover nearly one-third of the Earth’s surface with the exception of the
Polar Regions and make one complete revolution in a day. GEO satellites are useful in
direct TV distribution, positioning systems, broadcast systems, voice and data
commercial communications systems and many other civilian and military applications.
Originator Earth Station
Destination Earth Station
Transmitter and transmit antenna Receiver and receive antenna

13
1.5.2 Medium Earth Orbit Satellites (MEO)
MEO satellites orbit sometimes is referred as intermediate circular orbit (ICO). MEO is
any satellite that orbits the earth within an altitude range of 2000 – 35786 Km above
earth. The most common usage of this orbit is in navigation services such as global
positioning systems (GPS). MEO satellites could be utilized to provide communication
coverage in areas that fall in the blind spot of GEO satellites, such as the Polar region.
MEO satellites cover more earth area than low earth orbit satellite but they have a
higher latency.
1.5.3 Low Earth Orbit Satellites (LEO)
Low earth orbit satellite is generally defined as any satellite orbiting within the area
extending from the Earth’s sphere up to an altitude of 2,000 km. Normally the LEO
satellites travel at a speed of 27400Km/h within an altitude range of 200 – 2000 Km,
thus the time it would take for a LEO to finish a full orbital cycle is typically 90 minutes.
A constellation of LEO satellites are equipped with a means of hand-off feature to
allow the link to be passed from one satellite to another in order to provide meaningful
and seamless communication. Due to the relative proximity of LEO satellites to earth, it
would require less energy and it would cost less to launch them and put them into their
orbit, also it would require lower power communication transceivers to establish
successful link with LEO satellites.
1.6 Last-Mile Coverage
In communication systems, the ‘last mile’ term refers to the maximum distance of
delivering connectivity coverage from a communications service provider to a user’s

14
premises. This connectivity can be wired or wireless, terrestrial or satellite based. The
last mile connection is often asymmetric, with more bandwidth available downstream
than upstream, since users generally pull down data more than they send out.
The challenges of providing the ‘list mile’ coverage are considered one of the main
obstacles faced by service providers in the delivery of mobile communication services to
customer’s terminals. In recent years many technologies have been developed to resolve
this issue, including: Asymmetric Digital Subscriber Line (ADSL), Fiber optic cables,
Broadband Fixed Wireless Access (BFWA), Mobile telephony, Wireless LAN/WAN,
and Satellite technology. Due to the limitation or expensive costs of most of these
technologies, High Altitude Platforms (HAPs) have been proposed for the provision of
communication services from the stratosphere. Currently, the HAPs concept is
considered as one of the best alternative technologies for the issue of “last mile” service
coverage. HAPs have the potential to deliver communication services over a wide
coverage area, regardless of the nature of the terrain or the climate of the region. The
next section will discuss some of the different technologies applied to provide ‘last mile’
connectivity.
15
2. High Altitude Platforms (HAPs)
2.1 Overview
The High Altitude Platforms (HAPs) system concept envisages the utilization of un-
piloted High-Altitude, Long-Endurance (HALE) airborne stations as platforms to relay
telecommunication signals for several purposes. The HAPs concept takes advantage of
the advancements in microwave power transmission developments associated with the
modern Solar Power systems and High Altitude Powered Platform concepts. This newly
developed concept seems like a very simple concept but it has an enormous potential.
HAPs will be utilized to provide cellular communication and broadband services
applications especially in remote and oceanic regions where it is difficult to have an
affordable infrastructure. Serving as a communication backhaul, these platforms are to
remain relatively stationary at the upper atmospheres for long periods of time. Although
stratospheric platforms are an old idea, only recently, they have become considered as a
promising enabling technology. Currently there are several major organizations that are
devoted to the development and commercial marketing of HAPS based systems for
wireless communications as well as for environmental and security monitoring and
remote sensing.
HAPs are designed to fly at altitudes of around 20km (70,000 FT) because the average
wind speed in the stratosphere is minimal at altitude of about 20 KM. The relationship
between the wind speed at specific altitudes and the actual altitude is described in Figure
2.1. Moreover, at these altitudes, the signal delay will be negligible compared to satellite
signal, and propagation delay will be minimized. The average lifespan of each platform
is expected to exceed 5 years before landing for refueling, upgrade and maintenance.

16
Figure 2.1 Wind Velocity with respect to the Altitude [20]
2.2 Categories of HAPs There are three distinguishable types of proposed high altitude long endurance (HALE)
aerial vehicles. These types are categorized depending on the platforms structure, the
way they are operated, managed and maintained. Collectively, the unmanned aircraft and
manned aircraft of the three types are referred to as High Altitude Aeronautical
Platforms (HAAPs).
2.2.1 Unmanned Airship
These are mainly un-manned, powered airships that can maintain a relatively stationary
position at 70,000 feet. They can be well over 100m in length and could carry a payload

17
of about 800kg or more. Lifting these ships will be accomplished using the concept of
lighter-than-air gases. Differential thrust and electric-powered props control the pitch
and roll and keep it in position. Since liquid fuel is heavy, all power must be generated
on station. This could be accomplished by using thin-film photovoltaic solar cells and
commercially light weight high power fuel cells.
By generating its own power, usage of light weight structure and equipment materials
and keeping gas loss to a minimal amount, this type of aerial vehicle could stay up and
relatively stationary for a period of 5 years. These features qualify this type of HAPs to
be the most effective airship for telecommunication services and applications and the
most comparative technology to satellite systems.
Currently, several countries are developing this type of airship for several types of uses.
Figure 2.2 illustrates promising and on-going programs to produce this type of airships.
Figure 2.2 Solar Power Unmanned Airships [11]

18
2.2.2 Unmanned Aircraft
These types of aerial vehicles are also known as High Altitude Long Endurance
platforms (HALE Platforms). They make use of high tech light weight material, long
wingspan to fly for long periods and programmable electric motors to continuously fly
on a race track pattern. Figure 2.3 illustrate examples of the latest solar power
unmanned aircraft prototypes developed by NASA.
Figure 2.3 Solar Power Unmanned Aircraft [11]
Power is derived from solar cells mounted on the wings and stabilizers, which also
charge the on-board fuel cells. The span of flight duration for this category of vehicles
varies from days to a month. Some theoretical concepts of this type of aircraft propose
that there are methods and technologies that could keep them flying to up to six
months or more.
This type of aircraft has faster flying speeds and more maneuvering capabilities than
unmanned airships. It is also smaller sized and its preparation and operational logistics
are less complex than for airships. This type of aircraft could be most useful for
surveillance applications and disaster relief communication.

19
2.2.3 Manned Aircraft
This category of vehicles is basically a piloted airplane that is designed specifically to
handle high altitudes. It has an average flight duration of some hours which is mainly
due to the fuel constraints and human factors. This type is mainly used for defense and
some civilian services like weather monitoring services. Figure 2.4 below shows the
different types of aerial vehicles both manned and unmanned.
Figure 2.4 Long Range High Altitude Manned Aircraft [11]
The table below provides a summary and a breakdown of general comparison of the
three categories; Airships, Unmanned Aircrafts and HAAPS Piloted aircrafts.
From studying the table shown in Figure 2.5, it is apparent that the best suited type for
operating as a cellular communication base station (BS), or operating as a
telecommunication relay in the sky function as a LEO satellite would be the unmanned
high altitude airships. Their flight duration which is up to 5 years now but with the
development of aerial refueling solutions its expected to increase to up to 10 years if,
also their ability to carry a heavier communications payload and surveillance sensors and
their ability to remain relatively stationary comparing to other types is what qualified it
to be most proffered solution for many researchers.

20
Airships
(unmanned)
Solar-powered unmanned Aircraft
Manned Aircraft
Size Length 150 ~ 200 m Wingspan 35 ~ 70 m Length ≈ 30 m
Total weight ≈ 30 ton ≈ 1 ton ≈ 2.5 ton
Power source Solar cells (+Fuel cells)
Solar cells (+Fuel cells)
Fossil Fuel
Flight Duration Up to 5 years Unspecified (≈ 6 mths)
4 – 8 hours
Position Keeping (Radius)
Within 1 km cube 1 – 3 km ≈ 4 km
Mission Payload 1000 ~ 2000 kg 50 ~ 300 kg Up to 2000 kg
Power for Mission ≈ 10 kW ≈ 3 kW ≈ 40 kW
Example Japan, Korea, China, ATG, Lockheed Martin, SkyStation etc.
Helios, Pathfinder Plus (AeroVironment), Heliplat (European project)
HALO (Angel Technologies)
M-55 (Geoscan Network)
Figure 2.5 General comparison of airships solar powered unmanned and manned aircrafts [11]
2.3 Comparing the Terrestrial, Satellite and Stratospheric Communication Systems
Until sufficient interest has developed in utilizing HAPs as an infrastructure for
telecommunication systems, HAPs is not meant to replace, but rather to complement,
existing terrestrial and satellite networks. A comparison between the features of HAPs
versus terrestrial and satellite networks demonstrates the advantages of integrating
HAPs within existing networks. The most important similarities and differences of
stratospheric platforms vis-à-vis terrestrial and satellite systems are summarized in

21
survey conducted by S. Karapantazis and F.-N. Pavlidou [11] and shown in Appendix
A.
2.4 HAPs Applications
The multiple superior features of HAPs translate into the attractiveness of utilizing
HAPS in various applications. Below is a list of possible HAPs applications:
• HAPs allow broadcast services and wireless communications to be delivered more
cost effectively, with easy maintenance requirements.
• Increase in the cellular communications cells capacity and ease of planning the cells,
provide more and better coverage and require much less infrastructure and are less
affected by natural disasters
• Its network architecture also allows it to be a multicast for both Internet and DVB
(Digital Video Broadcast) type services.
• Unlike satellite systems, HAPs have relatively low propagation delays and
broadband capability using small sized antennas and terrestrial terminal equipment,
and is thus ideal for use in data and Internet traffic throughput, interactive
applications, and protocol constraints.
• Data communication, basic voice, and video are typical services that will be offered
from aerial platforms. More advanced services include news gathering,
videoconferencing, remote sensing, telemedicine, navigation, localization, and
emergency message broadcasting.
2.5 HAPs-Based Cellular Communication
Proponents of using HAPs for cellular telephone services advertise several advantages
of the system. The primary advantage is their higher return on investment when serving

22
rural areas where there is lower traffic. Further, the current terrestrial based
telecommunication system might not support disaster situations when the infrastructure
might suddenly become unavailable.
A single HAP which provides full service coverage of a wide rural area is expected to be
more technologically complex (e.g. utilize more advanced antenna technology), and each
macrocell served by a platform can be subdivided into a number of sectors, with each
sector connected to an aerial base station on the platform. A HAP can also be used as a
“backup” base station instead, supplementing the services provided by existing
terrestrial base stations, so that pockets of areas which are not covered by the terrestrial
network would be included in this integrated system. In such a use, the traffic density in
HAPs is expected to be low. Figure 2.6 illustrates a typical HAPs network architecture
scenario assuming a variety of possible interconnections.
Figure 2.6 Typical HAPs Cellular Network Architecture

23
2.6 HAPs Links Types
The architecture design phase of the HAPs system takes into consideration the system
coverage and the type of services to be offered. System coverage has two design
implications: the first is system capacity which is affected by the platform coverage area
that is composed of smaller cells to increase the capacity; the second is service area
which determines the number and configuration of the HAPs required. The type of
services to be offered is impacted by the choice of network topology. HAPs can be
standalone operations or they can be interworking operations connected to external
networks via gateways. The different types of platform interconnections and the design
implications together yield four possible network architecture scenarios, which are
defined and explained in the next sections.
2.6.1 Standalone Platform Links A standalone HAP system is conventionally used to provide basic coverage or
additional capacity for short-term events such as sports events (e.g. the Olympics) or
disaster relief operations. In such scenarios, onboard switching is most likely required as
ground stations may not be readily available for switching on the ground. In the HAPS
standalone, the coverage is limited to communication between users within the platform
coverage area, or with other networks in the ground connected to the HAP. The typical
capacity of a standalone HAP system is 200 Mbit/s for the uplink, shared between the
users in a cell, and 2 Mbit/s shared capacity for the downlink. Figure 2.7 illustrate a
standalone HAP with sectorized cells covered by its directional antennas.

24
Figure 2.7 Stand-Alone High Altitude Platform Scenario
2.6.2 Network of Platforms Connected via Ground Stations
Multiple HAPs systems are communication systems where different HAPS are
interconnected either via ground stations (discussed in this section) or via IPLs (next
section). The system coverage provided by ground connections is dependent on the
ground segment facilities. Switching can be ground or onboard. The advantage of
onboard switching is the improvement of QoS between communicating parties within
the same platform coverage area. In ground switching, the advantage is in the reduction
in platform payload requirements (such as weight and power consumption limitation).
Figure 2.8 shows how a ground station could be used as a relay between two HAPs. In
some cases, the ground station could be designated to function solely as HAPs ground
station, in other cases, HAPs interconnection could be achieved via existing cellular
base station.

25
Figure 2.8 Network of Platforms connected via ground station
In standalone operations, capacity is increased by the number of cells within a coverage
area. In multiple HAPs systems, capacity can be increased by the number of platforms
deployed. Fixed user antennas are employed as their relatively narrow beam-widths
enable the progressive reduction in the interference levels of other HAPs positioned
away from the boresight of the user antennas.
2.6.3 Network of Platforms Connected via Inter-Platform Links (IPLs)
In the case of multi HAPs network, Inter-Platform Link (IPL) is used to connect
between HAPs. Depending upon the technical requirements, the IPL terminals can be
either optical or radio frequency. There are advantages to using IPL versus ground
station connection. One is the flexibility of system coverage, whereby coverage can be
extended with less need for terrestrial infrastructure and up/down link segments. A
second is its ability to bridge spans between ground stations while rerouting traffic to
less loaded ground stations and gateways. When IPL networks are used, ground stations

26
could serve as a gateway to other networks or as a backup interconnection between
platforms in the event of IPL failure. As shown in figure 2.9, IPL helps the formation of
HAPs meshed network.
There are also some drawbacks to using IPL networks. One of them is that it increases
the payload burden with its additional weight and power consumption. The other is its
requirement for steerable IPL antennas that must meet pointing, acquisition and
tracking (PAT) conditions. Since natural weather phenomena such as wind, gusts, and
turbulence can affect the motion of the platforms, they will also affect the IPL distance
and antenna pointing angle.
Figure 2.9 Network of platforms connected via interplatform links
IPLs can connect either adjacent platforms with overlapping coverage areas, or remote
platforms within the same, or backbone, network.

27
Since signal attenuation tends to be greater in the higher mm0waveband, therefore the
maximum distance set between IPL-connected platforms to minimize the effects of
such attenuation, and that distance should not exceed 450-500 km.
2.6.4 Network of Platforms Connected with Satellites (PSLs)
A third type of platform network connection is via satellites using radio frequency
terminals. This RF platform to satellite link (PSL) shown in figure 2.10, is used primarily
where there is non-existing or inadequate ground infrastructure or when we need to
minimize the communication payload in HAPs. PSL has two main functions. One is to
integrate the HAP system with non-local terrestrial or satellite networks, the other is as
a backup system when the ground station or IPL connection is disabled. There are
drawbacks to the use of PSL networks. They use heavier terminals which consume
more power, have longer communication paths, and correspondingly greater loss in
spreading.
Figure 2.10 Network of High Altitude Platforms connected via Satellite
28
2.7 UMTS-HAP Networks
The ITU has approved the use of HAPs in the IMT-2000/UMTS spectrum for
providing 3G mobile service. As discussed in an earlier section, the HAPs system can
provide UMTS as a standalone system, or it can be integrated into a system of ground
based towers.
The HAPs UMTS system and ground tower-based UMTS system both utilize the same
infrastructure, and have the same functionality and service and operational
requirements. Although their delivery platforms are different, to the cellular user, the
mobile network operates in the same way for HAPs as it does for traditional ground
based stations.
The HAPs system is however superior in several aspects. To begin with, a single HAP
can encompass a signal coverage area of 500 km radius. The HAPs system handoff is
also advantageous in terms of: (a) softer cell to cell handoff due to all the cell antennas
being positioned on the same platform, thereby eradicating the need for time delay
correction; and (b) its ability to operate in several chip times, thereby enabling service to
fast moving vehicles. HAPs also have a dynamic beam assignment that allows the
provision of both service to hot spots, and point-to-point high speed coverage. Last but
not least, the improved beam radiation pattern characteristic of the HAPs system results
in lesser cell interference and thus corresponding higher spectral efficiency.

29
3. GOMEX-HAPs Communication
Network (GOMEX-HAPs Net)
This chapter proposes that there is an exigency for building a reliable wireless
communication backbone in the Gulf of Mexico (GOMEX), and that the HAPS based
UMTS-HSDPA network is the most reliable that could provide wireless coverage to
close the gap of radar coverage and wireless communication in this region. The
GOMEX-HAPS communication system is intended to provide a variety of
communication services including: UMTS, Aviation Communication Systems,
Broadband Services, and communication services intended to support civilian and
defense government services.
3.1 Network Functional Specification From the system engineering perspective, the functional specifications dictate the
expected behavior of the system. Functional specifications document what is needed by
the system user as well as the required properties of inputs and outputs.
3.1.1 Network Services The variety of communication services provided by GOMEX-HAPs Net can be
basically divided into two major categories; low data rate services for mobile terminals
and high data rate services for fixed terminals.
The following categories of network services may be included in HAP communication
services:
• Broadband Wireless Access
• Cellular Telephony (2G and 3G)

30
• Multicasting Services
• Broadcasting Services
The allocation of additional uplink channels in HAPs and the low signal time-latency
comparing to GEO satellites will allow better reception of interactive video and internet
access. GOMEX-HAPs Net will also provide affordable subscription services to the
population in the GOMEX region.
From the standpoint of profitability, GOMEX-HAPs Net may initially provide basic
cellular telephony services, aviation surveillance services and governmental coast guard
communication services. As the market grows for wireless services based HAPs and
development of communications systems customized for HAPs, then GOMEX-HAPs
services would be expanded to provide other services like broadband communication
3.1.2 System Availability and Efficiency Network availability is defined as the percentage of time for which services are not
affected by network outage (due to shadowing or blocking). In wireless communications
systems, environmental considerations (i.e., structure, rain, terrain, etc) have the greatest
effect on network availability. Since GOMEX-HAP is going to be operating over
oceanic region, the structure and terrain impacts would be minimal.
Another factor that impacts network availability is the loss margin. At the frequencies for
which HAPS have been allocated, and especially those in the millimeter-wave part of
the spectrum (above 27 GHz for HAPS), link budgets do not allow for very much loss
margin. Because of the importance of mitigating loss, gain is therefore an essential
parameter that needs to be accounted for in the link budget, particularly so at low
elevation angles, e.g. °15 , where the direct path between the HAPS and the ground
station is longer and so the path loss becomes larger than in the case of higher elevation

31
angles, e.g. °90 . The impact of a lower elevation angle on path loss is illustrated in the
example in Figure 3.1.
Figure 3.1 Impact of Lower Elevation Angle on Path Loss
Assuming an operating frequency of 28 GHz, a HAPS at 21km above the ground is
viewed by a user on the ground from two elevation angles, °90 (Terminal 1) and
°15 (Terminal 2). While the direct path between Terminal 1 and the HAPS is 21km and
80km between Terminal 2 and the HAPS is 80km, resulting in two different path losses,
152 dB and 164 dB respectively. The difference of 12 dB represents 16 times more
power, and this is high enough that it may not be accommodated for in a tight HAPS
link budget.
( )( )dBL 148
103
1028210004log20
8
9
90 =
×
×=
π (3.1)
( )( )dBL 160
103
1028810004log20
8
9
15 =
×
×=
π (3.2)

32
Gain is also significant to the ground antenna as it determines the data rates available to
the customer on the ground. High-gain antennas are necessary at millimeter-wave
frequencies in order to overcome rain fades. Using rain statistics and link budget
calculations, and assuming a downlink of 28 GHz, a channel bandwidth of 12.5MHz,
and a cell diameter of 6km, the table shown in Figure 3.2 outlines a few scenarios of
system availabilities with the link margin required to overcome rain fades [Thornton,
01].
Figure 3.2 Example of downlink data rates at 28GHz for various types of user. Inspired by [Thornton, 01]
High antenna directivity, which is the intensity with which the antenna radiates in its
preferred direction, is needed to minimize co-channel interference and maximize signal-
to-noise ratio so as to direct the wanted signal to users within the coverage area. Cellular
applications are dependent on the high directivity of antenna beams to illuminate a
specified cell coverage region, outside of which will result in interference in contiguous
cells and the decrease of carrier-to-interference ratio (CIR). The CIR can also be adversely
affected by rain scattering and attenuation which as already mentioned are more critical
at millimeter-wave frequencies, resulting in suboptimal system performance. It has been
proposed that this can be solved by using tighter antenna bandwidths and sidelobes.
33
The antenna directivity is the ratio of the maximum radiation intensity to the average
radiation intensity. The directivity and the power gain are then related by the following
equation:
( , ) ( , )G eDθ φ θ φ= (3.3)
where G is the gain of antenna, e is the efficiency, and D is the directivity.
From its definition, the directivity (D) is given by:
4 4m
A
xUD
W
π π= =
Ω (3.4)
where m
U is the maximum radiation intensity [W/rad2], W is the total power radiated
W andA
Ω is the beam solid angle [rad2]
Given the tight requirements imposed by link budgets, all three parameters must be
considered when designing the system. For instance, this relationship indicates that high
directivity with poor efficiency could still result in loss if power is poorly radiated, and
this is the case of some HAPs antennas.
3.1.3 Internetworking Requirements
GOMEX-HAPs users should be able to be connected with existing networks via
prevailing routing technologies and protocols to take advantage of existing cellular
infrastructure and established network roaming agreements for purpose of subscription
management and billing. Internetworking can be in two different ways. When the
GOMEX-HAPs network is complementary to current networks, it is termed Loose

34
interworking; and when it is a sub-component of an existing network, it is termed Tight
interworking.
Loose interworking affords more independence and flexibility for the HAPs network;
however security, mobility, and QoS standards need to be measured against Internet
Engineering Task Force (IETF) benchmarks. Tight interworking allows the GOMEX-
HAPs network to connect to the UMTS network via radio access technologies such as
UTRAN and GERAN, which obviates the need to address security, mobility and QoS
standards, and where GGSN serves as the interface between the UMTS core network
and the Internet. The same standards and requirements apply to satellite networks
where multi-HAPS platforms communicate via a satellite backhaul channel. Therefore
GOMEX-HAPS should support both loose and tight internetwork schemes.
Cell Planning
Cell planning is used to optimize coverage, make better usage of the frequency and
enhance signal quality. HAPS, terrestrial and satellite systems share allocated frequency
bands so interference analysis is critical to cell planning, which have different
considerations for HAPS than for terrestrial systems. HAPs-based systems are affected
by co-channel interference which determines the CIR distribution on the ground, but
are unaffected by propagation characteristics due to terrain characteristics. To minimize
interference, antenna specifications are of paramount importance to ensure optimum
antenna beams that will illuminate its corresponding cell with uniform power across the
cell and no power falling outside of it. For instance, aperture types have better radiation
characteristics. Antenna selection should also consider the production of beams that
have very low sidelobes and a steep roll-off in the main lobe, and directivity that is
neither too high (resulting in excessive power roll-off at the edge) or too low (resulting
in excessive power falling outside of the cell).
35
Call Admission Control
Call admission control (CAC) schemes are used to controls the number of users within
the service area. There are many CAC schemes for HAPs have been published.
According to the scheme presented in [Foo, 02a], the call will be admitted if the
downlink transmit power of all mobiles was found so as to satisfy the signal-to-noise
(SIR) requirements at available power levels. To calculate the grade of service (GoS) the
following algorithm is used:
GoS = 10b d
P P+ (3.5)
where b
P is the blocking probability, d
P is the probability of having a drop call.
CAC is necessary to ensure each mobile’s QoS requirements, by regulating the volume
of traffic or mobiles within a service area so that the signal-to-interference ratio
(SIR) level is always above a predefined limit. If incoming traffic is received beyond this
limit, the interference level will be increased while the SIR will fall below its
predetermined threshold, and handover is initiated often by system operators.
3.1.4 Handover
Handover is the process of changing the channel associated with the current connection
while a call is in progress. This process is initiated when a user is crossing the cell
boundary or detritions of the signal. Therefore, handover is based on the strength of the
received signals, in relation to the threshold or point at which communication quality
deteriorates.
Figure 3.3 illustrates how the threshold can affect when handover occurs by comparing
its relative value to the signal strengths of two HAPs (HAP1 and HAPS2) at the point

36
where they are equal. If signal strength were to be lower than T1, then handoff will
occur at position A. But if the threshold were lower than this point, e.g. T2, then
handover would be delayed until the current signal crosses T2 at position B. In the
scenario where the threshold is T3, the mobile user may now be so far from BS1 that the
quality of the communication link from BS1 is reduced to the point that the call is
dropped and there is also increased interference to co-channel users. This model shows
that overlapping cell coverage may be created. Further, since preexisting knowledge of
the crossover signal strength between the current and candidate HAP is a prerequisite
for determining the threshold, there are other factors which may be used in conjunction
with threshold to design the handover operation model. In some cases, the network
topology or regulatory issues might hand off users from one channel to another even if
the used channel is still able to provide the service.
Figure 3.3 Signal strength and hysteresis between two adjacent HAPs for potential handover
37
3.1.5 Quality of Service (QoS) Requirements QoS requirements for GOMEX-HAPs should consider both the restrictions and
limitations of radio interface, as well as solutions for air interface constraints, and
should be based on those specified for ITU Broadband Radio Access Networks. QoS
provisioning should only be implemented where there is user subscription, and the user
should be charged for the level of QoS provided and subscribed. The GOMEX-HAPs
network operator should be able to monitor the QoS provisioning, within any HAP or
the entire network should have little impact on that in other networks. There should
also be a mechanism in place to prevent unauthorized users from sending inadmissible
data through the network.
In order to simplify interworking with the operator’s ISP platform, the QoS
mechanisms of GOMEX-HAPs networks towards external networks should be aligned
with the IP mechanisms. Finally, as part of expandability, the GOMEX-HAPs network
should easily integrate the IP Multimedia Subsystem QoS requirements.
3.1.6 GOMEX-HAP Network Management
The Network Control Center (NCC) is the command center managing the
communication services provided by the GOMEX-HAPs Net. Using the PSLs, network
staff in the NCC will be able to perform all real-time network management tasks
including, resource allocation, links security and user authentication, traffic management
and data compilation for billing and system health management including system
configuration, testing, maintenance and software upgrade. Beside the NCC, GOMEX-
HAP operators would be able to perform all non-real-time network management tasks
via remote control centre in the ground station.

38
3.2 System Architecture GOMEX-HAPs network architecture design can be optimized by placing the most
complex components of the system in the ground segment, minimizing payload and
power consumption, and maximizing reliability. While the transparent HAP functions
primarily as a relay station transmitting information from an uplink to a downlink
channel, the HAP functions as an on-board processing system with multiple
components such as a multichannel transponder, antenna interfaces, digital signal
processing system, and so on.
A typical HAPs communications system consists of stratospheric and ground segments.
The stratospheric segment includes mainly the airship, telecommunications payload, and
navigation and surveillance equipment. The ground segment consists mainly of ground
station hubs which connect the HAPs network with the terrestrial communication
networks and its user, and Command and Control centers which track, maintain and
control aerial system platforms. In the next section we will discuss each of the segments
in more details.
3.2.1 Stratospheric Segment
The stratosphere layer is the second major layer of Earth's atmosphere, just above the
troposphere, and below the mesosphere. In GOMEX-HAPS, this stratospheric segment
may be divided into three main elements, the telecommunication payload, the airship
and the flight control system. The payload represents the motivation for the mission
itself, which for a HAPS communication system involves telecommunications
equipment and infrastructure. In the next three sections we will discuss in brief the main
components of the stratospheric segment. The subsystems which form the stratospheric
segment are shown in Figure 3.4.

39
Figure 3.4 The Subsystems of the Stratospheric Segment
Platforms (HAPs)
The GOMEX-HAPs airships consist of lighter-than-air airship (LTA) positioned in the
stratosphere balloons called “aerostats” equipped with propulsion systems powered by
solar power, flying over 100m long with a payload of about 800kg or more as shown in
Figure 3.5. The platform will be kept within an altitude of 20-21 km where air density is
approximately one-fourteenth that at sea level. The aim is for this type of aerial vehicle
to stay aloft up to 5 years or longer. During operation, the airship is kept relatively
stationary using a light weight high tech engine and position sensors with advanced
control system to counteract movements due to wind. The engine could also be utilized
to move the airship to a new position assigned by the ground controller. The aerostatic
platforms can carry heavier payloads (about 1000 kg mass) [14], having easy and precise
station-keeping for nominal environmental conditions and sufficient surface area for
power generation.
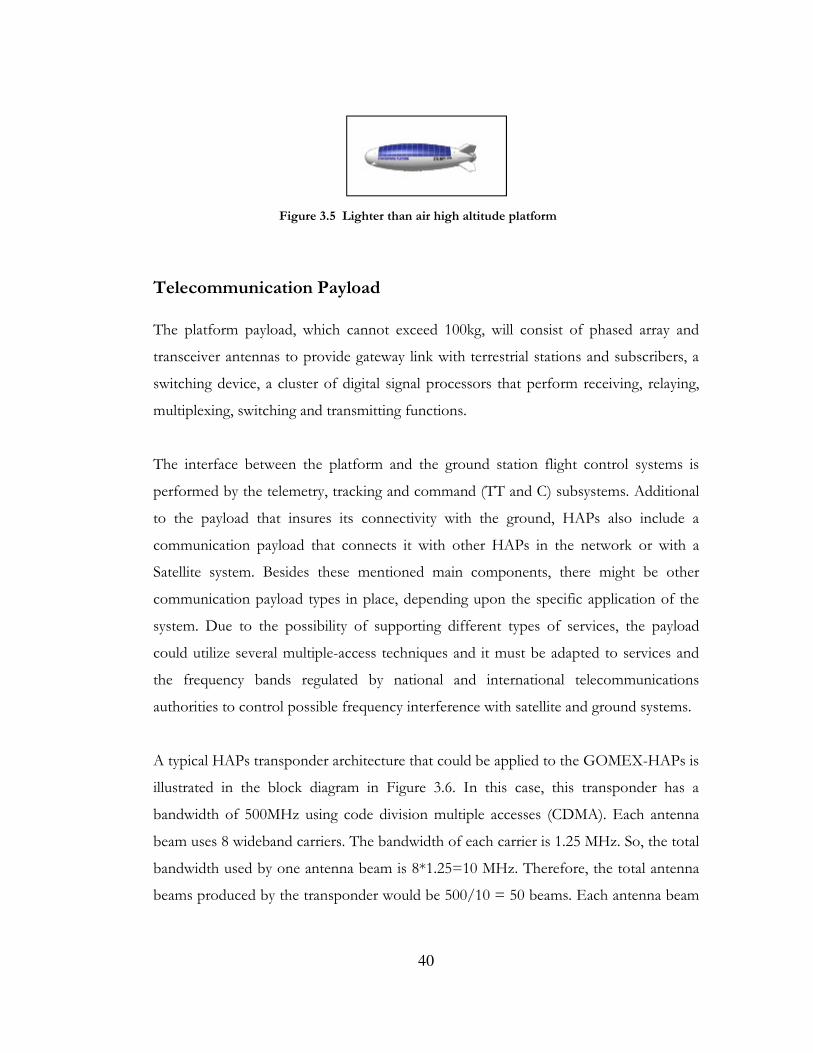
40
Figure 3.5 Lighter than air high altitude platform
Telecommunication Payload
The platform payload, which cannot exceed 100kg, will consist of phased array and
transceiver antennas to provide gateway link with terrestrial stations and subscribers, a
switching device, a cluster of digital signal processors that perform receiving, relaying,
multiplexing, switching and transmitting functions.
The interface between the platform and the ground station flight control systems is
performed by the telemetry, tracking and command (TT and C) subsystems. Additional
to the payload that insures its connectivity with the ground, HAPs also include a
communication payload that connects it with other HAPs in the network or with a
Satellite system. Besides these mentioned main components, there might be other
communication payload types in place, depending upon the specific application of the
system. Due to the possibility of supporting different types of services, the payload
could utilize several multiple-access techniques and it must be adapted to services and
the frequency bands regulated by national and international telecommunications
authorities to control possible frequency interference with satellite and ground systems.
A typical HAPs transponder architecture that could be applied to the GOMEX-HAPs is
illustrated in the block diagram in Figure 3.6. In this case, this transponder has a
bandwidth of 500MHz using code division multiple accesses (CDMA). Each antenna
beam uses 8 wideband carriers. The bandwidth of each carrier is 1.25 MHz. So, the total
bandwidth used by one antenna beam is 8*1.25=10 MHz. Therefore, the total antenna
beams produced by the transponder would be 500/10 = 50 beams. Each antenna beam

41
uses different frequencies to reduce intracellular interference and 2 separate antenna
beams also use different frequencies to reduce intercellular interference.
Figure 3.6 A Typical HAPS Transponder Architecture Applied to GOMEX-HAP
The uplink process begins with the reception of the carriers by a platform antenna
subsystem. The carriers are then amplified by a low-noise amplifier (LNA), while pass-
band filters limit their bandwidth up to 10MHz, and then multiplexed using frequency
division multiplexing (FDM). These multiplexed signals are further amplified by a high-
power amplifier (HPA) stage, filtered and multiplexed, before being transmitted to the
ground station. The downlink process engages a demultiplexer instead of a multiplexer
[ITU-F1500, 00], however the steps are the same as in the uplink except in reverse
direction
Flight Control and Power System
The majority of the airship surface will be covered with thin-film solar cells to generate
all the necessary power for the airship surveillance and navigation equipment, station-
keeping systems, telecommunications transceivers and antennas, and fuel cell re-
charging systems. The main problem with using solar power systems as a power source
is the operations during night time. Using re-chargeable traditional batteries will add to
the weight of the airship, therefore, to overcome this problem, the preferred choice will
be to use a Regenerative Fuel Cell (RFC) technology to provide a continuous source of

42
power during both day and night. As shown in figure 3.7, the electrical power
subsystem consists of three main elements: the primary and secondary energy sources,
and a power/control distribution network.
Figure 3.7 The Elements of an Electrical Power Subsystem
3.2.2 Ground Segment
The earth segment of HAPs wireless network architecture consists of ground stations,
base station equipment, main switching center, and user terminals, as shown in Figure
3.8.
The earth segment also includes the large number of cells projected by the high gain
transmit/receive antennas used onboard the HAPs. The cells are constructed in the
same pattern that is created by a traditional cellular system, as shown in Figure 3.8. The
size of the HAP footprint in the earth segment and the number of cells in the spot
beams are determined by the antenna array which is designed to match the demand for
the capacity within any selected coverage area.

43
Figure 3.8 Cellular System of a Ground Segment
The power designated to each cell, and the cell’s boundaries, are configured to enhance
the system capacity. In order to provide a high level of capacity for high-density zones,
more channels should be assigned to the zone, therefore we will have more cells but the
size of each cell will be smaller, whereas for less dense zones we will need less channels,
therefore each cell size will be larger.
The HAPs ground segment will include a Network Control Center (NCC) to function
as the command and control center for the HAPs network. The NCC will control and
manage all communications, network switching and management facility for the HAPs
data system. It will also serve as the point of connectivity between partnering carriers
and their customers. It will route subscriber communication to the proper platform via
a ground station, store device location and usage information, and provide monitoring
and test functions for overall network management.
3.3 GOMEX-HAP Network Topology
In order to decide how many HAPS are needed to provide the adequate coverage
needed, we need to know the area covered by a single HAP. For a given platform
altitude h, the diameter of the HAPS footprint can be computed using the formula:

44
−
+= − θθcoscos2 1
hR
RRd (3.6)
where R is the Earth radius (6378 km), is the minimum elevation angle and the
altitude.
Equation (3.6) leads to a minimum elevation angle of = 15 degrees for a footprint
diameter of d = 152 km and a minimum elevation angle of = 0 degrees for a footprint
diameter of d = 1'033 km (both at a platform altitude h = 21 km).
Applying the above equation give that each HAP would cover an area of 72,000 2km at
= 15 degrees.
The total area of the Gulf of Mexico = 615,000 square mile ≈ 1.6 million 2km
The radar gap of GOMEX = 60,000 square mile ≈ 144,400 2km
Therefore 3 HAPs would be sufficient to cover the Non-Radar Area (NRA) gap.
In order to connect the 3 HAPs stationed above the gap with the terrestrial UMTS, we
would need additional 3 boarder HAPs that would be connected with the Core HAPS
via IPL. The high level of the network topology is shown in figure 3.9. In order to
achieve best utilization of HAPs, it’s recommended to station the boarder HAPs over
highly populated coastal regions so it could relief the load on the terrestrial UMTS
networks.

45
Figure 3.9 GOMEX-HAPs Net Typology
3.4 HAPS Antenna Subsystems
Since GOMEX-HAPs is intended to provide various sorts of communication services
such as broadband, cellular 3G, emergency and broadcast to fixed and mobile users,
therefore the antennas for both on HAPs and the users antennas are considered key
elements which affect system performance.
Like any wireless communication system, the performance factor for HAPs lies in the
Antenna system. The GOMEX-HAPs platforms will be operating above oceanic region;
therefore it would be costly to bring down the platform for repairs or modification.
Therefore, HAPs antenna should have specific requirements to make it more reliable
and adaptable to HAPS operational requirements.

46
3.4.1 HAPS Antennas Recommendations for 2.1 GHz
For IMT-2000, the ITU-R has defined an operating frequency around 2 GHz, which
will be exploited particularly in North America. For HAPs applications, newer
requirements for 3G (Third Generation) cellular have been established [ITU-145, 05],
whereby to maintain co-channel interference levels at a minimum, all HAPS-based
ground stations should comply with the following radiation characteristics:
( )2
3
−=
b
mGGψ
ψψ for 10 ψψ ≤≤° (3.7)
( ) Nm LGG +=ψ for 21 ψψψ ≤≤ (3.8)
( ) ( )ψψ log60−= XG for 32 ψψψ ≤≤ (3.9)
( ) FLG =ψ for °≤≤ 903 ψψ (3.10)
where
( ) =ψG gain at angle ψ from the main lobe principle direction, dBi
=mG maximum gain at optical axis of the antenna, dBi
=bψ half of the 3dB beam width in the plane considered, degrees
=NL nearest sidelobe level dB, with respect to the required peak gain for the system
design, whose maximum value is – 25 dB;
and 73−= mF GL , the furthest sidelobe level, dbi.
−=
31
N
b
Lψψ (3.11)
bψψ 745.32 =
)log(60 2ψ++= Nm LGX (3.12)

47
603 10
FLX −
=ψ (3.13)
The angles ,,, 321 ψψψ are given in degrees, whereas X is in dB. The 3dB beam width
( )bψ2 is computed as:
mGb 1.010
7442=ψ (3.14)
The above-mentioned recommendation is only applicable for frequencies around 2
GHZ.
3.5 Rain Attenuation
Wave attenuation is positively correlated with the number of raindrops along the path,
the size of the drops and the length of the path through the rain, as shown in Figure
3.10. The equation to compute wave attenuation (dB/km) is typically:
baRγ =
where a and b depend on frequency and average rain temperature and γ has units
dB/km. Figure 3.10 shows values for a and b at various frequencies at 20oC for
horizontal polarization [ITU-P838, 92].
Frequency (GHz) a b
______________________________________________________ 1 0.0000387 0.912 10 0.0101 1.276 20 0.0751 1.099 30 0.187 1.021 40 0.35 0.939 ______________________________________________________
Figure 3.10 Parameters for Empirical Rain Attenuation Model, extracted from [ITU-P838, 92]

48
The effects of rain attenuation are negligible at lower frequencies (2.1GHz and below),
but significant at higher frequencies (above 20GHz). Fig 3.10 illustrates the attenuation
in dB/km due to rain.
3.5.1 GOMEX-HAPs Interconnection
Due to the lack of availability of ground stations within the reach of the footprint of
GOMEX-Core HAPs, and the distance between border-HAPs is to long to be
connected via ground station, therefore HAPs interlinks will be either IPL or PSL. This
would allow for communication between two or more contiguous platforms without the
need for ground network elements and with fewer requirements for ground and
uplink/downlink segments, while increasing the flexibility of system coverage. In the
scenario of an IPL failure, border-HAPs will not be able to connect GOMEX-HAPs
with the terrestrial UMTS, in such case, PSL will serve as back up for certain nodes,
depending on the priority level of the node and the contractual agreements with the
service provider.
Figure 3.11 HAPS Inter-Platforms Link (IPL)

49
3.5.2 Integrating GOMEX-HAP with Satellite and Terrestrial Networks
For the GOMEX-HAP to be an efficient communication system it must be able to
interconnect with terrestrial and satellite based networks. GOMEX-HAPs, GEO
satellite and terrestrial systems can coexist to provide fixed and mobile communication
service, as numerous studies have shown.
However a few important factors must be taken into account when designing this
interconnected system : the interference propagation paths between HAPs ground stations
and Fixed Satellite Service (FSS) satellites; interference levels for frequency sharing between
High-Density Fixed Satellite Service (HD-FSS) downlink and HAPs links; co-channel
interference effects from HAPs into UMTS terrestrial towers, including the effects of
arbitrary services areas, shadowing, and reverse link co-channel interference. Further
efforts are also required to establish a methodology for more realistic and applicable
coordination contours between terrestrial and HAPs ground stations, and to standardize
uniform interference criteria. Figure 3.12 shows the proposed integration of GOMEX-
HAP, satellite and UMTS network. The GOMEX-HAPs network would connect with a
‘border’ HAP via an optical link, while the latter would be connected with the terrestrial
network.

50
Figure 3.12 Proposed Integration of GOMEX-HAPs, Satellite and UMTS Network

51
4. System Modeling
In this chapter we will perform the mathematical modeling and analysis on applying the
28/31 GHZ since it’s the allocated spectrum for the North America region. We will
study HAPs geometric footprint, then we will briefly review the basic methods to
calculate signal power and link budget. Then we will perform the channel modeling and
the last part of this section we will analyze the UMTS system performance in HAPs.
4.1 Geometric Footprint Analysis
In order to perform geometric analysis on HAPs footprint, the major and minor axes
and there variations with the utilized antenna beam-widths and beam direction should
be determined. The coverage analysis could be defined based on two assumptions; first
is to assume that the earth surface is flat and then we perform the analysis based on the
curved surface of earth
4.1.1 Flat Surface Analysis In this analysis we would assume that the ground cells are formed by directing a beam
using phased arrays. Referring to Figure 4.1, the HAP is stationed at an altitude about
21 km high, which is very small comparing with the earth’s radius, therefore we can
approximate the earth as a flat surface as shown in the figure. The foot print of the
antenna beam is illustrated with this ellipse which has major and minor accesses.

52
Figure 4.1 HAP Cell Footprint
Let’s donate major access JK as fy and the minor access HK as fx . Figure 4.2 defines
the cell formed by beams θB and φB .
Figure 4.2 Flat Surface
In Figure 4.2, the major access LM is given as:

53
0 0tan tan2 2
F
B By h θ θθ θ
= + − −
(4.1)
The minor access JK is given by:
2 sec( ) tan2
F c
Bx h
φθ
=
(4.2)
where the center of the cell (C ) is located by an angle from the platform given by:
1
0tan tan2 2
Fc
B y
h
θθ θ− = − +
(4.3)
So the shape of the foot print will be defined from the minor and major axis. If we use
the flat surface assumption, it’s easier to perform calculations but when the coverage
area increases the approximation error will increase, we will not be able to use it.
4.1.2 Curved Surface Analysis
Taking into consideration the curvature of the earth surface would complicate the
calculations but give more accurate results. The geometry which defines the cell formed
by the antenna is shown in Figure 4.3.
In this figure, the major axis is the arc between the two ground central angles 1φ and
2φ is give as [23].
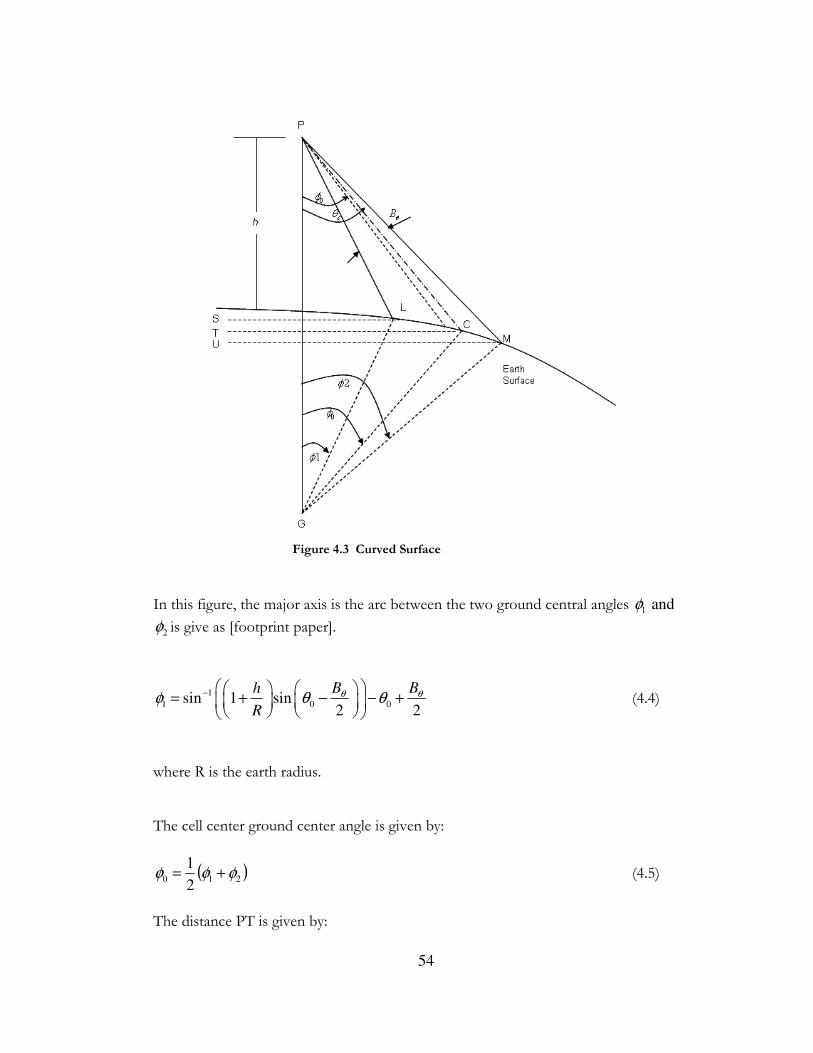
54
Figure 4.3 Curved Surface
In this figure, the major axis is the arc between the two ground central angles 1φ and
2φ is give as [footprint paper].
1
1 0 0sin 1 sin2 2
B Bh
R
θ θφ θ θ− = + − − +
(4.4)
where R is the earth radius. The cell center ground center angle is given by:
( )2102
1φφφ += (4.5)
The distance PT is given by:

55
( ) ( )( )
+−+= 21 coscos
2
11 φφRhPT (4.6)
and the distance TC is given by:
( ) ( )( )( )021 tancoscos2
1φφφ += RTC (4.7)
The distance between the platform and the cell center PC is given by:
22TCPTPC += (4.8)
From the above equations the major access Cy can be defined as:
)( 12 φφ −== RLMyC (4.9)
or
1 1
0 0sin 1 sin sin 1 sin2 2
c
B Bh hy R B
R R
θ θθθ θ− −
= + + − + − −
(4.10) So the cell center
= −
PT
TCc
1tanθ
1 0
1 2
tan(tan
2 1
(cos( ) cos( )) 1
ch
R
φθ
φ φ
−
= +
+ −
(4.11)
Therefore the cell minor access
Cx is given by:
==
2tan2
φBPCJKxC (4.12)

56
or
=
2tan)sec(2
φθ
Bhx cC (4.13)
which can be represented as:
12 2
2 2
1 2 1 2 0
1 12 tan 1 ((cos( ) cos( )) ((cos( ) cos( )) tan ( )
2 2 4c
B hx R
R
θ φ φ φ φ φ
= + − + + +
(4.14) The relative error in the major access between using the flat model and the curved
model is given by:
%100*C
FC
yy
yy −=ε (4.15)
The results of the MatLab simulation are reported in Chapter 5 Section 5.1. Comparing
Figures 5.1 and 5.2, we notice that for both the flat surface model and the curved
surface model using the directional antenna, there are variations of the cell major access
with beam direction at different beam widths, and an increase in the footprint with
increasing beam direction and beam width.
Also, we will notice that using the flat surface model simplifies the equations but
increases the error rate, whereas the curved surface model equations are more
complicated but the error rate is less. The variation in the error rate within axes is also
dependent on the distance from the center of the circle and is greater in the outer circle
than it is in the inner circle. Therefore we could utilize both models by applying the flat
surface model with simple equation in the cell near the center where the error rate is
minimal and acceptable, while for the outer cells we could apply the curved surface
model.

57
4.2 GOMEX-HAPs Link Budget
The HAPS communication is based on the line-of-sight principle. This type of links is
governed by free space propagation with only limited variation with respect to time.
There are other effects that might cause signal attenuation and cause time variation in
the signal sequence. The moist in the air is one of the effects but rain rain attenuation
effects are negligible at the range of 2.1GHz. In the next step we will apply the basic
communication theories to define the transmitted and received powers and the loss of
signal in the process.
4.2.1 Free-Space Propagation and Path Loss Theory
Path loss (or path attenuation) is the loss in signal strength of an electromagnetic wave
as it propagates through space. Calculating path loss is basically to find the ratio of the
transmitted power to the received power between a pair of antennas, and it is usually
expressed in decibels.
The link between a given HAP and earth terminal is specified by the basic microwave
radio link equation:
( ) 222
2
rttr
FD4
cGGPP
π= (4.16)
where
rP is the received power by the receiver antenna in Watts;
tP is the transmitted power by the transmitter in Watts;
rG is the receiver gain;
tG is the transmitter gain;
c is the speed of light ( sm /103 8∗ )

58
D is the path length in which the signal travels in meters;
F is the frequency in hertz
In order to simplify the communication equation, we will represent the above equation
using the decibel (dB). The formula to represent the dB gain is given as;
)P
Plog(10P
r
tdB ∗= (4.17)
The free space loss between HAP antenna and the receiver antenna Lf is given by:
2
λ
4πLf
= (4.18)
This equation could be presented as:
2
c
f4L f
=
rπ
where r is the distance between the antennas, c is the speed of light, and f is the
operating frequency.
Expressing the free space loss in dB as L
=
=
c
f4log20
2
c
f4log10L f
rr ππ (4.19)
Therefore, the Free space loss (dB) = 32.44 + 20 log f (MHz) + 20 log r (km).
In order to estimate HAPs transmitter service area we should calculate the Effective
Isotropic Radiated Power (EIRP), which is defined as the amount of power that a
theoretical isotropic antenna would emit to produce the peak power density observed in
the direction of maximum antenna gain. From the definition, the EIRP is given by:

59
22
0 0 maxρ sin(θ) θEIRP r d d
π π
θ φφ
= == ∫ ∫ (4.20)
where maxρ is the maximum time-averaged power density found over the surface of the
measurement sphere. Assuming that the maximum power density can be defined using
the bore-sight gain of the antenna,
2max
t tρ4π
P G
r=
(4.21)
Combine this with the equation for EIRP to get
22
20 0
t t sin(θ) θ4π
P GEIRP r d d
r
π π
θ φφ
= == ∫ ∫
(4.22)
=t t
P G
EIRP is db is represented as:
)Glog(P10EIRP tt∗=
The next step is to find the carrier-to-noise ratio (CNR or C/N). The CNR is the
quotient between the average received modulated carrier power C and the average
received noise power N after the receiver filters and it is given by:
BkT
P
N
C
s
r= (4.23)
where:
k = Boltzmann’s constant (1.38 ´ 10-23 J/K)
Ts = System noise temperature of receiver (K)
B = Noise bandwidth (Hz)

60
4.3 Channel Modeling
In this section, we will apply the small-scale fading scheme by Dovis-Fantini to identify
the characteristics of the channel connecting HAP and a terrestrial user to derive the
channel model in the 2.1-GHz frequency range. Rain attenuation effects will not be
taken into account since they are negligible at the selected frequency range. In this
analysis, the power delay profile for HAP is obtained and then the coherence bandwidth
and the coherence time are evaluated.
In this channel model, illustrated in the figure 4.4 shown below, the HAPs platform or
transmitter (TX) is assumed to be at a point in space with coordinates (0, 0, z0), and the
ground receiver (RX) is assumed at a point in space with coordinates (x0, 0, 0), where x0
and z0 are not at the same horizontal plane.
Figure 4.4 Channel Model [2]

61
Consider the ellipsoid Σ as the boundary containing the scatterers that cause excess
delays < τ e.g. S, with a height s
z < h, and assume that S is uniformly distributed in a
thin layer close to the ground, since scatterers are typically land structures which are
within a certain height h.
Then the length of the direct transmission path r0 is calculated by:
2 20 0 0r x z= +
(4.24)
and consequently, the propagation delay is obtained as:
00
r
cτ =
where c is the speed of light (4.25)
A reflected wave that is incident on the receiver with an excess delay τ will have
covered a path length given by
0( ) ck r ττ += (4.26)
TX and RX are points which form the foci of the ellipsoid∑ , where the sum of the
distance from TX and RX equalsk( )τ . Thus, all the scatterers in ∑ generate a total
path length < k( )τ , and any reflected ray with an excess delay < τ , i.e. with total path
length < k( )τ , must be associated with a scatterer S located in the ellipsoid ∑ . The
area ( , )A z τ is the intersection of the ellipsoid ∑ with a horizontal plane at the
height z .
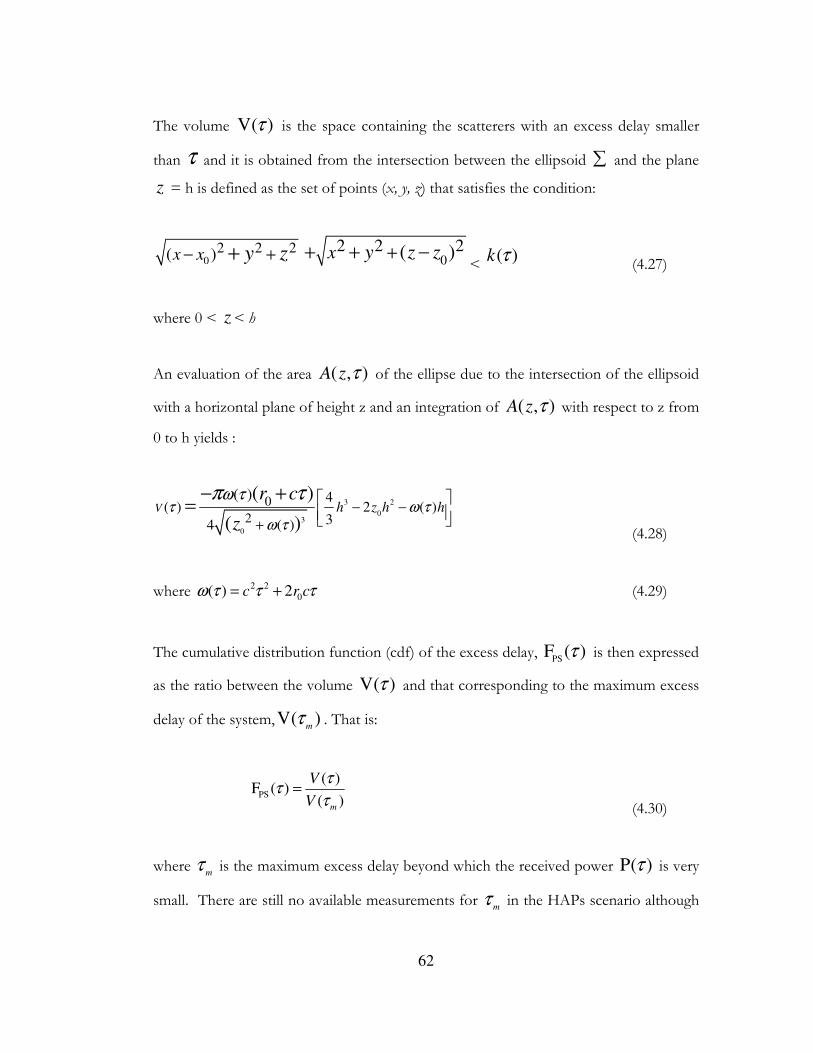
62
The volume V( )τ is the space containing the scatterers with an excess delay smaller
than τ and it is obtained from the intersection between the ellipsoid ∑ and the plane
z = h is defined as the set of points (x, y, z) that satisfies the condition:
02 2 2( )x x y z− ++ 0
2 2 2( )x y z z++ + −<
( )k τ (4.27)
where 0 < z < h
An evaluation of the area ( , )A z τ of the ellipse due to the intersection of the ellipsoid
with a horizontal plane of height z and an integration of ( , )A z τ with respect to z from
0 to h yields :
3 2
03
0
0
2
4( ) 2 ( )
34 ( )
( )( )
( )V h z h h
r c
zτ ω τ
ω τ
ω τπ τ− −
+
− +=
(4.28)
where 2 2
0( ) 2c r cω τ τ τ= + (4.29)
The cumulative distribution function (cdf) of the excess delay, PS
F ( )τ is then expressed
as the ratio between the volume V( )τ and that corresponding to the maximum excess
delay of the system,V( )m
τ . That is:
PS
( )F ( )
( )m
V
V
ττ
τ=
(4.30)
where m
τ is the maximum excess delay beyond which the received power P( )τ is very
small. There are still no available measurements for m
τ in the HAPs scenario although
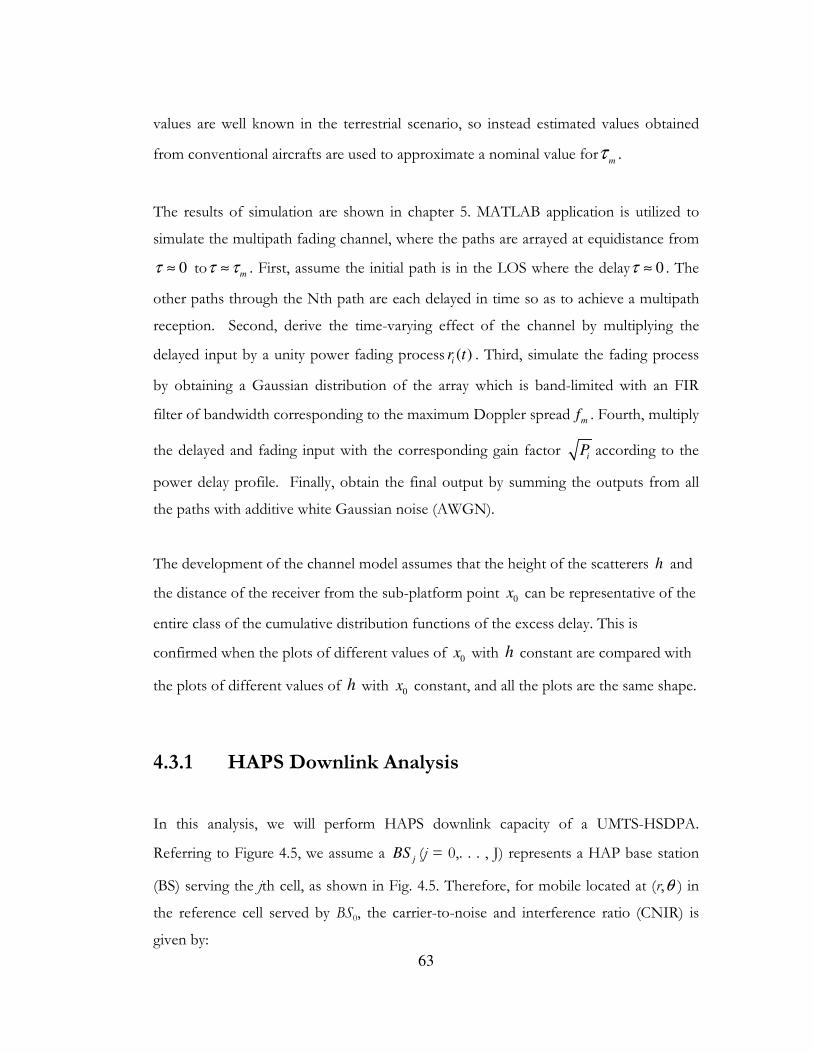
63
values are well known in the terrestrial scenario, so instead estimated values obtained
from conventional aircrafts are used to approximate a nominal value form
τ .
The results of simulation are shown in chapter 5. MATLAB application is utilized to
simulate the multipath fading channel, where the paths are arrayed at equidistance from
0τ ≈ tom
τ τ≈ . First, assume the initial path is in the LOS where the delay 0τ ≈ . The
other paths through the Nth path are each delayed in time so as to achieve a multipath
reception. Second, derive the time-varying effect of the channel by multiplying the
delayed input by a unity power fading process ( )i
r t . Third, simulate the fading process
by obtaining a Gaussian distribution of the array which is band-limited with an FIR
filter of bandwidth corresponding to the maximum Doppler spreadm
f . Fourth, multiply
the delayed and fading input with the corresponding gain factor iP according to the
power delay profile. Finally, obtain the final output by summing the outputs from all
the paths with additive white Gaussian noise (AWGN).
The development of the channel model assumes that the height of the scatterers h and
the distance of the receiver from the sub-platform point 0x can be representative of the
entire class of the cumulative distribution functions of the excess delay. This is
confirmed when the plots of different values of 0x with h constant are compared with
the plots of different values of h with 0x constant, and all the plots are the same shape.
4.3.1 HAPS Downlink Analysis
In this analysis, we will perform HAPS downlink capacity of a UMTS-HSDPA.
Referring to Figure 4.5, we assume a j
BS (j = 0,. . . , J) represents a HAP base station
(BS) serving the jth cell, as shown in Fig. 4.5. Therefore, for mobile located at (r,θ ) in
the reference cell served by BS0, the carrier-to-noise and interference ratio (CNIR) is
given by:

64
intra inter
G Pp ru
CNIRP P P
N
=+ +
(4.31)
where
Gp is the UMTS-HSDPA processing gain (Spreading Factor) = 16
Pru is the received power of the desired signal of the UMTS-HSDPA user under
consideration
intraP
is the received intracellular Interference
interP
is the received intercellular Interference
PN is the receiver thermal noise
Figure 4.5 Downlink Analysis of a UMTS- HSDPA [21]

65
Equation (4.20) could be rewritten as [Taha, 21]:
( )0 0 0
0 0 0 0 1
( )
( ) ( )
s
p u
js s
T u Tj j j j Nj
G P G lCNIR
P P G l P G l P
κ ψ ζ
κ ψ ζ φ κ ψ ζ
−
− −
=
=− + +∑
(4.32)
where
κ is the propagation loss factor
uP is the power assigned to the UMTS-HSDPA user under consideration
0( )G ψ is the normalized antenna gain in dB evaluated at the angles under which the
mobile is seen from the antenna boresights of 0
BS .
( )j
G ψ is the normalized antenna gain measured in dB evaluated at the angles under
which the mobile is seen from the antenna boresights of BSj
0l is the distances from the mobile to
0BS ,
jl
is the distance from the mobile to BS
j .
TjP
is the total power transmitted by the cell j
0ζ signify the shadowing corresponding to 0l in dB
jζ
and 0ζ signify the shadowing corresponding to j
lin dB
s is the path loss exponent = 2
φ is the non-orthogonality factor
J is the number of cells in the HAP constellation that contribute in the intercellular
interference
The effective path loss L between the HAP and the UMTS-HSDPA user under
consideration is given by :

66
10
4(dB) 20log (dB)BPL shd ant HAP
dL L L G
π
λ−
= + + −
(4.33)
where
d is the distance between the HAP and the user in meters.
λ is the wavelength.
BPLL
is the additional penetration loss assumed to be 12 dB
shdL
is the shadowing margin assumed to be 10 dB in urban zones and 5 dB in rural
zones
ant HAPG − is the HAP antenna gain at the boresight given in dB
The factor κ is given by :
( )/10
1
10L dBκ =
(4.34)
The power u
P assigned to the HSDPA user under consideration is given as:
HSDPAu
u
PP
N=
(4.35)
where
uN is the number of the HSDPA users per cell and
HSDPAP is the power assigned for the HSDPA user’s channels ≈ 20% of the maximum
transmitted power by the base station (HSDPA offered on a best effort basis with a
minimum reserved power)

67
Since the transmit antenna beams of all base stations essentially originate from the same
point, so 0jl l= and 0j
ζ ζ= (total correlation). Thus, the carrier-to-noise and
interference ratio CNIR can be given as [21]:
( )0 0 0
0 0 0 0 0 01
( )
( ) ( )
s
p u
js s
T u Tj j Nj
G P G lCNIR
P P G l P G l P
κ ψ ζ
κ ψ ζ φ κ ψ ζ
−
− −
=
=− + +∑
(4.36)
When N
P is very small compared to the interference power, CNIR can be written as:
( )0 0 0
0 0 0 0 0 01
( )
( ) ( )
s
p u
js s
T u Tj jj
G P G lCNIR
P P G l P G l
κ ψ ζ
κ ψ ζ φ κ ψ ζ
−
− −
=
≈− + ∑
(4.37)
This can be re-written as:
( )0
0 0 1
( )
( ) ( )
p u
j
T u Tj jj
G P GCNIR
P P G P G
ψ
ψ φ κ ψ=
≈− + ∑
(4.38)
The downlink performance is studied with the following assumptions:
• Height of HAP = 20 km
• Cell radius R = 2km
• T
P (full load) = 10 W/cell
• HSDPA
P = 2 W/cell regardless of cell load
• HAP antenna gain at zero angle of 37 dB with 3 dB beam width of 2.42°
• NP = 100 dBm
• Frequency of operation = 2.14 GHz
• P
G = 16
• J = 60
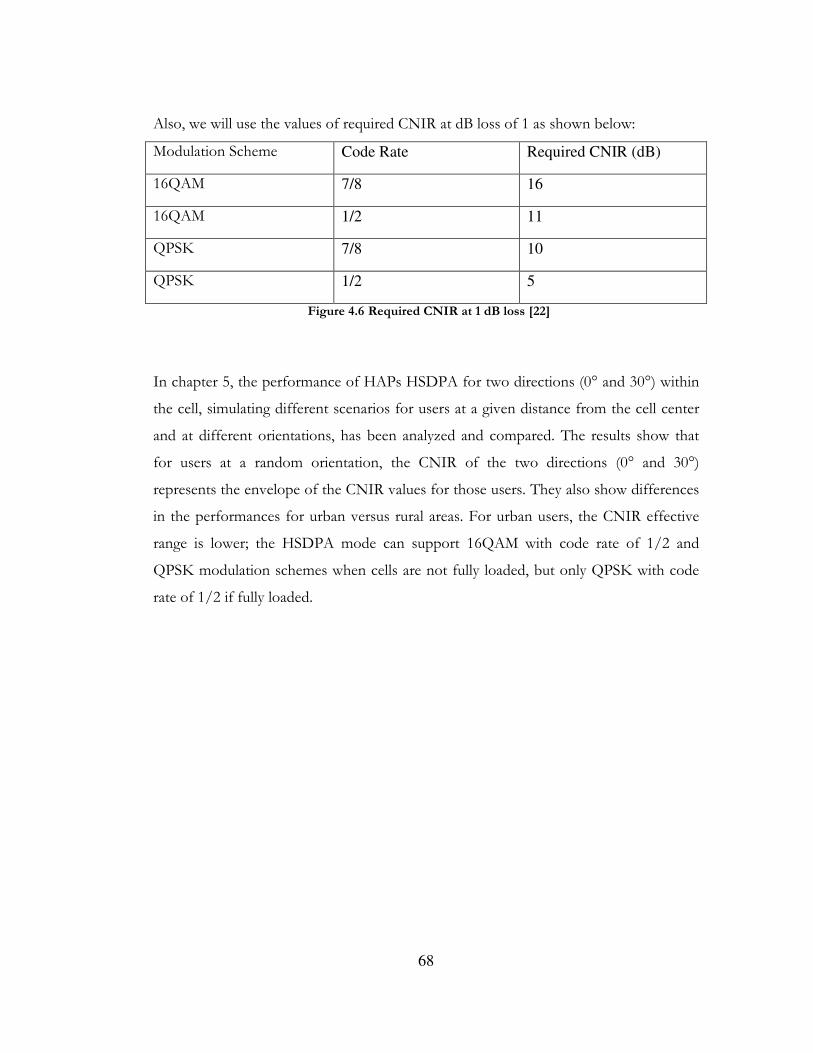
68
Also, we will use the values of required CNIR at dB loss of 1 as shown below:
Modulation Scheme Code Rate Required CNIR (dB)
16QAM 7/8 16
16QAM 1/2 11
QPSK 7/8 10
QPSK 1/2 5
Figure 4.6 Required CNIR at 1 dB loss [22]
In chapter 5, the performance of HAPs HSDPA for two directions (0° and 30°) within
the cell, simulating different scenarios for users at a given distance from the cell center
and at different orientations, has been analyzed and compared. The results show that
for users at a random orientation, the CNIR of the two directions (0° and 30°)
represents the envelope of the CNIR values for those users. They also show differences
in the performances for urban versus rural areas. For urban users, the CNIR effective
range is lower; the HSDPA mode can support 16QAM with code rate of 1/2 and
QPSK modulation schemes when cells are not fully loaded, but only QPSK with code
rate of 1/2 if fully loaded.

69
5. MAT-LAB Results
5.1 Footprint Results
Figure 5.1 Variations of the cell major axes ( y ) with the beam direction θo at different
beamwidths Bθ for flat surface ( Fy ) coverage models using directional antennas.

70
Figure 5.2 Variations of the cell major axes ( y ) with the beam direction θo at different
beamwidths Bθ for curved surface ( Cy ) coverage models using directional antennas.

71
Figure 5.3 Absolute error variation between major access flat surface model and curved surface model with beam direction at different beamwidths.

72
Figure 5.4 Relative error variation between major access flat surface model and curved surface model with beam direction at different beamwidths.

73
Figure 5.5 Variations of the cell minor axes ( x ) with the beam direction θo at different
beamwidths Bθ for flat surface ( Fx ) coverage models using directional antennas.

74
Figure 5.6 Variations of the cell minor axes ( x ) with the beam direction θo at different
beamwidths Bθ for curved surface ( Cx ) coverage models using directional antennas.

75
Figure 5.7 Absolute error variation between minor access flat surface model and curved surface model with beam direction at different beamwidths.

76
Figure 5.8 Relative error variation between major access flat surface model and curved surface model with beam direction at different beamwidths

77
Figure 5.9 3-D illustration of flat surface major access variation with beam direction at different beamwidths

78
Figure 5.10 3-D illustration of curved surface major access variation with beam direction at different beamwidths

79
Figure 5.11 Major access absolute error variations represented in 3-D

80
Figure 5.12 Major access relative error variations represented in 3-D

81
Figure 5.13 3-D illustration of flat surface minor access variation with beam direction at different beamwidths

82
Figure 5.14 3-D illustration of curved surface minor access variation with beam direction at different beamwidths

83
Figure 5.15 Minor access absolute error variations represented in 3-D

84
Figure 5.16 Minor access relative error variations represented in 3-D

85
5.2 Channel Modeling Results
Figure 5.17 Excess delay cumulative distribution with 0.15m sτ µ= , h=21 m, 0 20kmz = , and x
varying from 0 to 100 Km with step 20 Km.

86
Figure 5.18 Excess delay cumulative distribution with 0.15m sτ µ= , 0 40kmx = , 0 17kmz = ,
and varying from 1m to 51 with step 10m.

87
Figure 5.19 BER for a 4-DPSK transmission scheme obtained over AWGN, frequency-°at Ricean and stratospheric channel with a C/M ratio of 18 dB, at a bit rate of 0.25, 1, 4 Mb/s.

88
Figure 5.20 BER for a 4-DPSK modulation obtained over AWGN, frequency-°at Ricean and stratospheric channel with a C/M ratio of 6 dB, at a bit rate of 0.25, 1, 4 Mb/s.

89
5.3 System Capacity Results
Figure 5.21 /bE N as a function of the HSDPA user distance from the cell centre when
h = 20 km, R = 2 km, Φ =0.1, N=1, fully loaded cell. Φ =0.1, N=1, fully loaded cell. (Φ is the non-orthogonality factor, N is the number of users).

90
Figure 5.22 /bE N as a function of the HSDPA user distance from the cell centre when
h = 20 km, R = 2 km, Φ =0.1, N=2, fully loaded cell.
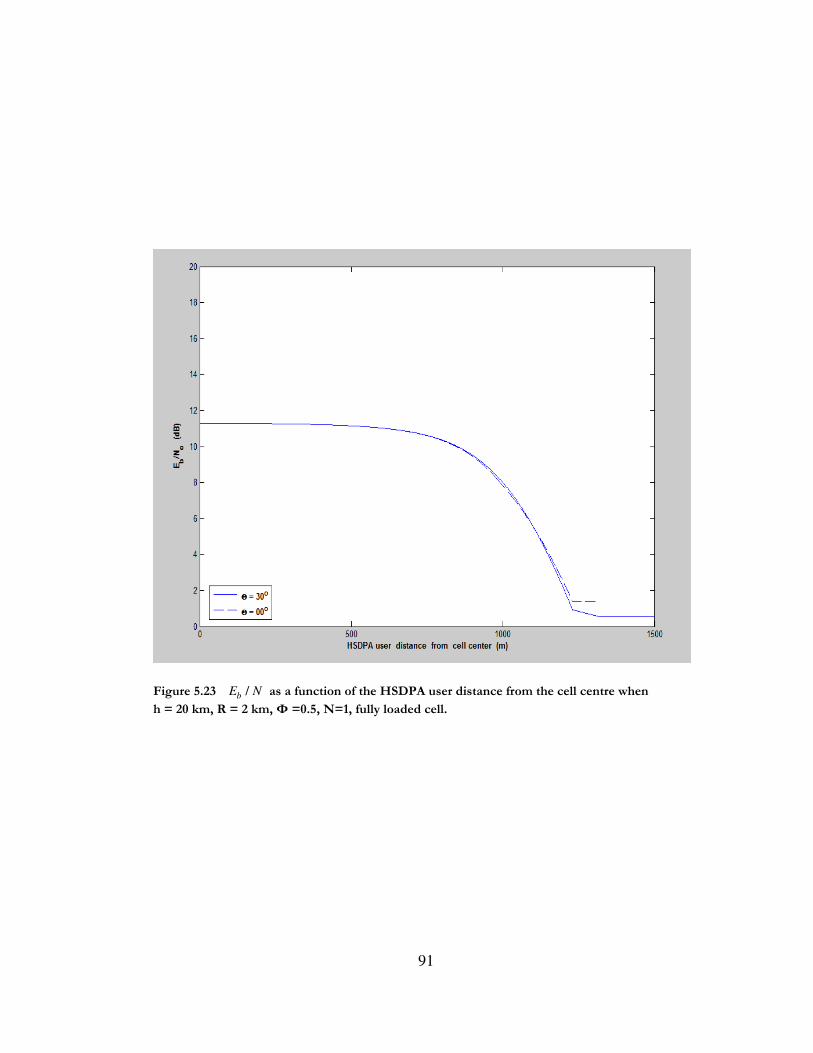
91
Figure 5.23 /bE N as a function of the HSDPA user distance from the cell centre when
h = 20 km, R = 2 km, Φ =0.5, N=1, fully loaded cell.

92
Figure 5.24 /bE N as a function of the HSDPA user distance from the cell centre when
h = 20 km, R = 2 km, Φ =0.5, N=2, fully loaded cell.

93
Figure 5.25 /bE N as a function of the HSDPA user distance from the cell centre when
h = 20 km, R = 2 km, Φ =0.5, N=1, Medium loaded cell.

94
Figure 5.26 /bE N as a function of the HSDPA user distance from the cell centre when
h = 20 km, R = 2 km, Φ =0.5, N=2, Medium loaded cell.

95
Figure 5.27 /bE N as a function of the HSDPA user distance from the cell centre when
h = 20 km, R = 2 km, Φ =0.1, N=2, Medium loaded cell.

96
6. Advantages and Future Challenges
6.1 Advantages of Integrating GOMEX-HAPs with Terrestrial UMTS
Integrating the features of terrestrial and satellite communication systems with HAPs-
based systems offer a number of benefits:
The high altitude of the network provides a wider service coverage, approximately an
area of diameter of 200-300km per HAP, and also suffers less atmospheric influence
(attenuation and turbulence) since they are situated well above cloud altitude.
The high elevation angle means fewer problems with terrestrial obstruction and
therefore reduced shadowing.
The mainly solar powered HAPs provide environmental advantages to UMTS service
provides because they would be able to scale down their terrestrial infrastructure.
GOMEX-HAPs would help UMTS service providers to expand and grow rapidly
because HAPs can be deployed rapidly, within a few hours, and would be most
advantageous in emergency or disaster situations, and in services that require rapid
operational availability.
GOMEX-HAPs also more easily serviced and upgraded, unlike a satellite, HAPS can
be brought down for payload repair, upgrading or configuration, or vehicle
modification.
It is more cost effective, since it does not require space qualification such as the
instruments onboard a satellite. The procurement and launch costs are also considerably

97
lower. Also, for UMTS service providers, replacing the ground stations in remote
regions with HAP can mean significant cost saving.
The intermediate position of a HAP between ground and satellite allows the link to be
closed more easily, resulting in negligible signal delay and loss due to atmospheric
influence, and therefore less propagation delay, by a factor of 1800 compared to a
downlink from a GEO satellite and by a factor of 20 compared to a downlink from a
LEO satellite. The high altitude, above cloud level, of HAPs/UAVs optimizes the
application of HAP-to-satellite communication to optical free-space communication
resulting in a very high communication capacity.
6.2 Future Challenges
In spite of the advantages which have been outlined in the previous section, there are
remaining challenges yet to be addressed in the application of HAPs to the wide variety
of services they can theoretically support. Several are discussed below.
A challenge to the viability of communication services via HAPs is the adverse effect of
wind and other weather turbulences which can compromise the stability of antenna
pointing on the HAP. To resolve this, array antenna must be electronically steered and
sub-platforms mechanically stabilized.
The frequencies within which HAPs operates, that is, in the 47/48 GHz and 28 GHz
(ITU Region 3) bands have not been fully characterized for propagation, and are also
more affected by rain attenuation. More analysis of rain attenuation and scattering needs
to be conducted to determine how to improve performance in spite of these factors, as
well as the most suitable diversity technique (space, time, frequency, etc) for each traffic
type.

98
A challenge to broadband telecommunication services is the need for optimal utilization
of network capacity so that the quality of service (QoS) and bit error rate (BER)
requirements under different link conditions can be supported, and the solution is to
use suitable coding and modulation techniques. Another challenge is achieving optimal
system capacity for the broadband wireless access (BWA) from HAPS, the quality of
which is dependent on antenna technology. For instance, if sidelobe performance is
inadequate then multiple spot beams will definitely be required which can affect inter-
cell interference, and thereby affect system capacity.
A challenge to future multimedia services is the possibility of frequent handoffs due to
the use of multiple spot beams in HAPs for greater coverage area and capacity, some of
which may occur when there is wind or turbulence resulting in motion of platform and
antenna beam. Stringent constraints pertaining to the size of the cells and the Hap’s
physical stability need to be considered for the handoff process to minimize delay due
to the need for handoffs resulting from movement, which can particularly affect future
multimedia services. Another challenge is to adapt channel assignment and resource
allocation schemes, which have been tailored to multimedia traffic, to the HAP
scenario, taking into account system topology and the coding/modulation scheme in
use.
Since different spot beam layouts are subject to wide angular fluctuations and changes
in link length, there is a need to develop an all-new cellular-type service that can focus
on frequency planning and reuse patterns for both user and backhaul links in such a
scenario. In this new network, the architecture must consider allowing for the possibility
of inter-terminal switching directly on the HAP itself and the use of inter-HAP links to
attain connectivity.
Last but not least, power limitations pose a challenge as well. Power availability will
depend on the type of HAP payload, and will be a direct determinant of the achievable
downlink RF power and thus the overall capacity. One solution would be to use power-
99
efficient modulation and coding techniques, and careful spot beam and antenna array
design.
6.3 Conclusion
This thesis proposed that high altitude platforms (HAPs) can serve a dual purpose of
providing cellular communication services and also support services for navigation
satellite systems. A system was designed and the results from simulation demonstrated
that HAPs can be successfully implemented to provide such services in the case of
macrocells of large radii. Although standard constraints may circumscribe limits on the
number of sustainable physical channels, however this can be in part overcome by
obtaining more information on the user location, through notification by the user to the
network using commnuication channels which transmit navigation messages to mobiles.

100
Appendix A Basic characteristics of Terrestrial Wireless, Satellite and HAPs systems [11]
Issue Terrestrial Wireless Satellite High Altitude
Platform
Availability and Cost of Mobile Terminals
Huge cellular PCS market drives high volumes resulting in small, low-cost, low-power units
Specialized, more stringent requirements lead to expensive bulky terminals with short battery life
Terrestrial terminals applicable
Propagation delay Low Causes noticeable impairment in voice communications in GEO (and MEO to some extent)
Low
Health concerns with radio emissions from handsets
Low-power handsets minimize concerns
High-power handsets due to large path losses (possibly alleviated by careful antenna design)
Power levels like in terrestrial systems (except for large coverage area)
Communications technology risk
Mature technology and well-established industry
Considerably new technology for LEOs and MEOs; GEOs still lag behind cellular PCs in volume, cost and performance
Terrestrial wireless technology, supplemented with spot-beam antennas; if widely deployed, opportunities for specialized equipment (scanning beams to follow traffic)
Deployment timing Deployment can be staged, substantial initial build-out to provide sufficient coverage for commercial service
Service cannot start before the entire system is deployed
One platform and ground support typically enough for initial commercial service

101
Issue Terrestrial Wireless Satellite High Altitude Platform
System growth Cell-splitting to add capacity, requiring system reengineering; easy equipment upgrade/repair
System capacity increased only by adding satellites; hardware upgrade only with replacement of satellites
Capacity increase through spot-beam resizing, and additional platforms; equipment upgrades relatively easy
System complexity due to motion of components
Only user terminals are mobile
Motion of LEOs and MEOs is a major source of complexity, especially when intersatellite links are used
Motion low to moderate (stability characteristics to be proven)
Operational complexity and cost
Well-understood High for GEOs and especially LEOs due to continual launches to replace old or failed satellites
Some proposals require frequent landings of platforms (to refuel or to rest pilots)
Radio channel “quality”
Rayleigh fading limits distance and data rate, path loss up to 50 dB/decade; good signal quality through proper antenna placement
Free-space-like channel with Ricean fading; path loss roughly 20 dB/decade; GEO distance limits spectrum efficiency
Free-space-like channel at distances comparable to terrestrial
Indoor coverage Substantial coverage achieved
Generally not available (high-power signals in Iridium to trigger ringing only for incoming calls)
Substantial coverage possible
Breadth of geographical coverage
A few kilometers per base station
Large regions in GEO (up to 34% of the earth surface); global for LEO and MEO
Hundreds of kilometers per platform (up to 200km)
Cell diameter 0.1 – 1 km 50km in the case of LEOs. More than 400km for GEOs
1 – 10 km
Shadowing from terrain
Causes gaps in coverage; requires additional equipment
Problem only at low elevation angles
Similar to satellite

102
Issue Terrestrial Wireless Satellite High Altitude
Platform
Communications and power infrastructure; real estate
Numerous base stations to be sited, powered, and linked by cables or microwaves
Single gateway collects traffic from a large area
Comparable to satellite
Aesthetic issues and health concerns with towers and antennas
Many sites required for coverage and capacity; “smart” antennas might make them more visible; continued public debates expected
Earth stations located away from populated areas
Similar to satellite
Public safety concern about flying objects
Not an issue Occasional concern about space junk falling to Earth
Large craft floating or flying overhead can cause significant objections
Cost Varies More than $200 million for a GEO system. A few billions for a LEO system (e.g. $5 billion for Iridium, $9 billion for Teledesic)
Unspecified (probably more than $50 million), but less than the cost required to deploy a terrestrial network with many base stations

103
References
[1] J. Thornton and D. Grace. Optimizing an array of antennas for cellular
coverage from a High Altitude Platform. IEEE Trans. Wireless Commun., 2(3):484–492, May 2003.
[2] C. Spillard, et al. Mobile link propagation aspects, channel model and
impairment mitigation techniques. CAPANINA Deliverable D14, Doc. No. CAP-D14-WP22-UOY-PUB-01, www.capanina.org. 2003.
[3] G. Djuknic, J. Freidenfelds, and Y. Okunev. Establishing wireless
communications services via high-altitude aeronautical platforms: a concept whose time has come? IEEE Communications Magazine, pages 128–135, September 1997.
[4] D. Grace, N. E. Daly, T. C. Tozer, and A. G. Burr. LMDS from high altitude
aeronautical platforms. In Proc. of IEEE GLOBECOM’99, December 1999. [5] L. C. Godara. Application of antenna arrays to mobile communications, Part
II: beamforming and direction-of-arrival considerations. Proc. of IEEE, 85, n. 8:1193–1245, August 1997.
[6] I. Jami, R F Ormondroyd, and E Artarit. Improved handset tracking using
Kalman filter algorithm aided by angle-spread information from a smart antenna array. In Proc. of IEEE 58th Vehicular Technology Conference, VTC Fall 2003, pages 752–756, 6th-9th October 2003.
[7] P.N. Pathirana, A.V. Savkin, and S. Jha. Location estimation and trajectory
prediction for cellular networks with mobile base stations. IEEE Trans. on Vehicular Technology, 53(6):1903–1913, November 2004.
[8] Z.R. Zaidi and B.L. Mark. Real-time mobility tracking algorithms for cellular
networks based on Kalman filtering. IEEE Trans. on Mobile Computing, 4(2):195–208, March-April 2005.
[9] R. Kueher, T. Todd, F. Shad, and V. Kezys. Forward-link capacity in smart
antenna base stations with dynamic slot allocation. IEEE Trans. on Veh. Technol., 50(4):1024–1038, 2001.
[10] V. Lau. Optimal downlink space-time scheduling design with convex utility
functions – multiple antenna systems with orthogonal spatial multiplexing. IEEE Trans. on Veh. Technol., 54(4):1322– 1333, July 2005.

104
[11] S. Karapantazis, and F.-N. Pavlidou, “Broadband communications via HAPS –
A survey” [12] M. V´azquez-Castro, F. P´erez-Font´an, and B. Arbesser-Rastburg, Wireless
Communication and Mobile Computing, Channel modeling for satellite and HAPS system design, 2002; 2:285–300 (DOI: 10.1002/wcm.58)
[13] Anggoro K. Widiawan and Rahim Tafazolli, High Altitude Platform Station
(HAPS): A Review of New Infrastructure Development for Future Wireless Communications. Wireless Personal Communications (2007) 42:387–404 DOI 10.1007/s11277-006-9184-9
[14] Alejandro Arago´ n-Zavala, Jose´ Luis Cuevas-Ruı´z, Jose´ Antonio Delgado-
Penı´n. High-Altitude Platforms for Wireless Communications. ISBN 978-0-470-51061-2 (HB)
[15] Chris Daskalakis and Patrick Martone. Alternative Surveillance Technology for
the Gulf of Mexico, DOT Voke Center, Cambridge, U4. [16] Steven D. Thompson and Katherine A. Sinclair. Automatic Dependent
Surveillance–Broadcast (ADS-B) in the Gulf of Mexico. [17] US Environmental Protection Agency (EPA). “General Facts about the Gulf of
Mexico”. [18] The Gulf of Mexico Working Group, US Environmental Protection Agency
(EPA). “General Facts about the Gulf of Mexico”. [19] FAA, the Gulf of Mexico Working Group Presentation, Houston Texas March
19 2002. [20] Anggoro K. Widiawan, A Promising Infrastructure for Delivery of 3G and
Beyond 3G Services, Centre for Communication Systems Research UNIS presentation. March 24 2009.
[21] Bazil Taha-Ahmed, Miguel Calvo-Ramón b, UMTS-HSDPA in High Altitude
Platforms (HAPs) communications with finite. Computer Communications 32 (2009) 828–833.
[22] Digital Video Broadcasting (DVB); Framing structure, channel coding and
modulation for digital Terrestrial television (DVB-T), European Broadcasting Union, ETS 300 744, p. 40.

105
[23] M. Dessouky, H. Sharshar, andY. Albagory, Geometrical Analysis of High Altitude Platforms Cellular Footprint. Progress In Electromagnetics Research, PIER 67, 263–274, 2007.

106
Vita
Amad Y. El-Disi
Date of Birth Nov 16, 1962 Place of Birth Taluzah, Palestine Degrees B.S. Electrical Engineering March, 1990 May 2010