A Theory of Rational Junk-Food Consumption - ORCOS : … · A Theory of Random-Lifetime-Rational...
21
A Theory of Random-Lifetime-Rational Junk-Food Consumption Amnon Levy Department of Economics The City College of the City University of New York & School of Economics and Information Systems University of Wollongong NSW 2522, Australia E-mail: [email protected] and Gustav Feichtinger Department of Operation Research University Technology Vienna Abstract Random-lifetime-rational (RLR) junk-food consumption balances the marginal satisfaction with the marginal deterioration of health. An RLR person discounts the instantaneous marginal satisfaction from junk-food consumption by its implications for his survival probability. His change rate of health evaluation is increased (decreased) by junk-food consumption when health is better (worse) than a critical level. The moderating direct effects of age and relative price on junk-food consumption may be amplified, or dimmed, by the change in his health. The stationary health of a person ignoring his age declines with his time-preference rate and rises with the marginal effect of junk food on his relative health-improvement rate. JEL classification: I12
Transcript of A Theory of Rational Junk-Food Consumption - ORCOS : … · A Theory of Random-Lifetime-Rational...

A Theory of Random-Lifetime-Rational Junk-Food Consumption
Amnon Levy
Department of Economics The City College of the City University of New York
& School of Economics and Information Systems
University of Wollongong NSW 2522, Australia
E-mail: [email protected]
and
Gustav Feichtinger
Department of Operation Research University Technology Vienna
Abstract
Random-lifetime-rational (RLR) junk-food consumption balances the marginal
satisfaction with the marginal deterioration of health. An RLR person discounts the
instantaneous marginal satisfaction from junk-food consumption by its implications
for his survival probability. His change rate of health evaluation is increased
(decreased) by junk-food consumption when health is better (worse) than a critical
level. The moderating direct effects of age and relative price on junk-food
consumption may be amplified, or dimmed, by the change in his health. The
stationary health of a person ignoring his age declines with his time-preference rate
and rises with the marginal effect of junk food on his relative health-improvement
rate.
JEL classification: I12

Keywords: junk food, health food, relative price, relative taste, risk, natural recovery, full-capacity income, expected lifetime utility, rational consumption, health, health value 1. Introduction
Food can be classified as junk or healthy in accordance with the concentration of
ingredients such as sugar, fat and salt. Due to a high concentration of these
ingredients, junk food is often tastier than its low in calories, fat and salt substitute.
Due to cheaper ingredients and/or preparation process, junk food is often less
expensive than health food. These possible short-term taste and cost advantages of
junk food might be offset by the long-term adverse effects of junk-food consumption
on health and life expectancy. This paper presents a theory of RLR consumption of
junk food whereby people are aware of the possible short-term advantages and the
long-term disadvantages associated with junk-food consumption. In addition to the
taste and price differentials, they take into account the risk differential in deciding
upon the composition of junk-food and health-food products in their diet.
Taste, price and risk differences are not exclusive to junk-food products and
their healthier substitutes. They may also provide an explanation to decisions on the
consumption of commodities such as coffee, tea, beer and self-rolled cigarettes. The
comparison of the taste, price and health impeding effects of coffee, tea, beer and self-
rolled cigarettes to those of their healthier substitutes (decaffeinated coffee, herbal tea,
light beer and filtered cigarettes, respectively) within a lifetime utility maximization
framework with uncertain life expectancy constitutes a complementary approach to
the rational addiction model proposed by Gary Becker and Kevin Murphy (1988) and
applied by Frank Chaloupka (1991), Gary Becker, Michael Grossman and Kevin
Murphy (1994), Nilss Olekalns and Peter Bardsley (1996), Michael Grossman, Frank
2

Chaloupka and Ismail Sirtalan (1998) and many others to the consumption of
cigarettes, alcohol and coffee.
RLR food consumers are defined as maximizers of their expected lifetime
utility from consumption of junk food and health food subject to the evolution of their
health and the effect of age and health on their random life expectancy. Their path of
junk-food consumption balances the marginal satisfaction with the marginal
deterioration of health. RLR consumers of junk food discount the instantaneous
marginal satisfaction from junk-food consumption by its implications for their
survival probability. Junk-food consumption increases (reduces) the change rate of
their evaluation of health when their health is better (worse) than a critical level. The
moderating direct effects of age and relative price on RLR junk-food consumption
may be amplified, or dimmed, by the change in health. The stationary health of junk-
food consumers ignoring their age, but otherwise rational, declines with their time-
preference rate and rises with the marginal effect of junk food on their relative health-
improvement rate. However, off steady state their joint trajectory of junk-food
consumption and health neither converges to, nor orbits, steady state.
The conceptual framework leading to the aforementioned results is structured
as follows. The building blocks of the analysis generating an RLR choice of a diet of
junk food and health food are presented in section 2. Similar to Levy (2000, 2002a
and 2002b), life expectancy is taken to be random and the probability of dying is
related to health and age. The expected lifetime-utility maximization problem is
presented in section 3 and the properties of the RLR diet of junk-food and value of
health are discussed in section 4. The long-run (stationary) consumption of junk food
and health are presented in section 5 for the case where people ignore their age. A
brief summary of the conclusions is given in section 6.
3

2. Building Blocks
The analysis of the RLR junk-food consumption employs the following notations:
t = a continuous time index, t T∈( , )0 where T is a positive scalar indicating the
upper bound on human longevity;
c tj ( ) = the individual’s consumption of junk food at instance ; t
c th ( ) = the individual’s consumption of health food at instance ; t
x t( ) = the individual’s age-adjusted health condition at instance t , a unit interval
index with 1)(0 ≤≤ tx x = 0 representing a terminally ill person and x = 1 a perfectly
healthy person;
p t( ) = the junk food-health food price ratio;
α = the junk food-health food taste ratio;
y t( ) = the individual’s income at instance ; t
y = a positive scalar indicating the full capacity income;
φ( )t = the probability density of dying at instance ; t
))(),(( tctcu hj = the individual’s satisfaction from food at instance t; and
ρ( )t = the individual’s rate of time preference at instance . t
The subscripts j and h can be interpreted as (the only) two types of meals: the
j-th meal consists of junk food and the h-th one of health food. In which case,
and indicate the numbers of these meals consumed at t.
)(tc j
)(tch
The individual’s health condition, x , is adjusted to the adverse effects of
normal aging. That is, x indicates the individual’s health relative to his age. This
definition of x is used for distinguishing between the effect of age (i.e., youth vis-à-
4

vis old age) and the effect of health on the individual’s probability of survival. (See
assumption 7.) This definition also explains why age (and thereby aging) is not
included in the motion equation of the individual’s health. (See assumption 6.)
The building blocks of the RLR junk-food consumption model are
summarized by the following assumptions.
Assumption 1 (instantaneous satisfaction): The individual’s instantaneous satisfaction
from eating is represented by a utility function having the following
properties. Food is essential --
u c t c tj h( ( ), ( ))
u( , )0 0 0= . However, neither junk food nor health food
is essential -- . The marginal satisfaction with respect to each
type of food is positive and diminishing -- u u ,
u c u ch( , ) ( , )0 0> < j 0
j h, > 0 u ujj hh, < 0 -- and health food
and junk food are substitutes -- 0<jhu .1
Consistent with this assumption the following explicit utility function is
considered
βα )]()([ tctcu hjt += (1)
1 It is possible that junk food and/or health food are addictive for some people. John Cawley’s (1999) empirical findings on the consumption of calories lend support to the hypothesis that some types of junk food are addictive. However, addiction and, in particular, the controversial concept of rational addiction are not the scope of the present analysis. Consistently with Karen Dynan’s (2000) empirical findings with panel household data, the present analysis assumes that food consumption is neither addictive nor a formed habit. That is, the stocks of junk-food consumption and health-food consumption are not considered as moderating the individual’s level of satisfaction from the flows of these commodities and hence are not introduced into the individual’s utility function. Instead, the analysis focuses on the roles of price, taste and risk differences in explaining the individual’s choice of junk-food and health-food consumption flows.
5
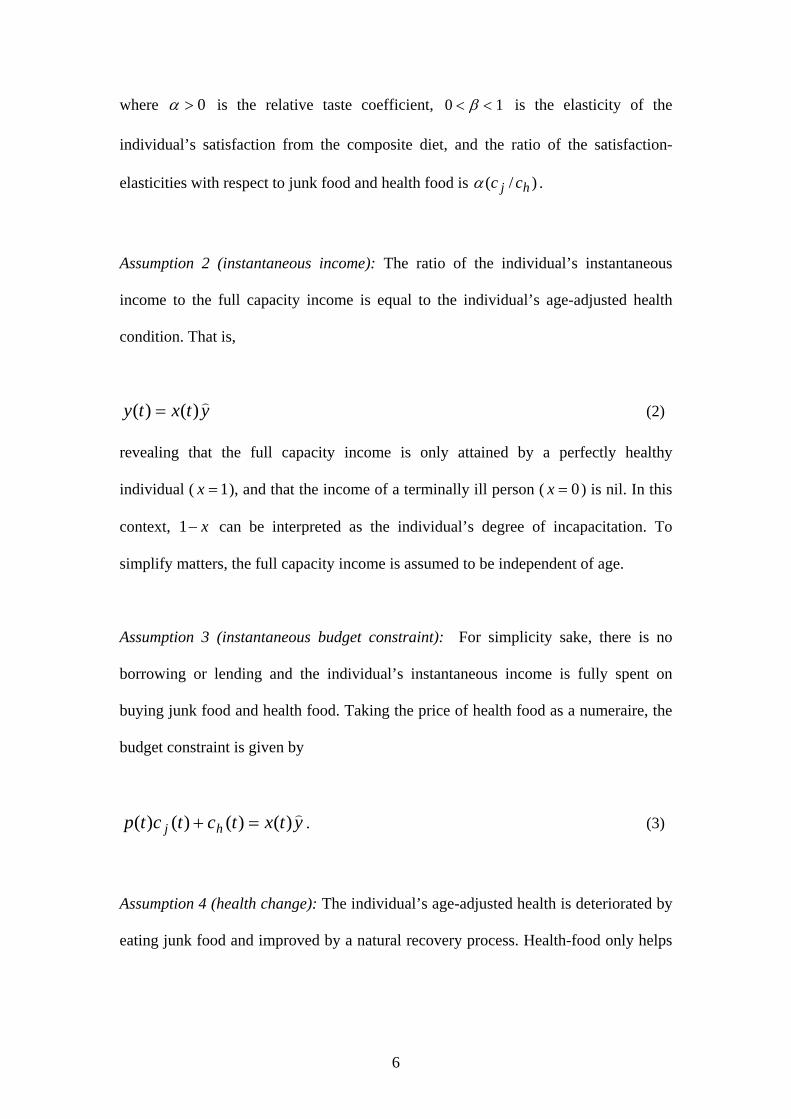
where 0>α is the relative taste coefficient, 0 1< <β is the elasticity of the
individual’s satisfaction from the composite diet, and the ratio of the satisfaction-
elasticities with respect to junk food and health food is )/( hj ccα .
Assumption 2 (instantaneous income): The ratio of the individual’s instantaneous
income to the full capacity income is equal to the individual’s age-adjusted health
condition. That is,
ytxty ))()( = (2)
revealing that the full capacity income is only attained by a perfectly healthy
individual ( ), and that the income of a terminally ill person (1=x 0=x ) is nil. In this
context, can be interpreted as the individual’s degree of incapacitation. To
simplify matters, the full capacity income is assumed to be independent of age.
x−1
Assumption 3 (instantaneous budget constraint): For simplicity sake, there is no
borrowing or lending and the individual’s instantaneous income is fully spent on
buying junk food and health food. Taking the price of health food as a numeraire, the
budget constraint is given by
ytxtctctp hj))()()()( =+ . (3)
Assumption 4 (health change): The individual’s age-adjusted health is deteriorated by
eating junk food and improved by a natural recovery process. Health-food only helps
6

maintaining the individual’s health relative to his age at the same level.2
Correspondingly, the instantaneous change in the individual’s age-adjusted health is
given by a logistic function displaying a diminishing relative health-improvement rate
in junk-food consumption, a diminishing health-improvement rate ( r ) in the level of
health, and a unit upper bound and a zero lower bound on the individual health. That
is, it is assumed that
)()](1)][(1[)( txtxtctx
r
j 444 3444 21& −−= δ (4)
where, δ is a positive scalar indicating the marginal adverse effect of junk-food
consumption on the relative rate of improvement of the individual’s age-adjusted
health. Loosely interpreted, δ is the health sensitivity to junk food.
The underlying rationale of the abovementioned effect of junk food on health
is as follows. By rearranging Eq. (4), )](1/[)](/)([)(1 txtxtxtc j −=− &δ . That is,
jcδ−1 is the individual’s health-improvement rate relative to his degree of
incapacitation ( ). This relative health-improvement rate is hindered by junk-food
consumption and is negative for sufficiently large values of
x−1
δ and . The case of a
negative relative health-improvement rate (
jc
01 <− jcδ ) does not violate the
assumption that x lies within the (positive) unit interval as long as the initial value of
x is smaller than 1. Furthermore, when x is close to zero and the consumption of junk
food is sufficiently low (i.e., δ/1<jc ), jcδ−1 can be interpreted as the recovery
rate from a near death situation.
2 Health-food fans may argue that, ceteris paribus, health food not only helps maintain personal health but also improves personal health. The incorporation of the latter assertion complicates the analysis and renders the model unsolvable.
7

Assumption 5 (survival probability): Let T be the limit to human longevity, the
cumulative distribution function associated with the probability density of dying
F t( )
φ( )t
where . Then Tt ≤≤0 )(1)( tFt −=Φ indicates the probability of living beyond . It
is assumed that
t
)),(()( tTtxt −Φ=Φ with 0>Φ −tT (the youth effect), (the
age-adjusted health effect) and
0>Φ x
)0),((0)t,0( txT − = = ΦΦ . That is, the probability of
living beyond t declines with the individual’s age and rises with the individual’s age-
adjusted health. It converges to zero as the individual’s age approaches T and when
his health is completely deteriorated ( x = 0 ).
Assumption 6 (time-consistent preferences): The individual’s rate of time preference
is positive and time invariant. That is, ρ ρ( )t = for every t T∈( , )0 .
3. RLR Choice
It is postulated that RLR individuals chose their junk and health food diet path so as to
maximize their expected lifetime satisfaction from food subject to their health motion
equation. Since the duration of life is random, expected-lifetime-satisfaction-
maximizing food consumers multiply their accumulated satisfaction from food
between the starting point of their planning horizon, , to their possible time of death
(i.e., multiply ) by the probability density of dying at time
(i.e.,
0
t ∫ −t
due0
ττρτ t
φ( )t ). The products of φ( )t and associated with any possible life
expectancy
∫ −t
due0
ττρτ
0 ≤ ≤t T are considered by such consumers. The sum of all these
8

products is these consumers’ expected lifetime-satisfaction from food. It is given by
the following double-integral expression
dtduetVT t
∫ ∫ −=0 0
)( τφ τρτ . (5)
Integrating by parts, this expected lifetime-satisfaction is equivalently rendered by a
mathematically more manageable single-integral expression:
dtuetTtxVT
tt∫ −−Φ=
0)),(( ρ . (6)
That is, the expected lifetime utility is the sum of the discounted instantaneous utility
from food consumption accruing during the maximum lifespan and weighted by the
probability of prevailing. (A detailed mathematical explanation is given in Appendix
A.)
The analysis of the RLR diet trajectory is further simplified by expressing c
as a function of c . Recalling the instantaneous budget constraint,
h
j
)()()()( tctpytxtc jh −= ) . (7)
The substitution of Eq. (7) into Eq. (1) renders the instantaneous satisfaction function
as
[ βα ytxtctpu jt ]))()()]([ +−= . (8)
Note that as long as the difference between the relative taste and the relative price of
junk food is positive (i.e., α − >p t( ) 0 ) the marginal instantaneous satisfaction from
junk food, in this concentrated form, is positive and diminishing. In turn, V is
concave in the control variable . Of course, an RLR person follows a strictly
health-food diet when
c j
0)( <− tpα .
9

By substituting Eq. (8) into Eq. (7) for the RLR junk-food consumption
path can now be found by
tu
[ dtytxtctpetTtxT
jt
c j∫ +−−Φ −
0}{)()()]([))),((max βρ α )]
subject to the health motion equation 4.
4. RLR Junk-Food Consumption and Shadow Value of Health
The present-value Hamiltonian corresponding to the aforementioned constrained
maximization problem is
4444 34444 21444 3444 21
)
&x
j
Z
jt txtxtctytxtcpetTtxtH )()](1)][(1[)(])()()[()),(()( −−++−−Φ= − δλα βρ (9)
where the co-state variable λ( )t indicates the RLR shadow present value of the
individual’s age-adjusted health at . Since t 0 1< <β , H is concave in the state
variable ( x ). If α − >p t( ) 0 , H is also concave in the control variable ( ). It is
assumed, henceforth, that the relative taste-price differential (
c j
)p−α is positive; in
which case, there exists an interior solution and, in addition to the state equation (Eq.
(4)), the following conditions are necessary and sufficient for maximum expected
lifetime satisfaction from junk-food consumption3:
{ )1)(21(][ 1j
t
uux cxeyZZ
xH
x
δλβ∂∂λ ρββ −−−Φ−Φ−=−= −−
43421)& (10.1)
and
0)1()]([1 =−−−Φ= −− xxtpZecH
ju
t
jλδαβ
∂∂ βρ
44 344 21. (10.2)
3 The time-index t is omitted for tractability.
10

The optimality condition, Eq. (10.2), indicates that along the RLR junk-food
consumption path there should be a balance between the marginal satisfaction from
junk-food consumption, discounted by both the individual’s time preference and
prospects of survival, and the value of the marginal damage to the individual health
caused by consuming junk-food.
The adjoint equation, Eq. (10.1), implies, in conjunction with the optimality
condition, that along the RLR junk-food consumption path the rate of change of the
shadow value of health is given by
)1)(21()1(ˆ
)/(1[)/()()(
jj cxxp
yxctt δδ
αβηβη
λλ
−−−−⎥⎦
⎤⎢⎣
⎡−
++−=&
(11)
where η denotes the survival elasticity (Φ
Φx
x ) which, for simplicity, is henceforth
assumed to be constant. As 0)/( >
<=
∂∂
jcλλ& for )/2/()/1( βηβη ++=
>
<x , the value of
health for an RLR person is increased (reduced) by junk-food consumption when his
health is better (worse) than a critical level, which rises with the ratio of the elasticity
of survival to the elasticity of satisfaction from eating ( βη / ).
The change in the RLR junk-food consumption over time is given by the
following no-arbitrage rule4:
4 Eq. (12) is obtained by differentiating Eq. (10.2) with respect to time, substituting the right-hand sides of Eq. (10.1) and Eq. (10.2) for and λ& λ , multiplying both sides of the resultant equation by and collecting terms. ))(1(/ 2 pZe t −−Φ − αβββδ
11
ΦΦ
⎥⎦
⎤⎢⎣
⎡−
+⎥⎦
⎤⎢⎣
⎡−−
−
⎥⎥⎥⎥
⎦
⎤
⎢⎢⎢⎢
⎣
⎡
−−−−−−−+
+
−−
+−+−−−−=
&&&
44444444 844444444 76
4444444444 84444444444 76
&
)1())(1())(1(ˆ)1()]()1/()21(/[
))(1(]ˆ)[1()(])1)(21[( 2
βαβαββαη
αβββηδαβρ
Zpp
Zxp
yZpxxxx
pyZxZxpZcx
c
B
A
jj
(12)
This equation and Eq. (4) portray the joint evolution of an RLR person’s junk-food
consumption and health. They lead to the following conclusions.
Recalling our assumptions, 0))(1( >−− pαβ . Hence, the direction of the
effect of an improvement in the RLR person’s health on junk food consumption
depends on the sign of B, which is positive, equal to zero, or negative when the
survival elasticity is greater than, equal to, or smaller than a critical size. That is,
0))(1(
>
<=
−−=
pB
xdcd j
αβ&
& as
xx
Zpyx
−−
−−−
=>
< 121
)(ˆ)1(
αβη .
The direct effects of changes in the prospects of survival and the relative price
of junk food on the RLR junk-food consumption are given by differentiating Eq. (12)
with respect to and , respectively. Recalling Eq. (4), these direct effects on
junk food consumption affect the individual’s age-adjusted health at a rate of
ΦΦ /& p&
δ− ,
which, by virtue of Eq. (12), also affects junk food consumption. The full effects of
changes in the prospects of survival and the relative price of junk food on the RLR
junk-food consumption are equal to the sum of these direct and indirect effects.
As can be seen from Eq. (12) and assumptions 1 and 3, the adverse effect of
age on survival ( ) has a direct moderating effect (0<Φ& Φ− )1/( βZ ) on the RLR
junk-food consumption over time. However, this decline in consumption of junk food
improves the individual’s age-adjusted health by Φ− )1/( βδZ and hence indirectly
12

changes the RLR junk-food consumption by . Recalling that )()1/( 2 pZB −Φ− αβδ
))(1( pB
xdcd j
−−=
αβ&
&, the indirect effect of aging on the RLR junk-food consumption
is positive (negative) if η is greater (smaller) than xx
Zpyx
−−
−−−
121
)(ˆ)1(
αβ and hence
dimming (amplifying) the direct moderating effect of age on RLR junk-food
consumption.
As can be expected, a rise in the relative price of junk food over time has a
moderating direct effect ( ))(1/( pZ −−− αβ ) on the RLR junk-food consumption.
This decline in junk-food consumption leads to an improvement in the individual’s
age-adjusted health by ))(1/( pZ −− αβδ and hence indirectly changes the RLR junk-
food consumption by . Recalling that 2)])(1/[( pZB −− αβδ))(1( p
Bxd
cd j
−−=
αβ&
&,
this indirect effect of a rise in the relative price of junk food on junk-food
consumption is positive (negative) if η is greater (smaller) than xx
Zpyx
−−
−−−
121
)(ˆ)1(
αβ
and hence dimming (amplifying) the direct moderating effect of a relative price rise
on the RLR junk-food consumption.
5. Stationary RLR Junk-Food Consumption and Health Index
The notion of steady state (SS) is used in this section to indicate possible long-run
levels. Of course, the derivation of stationary junk-food consumption and stationary
health index is inconsistent with the assumption that 0>Φ −tT . This assumption is
now relaxed. That is, the following analysis is conducted under the assumption that
some people ignore aging ( 0=Φ −tT ) and believe that their survival in the future
depends only on their health. In other words, these people believe that there is no
13
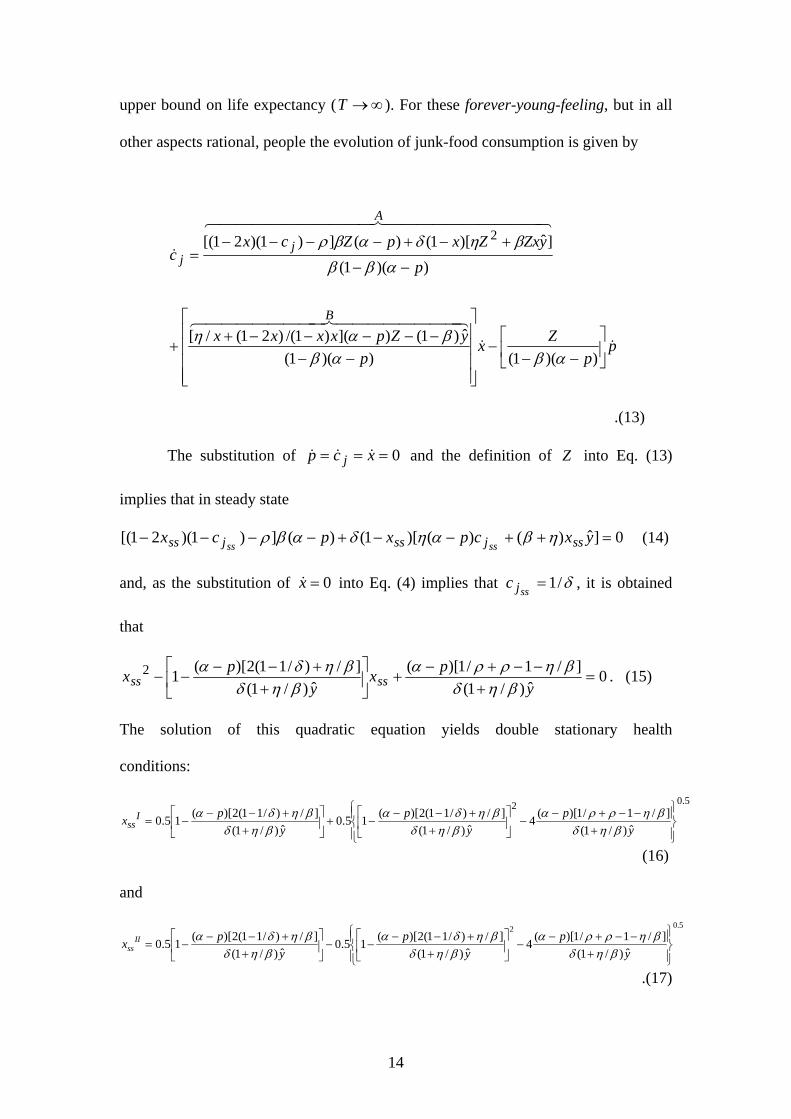
upper bound on life expectancy ( ∞→T ). For these forever-young-feeling, but in all
other aspects rational, people the evolution of junk-food consumption is given by
pp
Zxp
yZpxxxx
pyZxZxpZcx
c
B
A
jj
&&
44444444 844444444 76
4444444444 84444444444 76
&
⎥⎦
⎤⎢⎣
⎡−−
−
⎥⎥⎥⎥
⎦
⎤
⎢⎢⎢⎢
⎣
⎡
−−−−−−−+
+
−−
+−+−−−−=
))(1())(1(ˆ)1()]()1/()21(/[
))(1(]ˆ)[1()(])1)(21[( 2
αβαββαη
αβββηδαβρ
.(13)
The substitution of 0=== xcp j &&& and the definition of Z into Eq. (13)
implies that in steady state
0]ˆ)()()[1()(])1)(21[( =++−−+−−−− yxcpxpcx ssjssjss ssssηβαηδαβρ (14)
and, as the substitution of into Eq. (4) implies that 0=x& δ/1=ssjc , it is obtained
that
0ˆ)/1(
]/1/1)[(ˆ)/1(
]/)/11(2)[(12 =+
−−+−+⎥
⎦
⎤⎢⎣
⎡+
+−−−−
ypx
ypx ssss βηδ
βηρραβηδ
βηδα . (15)
The solution of this quadratic equation yields double stationary health
conditions:
5.02
ˆ)/1(]/1/1)[(4
ˆ)/1(]/)/11(2)[(15.0
ˆ)/1(]/)/11(2)[(15.0
⎪⎭
⎪⎬⎫
⎪⎩
⎪⎨⎧
+−−+−
−⎥⎦
⎤⎢⎣
⎡+
+−−−+⎥
⎦
⎤⎢⎣
⎡+
+−−−=
yp
yp
ypx I
ss βηδβηρρα
βηδβηδα
βηδβηδα
(16)
and
5.02
ˆ)/1(]/1/1)[(4
ˆ)/1(]/)/11(2)[(15.0
ˆ)/1(]/)/11(2)[(15.0
⎪⎭
⎪⎬⎫
⎪⎩
⎪⎨⎧
+−−+−
−⎥⎦
⎤⎢⎣
⎡+
+−−−−⎥
⎦
⎤⎢⎣
⎡+
+−−−=
yp
yp
ypx II
ss βηδβηρρα
βηδβηδα
βηδβηδα
.(17)
14

Numerical simulations are used for assessing the effects of the model’s parameters on
these RLR stationary levels of health. The simulations reveal that for various choices
of parameter-values only is, as required by construction, within the unit interval
(0,1). Hence, the reported simulation results are generated by using Eq. (17). The
reported simulations refer to a forever-young feeling person for whom:
IIssx
junk-food is fifty percent tastier than health food, 5.1=α ;
junk-food is fifty percent cheaper than health food, 5.0=p ;
the elasticity of satisfaction from eating is 5.0=β ;
the survival elasticity is 1=η (i.e., )x=Φ ;
the marginal (adverse) effect of junk-food consumption on the relative rate of
improvement of the individual health is 0003.0=δ ;
the daily rate of time preference is 00026.0=ρ (which is equivalent to about
10 percent per annum); and
the daily full-capacity income is 100$ˆ =y .
For this forever-young-feeling person, the stationary health index is 0.578: namely,
57.8 percent of a perfectly healthy individual in his cohort.
The numerical simulations reveal that this stationary health index is not
sensitive to changes in the relative taste of junk food, in the relative price of junk
food, in the elasticity of satisfaction from eating, in the elasticity of living beyond t,
and in the full-capacity income.
In contrast, and as can be expected, the numerical simulations indicate that the
stationary health index is considerably lowered by the rate of time preference. For
instance, a one-percent rise in ρ from the aforementioned benchmark level, all other
things remain the same, reduces by 0.998 percent. ssx
15

It is also found the stationary health index rises considerably with the marginal
effect of junk-food consumption on the relative rate of improvement of the individual
health. The rise of the stationary health index is due to the moderating effect of an
increase in δ on the stationary consumption of junk food ( δ/1=ssjc ). For instance,
a one-percent rise in δ from the aforementioned benchmark level, all other things
remain the same, increases by 1.006 percent. ssx
However, the trajectories of health index and junk-food consumption of the
“forever-young feeling” (otherwise rational) people neither converge to, nor orbit, the
stationary combination. (See Appendix B.)
6. Conclusion
We analyzed RLR junk-food consumption by incorporating the taste, price and risk
differences between junk food and its healthier substitute into an expected-lifetime-
utility-maximizing framework. Our analysis proposed that the RLR combination of
junk food and health food maintains a balance between the marginal satisfaction from
junk-food consumption and the value of the marginal damage to the individual health
caused by consuming junk-food, where the marginal satisfaction from junk-food
consumption is discounted by both the individual’s time preference and prospects of
survival.
We argued that junk-food consumption increases (reduces) the rate of change
of RLR people’s evaluation of their health when their health is better (worse) than a
critical level, which rises with the ratio of the elasticity of survival to the elasticity of
satisfaction from eating.
We also argued that the adverse effect of age on survival and a rise in the
relative price of junk food have direct moderating effects on the RLR junk-food
16

consumption over time. However, the decline in consumption of junk food improves
the individual’s age-adjusted health and hence indirectly changes the RLR junk-food
consumption. The indirect effect of aging on junk-food consumption can be positive,
or negative, and hence dimming, or amplifying, the direct moderating effects of age
and relative price on junk-food consumption if the elasticity of survival is larger, or
smaller, than a critical value.
We derived the steady-state health index for the case where people ignore their
age or believe that there is no upper bound on life expectancy. The numerical
simulations revealed that the steady-state health index declines considerably with the
individual’s rate of time preference and rises considerably with the marginal effect of
junk-food consumption on the relative rate of improvement of the individual’s health.
The trajectories of the health index and junk-food consumption neither converge to,
nor orbit, the computed steady state.
Finally, we note that it is possible that, for any given combination of food
consumption, a healthier person is happier, and that a healthier and happier person
may have a higher propensity to save and invest. The model can be extended to
incorporate this possible effect of health state on people’s instantaneous utility and
capital formation. The capital formation equation may further reflect a tradeoff
between the positive effect of the consumption of healthy food on people’s propensity
to invest and the adverse effect of the higher cost of healthy food on instantaneous
saving and, in turn, on investment. Correspondingly, the earning equation of the
extended model should take into account the effect of capital stock.
17

Appendix A: An explanation of the transition from Eq. (6) to Eq. (7)
F t( ) is the cumulative density function associated with the probability density of
dying at (i.e., the probability of living up to ). Hence, t t
φ( ) ' ( )t F t= (A1)
and Eq. (6) can be rendered as
∫∫∫ =⎪⎭
⎪⎬⎫
⎪⎩
⎪⎨⎧
= −TtT
vdUdtduetFJ000
)(' ττρτ (A2)
where,
ττρτ duev
t
∫ −=0
(A3)
and
U F= − −( (1 t))
v
. (A4)
The integration by parts rule suggests that
J vdU Uv UdTT
= = − ∫∫00
.
(A5)
Note, however, that
18

0))(1(00=
⎥⎥⎦
⎤
⎢⎢⎣
⎡−−= ∫ −
TtduetFUv ττ
ρτ (A6)
because when evaluated at the lower limit
(A7) 0))0(1(0
0=
⎥⎥⎦
⎤
⎢⎢⎣
⎡−−= ∫ − ττ
ρτ dueFUv
and when evaluated at the upper limit
0))(1(0
=⎥⎥⎦
⎤
⎢⎢⎣
⎡−−= ∫ −
TdueTFUv ττ
ρτ (A8)
as
F T( ) = 1
v
. (A9)
Hence,
J UdT
= − ∫0
. (A10)
By virtue of equation (A3)
dv e d= −ρτ τ (A11)
and the substitution of equations (A4) and (A11) into (A10) implies
dttueJT
tt )(
0Ω= ∫ −ρ (A12)
where
)(1)( tFUt t −=−≡Ω (A.13)
and indicating the probability of living at least until . t
19

Appendix B: The nature of the steady-state
In order to find whether the individual’s health and consumption of junk food
convergence to the aforementioned stationary levels of 0.578 and 3333.333,
respectively, the system of equations (13) and (4) is linearized at the vicinity of this
stationary point. The eigenvalues of the state-transition matrix are given by
})()()()([4)]()([)]()({[5.0 22,1 ssMssNssNssMssNssMssNssM xcxcxcxc jjjj
−−+±+=λ
(B.1)
with and 761.2068)( =ssMjc 789,288,45)( =ssM x indicating the stationary values
of the derivatives the right-hand-side of Eq. (13) with respect to and jc x , and
and 0532298.7)( −−= EssNjc 0)( =ssN x (as it is proportional to )
the stationary values of the derivatives the right-hand-side of Eq. (4) with respect to
and
01 =− ssjcδ
jc x . As 1λ and 2λ are both positive (2067.156 and 1.604, respectively) the
individual’s health and junk-food consumption trajectories neither converge to, nor
orbit, the stationary combination.
20

References
Becker, Gary. S., and Murphy, Kevin. M., 1988. A Theory of Rational Addiction, Journal of Political Economy 96, 675-700. Becker, Gary S., Grossman, Michael and Murphy, Kevin M., 1994. “An Empirical Analysis of Cigarette Addiction”, American Economic Review 84(3), 396-418. Cawley, John C. “Rational Addiction, the Consumption of Calories, and Body Weight”, Ph.D. Dissertation, Department of Economics, University of Chicago, August 1999. Chaloupka, Frank, 1991. “Rational addictive Behavior and Cigarette Smoking” Journal of Political Economy, 99(4), 722-742. Dockner, E. J., and Feichtinger, G., 1993. Cyclical Consumption Patterns and Rational Addiction, American Economic Review 83, 256-263. Dynan, K. E., 2000. Habit Formation in Consumer Preferences: Evidence from Panel Data, American Economic Review 90, 391-406. Grossman, Michael, Chaloupka, Frank J. and Sirtalan, Ismail, 1998. “An Empirical Analysis of Alcohol Addiction: Results from the Monitoring the Future Panels”, Economic Inquiry 36(1), 39-48. Levy, Amnon., 2000, “Would a Rational Lucy Take-Off without Assessing the Probability of a Crash Landing?”, Eastern Economic Journal 26(4), 431-437. Levy, Amnon., 2002a, “Rational Eating: Can It Lead to Overweightness or Underweightness?”, Journal of Health Economics 21(5), 887-899. Levy, Amnon., 2002b, “A Lifetime Portfolio of Risky and Risk-Free Sexual Behaviour and the Prevalence of AIDS”, Journal of Health Economics 21(6), 993-1007. Olekalns, Nilss and Bardsley, Peter, 1996. “Rational Addiction to Caffeine: An Analysis of Coffee Consumption”, Journal of Political Economy, 104(5), 1100-1104.
21