Due Diligence and Leveraged Buyout of Overhill Firms (Deb Sahoo)
Leverage Buyout Activity: A Tale of Developed and Developing Economies ( Preliminary and not to be Quoted).
ABSTRACT
In this study we explain and compare the returns on Leveraged Buyouts (LBOs)
in developed countries with those of developing economies (including newly
industrialized economies). We utilize a unique data set covering LBOs from 1980 – April
2012. This covers both periods of recession and economic boom.
We analyze how various factors influence the returns of an LBO. Returns on
LBOs are on average higher for developed markets; however, returns of LBOs during
high economic growth periods are high for developing nations; whereas returns in
developing nations are lower when compared to the returns in developed nations in
periods of slow economic growth.
During periods of slow or moderate economic growth, the returns in developing
nations do not compensate for the high risk associated with them. We also look at the
influence of other factors such as if the target and the buyer are from the same country,
Debt/Capital ratio {low, medium and high}, size of the target firms, Number of buyers
involved in the LBO, Reputation of the buyer firm, Target firm’s Industry, Buyer
Industry, if the target and the buyer are from the same industry, Number of days to exit,
interest rates in the target country and the buyer country, currency fluctuation between
the target country and the buyer country, target country stock market return and Law
ii
enforcement and government effectiveness and ease of setting up a business (number of
procedures) in the target country.
We also look at the time to exit from the initial LBO to the exit through one of the
following methods: IPO, bankruptcy, MBO, strategic buyout or secondary LBO. We find
that LBO transactions in exit sooner when the GDP at the time of exit is higher, due to
favorable markets for IPO, easier to find buyers to exit through other methods, and other
favorable corporate law enforcements in the developed nations. LBOs in developing
markets take longer time to exit irrespective of whether the GDP is higher or not.

iii
1
Section 1: Introduction
A developed country has a highly developed economy and advanced
technological infrastructure relative to other less developed nations. Most commonly the
criteria for evaluating the degree of economic development are gross domestic product
(GDP), the per capita income, level of industrialization, amount of widespread
infrastructure and general standard of living. Most of the LBO or M&A activity takes
place in these countries with USA being the country highest in LBO activity. Some of the
countries that can be considered as developed are: US, Canada, UK, Netherlands, Japan,
Australia, Norway, Denmark, Germany etc.
Developing countries are also called less-developed countries (LDC), are nations
with a low living standard, undeveloped industrial base, and low Human Development
Index (HDI) relative to other countries. LBOs in developing countries may be attractive
mainly due to low rules to comply with and also due to the presence of growth
opportunities for their investments.
Newly Industrialized countries or countries with economies that are more
advanced than developing economies but not considered developed: Brazil, China, India,
Malaysia, Mexico, Philippines, SA, Sri Lanka, Thailand and Turkey. These countries are
of particular interest since they have tremendous growth opportunities which attract lot of
LBO or M&A activity.
Returns of the Leveraged Buyouts (LBOs) are, on average found to be higher for
targets that are from developed nations (and when the LBO operator is also from a
developed country). Previous research in this area shows that LBO transactions in
developing markets do not compensate for the risk inherent in the deals. Lopez-de-
2
Silanes, Phalippou and Gottschalg (2010), find that investments in developing countries
exhibit poorer performance when compared to developed countries.
This may be a result of costly learning, lower leverage, poorer legal environments
and limited exit routes. Leeds and Sunderland (2003), find that the returns in developing
markets do not compensate for the high risk involved in the transactions. This is mainly
due to low standards of corporate governance in terms of quality of information required
for investment decisions, weakness in legal systems to enforce legal contracts and
protecting all classes of investors; and the inability of domestic equity markets to offer
reasonable exit prospects through IPOs.
However, in this paper, we expect to find that the returns of the LBOs in
developing nations are higher during the periods when the growth of the economy is
above the benchmark level when compared to returns of LBOs in the developed nations.
Where as when the growth of the economy is moderate or slow, then the returns of LBOs
in the developing nations do not compensate for the risk inherent in the investments in
developed nations. Hence during low or moderate economic growth, the returns of LBOs
in the developed nations will be higher. We use the country’s GDP as a measure of
economic growth. We choose different levels of GDP as benchmarks of economic growth
and look at how returns vary in the different benchmark levels chosen.
We sort LBO transactions that exit during a period when the GDP was < 0; and
when GDP was >0 and < 2; and also when the GDP is > 2. We compare how the returns
and the number of days to exit vary in these three categories for developed and
developing countries. We look at the returns of the Leveraged buyout from the time of
the announcement to the period of exit; that is after the buyout firms exit through one of
3
the following ways: Initial public offering (IPO), bankruptcy, Management Buyout
(MBO), strategic buyout and secondary Leveraged Buyout (SLBO).
The top 50 PE firms from Private Equity International 300 (PEI 300) are given a
value of “one” to represent reputed firms. The other variables will be given a value
“zero” for the dummy variable. Reputed PE firm can obtain financing at a lower rate as
compared to the un-reputed PE firms. We find that reputed PE firms result in higher
returns and lesser number of days to exit the LBO. Stromberg (2008) finds that LBO
transactions that are sponsored by more experienced PE partnerships tend to stay in LBO
ownership for a shorter period of time, are more likely to go public, and are less likely to
end in bankruptcy or financial restructuring.
This finding contradicts the study by Demiroglu and James (2010), where they
found that small investments perform better than the larger ones. They also find that
leverage (Debt/EBITDA) is directly related to reputation. We also will test the number of
exits through different routes based on reputation of the issuer. For example: are
bankruptcies lower when the PE firm is reputed, or are the number of IPOs larger if the
PE firms are reputed.
Lopez-de-Silanes, Phalippou and Gottschalg (2010), find that Quick flips
(investments held for less than 2 years have high IRR (85%) and investments held for
more than 6 years have IRR of 8%. Our results reinforce these findings. We find that less
number of days to exit the LBO results in higher returns (table 8).
We extend the study of Officer, Ozbas and Sensoy (2010) to look at the effect of
club deals on the returns of the LBOs. They find that club deals reduce the returns of the
leveraged buyout since they reduce the competitiveness during the initial process of the
4
leveraged buyout deals. A club deal, in finance, refers to a leveraged buyout or other
private equity investment that involves several different private equity investment firms.
A club deal can also be referred as a syndicated investment.
In a club deal, the investor group of private equity firms pools its assets together
and makes the acquisition collectively. The practice has historically allowed private
equity to purchase larger and more expensive companies than each constituent firm could
potentially acquire through its own private equity funds. Additionally, by syndicating the
equity ownership across a group of investment firms, each firm reduces its risk of
investing since it is shared by many firms.
Club deal reduces competitiveness of a deal since many large PE firms combine
to acquire a firm. This might be due to reduction in the number of firms competing for
the bidding process. Also in club deals, the consortium of PE firms can negotiate better
terms with the target firm, either due to reputation of one or more firms in the
consortium, or due to availability of large funds due to combining of multiple PE firms.
The smaller PE firms may not have the reputation or the funds to acquire in such cases.
In our study, we look at the effect of the number of PE firms on the LBO returns
and also the number of days to exit. From the regression results, we find that for every
one additional PE firm, the value of the target firm is higher by 543 million USD. This
shows that club deals are associated with large deals (table 8). We find that club deals
results in 10 percentage points lower returns for each additional PE firm involved in the
deal. We also find that club deals take 45 days lesser to exit for each additional number of
PE firm (table 9).
5
We also test the returns of the LBOs when the country of the PE firm and the
target firm are same. The results show that the returns higher when the PE firm and the
target firm are from the same country. This is because the PE firm in the same country
may have more knowledge about the country’s laws, political factors and other country-
specific issues. Hence if the PE firm and the target firm are from the same country it is an
advantage as compared to if the firms belong to different countries.
We test if the size of the target firm influences the return of the leveraged buyout
transaction or the amount of time taken by the firm to exit. We try to classify the targets
as small, medium and large firms to test if the size of the target has an impact of the
returns or exit patterns of the buyout. We plan to divide the firms based on value of the
LBO. (Small = < 10Million, medium = 10 – 100million, large = > 100million).
Demiroglu and James (2010) and Lopez-de-Silanes, Phalippou and Gottschalg (2010),
find that small investments outperform large ones.
Our results also show that smaller firms perform better than the large firms.
However we found that smaller firms take longer time to exit. This could be because
smaller firms make take longer time to establish the business and grow. Also may be the
firm may be smaller in value due to financial distress. This may also take longer time to
exit since the business needs to stabilize and start making profits.
We also test if the Debt /capital ratio of the target firm has an impact on the
returns or exit time of the transactions. High debt levels can for result in tax advantage
from the LBO deal; it also means that the PE firm can borrow more debt at better terms
and if the PE firm is a reputed firm and hence the returns may be higher. In our results,
we find that higher Debt/Capital ratio results in higher returns.
6
We test if the industry of the target firm or the issuer firm has an influence on the
returns or exit patterns of the LBOs. Generally target firms in high growth industries tend
to perform better and have shorter exit periods than those in slower growth industries.
There have been studies that show that certain industries perform better than others. Hsu,
Reed, and Rocholl (2012) find that industries with higher visibility have lower returns.
Also the industry of the PE firms (buyer firms) also may influence the returns or
the exit patterns of the LBO or PE returns. In our analysis, we find that buyer firms in the
same industry as the target have lower returns. This is because the top PE firms are
classified to be in the finance industry, which in most cases is different from the industry
of the target firm. Hence PE firms in a different industry then that of the target firm, show
higher returns. This is because the top PE firms have good reputation through which they
can get better terms on the loan for LBO; they also have more experience in LBO
transactions and exit processes. Stromberg (2008) finds that LBO transactions that are
sponsored by more experienced PE partnerships tend to stay in LBO ownership for a
shorter period of time and are less likely to end in bankruptcy or financial restructuring.
We test the effect of legal, government and institutional factors in the target
country on the LBO returns and time taken to exit. We include variables Government
effectiveness, Rule of law, and number of procedures required to start a business. (The
definition of these variables are provided in Section IV. La Porta, Lopez-de-Silanes,
Shleifer and Vishny (1997) find that Good law enforcement has effect on valuation and
breadth of debt and equity markets.
La Porta, Lopez-de-Silanes, Shleifer and Vishny (2002) show that poor
shareholder protection is penalized with lower valuations, and that higher cash-flow
7
ownership by the controlling shareholder improves valuation, especially in countries with
poor investor protection. Leeds and Sunderland (2003) find that the returns in developed
markets do not compensate for the high risk involved in the transactions. This is mainly
due to low standards of corporate governance in terms of quality of information required
for investment decisions, weakness in legal systems to enforce legal contracts and
protecting all classes of investors; and the inability of domestic equity markets to offer
reasonable exit prospects through IPOs. They also mention that private equity investors
differentiate investments between countries based on protection to shareholder rights, tax
treatment of capital gains, and securities market development.
We also will test if various other factors influence the returns of the Leveraged
buyout transactions, such as the interest rates of both the target country and the issuer
country (buyer country). If the interest rates are low in the acquirer country, then the
acquirer can borrow at a cheaper rate to finance for the leveraged buyout. In the paper by
Axelson, Jenkinson, Strömberg and Weisbach (2012) they find that the economy-wide
cost of borrowing is the main driver of both the quantity and the composition of debt in
these buyouts. Credit conditions also have a strong effect on prices paid in buyouts, even
after controlling for prices of equivalent public market companies. In the developing
markets, the acquirers are mixed. Some are international PE firms, some are Domestic PE
or other investment firms, and there are also a few other firms acquiring the target
companies.
We will also test the effect of exchange rate fluctuation between the target country’s
currency and the issuer country’s currency. We will also test the Influence of stock
market returns in the target country and the issuer country on the returns of the LBOs.

8
We will also test if the returns of the leveraged buyout in the country are greater than or
lesser than the returns of the stock market of the target country, and also test if volatility
of the stock market has an influence on the returns or amount of investment in LBOs.
9
Section 2. Literature Review
There have been studies that have looked at international LBOs and analyzed
various factors that influence LBO activity. Leeds and Sunderland (2003), find that the
returns in developing markets do not compensate for the high risk involved in the
transactions. This is mainly due to low standards of corporate governance in terms of
quality of information required for investment decisions, weakness in legal systems to
enforce legal contracts and protecting all classes of investors; and the inability of
domestic equity markets to offer reasonable exit prospects through IPOs.
Lopez-de-Silanes, Phalippou and Gottschalg (2010), find that Quick flips
(investments held for less than 2 years have high IRR (85%) and investments held for
more than 6 years have IRR of 8%. They also find that small investments outperform
large ones. They look at the size of the PE firm in influencing the returns of the PE
investment. In this paper, they also find that investments in developing countries exhibit
poorer performance when compared to developed countries. This may be a result of
costly learning, lower leverage, poorer legal environments and limited exit routes.
In the paper by Axelson, Jenkinson, Strömberg and Weisbach (2012) they find
that the economy-wide cost of borrowing is the main driver of both the quantity and the
composition of debt in these buyouts. Credit conditions also have a strong effect on
prices paid in buyouts, even after controlling for prices of equivalent public market
companies. In the developing markets, the acquirers are mixed. Some are international
PE firms, some are Domestic PE or other investment firms, and there are also a few other
firms acquiring the target companies.
10
Demiroglu and James (2010) found that small investments perform better than the
larger ones. They also find that leverage (Debt/EBITDA) is directly related to reputation.
Calderón and Fuentes (2010) find that output losses during peak‐to‐trough phases are
larger among emerging market countries than among industrial ones. Output gains during
trough-to-peak phases are larger among emerging market economies.
La Porta, Lopez-de-Silanes, Shleifer and Vishny (1997) find that Good law
enforcement has effect on valuation and breadth of debt and equity markets. La Porta,
Lopez-de-Silanes, Shleifer and Vishny (2002) show that poor shareholder protection is
penalized with lower valuations, and that higher cash-flow ownership by the controlling
shareholder improves valuation, especially in countries with poor investor protection.
Leeds and Sunderland (2003) find that the returns in developed markets do not
compensate for the high risk involved in the transactions.
This is mainly due to low standards of corporate governance in terms of quality of
information required for investment decisions, weakness in legal systems to enforce legal
contracts and protecting all classes of investors; and the inability of domestic equity
markets to offer reasonable exit prospects through IPOs. They also mention that private
equity investors differentiate investments between countries based on protection to
shareholder rights, tax treatment of capital gains, and securities market development.
We look at the returns on the Leveraged Buyouts in both the developed and
developing (including newly industrialized economies). We want to test if the results
found in previous studies are persistent in the recession and the boom periods.
11
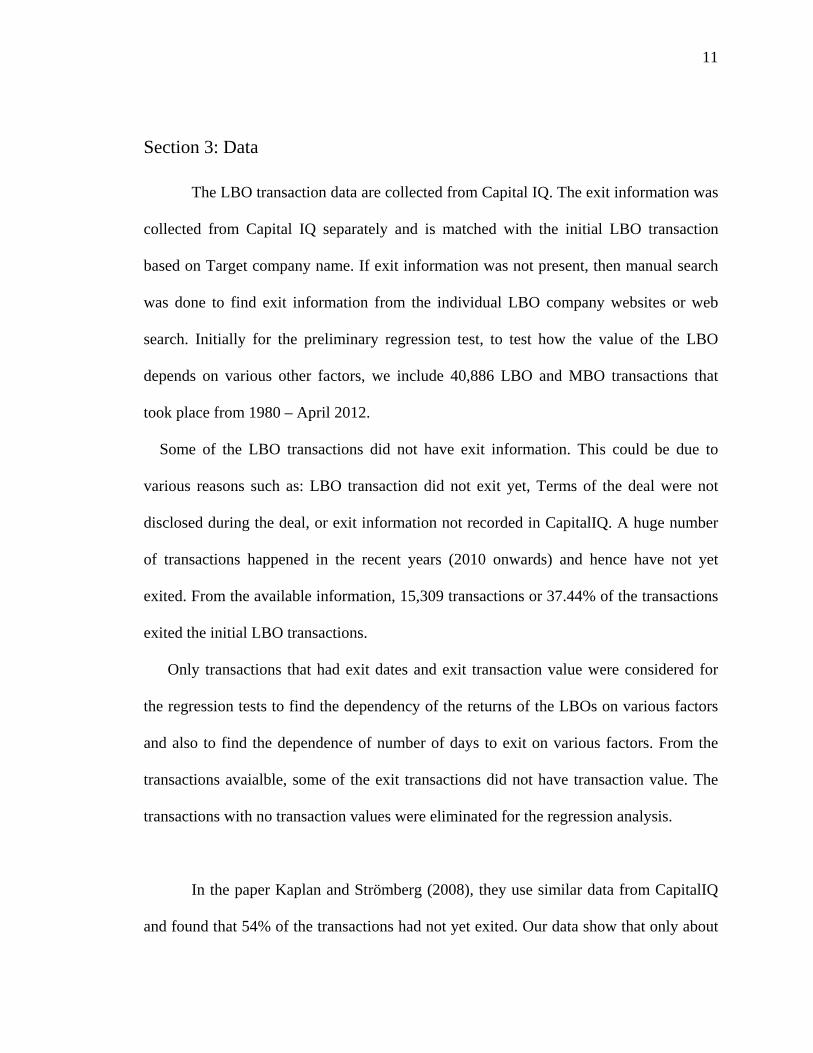
Section 3: Data
The LBO transaction data are collected from Capital IQ. The exit information was
collected from Capital IQ separately and is matched with the initial LBO transaction
based on Target company name. If exit information was not present, then manual search
was done to find exit information from the individual LBO company websites or web
search. Initially for the preliminary regression test, to test how the value of the LBO
depends on various other factors, we include 40,886 LBO and MBO transactions that
took place from 1980 – April 2012.
Some of the LBO transactions did not have exit information. This could be due to
various reasons such as: LBO transaction did not exit yet, Terms of the deal were not
disclosed during the deal, or exit information not recorded in CapitalIQ. A huge number
of transactions happened in the recent years (2010 onwards) and hence have not yet
exited. From the available information, 15,309 transactions or 37.44% of the transactions
exited the initial LBO transactions.
Only transactions that had exit dates and exit transaction value were considered for
the regression tests to find the dependency of the returns of the LBOs on various factors
and also to find the dependence of number of days to exit on various factors. From the
transactions avaialble, some of the exit transactions did not have transaction value. The
transactions with no transaction values were eliminated for the regression analysis.
In the paper Kaplan and Strömberg (2008), they use similar data from CapitalIQ
and found that 54% of the transactions had not yet exited. Our data show that only about
12
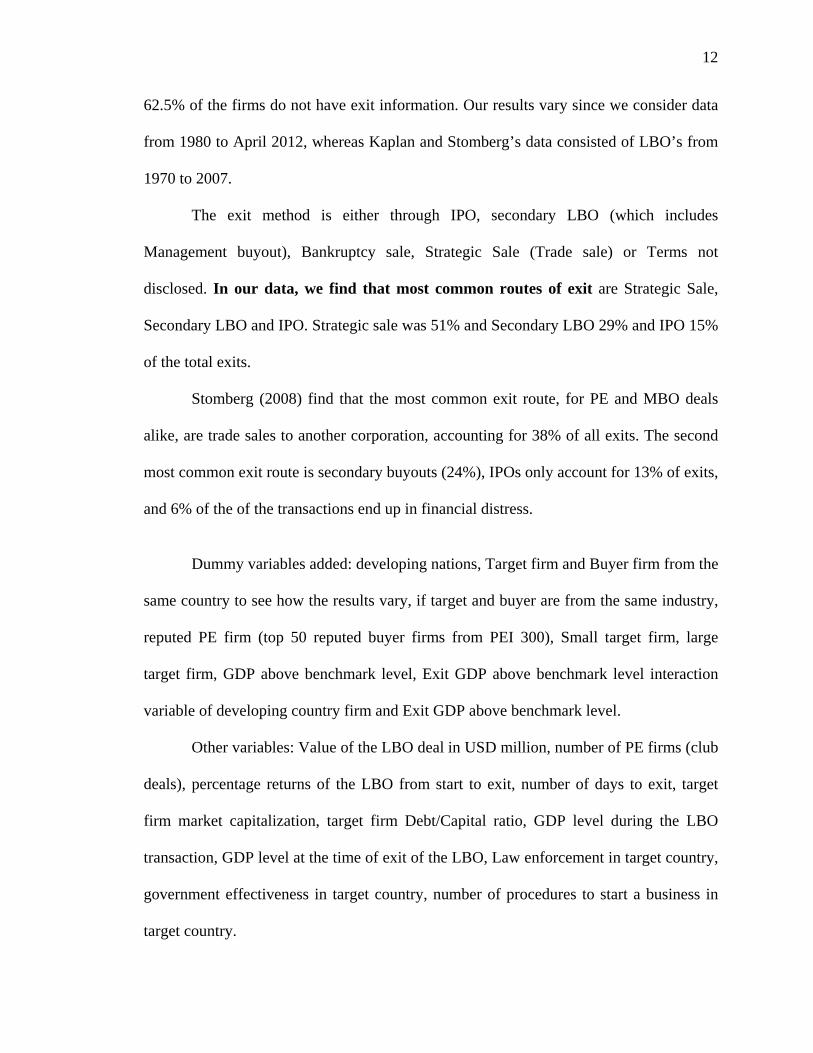
62.5% of the firms do not have exit information. Our results vary since we consider data
from 1980 to April 2012, whereas Kaplan and Stomberg’s data consisted of LBO’s from
1970 to 2007.
The exit method is either through IPO, secondary LBO (which includes
Management buyout), Bankruptcy sale, Strategic Sale (Trade sale) or Terms not
disclosed. In our data, we find that most common routes of exit are Strategic Sale,
Secondary LBO and IPO. Strategic sale was 51% and Secondary LBO 29% and IPO 15%
of the total exits.
Stomberg (2008) find that the most common exit route, for PE and MBO deals
alike, are trade sales to another corporation, accounting for 38% of all exits. The second
most common exit route is secondary buyouts (24%), IPOs only account for 13% of exits,
and 6% of the of the transactions end up in financial distress.
Dummy variables added: developing nations, Target firm and Buyer firm from the
same country to see how the results vary, if target and buyer are from the same industry,
reputed PE firm (top 50 reputed buyer firms from PEI 300), Small target firm, large
target firm, GDP above benchmark level, Exit GDP above benchmark level interaction
variable of developing country firm and Exit GDP above benchmark level.
Other variables: Value of the LBO deal in USD million, number of PE firms (club
deals), percentage returns of the LBO from start to exit, number of days to exit, target
firm market capitalization, target firm Debt/Capital ratio, GDP level during the LBO
transaction, GDP level at the time of exit of the LBO, Law enforcement in target country,
government effectiveness in target country, number of procedures to start a business in
target country.
13
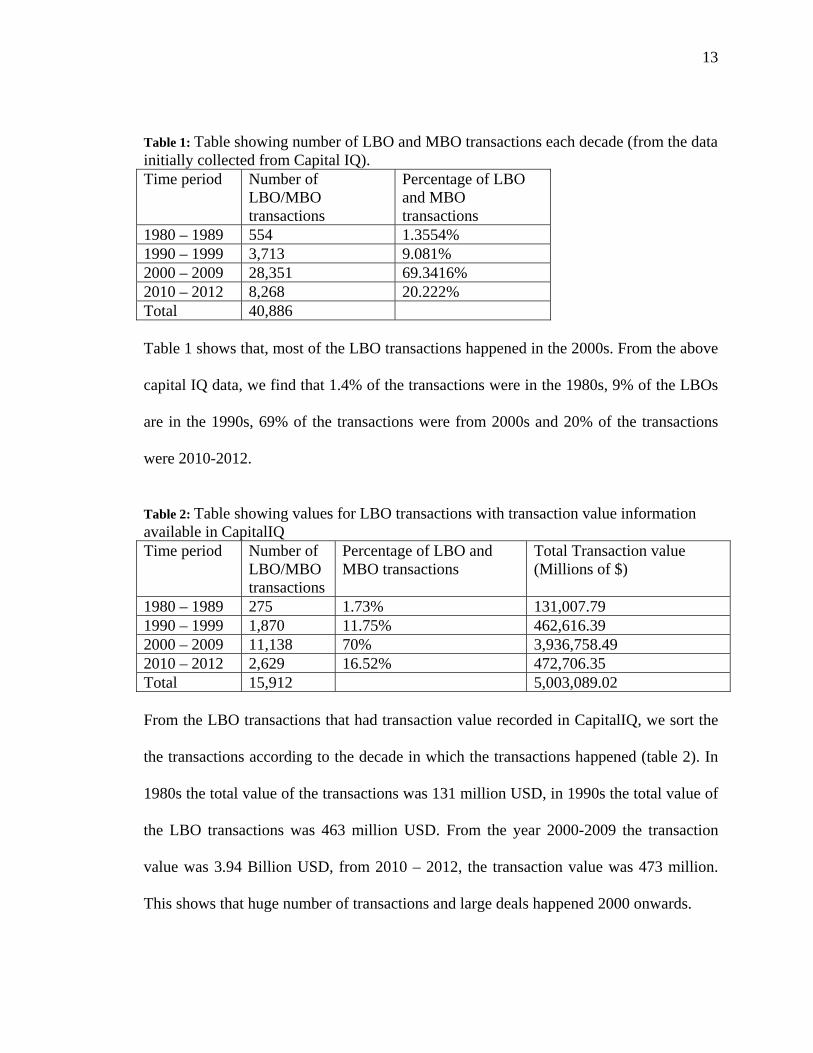
Table 1: Table showing number of LBO and MBO transactions each decade (from the data initially collected from Capital IQ). Time period Number of
LBO/MBO transactions
Percentage of LBO and MBO transactions
1980 – 1989 554 1.3554% 1990 – 1999 3,713 9.081% 2000 – 2009 28,351 69.3416% 2010 – 2012 8,268 20.222% Total 40,886 Table 1 shows that, most of the LBO transactions happened in the 2000s. From the above
capital IQ data, we find that 1.4% of the transactions were in the 1980s, 9% of the LBOs
are in the 1990s, 69% of the transactions were from 2000s and 20% of the transactions
were 2010-2012.
Table 2: Table showing values for LBO transactions with transaction value information available in CapitalIQ Time period Number of
LBO/MBO transactions
Percentage of LBO and MBO transactions
Total Transaction value (Millions of $)
1980 – 1989 275 1.73% 131,007.79 1990 – 1999 1,870 11.75% 462,616.39 2000 – 2009 11,138 70% 3,936,758.49 2010 – 2012 2,629 16.52% 472,706.35 Total 15,912 5,003,089.02 From the LBO transactions that had transaction value recorded in CapitalIQ, we sort the
the transactions according to the decade in which the transactions happened (table 2). In
1980s the total value of the transactions was 131 million USD, in 1990s the total value of
the LBO transactions was 463 million USD. From the year 2000-2009 the transaction
value was 3.94 Billion USD, from 2010 – 2012, the transaction value was 473 million.
This shows that huge number of transactions and large deals happened 2000 onwards.
14
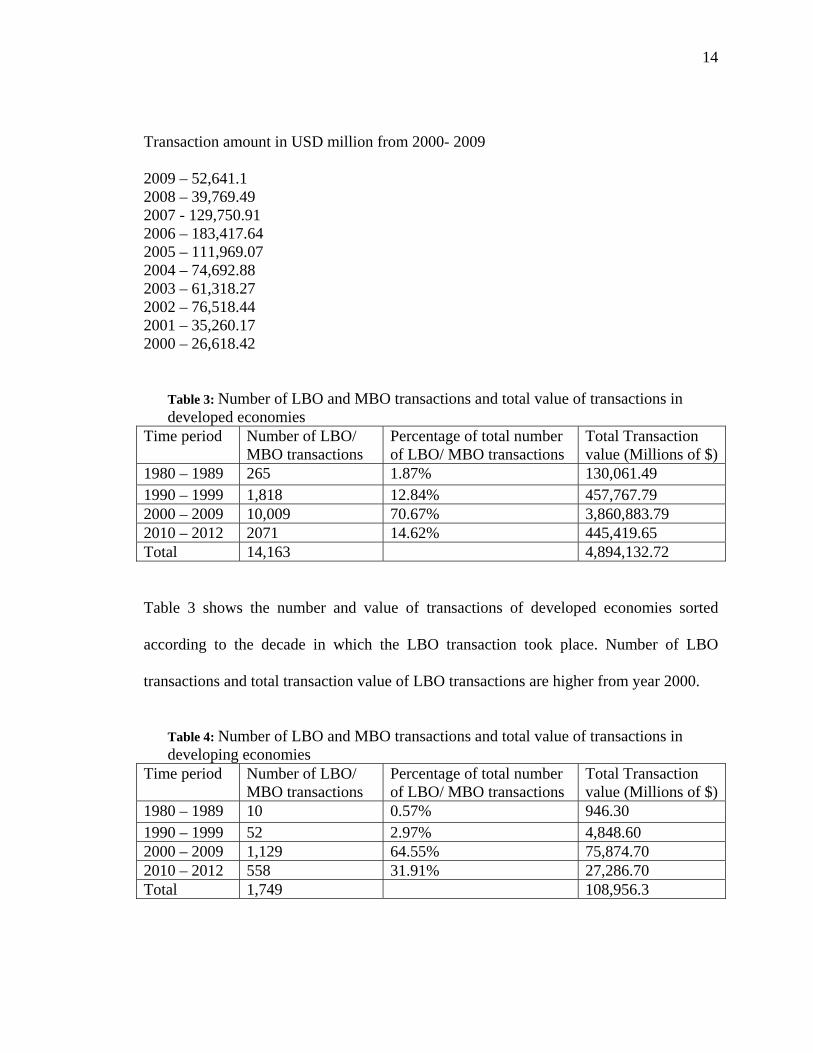
Transaction amount in USD million from 2000- 2009
2009 – 52,641.1 2008 – 39,769.49 2007 - 129,750.91 2006 – 183,417.64 2005 – 111,969.07 2004 – 74,692.88 2003 – 61,318.27 2002 – 76,518.44 2001 – 35,260.17 2000 – 26,618.42
Table 3: Number of LBO and MBO transactions and total value of transactions in developed economies
Time period Number of LBO/ MBO transactions
Percentage of total number of LBO/ MBO transactions
Total Transaction value (Millions of $)
1980 – 1989 265 1.87% 130,061.49 1990 – 1999 1,818 12.84% 457,767.79 2000 – 2009 10,009 70.67% 3,860,883.79 2010 – 2012 2071 14.62% 445,419.65 Total 14,163 4,894,132.72
Table 3 shows the number and value of transactions of developed economies sorted
according to the decade in which the LBO transaction took place. Number of LBO
transactions and total transaction value of LBO transactions are higher from year 2000.
Table 4: Number of LBO and MBO transactions and total value of transactions in developing economies
Time period Number of LBO/ MBO transactions
Percentage of total number of LBO/ MBO transactions
Total Transaction value (Millions of $)
1980 – 1989 10 0.57% 946.30 1990 – 1999 52 2.97% 4,848.60 2000 – 2009 1,129 64.55% 75,874.70 2010 – 2012 558 31.91% 27,286.70 Total 1,749 108,956.3
15
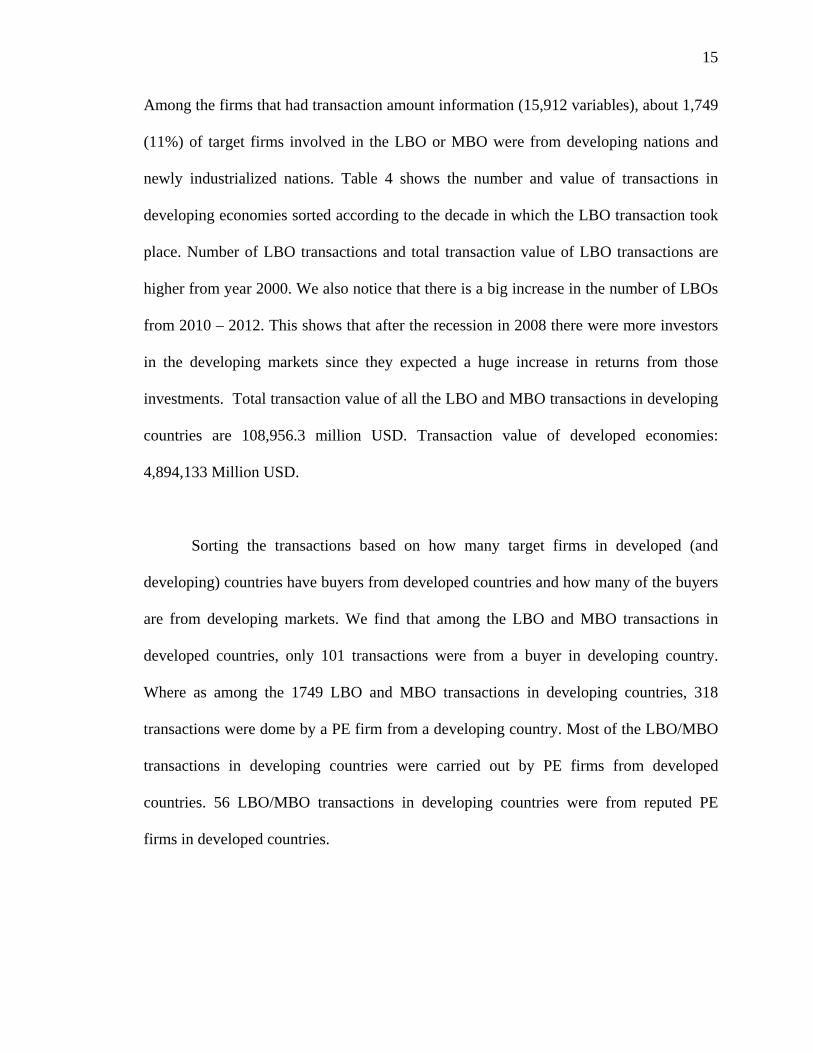
Among the firms that had transaction amount information (15,912 variables), about 1,749
(11%) of target firms involved in the LBO or MBO were from developing nations and
newly industrialized nations. Table 4 shows the number and value of transactions in
developing economies sorted according to the decade in which the LBO transaction took
place. Number of LBO transactions and total transaction value of LBO transactions are
higher from year 2000. We also notice that there is a big increase in the number of LBOs
from 2010 – 2012. This shows that after the recession in 2008 there were more investors
in the developing markets since they expected a huge increase in returns from those
investments. Total transaction value of all the LBO and MBO transactions in developing
countries are 108,956.3 million USD. Transaction value of developed economies:
4,894,133 Million USD.
Sorting the transactions based on how many target firms in developed (and
developing) countries have buyers from developed countries and how many of the buyers
are from developing markets. We find that among the LBO and MBO transactions in
developed countries, only 101 transactions were from a buyer in developing country.
Where as among the 1749 LBO and MBO transactions in developing countries, 318
transactions were dome by a PE firm from a developing country. Most of the LBO/MBO
transactions in developing countries were carried out by PE firms from developed
countries. 56 LBO/MBO transactions in developing countries were from reputed PE
firms in developed countries.
16
When we compare the Target debt/capital ratio in developed and developing
economies, we find that: Debt to capital ratio ranges from 0.011 to 4444.6 in developed
economies. Average Debt/Capital ratio in developed economies is 69.21. In developing
economies, the Debt/Capital ratios range from 0.084 to 131.7 with an average of 37.88.
The reason for a higher Debt/Capital ratio in case of developed economies is that the
interest rates in developed economies are low as compared to that of the developing
economies; hence they have a higher ability to pay off high debt. Also the credit rating is
high hence developed economies can obtain higher debt easily.
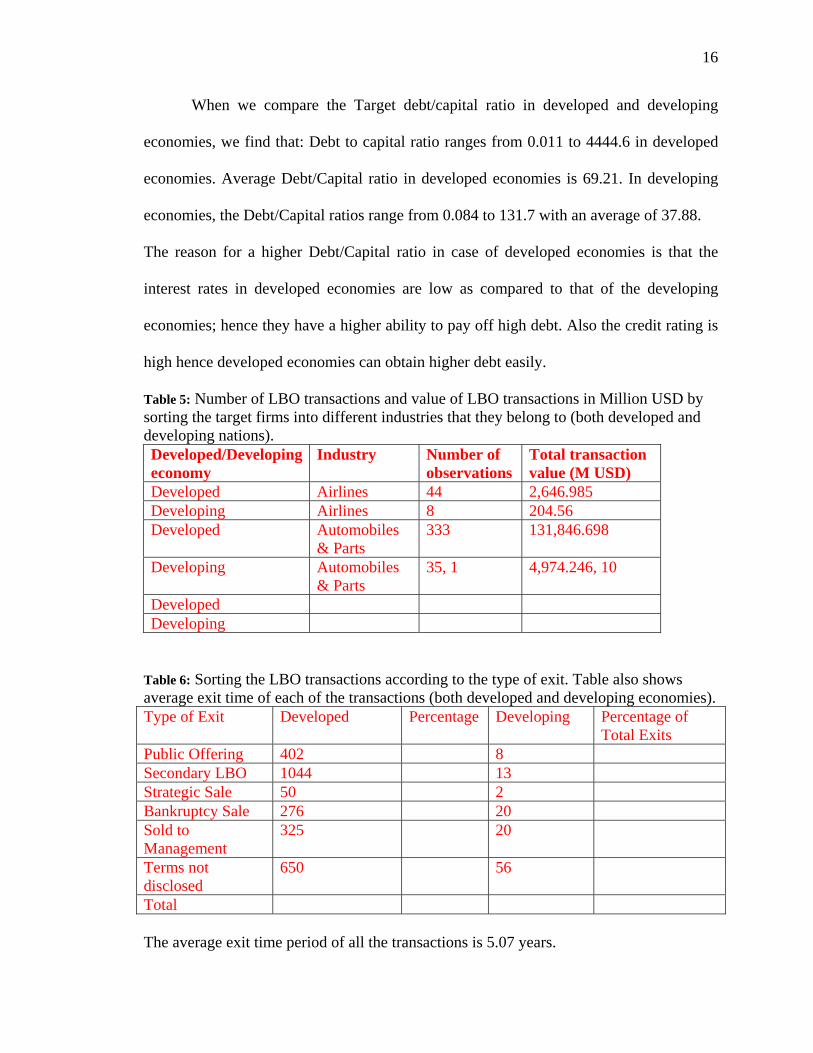
Table 5: Number of LBO transactions and value of LBO transactions in Million USD by sorting the target firms into different industries that they belong to (both developed and developing nations). Developed/Developing economy
Industry Number of observations
Total transaction value (M USD)
Developed Airlines 44 2,646.985 Developing Airlines 8 204.56 Developed Automobiles
& Parts 333 131,846.698
Developing Automobiles & Parts
35, 1 4,974.246, 10
Developed Developing
Table 6: Sorting the LBO transactions according to the type of exit. Table also shows average exit time of each of the transactions (both developed and developing economies). Type of Exit Developed Percentage Developing Percentage of
Total Exits Public Offering 402 8 Secondary LBO 1044 13 Strategic Sale 50 2 Bankruptcy Sale 276 20 Sold to Management
325 20
Terms not disclosed
650 56
Total The average exit time period of all the transactions is 5.07 years.
17
Section 4: Methodology
We divide the LBO activity into two categories based on the country of origin of
the target. We classify and compare leveraged buyout activity as LBOs in developed
countries and LBOs in developing countries.
Hypothesis 1: Returns of Leveraged buyouts are on average higher; however
during periods of high economic growth, LBOs in developing economies have better
returns when compared with developed economies. However in slow or low economies
growth periods, the LBO transactions in developed economies produce higher returns
than the LBOs in developing economies.
This is true because developed economies have high growth rates in terms of
GDP and other economic indicators. Historical GDP (last 10 years) in US is on average
about 2-2.5% and highest being about 6.6% in Q3 2003. Source: US Bureau of Economic
Analysis. In UK and Scotland, GDP growth rate in the last 10 years has been around 2%
with the highest GDP being a little over 4% in Q3 2003 (UK GDP). Source: Scottish
Government Website.
In China (Newly industrialized economy), GDP growth rate in the last 10 years
has been around 9% with the highest GDP being about 12.8% in 2007. South Africa has a
highest GDP growth rate of 6.5%. Similar in other developing or newly industrialized
economies, GDP growth rate is much higher compared to the developed economies.
Hence investments in developing or newly industrialized economies have higher returns
when compared to investments in developed economies. However, in periods of slow
economic growth, like periods of recession, the developing markets are highly risky.
Hence we want to test is Hypothesis 1 holds true.
18
Hypothesis 2: Leveraged buyouts in developed economies exit sooner; however
during periods of high economic growth, LBOs in developing economies exit sooner
when compared with developed economies. However in slow or low economies growth
periods, the LBO transactions in developed economies exit sooner than the LBOs in
developing economies.
Hypothesis 2 is true due to the same explanation of Hypothesis 1. In periods of
fast economies growth, the developing market’s LBOs have high returns and hence exit
sooner. And in periods of recession or slow growth, the LBOs in developing markets
have difficulty finding exit buyers, or taking the firm public.
We also try to find how differently the returns of the LBO are influenced by
various other variables that are listed and described below in the model. We test how
these factors influence the amount, returns and number of days to exit the LBOs.
Model
For the regression analysis, we use simple OLS regression model: Equation 1) is the
initial regression equation which considered all the observations (with or without exit
information). For Equations 2) and 3) consider only the observations that have exited the
initial LBO transaction.
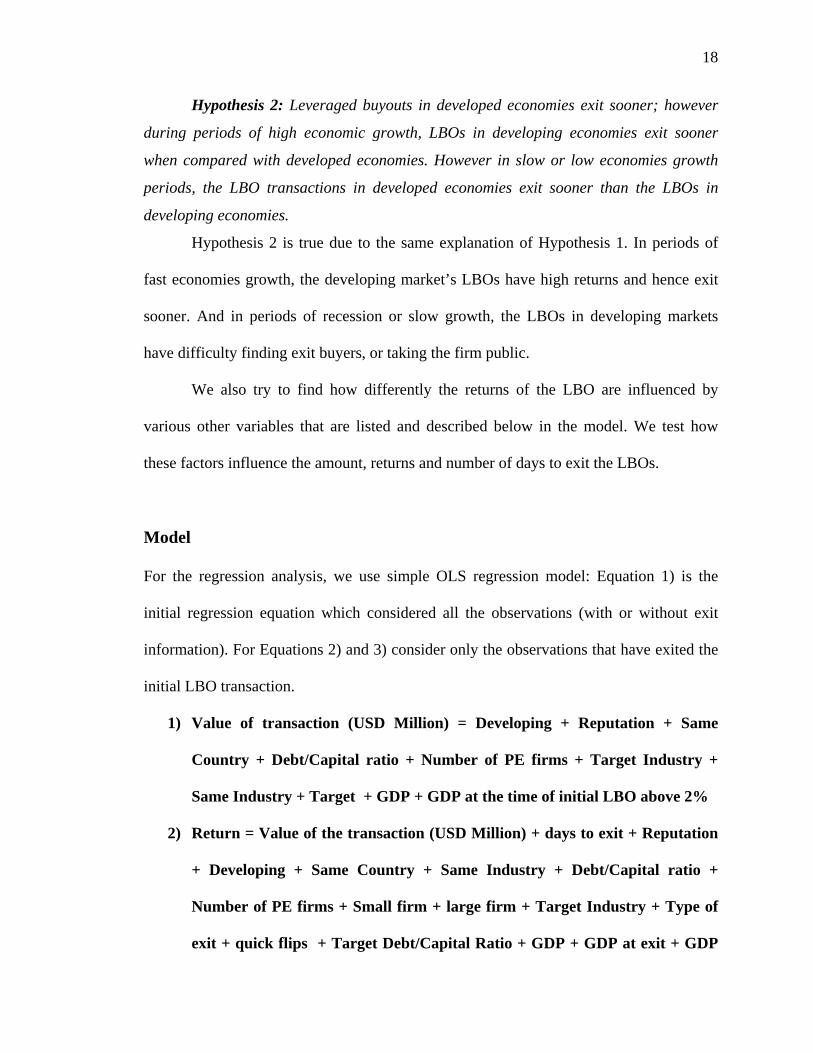
1) Value of transaction (USD Million) = Developing + Reputation + Same
Country + Debt/Capital ratio + Number of PE firms + Target Industry +
Same Industry + Target + GDP + GDP at the time of initial LBO above 2%
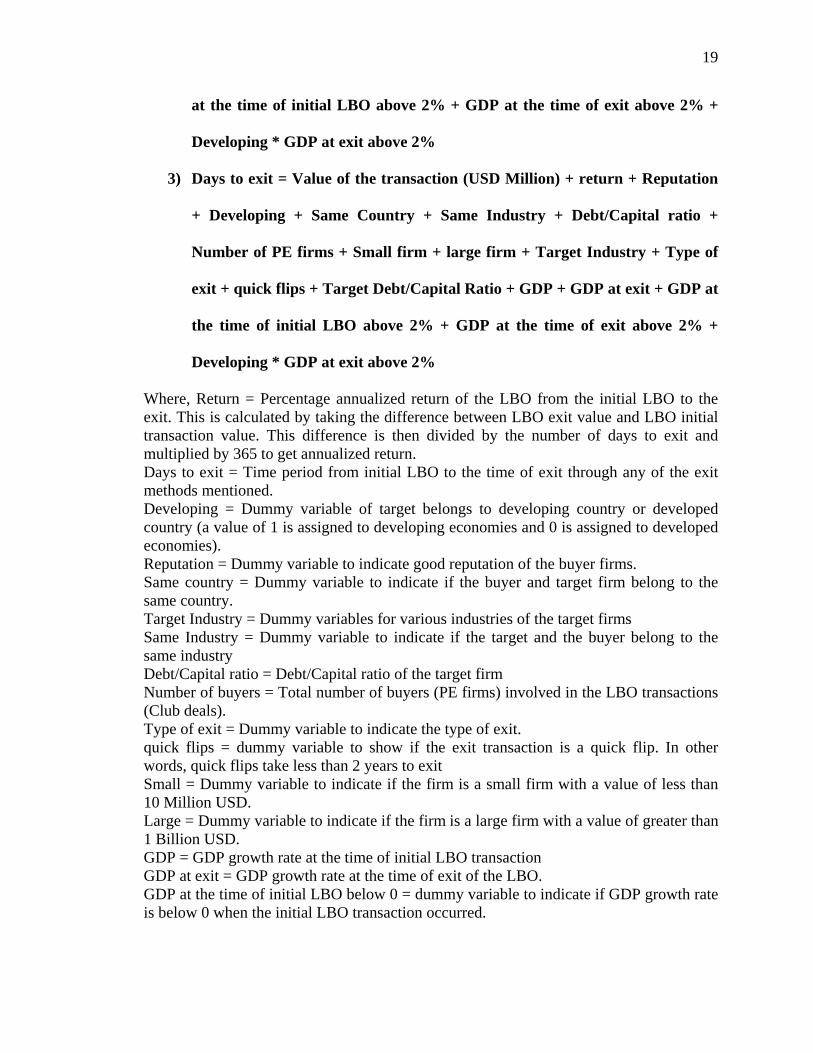
2) Return = Value of the transaction (USD Million) + days to exit + Reputation
+ Developing + Same Country + Same Industry + Debt/Capital ratio +
Number of PE firms + Small firm + large firm + Target Industry + Type of
exit + quick flips + Target Debt/Capital Ratio + GDP + GDP at exit + GDP
19
at the time of initial LBO above 2% + GDP at the time of exit above 2% +
Developing * GDP at exit above 2%
3) Days to exit = Value of the transaction (USD Million) + return + Reputation
+ Developing + Same Country + Same Industry + Debt/Capital ratio +
Number of PE firms + Small firm + large firm + Target Industry + Type of
exit + quick flips + Target Debt/Capital Ratio + GDP + GDP at exit + GDP at
the time of initial LBO above 2% + GDP at the time of exit above 2% +
Developing * GDP at exit above 2%
Where, Return = Percentage annualized return of the LBO from the initial LBO to the exit. This is calculated by taking the difference between LBO exit value and LBO initial transaction value. This difference is then divided by the number of days to exit and multiplied by 365 to get annualized return. Days to exit = Time period from initial LBO to the time of exit through any of the exit methods mentioned. Developing = Dummy variable of target belongs to developing country or developed country (a value of 1 is assigned to developing economies and 0 is assigned to developed economies). Reputation = Dummy variable to indicate good reputation of the buyer firms. Same country = Dummy variable to indicate if the buyer and target firm belong to the same country. Target Industry = Dummy variables for various industries of the target firms Same Industry = Dummy variable to indicate if the target and the buyer belong to the same industry Debt/Capital ratio = Debt/Capital ratio of the target firm Number of buyers = Total number of buyers (PE firms) involved in the LBO transactions (Club deals). Type of exit = Dummy variable to indicate the type of exit. quick flips = dummy variable to show if the exit transaction is a quick flip. In other words, quick flips take less than 2 years to exit Small = Dummy variable to indicate if the firm is a small firm with a value of less than 10 Million USD. Large = Dummy variable to indicate if the firm is a large firm with a value of greater than 1 Billion USD. GDP = GDP growth rate at the time of initial LBO transaction GDP at exit = GDP growth rate at the time of exit of the LBO. GDP at the time of initial LBO below 0 = dummy variable to indicate if GDP growth rate is below 0 when the initial LBO transaction occurred.
20
GDP at the time of initial LBO between 0-2% = dummy variable to indicate if GDP growth rate is above 0 when the initial LBO transaction occurred. GDP at the time of initial LBO above 2% = dummy variable to indicate if GDP growth rate is above 2% when the initial LBO transaction occurred. GDP at the time of exit below 0 = Dummy variable to indicate if GDP growth rate at the time of exit of the LBO was below 0. GDP at the time of exit between 0 and 2%= Dummy variable to indicate if GDP growth rate at the time of exit of the LBO was between 0 and 2%. GDP at the time of exit above 2% = Dummy variable to indicate if GDP growth rate at the time of exit of the LBO was above 2%. Developing * GDP below 0% = interaction variable between the dummy variable Developing and if GDP Growth rate during initial LBO is below 0%. Developing * GDP at exit below 0% = interaction variable between the dummy variable Developing and if GDP at exit is below 0% Developing * GDP above 2% = interaction variable between the dummy variable Developing and if GDP Growth rate during initial LBO is above 2%. Developing * GDP at exit above 2% = interaction variable between the dummy variable Developing and if GDP at exit is above 2% Govt = government effectiveness. Law = rule of law. Numb of proced = number of procedures.
The classification of whether the country belonged to a developed country or a
developing country (Variable: Developing) was done based on International Monetary
Fund’s World economic outlook report, April 2012. About 1900 transactions were from
developing countries. The remaining 15,000 transactions were from developed countries.
This clearly shows that the LBO’s are mainly in developed economies.
The variable Target industry is the “Industry classification benchmark” launched
by DOW Jones and FTSE in 2005. It is used to segregate markets into sectors within the
macroeconomy. Dummy variable is created if the target firm and the PE firm are from the
same industry. A value of 1 is assigned if the target firm and the PE firm are from the
same industry. This is to determine if there is any increase/decrease in returns when the
target and the buyer firms operate in the same industry. For this dummy variable even if
one of the multiple buyers are in the same industry as the target firm, then a value of 1 is
21
assigned to the variable; and if none of the buyers belong to the industry as that of the
target firm, then a value 0 is assigned to the variable.
Dummy variables are to be created for reputation of the PE firms. That is: if at
least one of the buyer firm/firms is a reputed firm, then the dummy variable is given a
value 1 and 0 otherwise. The measure for reputation is given based on Private equity
international May 2012 report, which looks at the total fund raised by the PE firms for 5
years, i.e; 2006 – 2011. This report reveals that the world's 50 largest private equity direct
investment programs have raised in excess of US$325 billion since 2006. Even though,
some of the transactions took place long before 2011, we consider this report to be close
enough since most of the transactions that were collected from CapitalIQ were after the
year 2000 and exited in the recent years. Hence the firms in this report will give a close
measure of the reputation of the Private Equity (PE) firms in the sample.
As in the paper, Officer, Ozbas and Sensoy (2010), we include a variable to
indicates the number of PE firms (or the number of buyer firms) involved in the LBO
transaction. This is to test if higher number of PE firms, have an influence in increasing
the returns. We even test the influence of number of PE firms on the number of days to
exit for the LBO.
The variable Type of exit includes the different types of exit routes of the LBO
transaction. We use the exit routes, Secondary LBO, Strategic Sale, Initial Public offering
(IPO) and bankruptcy. We exclude terms not disclosed from the regression since we do
not have transaction value for the interpretation of results.
We also include variables to test if the size of the target firm influences the return
of the leveraged buyout transaction or the amount of time taken by the firm to exit. create
22
three dummy variables “small”, “medium” and “large”. The firms are divided based on
the value of the LBO. Small = < 10Million, medium = 10 – 100million, large = >
100million. We include Variables Small and Large in the regression to test influence of
these two extreme categories.
The variables GDP and GDP at exit can help us test of GDP at the time of initial
LBO and GDP at the time of exit has an influence on the returns or the days taken to exit
the LBO. We choose different levels of GDP as benchmarks of economic growth and
look at how returns vary in the different benchmark levels chosen.
We sort transactions that took place during a period when the GDP was < 0; and
when GDP was >0 and < 2; and also when the GDP is > 2. We compare how the
dependent variables “returns” and also “days to exit” depend on these three categories
and analyze how these two dependent variables vary for developed and developing
countries. This benchmark lets us compare the transactions that took place in times when
the market was performing badly (GDP <0), we can also look at slow/moderate growth
periods (GDP between 0 and 2) and also when the economy is growing fast (GDP >0).
Although the benchmark may be different for different countries, (for
example, a developing country may have much higher GDP growth rates than the 2
percent level that we have chosen for high growth phase), we still choose this average
since most of the transactions are in the US and UK and 2% level would be an
appropriate average for most economies.
Since one of our hypotheses is mainly based on if the returns in developing
markets are higher or lower compared the returns in developed markets, we include
interaction variables between the variable “Developing” with each of the four variables
23
“GDP below 0%” , “GDP at exit below 0%” , “GDP above 2%” and “GDP at exit above
2%”. This creates four different variables that lets us test if returns are lower or higher for
developing markets during periods of economic boom (GDP growth rate above 2%) or
recession (GDP growth rate below 0%).
Finally we include three variables to test the effect of regulation, law enforcement and
ease of setting up a business on the returns on days to exit the LBO. Better law
enforcement and corporate governance in target country results in higher returns. La
Porta, Lopez-de-Silanes, Shleifer, Vishny (2002) and Leeds and Sunderland (2003) find
developing countries do not have very effective corporate governance, legal systems to
enforce legal contracts or government effectiveness and hence result in low returns on the
transactions.
Government effectiveness, range from -2.5 to 2.5. (Source: Kaufman, Kraay and
Mastruzzi (2003)). They combine into a single grouping responses on the quality of
public service provision, the quality of the bureaucracy, the competence of civil servants,
the independence of the civil service from political pressures, and the credibility of the
government’s commitment to policies. The main focus of this index is on “inputs”
required for the government to be able to produce and implement good policies and
deliver public goods.
Law = rule of law, range from -2.5 to 2.5. (Source: Kaufman, Kraay and
Mastruzzi (2003)). They include several indicators which measure the extent to which
agents have confidence in and abide by the rules of society. These include perceptions of
the incidence of crime, the effectiveness and predictability of the judiciary, and the
enforceability of contracts. Together, these indicators measure the success of a society in
24
developing an environment in which fair and predictable rules form the basis for
economic and social interactions, and importantly, the extent to which property rights are
protected.
Numb of procedures is defined as the number of procedures required to start up a
firm. Range from 2 – 21. Where 2 means, it is easiest to start a firm and 21 is where it
requires 21 procedures to start a business and hence it is most difficult to start a business
in these target firms. This helps us test if it is easy to exit the LBO and start over as a new
firm. (Source: Djankov, La Portla, Lopez-De-Silanes, Shleifer (2002)).
25
Section 5: Findings
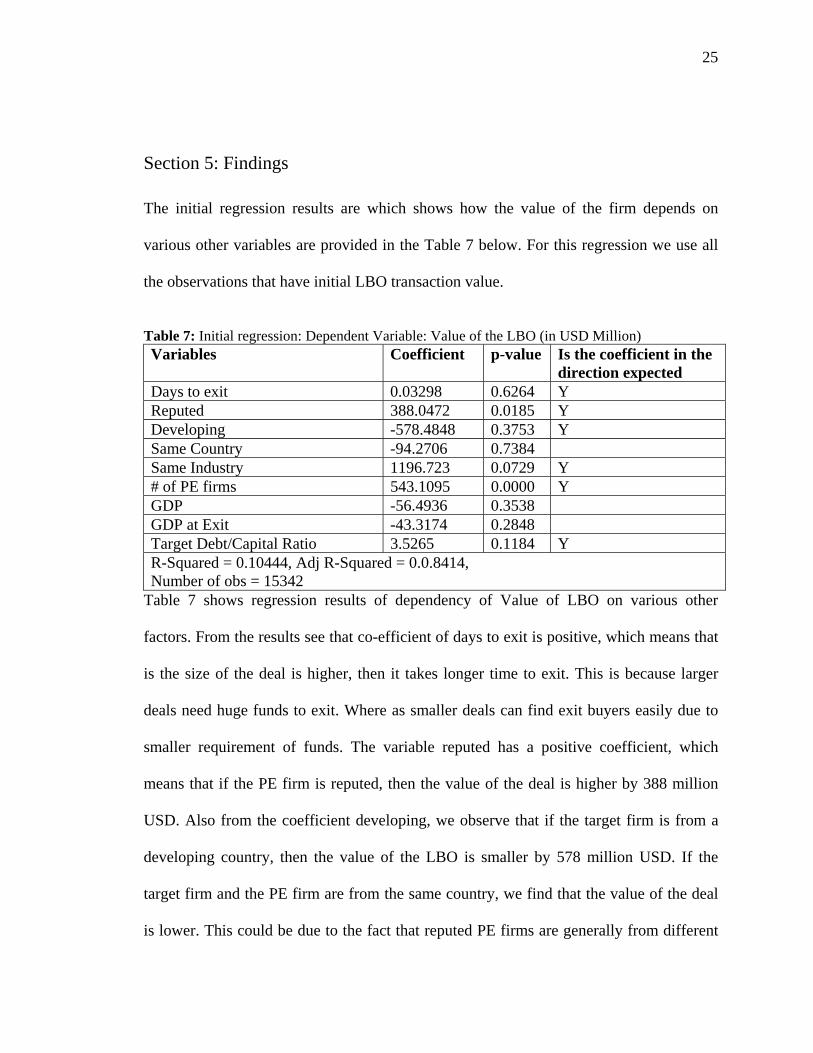
The initial regression results are which shows how the value of the firm depends on
various other variables are provided in the Table 7 below. For this regression we use all
the observations that have initial LBO transaction value.
Table 7: Initial regression: Dependent Variable: Value of the LBO (in USD Million) Variables Coefficient p-value Is the coefficient in the
direction expected Days to exit 0.03298 0.6264 Y Reputed 388.0472 0.0185 Y Developing -578.4848 0.3753 Y Same Country -94.2706 0.7384 Same Industry 1196.723 0.0729 Y # of PE firms 543.1095 0.0000 Y GDP -56.4936 0.3538 GDP at Exit -43.3174 0.2848 Target Debt/Capital Ratio 3.5265 0.1184 Y R-Squared = 0.10444, Adj R-Squared = 0.0.8414, Number of obs = 15342
Table 7 shows regression results of dependency of Value of LBO on various other
factors. From the results see that co-efficient of days to exit is positive, which means that
is the size of the deal is higher, then it takes longer time to exit. This is because larger
deals need huge funds to exit. Where as smaller deals can find exit buyers easily due to
smaller requirement of funds. The variable reputed has a positive coefficient, which
means that if the PE firm is reputed, then the value of the deal is higher by 388 million
USD. Also from the coefficient developing, we observe that if the target firm is from a
developing country, then the value of the LBO is smaller by 578 million USD. If the
target firm and the PE firm are from the same country, we find that the value of the deal
is lower. This could be due to the fact that reputed PE firms are generally from different
26
country as compared to the target firm country and hence the lower value of deals. If the
PE firm and the target firm are from the same industry, then the value of the LBO deals
are higher. If the number of PE firms is higher, then the value of the deal is higher by
1197 million USD as shown by coefficient # of days to exit. This is in lines with the
finding that club deals are involved in larger LBOs’ since they can get better terms on the
loan due to reputation and capacity to borrow more funds due to their sheer size and
number. From the coefficients GDP and GDP at exit, we observe that if the target GDP is
higher then the value of the deal is lower; this is what we expected to have. From the
coefficient target debt/capital ratio, we find that if the debt/capital ratio of the target firm
is high, then the value of the LBO is higher. This shows that high debt is borrowed to
finance the LBO deals.
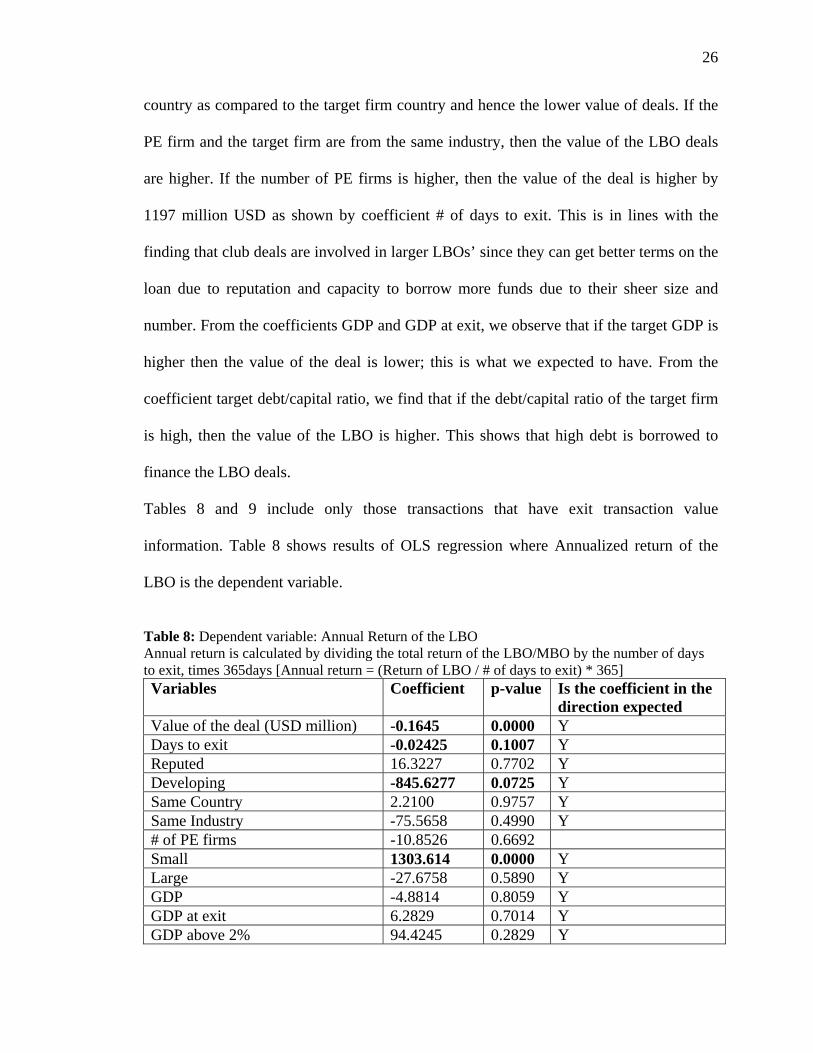
Tables 8 and 9 include only those transactions that have exit transaction value
information. Table 8 shows results of OLS regression where Annualized return of the
LBO is the dependent variable.
Table 8: Dependent variable: Annual Return of the LBO Annual return is calculated by dividing the total return of the LBO/MBO by the number of days to exit, times 365days [Annual return = (Return of LBO / # of days to exit) * 365] Variables Coefficient p-value Is the coefficient in the
direction expected Value of the deal (USD million) -0.1645 0.0000 Y Days to exit -0.02425 0.1007 Y Reputed 16.3227 0.7702 Y Developing -845.6277 0.0725 Y Same Country 2.2100 0.9757 Y Same Industry -75.5658 0.4990 Y # of PE firms -10.8526 0.6692 Small 1303.614 0.0000 Y Large -27.6758 0.5890 Y GDP -4.8814 0.8059 Y GDP at exit 6.2829 0.7014 Y GDP above 2% 94.4245 0.2829 Y
27
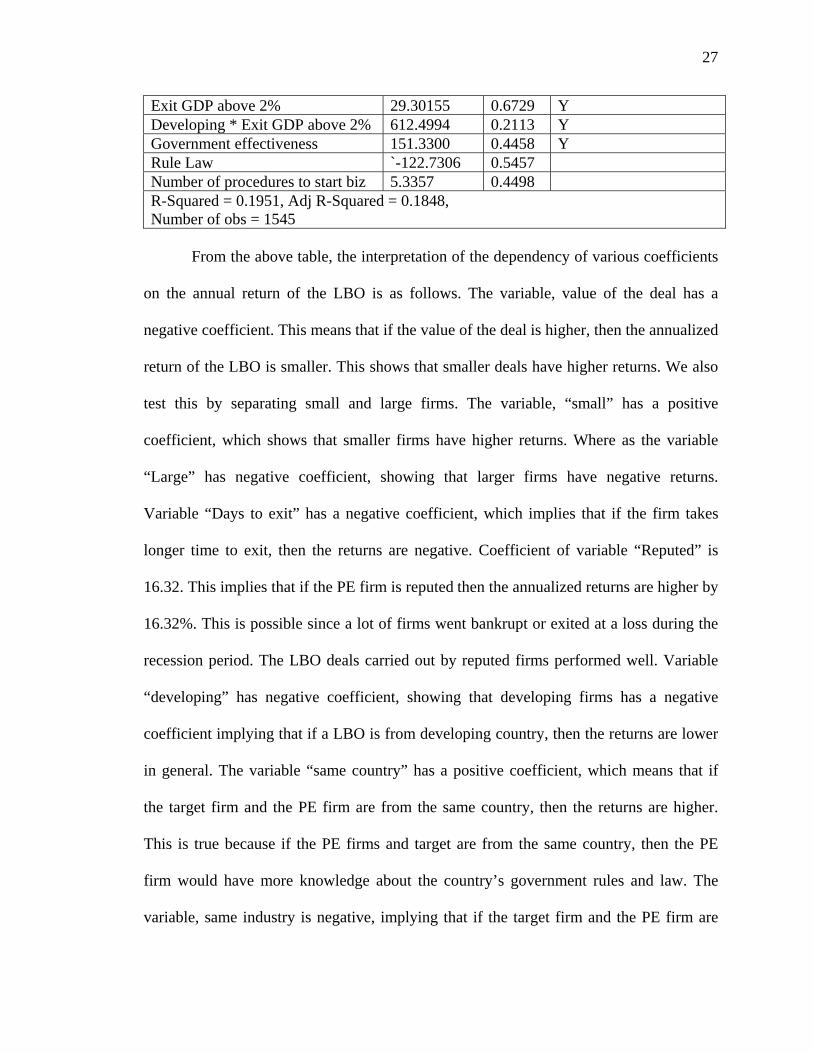
Exit GDP above 2% 29.30155 0.6729 Y Developing * Exit GDP above 2% 612.4994 0.2113 Y Government effectiveness 151.3300 0.4458 Y Rule Law `-122.7306 0.5457 Number of procedures to start biz 5.3357 0.4498 R-Squared = 0.1951, Adj R-Squared = 0.1848, Number of obs = 1545
From the above table, the interpretation of the dependency of various coefficients
on the annual return of the LBO is as follows. The variable, value of the deal has a
negative coefficient. This means that if the value of the deal is higher, then the annualized
return of the LBO is smaller. This shows that smaller deals have higher returns. We also
test this by separating small and large firms. The variable, “small” has a positive
coefficient, which shows that smaller firms have higher returns. Where as the variable
“Large” has negative coefficient, showing that larger firms have negative returns.
Variable “Days to exit” has a negative coefficient, which implies that if the firm takes
longer time to exit, then the returns are negative. Coefficient of variable “Reputed” is
16.32. This implies that if the PE firm is reputed then the annualized returns are higher by
16.32%. This is possible since a lot of firms went bankrupt or exited at a loss during the
recession period. The LBO deals carried out by reputed firms performed well. Variable
“developing” has negative coefficient, showing that developing firms has a negative
coefficient implying that if a LBO is from developing country, then the returns are lower
in general. The variable “same country” has a positive coefficient, which means that if
the target firm and the PE firm are from the same country, then the returns are higher.
This is true because if the PE firms and target are from the same country, then the PE
firm would have more knowledge about the country’s government rules and law. The
variable, same industry is negative, implying that if the target firm and the PE firm are
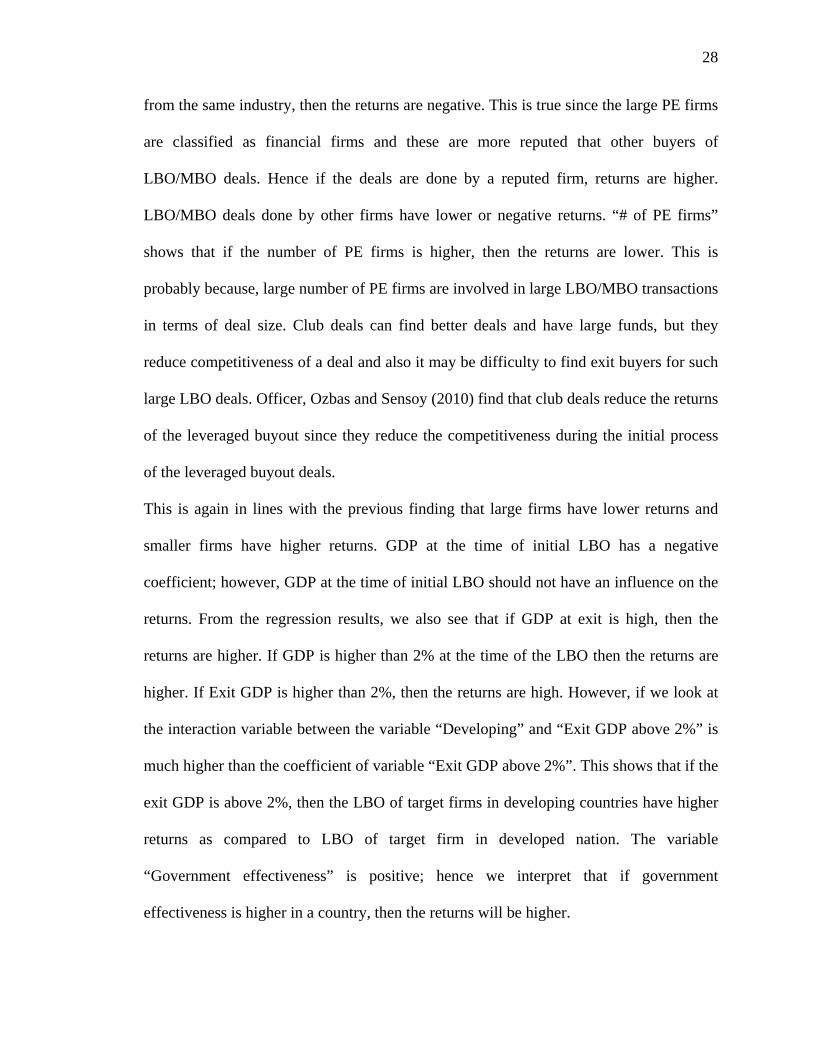
28
from the same industry, then the returns are negative. This is true since the large PE firms
are classified as financial firms and these are more reputed that other buyers of
LBO/MBO deals. Hence if the deals are done by a reputed firm, returns are higher.
LBO/MBO deals done by other firms have lower or negative returns. “# of PE firms”
shows that if the number of PE firms is higher, then the returns are lower. This is
probably because, large number of PE firms are involved in large LBO/MBO transactions
in terms of deal size. Club deals can find better deals and have large funds, but they
reduce competitiveness of a deal and also it may be difficulty to find exit buyers for such
large LBO deals. Officer, Ozbas and Sensoy (2010) find that club deals reduce the returns
of the leveraged buyout since they reduce the competitiveness during the initial process
of the leveraged buyout deals.
This is again in lines with the previous finding that large firms have lower returns and
smaller firms have higher returns. GDP at the time of initial LBO has a negative
coefficient; however, GDP at the time of initial LBO should not have an influence on the
returns. From the regression results, we also see that if GDP at exit is high, then the
returns are higher. If GDP is higher than 2% at the time of the LBO then the returns are
higher. If Exit GDP is higher than 2%, then the returns are high. However, if we look at
the interaction variable between the variable “Developing” and “Exit GDP above 2%” is
much higher than the coefficient of variable “Exit GDP above 2%”. This shows that if the
exit GDP is above 2%, then the LBO of target firms in developing countries have higher
returns as compared to LBO of target firm in developed nation. The variable
“Government effectiveness” is positive; hence we interpret that if government
effectiveness is higher in a country, then the returns will be higher.
29
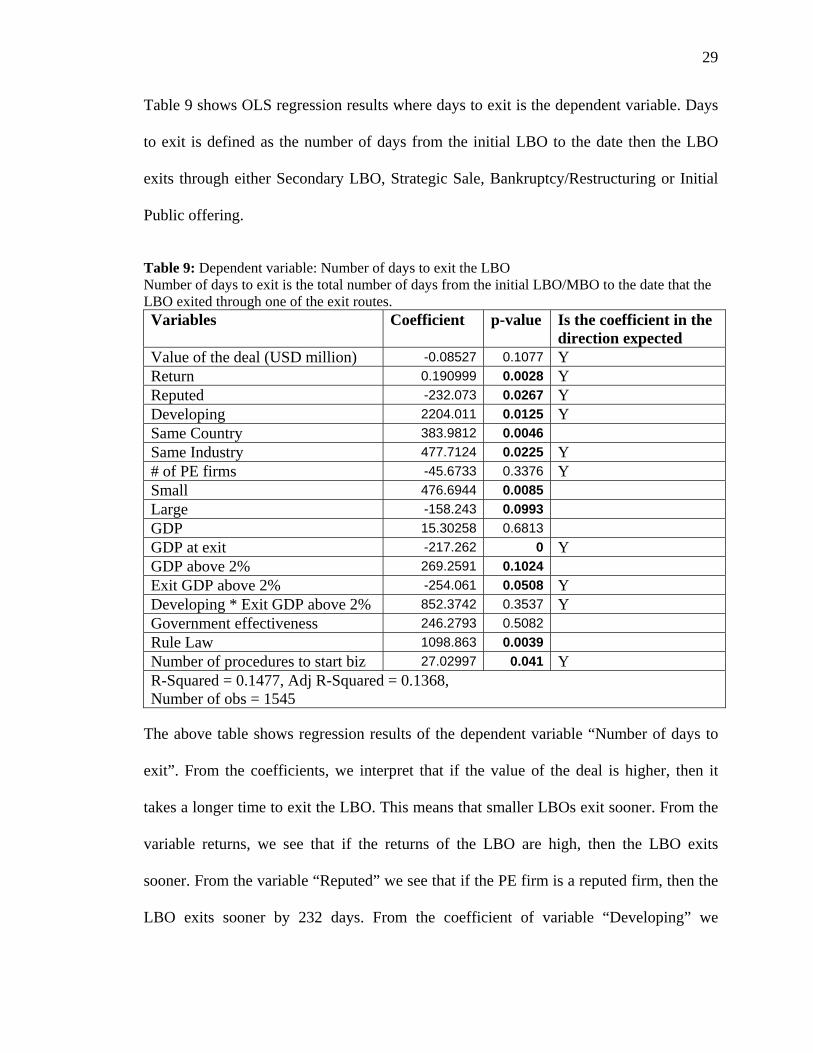
Table 9 shows OLS regression results where days to exit is the dependent variable. Days
to exit is defined as the number of days from the initial LBO to the date then the LBO
exits through either Secondary LBO, Strategic Sale, Bankruptcy/Restructuring or Initial
Public offering.
Table 9: Dependent variable: Number of days to exit the LBO Number of days to exit is the total number of days from the initial LBO/MBO to the date that the LBO exited through one of the exit routes. Variables Coefficient p-value Is the coefficient in the
direction expected Value of the deal (USD million) -0.08527 0.1077 Y Return 0.190999 0.0028 Y Reputed -232.073 0.0267 Y Developing 2204.011 0.0125 Y Same Country 383.9812 0.0046 Same Industry 477.7124 0.0225 Y # of PE firms -45.6733 0.3376 Y Small 476.6944 0.0085 Large -158.243 0.0993 GDP 15.30258 0.6813 GDP at exit -217.262 0 Y GDP above 2% 269.2591 0.1024 Exit GDP above 2% -254.061 0.0508 Y Developing * Exit GDP above 2% 852.3742 0.3537 Y Government effectiveness 246.2793 0.5082 Rule Law 1098.863 0.0039 Number of procedures to start biz 27.02997 0.041 Y R-Squared = 0.1477, Adj R-Squared = 0.1368, Number of obs = 1545
The above table shows regression results of the dependent variable “Number of days to
exit”. From the coefficients, we interpret that if the value of the deal is higher, then it
takes a longer time to exit the LBO. This means that smaller LBOs exit sooner. From the
variable returns, we see that if the returns of the LBO are high, then the LBO exits
sooner. From the variable “Reputed” we see that if the PE firm is a reputed firm, then the
LBO exits sooner by 232 days. From the coefficient of variable “Developing” we
30
interpret that if the target firm is from a developing country, then the LBO takes longer
time to exit. From the variable “Same industry” we interpret that if the target firm and the
PE firm are from the same industry, then the exit takes longer time. The reason for this is
that if the LBO is done by a reputed PE firm which is classified to be in the finance
industry, then the returns are higher due to better knowledge in the field and availability
to favorable terms on the loan due to reputation. If the “# of PE firms” is higher, then it
takes 46 days lesser to exit the LBO. This is because club deals have better negotiating
power and have greater combined experience in dealing with LBOs and their exits. The
results also show that Small firms take longer time to exit, and larger firms exit sooner.
The sign of these coefficients are not in the direction that we expected. Higher the GDP
at the time of initial LBO, longer it takes to exit. Higher GDP at the time of exit of the
LBO results in sooner exits. And if GDP at the time of initial LBO is higher than 2%, the
LBO takes longer time to exit. If exit GDP is above 2%, then the LBOs exit sooner by
254.06 days. The interaction variable between Developing and Exit GDP above 2%
shows that if the exit GDP is above 2% and if the target firm is from a developing
country, then the exit takes longer time to exit. We also see that if government
effectiveness or rule law in a target country is high, then it takes longer time to exit. If the
number of procedures required to start a business are high, then it takes longer time to
exit due to the difficulty of starting as a new entity after exit.
31
CHAPTER 6: Preliminary Conclusions
The results show that LBO targets in developed nations have higher returns and
exit sooner on average. However, when we look at LBOs in developing nations during
the period of higher GDP growth rates, we find that the LBOs have higher returns. Also,
LBOs in developing nations exit sooner when the level of GDP growth rate is higher than
the benchmark level at the time of exit. We find that reputed PE firms result in higher
returns and lesser days to exit. We also find that smaller firms have higher returns when
compared to the larger firms.
32
REFERENCES
Cem Demiroglu and Christopher M James, 2010, The role of private equity group reputation in LBO financing, JFE
Cesar Calderón and Rodrigo Fuentes, 2010, Characterizing the Business Cycles of Emerging Economies, World Bank, Policy Research Working Paper 5343
Crucini, M., Kose M. and C. Otrok 2008. “What are the driving forces of international Business Cycles?” NBER Working Paper 14380.
Cumming Douglas J and Uwe Walz, 2010, Private equity returns and disclosures around the world. Journal of international business studies 41, 727-754.
Djankov, S., R. La Porta, F. Lopez-de-Silanes, A. Shleifer, 2003. Courts. Quarterly Journal of Economics 118, 453-517. Djankov, S., C. McLiesh, A. Shleifer, 2007. Private credit in 129 countries. Journal of Financial Economics 84, 299-329. Djankov, S., R. La Porta, F. Lopez-de-Silanes, A. Shleifer, 2008. The law and economics of selfdealing. Journal of Financial Economics 88, 430–465. Djankov, S., R. La Porta, F. Lopez-de-Silanes, A. Shleifer, 2002. The regulation of entry. Quarterly journal of economics. 117. Florencio Lopez-de-Silanes, Ludovic Phalippou and Oliver Gottschalg, 2010, Giants at the gate: On the Cross-section of Private Equity Investment returns. Working paper Shourun Guo, Edith S. Hotchkiss, and Weihong Song, 2009, Do Buyouts (still) create value?, Journal of finance, Working paper. Hochberg, Yael V., Alexander Ljungqvist, and Annette Vissing-Jorgensen, 2009, Informational hold-up and performance persistence in private equity. Working paper, Northwestern University.
Hung-Chia Hsu, Adam V. Reed, and Jorg Rocholl, 2012, Competivive Effects of Private Equity Investments, American Finance Association. Working Paper
Kaplan, Steven N., and Per Stromberg, 2003, Financial Contracting Meets the Real World: An Empirical Analysis of Venture Capital Contracts, Review of Economic Studies, LXX, 281–316
Kaplan, Steven N., and Per Stromberg, 2008, Leveraged Buyouts and Private Equity, NBER working Paper 14207
33
Kaufman, D., A. Kraay and M. Mastruzzi, 2003, Governance Matters III: Governance Indicators for 1996-2002, World Bank
La Porta, R., F. Lopez-de-Silanes, A. Shleifer, R. Vishny, 1997. Legal determinants of external finance. The Journal of Finance 52. 1131-1150.
La Porta, R., F. Lopez-de-Silanes, A. Shleifer, R. Vishny, 1998. Law and finance. The Journal of Political Economy 106. 1113-1155. La Porta, R., F. Lopez-de-Silanes, A. Shleifer, R. Vishny, 2002. Investor protection and corporate valuation. The Journal of Finance 57, 1147-1170
Lerner, Josh and Antoinette Schoar 2004, the illiquidity puzzle: theory and evidence from private equity, JFE
Lerner, Josh and Antoinette Schoar 2005, Does Legal enforcement affect financial transactions? The contractual channel in private equity. Quarterly journal of economics 120, 223-246
Lerner, Josh and Antoinette Schoar, 2004, Private Equity in the Developing World: The Determinants of Transaction Structures, NBER, Working Paper
Lerner, Josh, Schoar, Antoinette and Wong, Wan, 2004, Smart Institutions, Foolish Choices?: The Limited partner Performance Puzzle, Unpublished working paper, Harward University and MIT.
Micah S Officer, Oguzhan Ozbas and Berk A. Sensoy, 2010, Club deals in leveraged buyouts, Journal of Financial Economics 98, 214-240.
Sara B. Moeller, Frederik P. Schlingemann, Rene M. Stulz, 2004, Firm size and the gains from acquisitions, Journal of Financial Economics 73 201–228 Neumeyer, P.A., and F. Perri, 2005. “Business cycles in emerging economies: the role of interest rates.” Journal of Monetary Economics 52(2), 345-380 Standard and Poors (2000) and the Internation al Finance Corporation to categorize a country as an emerging market. Strömberg, Per, 2008, The new demography of private equity, World Economic Forum: The Global Economic Impact of Private Equity Report 2008 Roger Leeds and Julie Sunderland, 2003, Private equity investing in emerging markets, Journal of applied corporate finance 15, 111–119 Ulf Axelson, Tim Jenkinson, Per Strömberg and Michael S. Weisbach, 2012, Borrow Cheap, buy high? The determinants of leverage and pricing in buyouts, Journal of Fianance, Working paper
There may be cultural factors at work also, these are separate from legal factors.. Stulz and Williamson (JFE) to see some of the culture proxies.