A STUDYOF GASTRIC ACIDITY IN INFANTS.adc.bmj.com/content/archdischild/1/4/232.full.pdftest feeds...
13
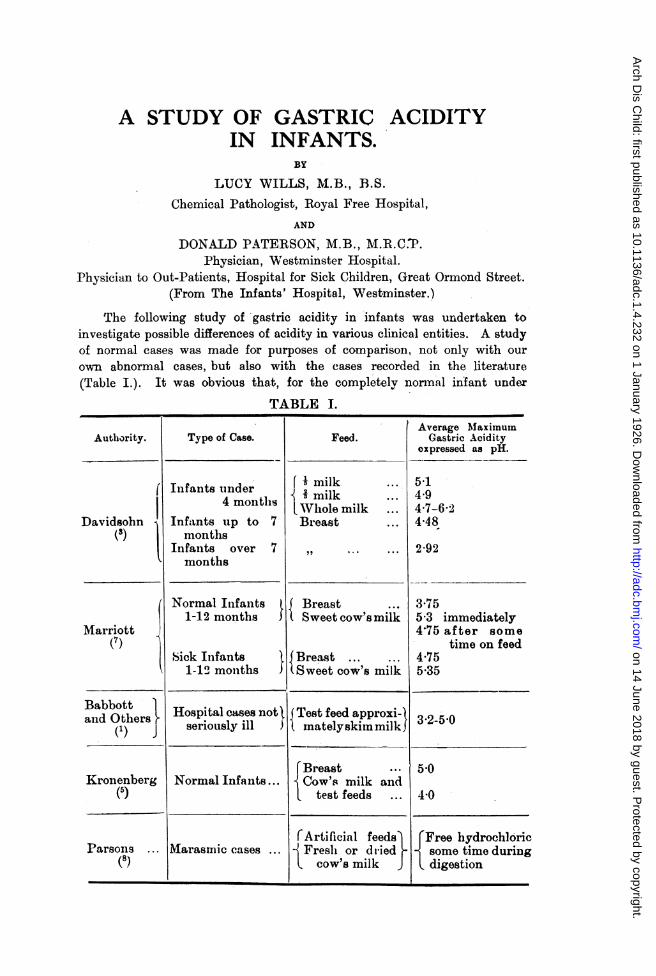
A STUDY OF IN GASTRIC ACIDITY INFANTS. BY LUCY WILLS, M.B., B.S. Chemical Pathologist, Royal Free Hospital, AND DONALD PATERSON, M.B., M.R.C.'P. Physician, Westminster Hospital. Physician to Out-Patients, Hospital for Sick Children) Great Ormond Street. (From The Infants' Hospital, Westminster.) The following study of gastric acidity in infants was undertaken to investigate possible differences of acidity in various clinical entities. A study of normal cases was made for purposes of comparison, not only with our own abnormal cases, but also with the cases recorded in the literature (Table I.). It was obvious that, for the completely normal infant undex TABLE I. Authority. Davidsohn ° l Marriott (7) Babbott and Others (1) J Kronenberg (5) Parsons ... (8) Type of Case. Infants tinder 4 months Infants up to months In1fants over months 7 7 Normal Infants 1-12 months Sick Infants 1-12' moniths } Hospital cases not I seriously ill, Normal Infants... lMarasmic cases ... Feed. 4 milk I milk Whole milk Breast Breast Sweet cow's milk Breast ... ... Sweet cow's milk Test feed approxi- matelyskimnmilkJ f Breast ... Cow's milk and test feeds CArtiricial feeds Freslh or diied cow's milk Average MIaximum Gastric Acidity expressed as pH. 51 4.9 4.7-6-2 4-48 2-92 3.75 5 3 immediately 4'75 af ter some time on feed 4.75 5.35 3 2-5 0 5*0 4-0 {Free hydrochloric some time during digestion - on 14 June 2018 by guest. Protected by copyright. http://adc.bmj.com/ Arch Dis Child: first published as 10.1136/adc.1.4.232 on 1 January 1926. Downloaded from
Transcript of A STUDYOF GASTRIC ACIDITY IN INFANTS.adc.bmj.com/content/archdischild/1/4/232.full.pdftest feeds...
A STUDY OFIN
GASTRIC ACIDITYINFANTS.
BY
LUCY WILLS, M.B., B.S.
Chemical Pathologist, Royal Free Hospital,AND
DONALD PATERSON, M.B., M.R.C.'P.Physician, Westminster Hospital.
Physician to Out-Patients, Hospital for Sick Children) Great Ormond Street.(From The Infants' Hospital, Westminster.)
The following study of gastric acidity in infants was undertaken toinvestigate possible differences of acidity in various clinical entities. A studyof normal cases was made for purposes of comparison, not only with our
own abnormal cases, but also with the cases recorded in the literature(Table I.). It was obvious that, for the completely normal infant undex
TABLE I.
Authority.
Davidsohn° l
Marriott(7)
Babbottand Others
(1) J
Kronenberg(5)
Parsons ...
(8)
Type of Case.
Infants tinder4 months
Infants up tomonths
In1fants overmonths
7
7
Normal Infants1-12 months
Sick Infants1-12' moniths }
Hospital cases not Iseriously ill,
Normal Infants...
lMarasmic cases ...
Feed.
4 milkI milkWhole milkBreast
BreastSweet cow's milk
Breast ... ...Sweet cow's milk
Test feed approxi-matelyskimnmilkJ
f Breast ...
Cow's milk and
test feeds
CArtiricial feedsFreslh or diied
cow's milk
Average MIaximumGastric Acidity
expressed as pH.
514.94.7-6-24-48
2-92
3.755 3 immediately4'75 after some
time on feed4.755.35
3 2-5 0
5*0
4-0
{Free hydrochloricsome time duringdigestion
-
on 14 June 2018 by guest. Protected by copyright.
http://adc.bmj.com
/A
rch Dis C
hild: first published as 10.1136/adc.1.4.232 on 1 January 1926. Dow
nloaded from

A STUDY OF' GASTRIC, ACIDITY IN INFANTS
7 months, our average figures of pH 2 70 for breast fed children and pH 3-5for the artificially fed, indicate much higher acidities than those recorded byother writers. Da.vidsohn(3), Mlarriott(7), and Kronenberg(5) give figures,ranging from pl 3 75 to 5-0 for normal infants up to 7 months, which wouldcorrespond to lower average acidities. Davidsohn(3), for normal breast fedinfants over 7 months old, finds an average acidity of pH 2-92, practicallythe same value as our figure for the same type under 7 months. Babbottand co-workers(1), working with a skim milk feed and using convalescent caseswhich were considered normal as far as their gastric function was concerned,found a wide range of acidity, from pH 3 2 to 543.
Further observations on underweight, but othermise normal, infantsindicated that, contrary to the usual teaching, given cornparable cases, withthe possible exception of the completelv normal, the average maximumgastric acidity is the same, regardless of the nature of the feed.
These findings are set out in full below, together with a series ofobservations on sick infants.
Before discussing the niet,hods used and the findings, a brief note on theterms used will perhaps be useful. The true acidity of a solution is themeasure of the hydrogen (H) ions present in that solution. For example,a N/'10 solution of hydrochloric acid contains 1/10 molecular weight ofHCl in gramnmes dissolved in a litre and this HCl is 910/,. dissociated at thisdiltition: the hyd(rogen ion concentration is therefore 91 x 10 -2 To avoidthe use of so many figures Scorenson introduced the exponent pH*, as theexpression of the hydrogen ion concentration, or true acidity:-for a
N/10 H-(CI solution pH equals 104. The (lisadvantage of the exronent pHis that as the acidity increases it beeomes less and vice versa, e.g., a neutralsolution has a pH: of 7 0, figures below this (pH 2-0) indicate acid solutionsand figures above (pH 80) alkaline ones. The exponent pH will be usedthroughout the following papers to express the true acidity of the solutionsunder consideration..
A " buffer " substance is one that allows the addition of an acid oralkali to a, solution without an appreciable alteration in the reaction (acidityor alkalinity) of the solution. The protein of milk is such a substance; it,so to speak, " mops up" added acid, so that till sufficient acid has beenadded to saturate the buffer, there is only a slight increase in the acidityor hydrogen ion concentration of the solution.
The titratable acidity, determiined with caustic soda, gives a measure ofthe total acidity, both free and combined. It is, therefore, an index of theacid exereted by the stomach.
The term " free hydrochloric acid " is used to denote the hydrochloricacid which is not linked to the " buffer substance " of the stomach contents,but is present in the uncoimbined condition.
*pH equals the logarithm to the ba.se 10 of the concentration of H ions in grammesper litre, the negative sign being understood.
233
on 14 June 2018 by guest. Protected by copyright.
http://adc.bmj.com
/A
rch Dis C
hild: first published as 10.1136/adc.1.4.232 on 1 January 1926. Dow
nloaded from

ARICHIVES OF I)ISEASE IN CHILDHOOD
METHODS.
No definite test meals were given, but the stomach contents wereremoved and examined after the ordinary feed. A soft rubber catheter(Jacques) was passed, generally portions of the stomach contents wereexpelled through the tube; failing this, portions were removed by -a syringe.There was generally no difficulty in obtaining samples, but if there wasexcessive salivation or retching samples were rejected.
Either the whole stomach content was removed or the fractional methodof sampling was used. Babbott(l) and Davidsohn(3) have discussed the errorsin these methods and, as in two samples taken immediatelv one after theother the differences in pH may be as great as 0 3, it is essential, if the singlesample mnethod is used, to attempt to empty the stomach. In the fra.ctionaltests, this error is recognised. F'romi a study of the curves of gastric acidity(see later), it was deci.ded that, if single samples were to be used, theymust be obtained at the height of digestion. In breast fed infants, this isat a.bout one hour, and, in the artificially fed, at about two hours. When thechildren are ill, the maximum is generally somewhat delayed. Figures in thetext refer to such samples.
The samples were strained immediatelv through gauze and then dialyzedthrough collodion sacs, according to the method of Levy, Rowntree andMarriott(6). The hydrogen ion concentration of di-lysate was determinedcoloriinetrically and expressed as pH, the indicators used being thymol blue(4 2-2 8), brom-phenol blue (3.0-.46), methyl red (4.4-630), brom thymol blue(6 0-7 6). The indicators and standard solutions were ma.de according to thedirections given by Clark and Lub(2) and were tested for us, by the hydrogenion electrode method, bv Dr. Jordon-Lloyd at the Lister Institute. Repeatedestimations were satisfactory and the error for the whole method shouldsot be more than + or - 0-2 on the final pH reading.
The samples removed were also tested for free hydrochloric acid byGunzberg's reagent, and, whenever enough was obtained, titrated with N/1osoda, phenolphthalein as indicator, to give the titratable acidity. Notes weremade as to the pre-ence or absence of curds and their size.
RESULTS.
Noriiial breast fed atnd artificially fed infants fro;m one to nine months.Ten children were studied in this group. They were normal, healthy
infants with no discoverable defect or ailment, and all had excellent activity.None were attending the hospital, nor were they inmates of infants' home;,.They did not belong to the ve.y poor strata of society, but were clean,well cared for children. Six were breast fed, three were fed on cow's milkmixtures and one fed on a dried milk mixture. The stomach contents wereexamined by the fractional mnethod and the results are shown in Table II.and Chart I. The average maximum acidity for the whole group was
234
on 14 June 2018 by guest. Protected by copyright.
http://adc.bmj.com
/A
rch Dis C
hild: first published as 10.1136/adc.1.4.232 on 1 January 1926. Dow
nloaded from

A STUDY OF GASTRIC ACIDITY IN INFANTS
TABLE II.NORMAL CHILDREN.
Feed.
Bireast
Dilute cow'snilk mixture
,,
Concentratedcow's milkmixture
Dried milkmixture
Time afterfeed thatnmaximumacidity
occurred ihours.
1
II
I
I
1.1I f
Ii
2
2
2
pH.
20
2-2
29
2-7
3.)
3-2
40
31
30
3.9
Average pH-Total..BreastArtificially f
IAcidityCC Nb10 Acid 7..
69% I
590
56%
62%
55%
vv/O
70%
49%
Free HC1Gunzberg's
Test.
+
+
0
0
0
0
+
0
... 302.
... 2-7.'ed 35.
Remarks.
Curds present
,,
Curds presentEarlier valuesnot obtained
Curds present
No curds
Very large curds
CHART I.
TIME IN IlouaRs.
Curves o! gastric acidity in 10 :.ciinal infanits agcd 1-9 montl.s
-*- BREAsT Pko --- X---#4R7rF/C/AL.LY FPD0
+ SrOt'IIACH EMPrY
Six anidAge inMIonths.
F 4
M 7
M 3iF 4
AM 3
F 1
M
AI
6.
6
F 8
F 7
.
I~~~~~~~~~~~~~~~~~~~~
235
Ti frat OA d.
I I
on 14 June 2018 by guest. Protected by copyright.
http://adc.bmj.com
/A
rch Dis C
hild: first published as 10.1136/adc.1.4.232 on 1 January 1926. Dow
nloaded from

ARCHIVES OF DISEASE IN CHILDHOO)
pH 302 and for the six breast fed infants pH 2 7. The highest acidity,pH 2 0, occurred in a breast fed child of 4 months one hour after feeding:this value did not represent pure gastric juice as curds were still present.In an infant of 1 month at 11 hours after feeding, the pH of the gastriccontents was 3 2, but as there was very little in the stomach and no curds,this figure probably represents the acidity of the gastric secretion itself.Free hydrochloric acid was present in the gastric contents of four out of thesix breast fed infants at some time during digestion, but olnly in one casewas it detected in the artificially fed children. A titratable acidity of69% N/10 acid corresponded to a pH of 2 0 in a breast fed infant and to a pHof 3 0 in an artificially fed child, showing the difference in buffering of t,hetwo feeds. Chart I. demonstra.tes the high maximum, the rapid rise in acidityand the ra,pid emptying in the breast fed and the lowered flattened curive anddelayed rise in the artificially fed. A study of more artificially fed infantswould probably show a less marked difference. In this connection eightartifieiallly fed patients that were diagnosed as normal (D.P.), though attendinghospital, may be considered. The average maximum pH was 3 5, the sameas that for the similar true normal, but one child aged 7 months on a driedmilk feed gave a, maximum pH of 2-5, a value of the same order as thoseof the breast fed normals. These eight cases showed the same delay inattaining the maximum acidity as the other artificially fed cases.
The high true acidity values (low pH's) in the breast fed are such that)eptic digestion would be active; in fact, the optimum for pepsin (aboutpH 2.3) was reached in two cases. The artificially fed infants also showedvalues in which peptic digestion would be appreciable, i.e., under pH 4 0.
Unzdecrweight children.In this group 63 children were studied. It was impossible to do a
fr(actional analysis on all of these patients, so, when this could not be done,samples were talien at approximiately two hours in the artificially fed andat approximately one hour in the case of the breast fed, and the pH ofthese samples tfaken as representing the m-iaximrnm acidity. From a studyof the curves in Clhart L., it will be seen that this method is only anapproximate one, but it is one largely used by other workers and thereforeyields comnpa,rable figures.
The infants selected, except for the fact, that they were all under weightand rmany were not gaining well, might be regarded, from the point of viewof gastric function, as normnal.
Table III. gives the average findings for the whole of this group andfor the different classes of feeds used. The ages varied from 3 weeks to1 year. The average pH of the gastric contents at the height of digestionwas 394 and the range of values found at this time 1-8 to 5-3. Freehydrochloric acid was found in 12% of the cases, but, as fractional analyseswere the exception, this figure wa.s almost certainly too low. The averagefigures for the, different feeds are extremely near together, which is surprising,in view of the current teaching on the subjeAt.
236
on 14 June 2018 by guest. Protected by copyright.
http://adc.bmj.com
/A
rch Dis C
hild: first published as 10.1136/adc.1.4.232 on 1 January 1926. Dow
nloaded from

A STUDY OF GASTRIC ACIDITY IN INFANTS
TABLE III.UNDERWEIGHT CHILDREN.
Numiiberof
Cases.Nature of Feed.
14 Breast
13 Dilute cow'smilk
imiixtures8 3 parts or
more co'v smilk to1 water
17 Dried inilkmiiixtuires
52 Mean
Age inMonths.
3-92-10
3-12
2-9
RF-12
AveragemaxinmumAcidityas pH.
41
3.93
387
3-84
3.94
Range ofRange of maximlummaximum Titratable
Acidity (p1i). Acidity0c N/I0 Acid.
214-417 16-500%2 4-5-0 28-700%
2-6-414 36-71%
18-5-3
1-8-53
28-83%
16-83%
Average maximiumiTatratable AcidityIcc N/1o Acid.
35%
44%
55%
53%
47%
Cases of persistent vowniting.This group consists of seven children who suffered from persistent and
intractable vomiting. Two had diarrhoea as well, but in the remaining fivecases this was not present. All were artificially fed. Table IV. shows
TABLE IV.CASES OF PERSISTENT VOMITING.
Dilute cow's milkmixtuire
Dried mnilk mi:
Diltite cow'sIlliXtUIte
Nestles ...
xture
mlilk
11' 5) 1ll'ite cowv's milkimlixture
F 9 Dried milk mixture
Time Titra-after tableFeed PEH. Acidityin CC NII/O
hours Acid
2 2 0 88%
21 20 92%
3 2'0 -
2
2i
11
2
2
2-2 92%
2-9 -
2-4
3 4
3-2 70%/
3-8 68%
FreeHCIGunz-berg
+
0
+
Remarks
Curds present
I .,1
,. ..
No curds
Curds present
Very ill
Curds presenit
,. ..
237
Al 3
F 3iAl 4
Al 1
5
-
I
. . .
I -A r- I T-lk I I i I I I I
I, _Il
on 14 June 2018 by guest. Protected by copyright.
http://adc.bmj.com
/A
rch Dis C
hild: first published as 10.1136/adc.1.4.232 on 1 January 1926. Dow
nloaded from

ARCHIVES OF DlSEASE IN CHILDHOOD
the result of gastric analysis in these cases. The average aciditywa.s pH 2?4, the value for titratable acidity ranaed from 68 to 92% N/10acid and free hydrochloric acid was present five times out of seven. Theyoungest child was 2 months old: gastric analyses were done on severaloccasions in this case and always gave the amazingly high acid values shownon Table IV.: at the end of three hours, curds were still present in thestomach, so that there was a markedly delayed emptying as well as a highacidity.Ill c,hildren.
The next group consists of children suffering from acute infections andseriously ill. Thirty-two ca-ses in all were studied, both by the fractionalmethod and by the single estimation method; in all 108 estimnations weremade. Table V. gives the range and average maximum findings in thegroup and the various types of cases studied.
TABLE V.ILL CHILDREN.
Numberof
Cases.
15
1 1
Disease.
InfectionsBronchitisMiddlAAar Aft--
Range ofAge in maximumMonths. Acidity
as pH.
2-9 6-6-3-3
1vluq-tLv1 ) 0X Q7U..I2 ..Aq s_n iAG94
Marasmus5 Eczema severe i-7 6-7-4-0
1 Arsenical 10 -Dernmatitis
32 Total 1 J-10 6-6-3-3
Average Range of FreeI n,~,,, " IunFbeergCImaximum 1. LrataubeAcidity Acidityas pH. CCN/lOAcid.
4-92
4-86
5'143.4
4-88
21-64%
25-80%
12-45%
68%
12-80%
G;unzberg% Cases.
0%
0%
0%
0%
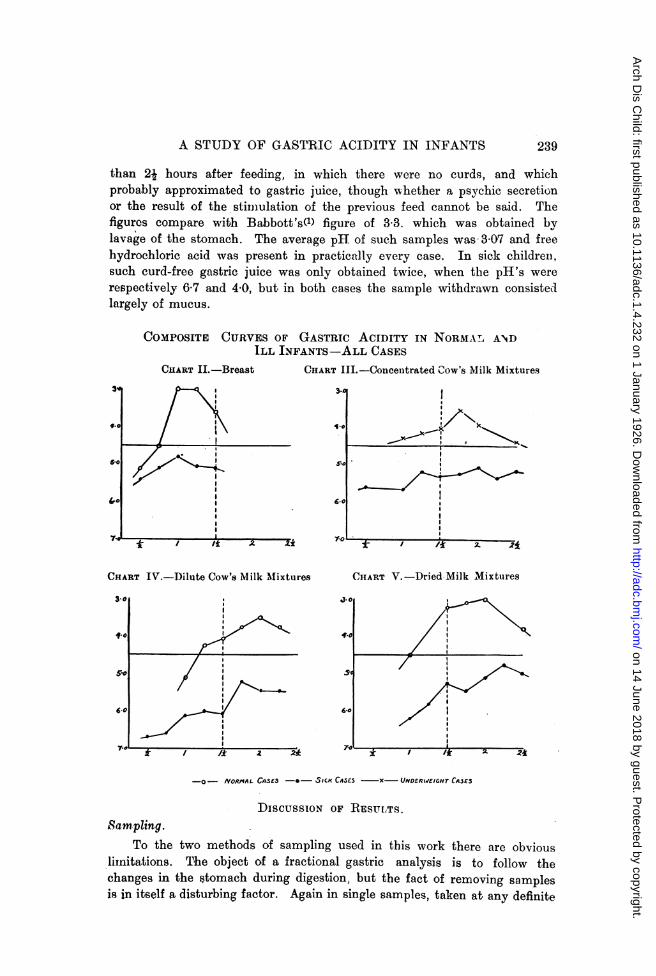
0%A study of the curves obtained by fractional analysis is of special
interest, especially when compared with the curves obtained from nornmalinfants on the same feed. Charts II., IIT., IV. and V., give the results.The most striking difference is the marked lowering of the curve of gastricacidity (expressed as pH) in the sick children; this lowering is shownrelative to every type of feed and is as striking in the brea.st fed childrenas in the artificially fed. The curves in the sick cases are also flatter thanthe corresponding normal curves. In Chart III., a composite curve fromthe values obtained in under-nourished infants fed on concentrated cow'smilk mixtures is shown instead of a curve of normal values, as it so
happened that in our series of normal infants none were fed on suchconcentrated miixtures. The titratable acidity is correspondingly low inthese sick cases and naturally gives the same flat curves.
Gastric juice.Before diLcussing the above results, it is of interest to consider the
question of the gastric secretion itself. It was not possible to obtain samplesof resting juice, but in certain cases samples were obtained, generally more
238
on 14 June 2018 by guest. Protected by copyright.
http://adc.bmj.com
/A
rch Dis C
hild: first published as 10.1136/adc.1.4.232 on 1 January 1926. Dow
nloaded from
A STUDY OF GASTRIC ACIDITY IN INFANTS 239
than 2j hours after feeding, in which there were no curds, and whichprobably approximated to gastric juice, though wvhether a psychic secretionor the result of the stimulation of the previous feed cannot be said. Thefigures compare with Babbott's(l) figure of 3 3. which was obtained bylavage of the stomach. The average pH of such samples was 3 07 and freehydrochloric acid was present in practically every case. In sick childrein.such curd-free gastric juice was only obtained twice, when the pH's wererespectively 6 7 and 4*0, but in both cases the sample withdrawn consistedllargely of mucus.
COMPOSITE CURVES OF GASTRIC ACIDITY IN NORMAL ANDILL INFANTS-ALL CASES
CHART II.-Breast CIIART III.-Concentrated Cow's Milk Mixtures
3"d
f.o
5.0
7'
1~~~~~~~~*
I P s~~~~~~~~~~~~~~~~~~~~5.0, 6.
I
*~ / * 2 E ' t T I7 ;L-/
CHART IV.-Dilute Cow's Milk MAixtures CHIART V.-Dried Milk Mixtures
3-0
41..
5'.
60
7.-0 iT / /it 2 2*
-O- NORMAL CnSES -*- SICK CASE5 -X- UNDERW/EIGHT CA3E3
DIscussIoN OF RES uLTS.Sampling.
To the two methods of sampling used in this work there are obviouslimitations. The object of a fractional gastric anal,ysis is to follow thechanges in the stomach during digestion, but the fact of removing samplesis in itself a disturbing factor. Again in single samples, taken at any definite.
%, -
III
"I-,)(
I...
i
I
OI
II
4
I
I
II
II
II
I J.
on 14 June 2018 by guest. Protected by copyright.
http://adc.bmj.com
/A
rch Dis C
hild: first published as 10.1136/adc.1.4.232 on 1 January 1926. Dow
nloaded from

ARCHIVES OF l)ISEASE IN CHILDHOOD
time, it is impossible to judge the stage of digestion reached. A study ofthe curves in Charts I. to V\. shows that samples withdrawn at one hourin the breast fed norrmial infant will represent the condition at the heightof digestion, whereas this would not be the case in the artificially fed Aslight shift in time may make a great. difference in value and also the errorin sampling, according to Babbott(l) and Davidsohn(3), may be as great aspH 03. It is therefore necessary when usinlg single samples to have alarge nuimber of cases from which to draw conclusions. Further, differentworkers have used different methods, therefore it is important beforecomnparing their results to see that the samples under discussion are reallycom-parable. Another cause of error in the samples removed is excessivesalivation and also the swallowing of mucus. Davison(4) has shown theimportance of these. In the eases recorded, those that had excessivesalivation or nausea were excluded.
In the discussion of the fraetional findings, the error in sampling isrecognised, but, as the curves are remarkably similar and when repeated onthe same case constant Table VI.), thev are of considerable interest and
T"ABLE VI.
REPEATED TEST MEALS.
Case
2 r
pHTime after feed in hours
Ii
4-1
42
_
1^;
4.44.44.3
4-1
1- 2
3-8 4*0
3-8
3-83.94-0
Empty
4II4*1
4-0
24
Emnpty
Empty
Empty
Empty
Parsons(8) has pointed out that in the majority of his cases (marasmus)free hydrochloric acid occurred at some point in the curve. In our
experience, to obtain such results it is necessary to take samples as near
together as possible, as the rise and fall may be very rapid.
240
on 14 June 2018 by guest. Protected by copyright.
http://adc.bmj.com
/A
rch Dis C
hild: first published as 10.1136/adc.1.4.232 on 1 January 1926. Dow
nloaded from

A STUDY OF GASTRIC ACIDITY IN INFANTS
Nornmal values.The cases recorded as normals would, in the light of our work, appear
rather as subnormals. Babbot.t and his co-worlkers(1) recognise that theircases are not completely well, but assunme that the gastric function is notaffected. The grou,p of normal children in our series shows the differencebetween the really active hea.lthy infant and these subnormal hospitalisedcases. Especially is this remarkable in the breast fed infant, where theaverage maximum acidity figure is pH 2 7. Comparing this withDavidsohn's(3) figure for breast fed children over 7 rrmonths (pH 2-92). itis seen to agree closely, but the six cases studied by us were all under8 months, one only was 7 months, the remaining five being aged 1, 3, 3S, 4and 4 months respectively. The mnaximum in the child aged 1 month was3o2, this probably representing pure gastric juice. The shape of the curvesis also remarkable. The steep rise and rapid emptying should be particularlynoted.
From a consideration of these figures it is obvious that there is agreater opportunity for peptic digestion in the healthy infant's stomach thanis generally thought, since pepsin is half active at pH 40 and fully activeant pH 2-3, a value often reached in the breast fed infant. Further, in thesenormal breast fed cases, the stoma.ch is empty at 11 hours, so that on athree-hourly feed there is usually a resting period of 1-1 hours before thenext feed. The few normals on artificial feeds do not give such high curves,but they are too few to permit conclusions t.o be drawn from them. Whatshould be remarked, however, is the delay in reaching the maximum.
The group of underweight children mentioned above corresponds tomany of the normals of the literature, i.e., these are subnormal children.Our findings (Table III.) a-re somewhat higher than those of most otherworkers, though Marriott's(7) figuire of pH 3 75 for well breast fed childrenindica.t.es a slightly higher average acidity. The fa.ct that he nbtainedsamples two ho'ars after feeding in brea.st fed children suggests that thesewere not cormlpletely normal as in such the stomach would generallv beempty a.t such a time (see Chart I.), but are hospitalised, i.e., subnormalcases.
Another point in which the present. series differs from those in literatureis the similarity of the average pH on different feeds, provided the childrenare accustomed to the feed. Mlarriott(7) remarks on the increased gastricsecretion to meet the need when the child is kept on a high buffer feed,but does not think that complete compensation takes place. However, ast.udy of Table III. would suggest that in a series of comparable cases thepH approximates closely regardless of the nature of the feed. The valueof each feed expresse1 as ounces of cow's milk wa.s worked out for all theartificially fed infants, but no connection between either the concentrationor absolute quantity of protein and pH could be determined, provided the
241
on 14 June 2018 by guest. Protected by copyright.
http://adc.bmj.com
/A
rch Dis C
hild: first published as 10.1136/adc.1.4.232 on 1 January 1926. Dow
nloaded from

ARCHIVES OF DISEASE IN CHILDHOOD
clhild had been on the same feed for some little time. A study of thctitratable acidity that corresponds to the low pH values shows, what isobvious from theoretical considerations, tfhe great increase in output of acidnecessary to bring an artificial feed with a high buffer value to the samepH as a breast fed maximum (see Tables).
In the absolutely normal series there are not enough artificially fedcases to say whether the same would hold or not. However, the dela,y inobtaining the maximum will assumedly remain, as in no artificially fedinfant was the maximum acidity found as early as one hour after feeding.
That it is the condition of the child rather than the nature of the feedthat is of importance in determining the pH is indicated by observationson certain ill children who became progressively either better or worse whileunder observation. In those that went down hill, the acidity steadilydecreased, while the converse occurred when the child made a steadyrecoverv.
SICK INFANTS.V'omniting children.
The series of children described showvs the very high acidity associatedwith this condition. The cases were selected by one of us (D.P.) as beingtypical vomiters, though he was in complete ignorance of the values obtained(L. WV.). One case, a female aged 2 months, suggests that these highacidities may be associated with pyloric spasm (cf. Parsons(8)), as thestomach was not empty at the end of three hours, and the titratable aciditywas very high, 92% N/10 acid. It is not suggested that the acidity isthe cause of the spasm; more likely it is the result (cf. adult cases). Thiswas the only series of ill children examined that gave a high averagemaximum acidity. Davidsohn(3), in his work on the child suffering from theexudative diathesis (symptoms mentioned, vomiting and diarrhexa) mentionsthe high values obtained (up to 2 0). Davison(4) states that vomitingincreases the acidity.
Children suffering from infection 3, extreme degrees of marasmus, etc.
The figures agree with those of other authors. Marriott(7), Ylppb(9),etc., state that the gastric acidity is lowered. This is marked in bronchitisand sim-ilar infections though the eczema cases (all severe cases) actually gavea lower average acidity, and it is associated with increased mucus in thestomach contents. The curnes of all feeds are not only lower but remarkablyflattened (see Charts II., III., IV. and V.).
GENERAL, DiscusSION.
The study reported above indicates that gastric acidity in active healthychildren, particularly in the breast fed, is such that active peptic digestionould take place. Free hydrochloric acid which corresponds to an acidity at
242
on 14 June 2018 by guest. Protected by copyright.
http://adc.bmj.com
/A
rch Dis C
hild: first published as 10.1136/adc.1.4.232 on 1 January 1926. Dow
nloaded from

A STUDY OF GASTRIC ACIDITY IN INFANTS
which peptic activity is at its maximum is frequently present at some stageof digestion: this is in agreement with Parsons'(8) findings in marasmicchildren. The average pH is lower, i.e., acidity is greater, than is normallytaught, if conclusions can be drawn from so few cases. Artificial feedingcauses a delay in the maximum rise, apparently even when the buffer valueof fee(d is approximately that of breast milk (1 part of milk to 2 of water).If the group of subnormal cases is considered, it is seen that compensationtakes place to a very marked degree, so that, whatever the feed, the averagemaxinuiim pH is the same. Similarly, the lowering of gastric acidity thattalkes place in ill childlren, except in uncomplicated cases of vomiting, isa general process and not related to one particular food. In fa.ct, in infantsas in adults, hbigh and low acidity seem more closely related to the generalcondition (high acidity and good activity, low acidity and poor activity)than with the type of food or disease.
Iote oti the cliiCic(l )a)lication of rcsultqs.The striking difference in emptying time shown by breast fed and
artificially fed infants is of significance in regard to the question of spacinginfants' feedls. The stomaeh of a breast fed child is generally empty in 1-lhours: three-hourly feeds would, therefore, insure adequate emptying andopportunity for rest in such infants. However, in the artificially fed.whatever the nature of the, feed, the stomach is not emptv for two hours ormore after feeding: hence, to insure complete emptying and a certain amountof gastric rest, a longer interval is necessary. Four-hourly feeds would,therefore, appear more rational (other things being equal) in the artificiallyfed child than in the infant on the breast.
Seven cases of persistent vomiting have been reported above; in alldefinite hyperacidity was demronstrated. The type of child investigatedis one who, almost from birth, tends to vomit persistently. There may beno loss of weight, provided that an adequate amount of food is offered.Obstiniate constipation is not present and diarrhbea is not the rule, whichex(lludes pyloric stenosis on the one hand, and gastro-enteritis on the other.The vomit is sour with large curds and appreciable quantities may bereturned. This type of case corresponds closely to that described by pertainclinicians as " pyloric spasm," and they muist be distinguished from cases ofvomiting due to air swvallowing caused by bad feeding. Clinically, theyhave been found to do best on small concentrated thickened feeds. It maybe that the success of this therapy is partly due to the high buffer, i.e., hi,ghpercentage of protein of the feed, but more likelv is due to the mechanicaleffect of the thickened feed. Since in most vomiting children the feed islessened or weakened, the recognition of this type of case is of great practicalimportance.
Children suffering from an infection, or seriouslv ill, have been shownto have a low gastric acidity. Whatever feed these children are given, theyseem quite unable to raise their gaistric acidity to that point at which peptic
E
243
on 14 June 2018 by guest. Protected by copyright.
http://adc.bmj.com
/A
rch Dis C
hild: first published as 10.1136/adc.1.4.232 on 1 January 1926. Dow
nloaded from
244 ARCHIVES OF DISEASE IN CHILDHOOD
dligestion is appreciable. This appears to us to be a very definite indicationfor acid feeds in such conditions. The addition of lactic. or hydrochloriv.acid to the milk brings the stomach contents up to an acidity where peptivdigestion can take place. Peptonising the milk would also ci'cumvent this,but has not proved so practicable.
SUMMARY.
1. Normal healthy infants under one year have an average maximumgastric acidity of pH 3-02 for all feeds. Breast fed infants have a higheracidity, i.e., 2 7, and in most cases those over one rronth o-ld show freehydrochloric acid at some time during digestion.
2. The pH of 2-7 is such that active peptic digestion could take place:3. The gastric emptying time in breast fed infants is more rapid than
in the artificially fed.4. Slightly underweight children ha-ve a lower acidity than true normals,
though there is no obvious gastric defect. The average pH is nearly thesame for the different feeds, indicating a comiipensatory increased gastricsecretion, where infants are<V!d on high buffer feeds.
5. Infants suffering from persistent vomiting (not ruminatcrso levea high gast,ric acidity.
6. Ill children have a lowered gastric acidity.7. The gastric findings in infants, as in adults, seem more closely
associated with the general condition of the child than with arny particularfeed or disease.
Wre are indebted to Dr. Eric Pritchard, Director of the Hospital, forpermission to work in the Research Laboratory and to the Medical ResearchCouncil which paid the expenses of this work.
REFERENCES.
1. Babbott, F. L., Johnston, J. A., Haskins, C. H., and Shohl, A. T., Am. J. Dis. Ch.,Chicago, 1923, XXVI, 475-486.
2. Clark, W. M., The Determination of Hydrogen Ions, Baltimore, 1922, 99.3. Davidsohn H., Arch. f. Kinderheilk, Stuttg., 1921, LXIX, 142 and 239.4. Davison, W. C., Am. J. Dis. Ch., Chicago, 1925, XXX, 22.5. Kronenberg, R., Jahrb. fur. Kinderheilk, Berlin, 1915, LXXXII, 401.6. Levy, R. L., Rowntree, L. G., and Marriott, W. McK., Arch. Int. Med., Chicago,
1915, XVI, 389.7. Marriott, W. McK., and Davidson, L. T., .4m. J. Dis. Ch., Chicago, 1923, XXVI,
542.
8. Parsols, L., Lancet, 1924, I, 797.9. Ylppii, A., Acta Pediatrica, Stockholm. 1924, IIT, 101
on 14 June 2018 by guest. Protected by copyright.
http://adc.bmj.com
/A
rch Dis C
hild: first published as 10.1136/adc.1.4.232 on 1 January 1926. Dow
nloaded from