A STUDY OF UMTS TERRESTRIAL RADIO ACCESS...
80
Helsinki University of Technology Communications Laboratory Technical Report T49 Teknillinen korkeakoulu Tietoliikennelaboratorio Raportti T49 Espoo 2003 A STUDY OF UMTS TERRESTRIAL RADIO ACCESS PERFORMANCE Harri Holma Dissertation for the degree of Doctor of Technology to be presented with due permission for public examination and debate in Auditorium S1 at Helsinki University of Technology (Espoo, Finland) on the 24rd of October, 2003, at 12 o’clock noon. Helsinki University of Technology Department of Electrical and Communications Engineering Communications Laboratory Teknillinen korkeakoulu Sähkö- ja tietoliikennetekniikan osasto Tietoliikennelaboratorio
Transcript of A STUDY OF UMTS TERRESTRIAL RADIO ACCESS...

Helsinki University of Technology Communications Laboratory Technical Report T49 Teknillinen korkeakoulu Tietoliikennelaboratorio Raportti T49
Espoo 2003
A STUDY OF UMTS TERRESTRIAL RADIO ACCESS PERFORMANCE
Harri Holma
Dissertation for the degree of Doctor of Technology to be presented with due permission for public examination and debate in Auditorium S1 at Helsinki University of Technology (Espoo, Finland) on the 24rd of October, 2003, at 12 o’clock noon. Helsinki University of Technology Department of Electrical and Communications Engineering Communications Laboratory Teknillinen korkeakoulu Sähkö- ja tietoliikennetekniikan osasto Tietoliikennelaboratorio

Distributor: Helsinki University of Technology Communications Laboratory P.O. Box 3000 FIN-02015 HUT Tel. +358-9-451 2366 Fax +358-9-451 2345 © Harri Holma ISBN 951-22-6715-2 (printed) ISBN 951-22-6718-7 (electronic) ISSN 0356-5087 Oy Edita Ab Helsinki 2003

3
Holma, Harri. A Study of UMTS Terrestrial Radio Access Performance Keywords: Wideband code division multiple access (WCDMA), radio network simulations, capacity, multiuser detection, antenna diversity
ABSTRACT This thesis considers the performance evaluation of third generation radio networks, in particular UMTS Terrestrial Radio Access (UTRA). First, the performance evaluation methods are presented. The typical capacity of UTRA is estimated using those methods and a few solutions are evaluated to improve the capacity and coverage. The thesis further studies the effect of base station synchronization on the performance of UTRA time division duplex mode. The performance evaluation is based on the combination of theoretical calculations, link and system level simulations, and laboratory and field measurements. It is shown that these different evaluation methods give similar results and – when combined together – they can be used for the radio network development purposes. The simulation results indicate that the typical WCDMA, i.e. UTRA frequency division duplex mode, macro cell capacity is between 600 and 1000 kbps per sector per 5 MHz. The capacity is sensitive to the environment and to the transceiver performance. The results further show that user bit rates up to 2 Mbps can be provided locally for packet data with the basic Rake receiver, but not for full coverage circuit switched connections in macro cells. The following performance enhancement techniques are evaluated in this thesis: soft combining of packet retransmissions, base station multiuser detection and 4-branch base station receiver diversity. The link level simulations show that soft combining can provide a gain up to 2.0 dB, which can be used to increase the capacity up to 60%. The performance of base station multiuser detection is evaluated with link and system level simulations. It is shown that the studied sub-optimal multiuser detector is able to remove 60–70% of the intra-cell interference. That gain can be utilized to improve the uplink capacity by 50–100% or the coverage by 1–2 dB. The performance of 4-branch antenna diversity is evaluated in the simulations and in the field measurements. The results show that the average coverage gain of 4-branch diversity with two separate cross-polarized antennas is 3 dB compared to 2-branch diversity with one cross-polarized antenna. The synchronization requirements of UTRA time division duplex base stations are studied with system simulations. The results show that synchronization is a key requirement for time division duplex operation, especially for the uplink performance. The study indicates that co-location of different operators’ base stations is feasible in time division duplex operation only if the two networks are synchronized and if an identical split between uplink and downlink is used.

5
PREFACE I would like to express my gratitude to my supervisor, Professor Sven-Gustav Häggman, for his guidance during my post-graduate studies at Helsinki University of Technology and during the preparation of this thesis. The research work of this thesis has been done with Nokia Research Center and with Nokia Networks between 1994 and 2001. I would like to acknowledge all my Nokia colleagues that I have had pleasure to work with during those years. We have been able to explore new and interesting aspects of future mobile communications together. In particular, I would like to thank Lauri Oksanen and Peter Muszynski from Nokia Networks for guiding the research work and for the excellent support. I would also like to thank colleagues from the other companies and from the universities for the fruitful discussions in the area of this thesis, especially Dr. Jonathan Moss from UK. I am grateful to my wife, Mari, and to our daughter, Eevi, for their patience during the final editing phase of this thesis. Helsinki, Finland September 2003 Harri Holma


7
CONTENTS ABSTRACT .........................................................................................................................3
PREFACE............................................................................................................................5
CONTENTS .........................................................................................................................7
LIST OF PUBLICATIONS.....................................................................................................9
SYMBOLS .........................................................................................................................11
ABBREVIATIONS ..............................................................................................................13
1 INTRODUCTION...........................................................................................................15 1.1 Background and Problem Definition...............................................................15 1.2 Scope and Objectives ......................................................................................15 1.3 Review of Previous Work................................................................................17 1.4 Original Contributions.....................................................................................18 1.5 Author’s Contributions of Joint Publications ..................................................19 1.6 Thesis Outline..................................................................................................20
2 SIMULATION AND MEASUREMENT METHODS ...........................................................23 2.1 Dynamic System Level and Link Level Simulations ......................................23 2.2 Static and Dynamic System Level Simulations...............................................23 2.3 Interface Between Link and System Level Simulations..................................25 2.4 Measurement Methods ....................................................................................31
3 SYSTEM MODELS AND THEORETICAL ANALYSIS......................................................33 3.1 Link Level Modelling......................................................................................33 3.2 System Level Modelling..................................................................................34 3.3 Theoretical Analysis........................................................................................34
4 ACHIEVED RESULTS ...................................................................................................37 4.1 Evaluation of Basic UTRA FDD Performance ...............................................37 4.2 Evaluation of UTRA FDD Performance Enhancements .................................47 4.3 Evaluation of UTRA TDD Interference ..........................................................63
5 CONCLUSIONS.............................................................................................................71
6 MAIN CONTENTS AND CONTRIBUTIONS OF THE PUBLICATIONS ..............................73
ERRATA ...........................................................................................................................76
REFERENCES ...................................................................................................................77

9
LIST OF PUBLICATIONS
The thesis consists of the summary part and the following publications [P1-P13]: three journal papers and ten conference papers. [P1] Westman, T. and Holma, H. “CDMA System for UMTS High Bit Rate Services”,
IEEE Vehicular Technology Conference VTC’97, Phoenix, Arizona, May 4–7, 1997, in proceedings pp. 825–829.
[P2] Pehkonen, K., Holma, H., Keskitalo, I., Nikula, E. and Westman, T. “A Performance Analysis of TDMA and CDMA Based Air Interface Solutions for UMTS High Bit Rate Services”, IEEE International Symposium on Personal, Indoor and Mobile Radio Conference PIMRC’97, Helsinki, September 1–4, 1997, in proceedings pp. 22–26.
[P3] Hämäläinen, S., Holma, H., Toskala, A. and Laukkanen, M. “Analysis of CDMA Downlink Capacity Enhancements”, IEEE International Symposium on Personal, Indoor and Mobile Radio Conference PIMRC’97, Helsinki, September 1–4, 1997, in proceedings pp. 241–245.
[P4] Hämäläinen, S., Slanina, P., Hartman, M., Lappeteläinen, A. and Holma, H. “A Novel Interface Between Link and System Level Simulations”, ACTS Mobile Telecommunications Summit’97, Aalborg, Denmark, October 7–10, 1997, in proceedings pp. 599–604.
[P5] Toskala, A., Hämäläinen, S. and Holma, H. “Link and System Level Performance of Multiuser Detection CDMA Uplink”, Wireless Personal Communications, Issue 8, Kluwer Academic Publisher, 1998, pp. 301–320.
[P6] Holma, H., Toskala, A. and Latva-aho, M., “Asynchronous Wideband CDMA for IMT-2000”, Telecommunications Review, SK Telecom Co., Ltd, Vol. 8, No. 6, 1998, pp. 1007–1021.
[P7] Raitola, M. and Holma, H. “Wideband CDMA Packet Data with Hybrid ARQ”, IEEE International Symposium on Spread Spectrum Techniques & Applications ISSSTA'98, Sun City, South Africa, September 2–4, 1998, in proceedings pp. 318–322.
[P8] Holma, H. and Heiska, K. “Performance of High Bit Rates With WCDMA Over Multipath Channels”, IEEE Vehicular Technology Conference VTC’99 Spring, Houston, USA, May 16-20, 1999, in proceedings pp. 25–29.
[P9] Hämäläinen, S., Holma, H. and Sipilä, K. “Advanced WCDMA Radio Network Simulator”, IEEE International Symposium on Personal, Indoor and Mobile Radio Conference PIMRC'99, Osaka, Japan, September 12–15, 1999, in proceedings pp. 951–955.
[P10] Holma, H., Lehtinen, O., Toskala, A. and Heikkinen, S., “Time Division Duplex Mode of UMTS Terrestrial Access”, IEEE Journal on Selected Areas on Communications, Special issue on Wideband CDMA, Volume: 18 Issue: 8, Aug. 2000, pp. 1386–1393.
[P11] Tölli, A. and Holma, H. “Comparison of WCDMA Uplink Antenna Solutions with 4 Receiver Branches”, CDMA International Conference (CIC), South Korea, October 25–28, 2000, in proceedings pp. 57–61.

10
[P12] Holma, H. and Tölli A. “Simulated and Measured Performance of 4-branch Uplink Reception in WCDMA”, IEEE Vehicular Technology Conference VTC'2001 Spring, Greece, May 6–9, 2001, in proceedings pp. 2640–2644.
[P13] Holma, H., Soldani, D. and Sipilä, K. “Simulated and Measured WCDMA Uplink Performance”, IEEE Vehicular Technology Conference VTC'2001 Fall, Atlantic City, NJ, USA, October 7–11, 2001, in proceedings pp. 1148–1152.

11
SYMBOLS αerror Synchronization error in time slots between two TDD transmissions αj Downlink orthogonality of jth user after the multipath channel β Efficiency of multiuser detection C/I Carrier power-to-interference ratio Eb/N0 Energy per user bit divided by noise spectral density i Other-cell to own-cell interference ratio Itotal Total received wideband interference power Iown Total received wideband interference power from the own cell K Number of simultaneous users per cell KRAKE Number of simultaneous users per cell with Rake receiver KMUD Number of simultaneous users per cell with multiuser detection receiver L Number of multipath components M Capacity of TDD cell with inter-cell interference M0 Capacity of TDD cell without inter-cell interference ηUL Uplink load factor ηDL Downlink load factor N0 Thermal noise power ∆r Reduction of the cell range Rj Bit rate of jth user SIR Signal-to-interference ratio SIRframe Signal-to-interference ratio averaged over 10-ms frame SIRi Signal-to-interference ratio averaged over 0.667-ms slot tslot Length of time slot toffset Offset between two transmission timings υj Voice activity of jth user W Chip rate, 3.84 Mcps in WCDMA


13
ABBREVIATIONS 3GPP Third generation partnership project AVI Actual value interface AWGN Additive white Gaussian noise BER Bit error rate BLER Block error rate BTS Base station CDMA Code division multiple access ETSI European telecommunications standards institute EV-DO cdma2000 evolution, data only FDD Frequency division duplex FER Frame error rate GPS Global positioning system GSM Global system for mobile communication HSDPA High speed downlink packet access ITU International telecommunication union Mcps Megachips per second MHz Megahertz MUD Multiuser detection MS Mobile station PC Power control RF Radio frequency RRC Radio resource control RRM Radio resource management SIR Signal to interference ratio TD/CDMA Time division code division multiple access TDD Time division duplex TX Transmission UE User equipment, mobile station UMTS Universal mobile telecommunication system UTRA UMTS Terrestrial radio access WCDMA Wideband code division multiple access


Introduction 15
1 INTRODUCTION
1.1 Background and Problem Definition Analog cellular systems are commonly referred to as first generation systems. The current digital systems, such as GSM, are the second generation systems. These digital systems have made voice communications go wireless in many of the leading market areas, and customers are finding value also in other services such as text messaging, multimedia pictures, video clips, ringing tones and access to data networks and corporate intranets. Third generation systems are designed to make a large set of new services to go wireless as well. These systems make new attractive services possible for the customers, and can provide new sources of revenues for the operators. These systems are also designed to deliver high bit rates and high capacities. Performance evaluation is needed to develop and operate these new radio systems efficiently. An accurate evaluation of the radio network performance helps in the first place to develop a new system. The selection of the technical solution in the standardization forums and in the manufacturers’ development teams is based on the performance comparisons. The performance evaluation is also required when the operators dimension their networks, i.e., when they estimate the amount of needed network investments, and when they further proceed to the detailed capacity and coverage planning which includes the base station site locations and network element configurations. Once the networks are running, the performance evaluation is required for optimising the existing network to deliver the maximum performance with the given investment. The performance evaluation is needed in every phase of the system development and operation, and it is a continuous feedback loop to improve the radio system performance. This loop is depicted in Figure 1.
Performance evaluationPerformance evaluation
StandardizationStandardization DimensioningDimensioning Capacity andcoverage planning
Capacity andcoverage planning OptimizationOptimization
Figure 1. The feedback loop between system development and performance evaluation
1.2 Scope and Objectives This thesis considers the evaluation of the air interface performance of UMTS Terrestrial Radio Access, UTRA. The first target of the thesis is to present the performance evaluation methods including theoretical calculations, simulations, and laboratory and field measurements. The second target is to obtain performance estimates of UTRA networks, and the third target to evaluate performance enhancement techniques. The targets of the thesis are presented in Figure 2.

16 A Study of UMTS Terrestrial Radio Access Performance
Performance evaluationmethods• theoretical calculations• simulations• laboratory measurements• field measurements
Performance evaluationmethods• theoretical calculations• simulations• laboratory measurements• field measurements
Basic UTRA performanceevaluation
Basic UTRA performanceevaluation
UTRA performance
improvements
UTRA performance
improvements
Figure 2. Targets of the thesis
The objective of the basic performance evaluation part is to estimate the typical spectral efficiency of UTRA Frequency division duplex, FDD, mode. UTRA FDD is referred to as wideband code division multiple access, WCDMA, in this thesis. The spectral efficiency is estimated in terms of the aggregate throughput in kbps per sector per carrier. The basic performance evaluation includes also the link level performance of high bit rates up to 2 Mbps. The performance enhancement part considers the effect of the soft combining of packet retransmissions, base station multiuser detection and base station 4-branch receiver diversity. The capacity of UTRA FDD networks can be enhanced also with UTRA Time division duplex, TDD, mode. The UTRA TDD part of the thesis evaluates one of the main differences between FDD and TDD – interference between uplink and downlink in TDD, and the related base station synchronization requirements. The objectives of the thesis are summarized in Figure 3.
Maximum capacity kbps/sector/carrier
Performanceof 2 Mbps
Base station performance improvements with baseband multiuser detection and with
antenna solutions
Soft combiningfor packet data
TDD: Interference between downlink and
uplink
Link level performance analysis
Figure 3. Objectives of the performance evaluation

Introduction 17
The performance evaluation can be done on several levels from the receiver algorithms and link level evaluation to the radio network performance evaluation with several base stations. The link level analysis concentrates on the performance of one radio link between a mobile station and a base station. The network level analysis concentrates on the performance of several base stations and all the mobiles that are simultaneously connected to those base stations. All those parts of the performance evaluation are included in this work. A complete performance evaluation requires also higher layer analysis, including radio resource management functionalities and protocols. The higher layers are not within the scope of this work. The scope is presented in Figure 4.
Receiver algorithmsReceiver algorithms
Link level analysisLink level analysis
Radio network level physical layer analysisRadio network level
physical layer analysis
Higher layer analysisHigher layer analysis
Scope of this thesis
Figure 4. Scope of the thesis
1.3 Review of Previous Work An extensive and analytical performance evaluation for CDMA has been presented in [1]. That reference includes both link level and system level analysis with coverage and capacity calculations. The reference [1] concentrates mainly on the narrowband CDMA and on the voice service, and further work is needed for third generation wideband CDMA systems. The main WCDMA network vendors have presented analytical and simulation approaches for UTRA performance evaluation. The first combined effort of the European companies was done within ETSI 1998 and the results are presented in [2]. Nokia’s performance evaluation work has been summarized mainly in [3 and 4]. Ericsson has presented the WCDMA downlink capacity estimation in [5] and the effect of smart antennas in [6]. Field measurements by Ericsson are introduced in [7]. Motorola has performed system performance analysis and simulations whose results are presented in [8, 9 and 10]. Siemens has concentrated in particular on UTRA TDD system and its evaluation [11]. UTRA TDD field measurements are presented in [12]. Also, major wireless operators have presented WCDMA performance evaluation results, for example, Vodafone has shown their analysis and simulations in [13] and Orange field measurements in [14]. More performance evaluation results are expected

18 A Study of UMTS Terrestrial Radio Access Performance
to be published in the near future since the first commercial WCDMA networks have been opened during early 2003 and more launches will follow during 2003. The performance enhancements, including multiuser detection and smart antennas, have been extensively studied in the wireless research community. The multiuser detection has been considered in the following theses for WCDMA [15, 16, 17 and 18] and for UTRA TDD in [19 and 20]. The combination of multiuser detection and antenna diversity is evaluated in [21]. The performance of advanced antenna structures in WCDMA has been studied in [22]. The reference [22] considers also the combining of the link and system level simulations. UTRA TDD system can experience interference between uplink and downlink signals. This aspect has received only little attention in the research work so far, one of the few reference is [23]. The interest in third generation TDD systems emerged mainly after the UMTS system selection in ETSI 1998 and even since then the main interest has been on the FDD systems. This thesis concentrates in particular on developing most suitable performance evaluation methods for the third generation systems. It combines the different evaluation approaches from calculations and simulations to measurements to obtain reliable results. This thesis targets to give a realistic performance estimate of the UTRA system and its performance enhancements. The included papers of this thesis have been published during 1997–2001.
1.4 Original Contributions The thesis includes the following original contributions. 1.4.1 Interfacing Link and System Level Simulators The performance evaluation of a cellular system is typically done in two kinds of simulators: link and system level. The interface between these two tools need to be properly defined in order to develop real time radio resource management algorithms and to obtain accurate capacity results from the system level tool. The interface developed in [P4, P9] allows accurate modelling of the receiver performance in the system level simulator with fast fading, fast power control and with varying interference from short packets. The accuracy is obtained by taking the variances of the signal and the interference into account in the interface. The traditional interface uses the average values and does not take the variance of the signal-to-interference ratio into account. 1.4.2 WCDMA Link Level Measurements The WCDMA link level performance is measured in the laboratory and compared to the simulations in [P13]. The measurements evaluate the effect of mobile speed, multipath propagation and base station antenna diversity. Measurements with narrowband CDMA were widely available but the published WCDMA measurements were scarce during the publication of this paper.

Introduction 19
1.4.3 High Bit Rate Performance Analysis The performance of high bit rates requires special attention in cdma based systems because the processing gain gets low and part of the interference resistance of cdma signal is lost. The link performance of high bit rates is sensitive to the inter-path interference that is caused by multipath propagation. The link level performance is simulated in [P8]. The other challenge in providing high bit rates is the capacity. The capacity of the high bit rate services is presented in [P2]. These performance challenges can be tackled with advanced packet data retransmission and power control techniques that are evaluated in [P7] and with advanced mobile receiver algorithms that are evaluated in [P3]. 1.4.4 Link and System Level Performance Analysis of Multiuser Detection The performance of the cellular system can be improved with advanced baseband processing in the receiver. These techniques can be used to reduce the interference between the users communicating on the same frequency in WCDMA. This approach is called multiuser detection. The performance of multiuser detection is evaluated analytically and in the link level and in the system level simulations in [P5]. The performance evaluation considers realistic signal-to-noise ratios, channel estimation algorithms in the receiver and realistic assumptions for the interference levels in the system level. The coverage and capacity gains are estimated analytically based on the simulation results. The main theoretical contributions of this thesis can be found in the area of multiuser detection. 1.4.5 Evaluation of Base Station Antenna Concepts for Improving Coverage The base station antenna techniques can be used to improve the coverage of the cell: a weaker signal from the mobile can be detected by the base station that utilizes these antenna concepts. The performance of three different antenna solutions, each with 4-branch reception, is evaluated in the WCDMA link level simulations in [P11], and one configuration in more detail in the WCDMA field measurements in [P12]. 1.4.6 Interference Evaluation of Time Division Duplex Mode, TDD UTRA consists of two modes: Frequency Division Duplex, FDD, and Time Division Duplex, TDD. In TDD the uplink and downlink directions use the same frequency and these two signals can interfere each other. The interference between uplink and downlink is evaluated by system simulations in [P10]. Synchronization and coordination requirements of UTRA TDD are evaluated based on the results.
1.5 Author’s Contributions of Joint Publications [P1] The author has run the uplink simulations and the uplink analysis in this paper. [P2] The author has contributed to the CDMA system design, simulated the CDMA uplink performance and contributed to the analysis of the results.

20 A Study of UMTS Terrestrial Radio Access Performance
[P3] The author has contributed to the definition of the simulation cases and to the analysis of the results. The system simulations are done by Hämäläinen. [P4] The author has validated the performance of the actual value interface in the link level simulations. [P5] The author has developed the link level simulation tool with the multiuser detection receiver with Toskala. The author has done the link level simulations and contributed to the definition of the interface to the system level simulator. [P6] The author has collected a summary of the main design targets, solutions and parameters of the WCDMA physical layer. [P7] The author has defined the simulation cases, contributed to the performance evaluation and to the implementation considerations. The simulations are done by Raitola. [P8] The author has contributed to the definition of the simulation cases and to the analysis of the results. The simulations are done by Heiska. [P9] The author has contributed to the fundamental modelling principles in the dynamic simulation tool. [P10] The author has defined the main principles of the simulation tool and has contributed to the analysis of the simulation results. The detailed simulation tool development and the simulations are done by Heikkinen. [P11] The author has contributed to the definition of the studied antenna concepts, to the simulation cases and to the analysis of the results. [P12] The author has contributed to the analysis of the results and to the comparison of the simulation and the measurement results. The simulations and most of the measurements are done by Tölli. [P13] The author has done the laboratory measurements with Soldani, part of the link level simulations and compared the simulations and the measurements.
1.6 Thesis Outline The thesis is organized as follows. The simulation tools and the measurement configurations are introduced in Chapter 2. The modelling assumptions of the simulations and theoretical capacity estimations are presented in Chapter 3, and the achieved results of the thesis are presented and discussed in Chapter 4. The presentation of the achieved results is organized in three parts. First, the UTRA FDD performance is evaluated in terms of capacity, link level performance and high bit rate performance in Section 4.1. Second, the gain of UTRA FDD performance

Introduction 21
enhancement solutions is evaluated in Section 4.2. The studied performance enhancement solutions include advanced packet retransmission algorithms, base station multiuser detection and base station antenna solutions. Third, Section 4.3 presents the main differences between UTRA FDD and UTRA TDD and concludes synchronization and co-ordination requirements for UTRA TDD base stations based on the simulation results. The conclusions of the thesis are drawn in Chapter 5 and the main contents of the included publications are summarized in Chapter 6.


Simulation and Measurement Methods 23
2 SIMULATION AND MEASUREMENT METHODS
2.1 Dynamic System Level and Link Level Simulations Radio network simulations are classified as either link level or system level simulations in this thesis. The link level simulation includes a single mobile station connected to one or a few base stations. The system level simulation consists of multiple base stations and all the mobiles that are connected to those base stations. The link level simulator is illustrated in Figure 5 and the system level one in Figure 6. For accurate receiver performance evaluation, a chip-level time resolution in the simulation model is needed. In WCDMA the chip rate is 3.84 Mcps. On the other hand, at system level the traffic models and the mobility models require simulations of at least 10–20 minutes with a large number of mobiles and base stations. Simulations of 10–20 minutes are needed because voice and data calls typically last for a few minutes and several calls need to be started and ended during the simulation. The complexity of such simulations would be too large if hundreds of mobiles would operate 10–20 minutes and each connection would be modelled with up to 3.84 MHz frequency. Separate link level and system level simulators are needed to obtain feasible computer simulation times with accurate receiver modelling and large system simulations. The link level simulators usually operate at chip frequency, while the dynamic system level simulators typically operate with the fast power control frequency of 1.5 kHz. The division between link level and system level simulators is summarised in Table 1.
Sampling frequency at least 3840 kHz
Accurate mobile receiver modelling
Accurate base station receiver
modelling
Figure 5. Link level simulator in case of soft handover
2.2 Static and Dynamic System Level Simulations A static tool does not have time dependency while in a dynamic tool mobiles are moving, calls are starting and ending, and propagation channel experiences fading. These two types of system simulators and their application areas are compared in this section. The static tool can be efficiently used to evaluate the network capacity and coverage and to evaluate the effect of inter-cell and inter-frequency interference. The radio resource management algorithms are modelled as average values in the static tools, e.g., the effect of the fast power control is taken into account in the average values. Static

24 A Study of UMTS Terrestrial Radio Access Performance
tools are well suited for the network planning purposes where the modelling of the propagation loss is important for the site planning. Static tools allow simulations of a larger network area than dynamic tools because of simpler modelling. An example static tool is presented in [24].
Several base stations
All mobiles connected to those
base stationsSampling frequency 1.5 kHz
or lower
Figure 6. System level simulator
Table 1. Link level and system level simulators Link level Dynamic system level Time resolution 1 sample/chip 3840 kHz 1 sample/slot 1.5 kHz Number of base stations 1–3. That is the typical number
of soft handover branches. >10. Several base stations are needed to get enough inter-cell interference.
Number of mobiles 1 mobile with Rake receiver. Several mobiles with multiuser detection receivers
>100. All the mobiles that are connected to the base stations.
Receiver detection performance
Complete receiver modelling With actual value interface, see Section 2.3
Path loss — Yes Slow fading — Yes Mobility model — Yes Traffic model — Yes Simulated time span 1–5 min. That time is needed to
get enough frames for reliable frame error rate calculation.1
10–20 min. That time is needed to have enough calls starting and ending.2
1There are 100 frames per second in WCDMA. In order to study frame-error-rate of 10-3 and to obtain at least 10 errors for reliable results, 10000 frames are needed corresponding to 100-second simulation. 2Typical call length is a few minutes.

Simulation and Measurement Methods 25
The dynamic simulator includes traffic and mobility models which make it possible to develop and test real time radio resource management algorithms. Testing of radio resource management algorithms requires accurate modelling of WCDMA link performance, and therefore, a time resolution corresponding to the power control frequency of 1.5 kHz is used. Such a high accuracy makes the dynamic simulation tool complex and the simulations still slow for practical network planning purposes. The results from the dynamic tool can be used to calibrate the modelling of the static tool. For example, the practical performance of handover algorithms with measurement errors and delays can be tested in the dynamic tool and the results fed into the static network planning tool. An example dynamic tool is presented in [P9]. The differences between static and dynamic system simulators are summarized in Table 2. The system level studies in this thesis are based on static simulations.
Table 2. Static and dynamic system level simulators Static Dynamic Mobility model No, users are stationary Yes, mobile speed and
direction included Traffic model No, fixed bit rate per user Yes, call and packet arrival
process included Multipath fading model No, the effect of multipath is
taken into account in the average values
Yes
Radio resource management algorithms
No, the effect of radio resource algorithms is taken into account in the average values
Yes
2.3 Interface Between Link and System Level Simulations Because the simulation is divided into two parts, a method of interfacing the link and system level simulators has to be defined. The target of the interface is to bring the accuracy of the detailed link level receiver modelling to the system level simulations. The interface need to be able to predict the frame error rate, FER, probability in the system level simulations based on the received signal-to-interference ratios, SIR, per time slot. The target of the interface is illustrated in Figure 7.
SIR1,..,SIR15 of the received signal
Real receiver
Interface
FER
FER
Target is to obtain the same FER as with real receiver
Real received signal
Figure 7. The target of the interface between link and system level simulators

26 A Study of UMTS Terrestrial Radio Access Performance
The interference situations and correspondingly the received SIR can change quickly in the dynamic system simulations. It is desirable that the same interface function can be used regardless of the variance of the received SIR. An example case is illustrated in Figure 8. In the left-most case the variance of the received SIR is high because of high mobile speed and bursty interference. The bursty interference can cause a fast drop or a fast increase in SIR. In the right-most case the variance of the received SIR is low because the fast power control is able to maintain constant SIR at low mobile speed. The higher variance leads to a higher FER probability with the same average received SIR.
High FER probability
1 frame = 10 ms = 15 slots
Low FER probability
1 frame = 10 ms = 15 slots
Received SIR per slot
• high mobile speed• high interference variance
• low mobile speed• fast power control
Other user transmission starts
Fast fading The same average SIR
High variance in SIR Low variance in SIR
Figure 8. Two examples of different variances at the same mean value We describe two interfaces below: average value interface and actual value interface. The average value interface uses the average signal-to-interference ratio, SIR, and does not consider the variations in SIR within one frame. The actual value interface takes into account the variations in SIR that can be caused by changing multipath fading profiles, changing mobile speeds, limited power control dynamics, changing interference situations or by radio resource management algorithms. The actual value interface can be implemented in a number of different ways. An extensive evaluation of different implementations of actual value interface is presented in [22]. The actual value interface in this section uses a geometric average SIR over 15 slots in each frame, see Eq. (1). Geometric average is equivalent to calculating an average of logarithmic SIR values, i.e. average of SIR values in dB, as shown in Eq. (2). The geometric average is equal or smaller than the average value. The geometric average decreases as the variance increases.

Simulation and Measurement Methods 27
( )
∏ ∑
===
=
∏15
log
15
log
1515
15
110
1510
1010
ii
ii
SIRSIR
iiframe SIRSIR
(1)
where SIRframe is the signal-to-interference ratio value to be used in the BLER estimation and SIRi is the signal-to-interference ratio for ith slot within frame
( )( )
15
log10log10
15
110
10
∑ ⋅= =i
i
frame
SIRSIR
(2)
The accuracy of the actual value interface can be verified by building a mapping function in the link level with several different assumptions, like mobile speed and power control dynamics. The verification in the thesis is done by calculating SIRframe values with the actual value interface from the real received signal and by taking FER from the real receiver. If the mapping from SIRframe to FER remains the same for all test cases, the same mapping function can be used and the interface is able to capture the effect of the tested input parameter. If different mapping would be needed for the different cases, the interface function is not able to predict the receiver detection performance in terms of FER. The testing of the accuracy of the actual value interface is presented in Figure 9.
Case 1
SIR distribution 1 Interface
Real received signal Real receiver
SIRframe
FER
Case 2
SIR distribution 2 Interface
Real received signal Real receiver
Case n
SIR distribution n Interface
Real received signal Real receiver
...
If the mapping from SIRframe to FER remains constant for all cases, the interface function is able to capture the effect of the tested input parameter.
SIRframe
SIRframe
Mapping
FER
FER
Mapping
Mapping
Figure 9. Testing the accuracy of the actual value interface

28 A Study of UMTS Terrestrial Radio Access Performance
The performance of the average value interface with different mobile speeds is shown in Figure 10 and with limited power control dynamics in Figure 11. The x-axis shows the average received SIR and the y-axis the average FER from the receiver. The higher is the mobile speed, the higher is the variance of the received SIR since the fast power control is not able to compensate the fading. The limited power control dynamics affects the performance when the mobile is at the edge of the coverage area operating close to its maximum power. When the mobile is not able to compensate the fast fading with fast power control, it results into a higher variance in the received SIR. The average required SIR is clearly affected by the mobile speed: 2.2 dB higher average SIR is needed when the mobile speed is increased from 3 km/h to 120 km/h to obtain FER of 1%. The average SIR is affected by the power control as well: the difference in the performance with and without power control with 50 km/h is nearly 2 dB. At 3 km/h the effect of the power control is even larger. These results indicate that different average value interfaces would be needed depending on the instantaneous conditions in the system level simulations. The performance of the actual value interface with different mobile speeds is shown in Figure 12 and with limited power control dynamics in Figure 13. The x-axis shows SIRframe from Eq. (1) and the y-axis FER from the receiver. The actual value interface is able to capture the effect of the mobile speed up to 120 km/h. That can be seen as the curves are close to each other after the actual value mapping function has been applied. The interface is less accurate at high mobile speeds because the channel changes during one simulation time step, i.e. during 0.667 ms. The actual value interface captures the effect of limited power control dynamics well: for FER larger than 1% the differences are below 0.2 dB. The results above show that the actual value interface helps making the dynamic system simulations more accurate compared to using average value interface. Different correction factors would be needed with an average value interface depending on the mobile speed, power control dynamics, and a number of other factors affecting SIR distributions.

Simulation and Measurement Methods 29
3 4 5 6 7 8 9 1010
−3
10−2
10−1
100
FER vs. SIR
Average SIR over whole simulation
FE
R
3 km/h 10 km/h 20 km/h 50 km/h 120 km/h250 km/h
Figure 10. Average value interface, different mobile speeds
2 3 4 5 6 7 8 910
−3
10−2
10−1
100
Average SIR over the whole simulation
Ave
rage
FE
R o
ver
the
who
le s
imul
atio
n
dB
No PC, 3 km/h With PC 3 km/h No PC 50 km/h With PC 50 km/h
Figure 11. Average value interface, limited power control dynamics

30 A Study of UMTS Terrestrial Radio Access Performance
0 1 2 3 4 5 6 7 8 9 1010
−3
10−2
10−1
100
FER vs. SIR
Log−average SIR over one frame
FE
R o
ver
one
fram
e
3 km/h 10 km/h 20 km/h 50 km/h 120 km/h250 km/h500 km/h
Figure 12. Actual value interface, different mobile speeds
0 0.5 1 1.5 2 2.5 3 3.5 410
−3
10−2
10−1
100
FE
R
Average over frame of 10*log10(SIR over slot)
dB
No PC, 3 km/h With PC 3 km/h No PC 50 km/h With PC 50 km/h
Figure 13. Actual value interface, limited power control dynamics (PC=power control)

Simulation and Measurement Methods 31
2.4 Measurement Methods In addition to the link and system level simulations the WCDMA performance was evaluated in the laboratory and field measurements. These measurements concentrated on the uplink performance of a single connection. In the initial WCDMA deployment phase the coverage is important to be able to provide new services to as many customers as possible, and to reduce the required number of base station sites and the related costs. It is shown in [3] that the WCDMA macro cell coverage is initially uplink limited. The reason is that the mobile output power is typically 0.125 W while the base station output power is clearly higher: 20–40 W. Therefore, a thorough understanding of the uplink performance is important for the initial WCDMA deployment. An experimental WCDMA system was used in these measurements. The physical layer was based on the early WCDMA concept by Japanese Docomo with 4.096 Mcps [25]. There are a few differences in the details of the physical layer between this Docomo proposal and the final 3GPP WCDMA standard with 3.84 Mcps. In addition to the different chip rate those differences are mainly related to the multiplexing of the physical data and control channel, and are not considered relevant from the performance point of view. The mobile transmission power was the main output that was collected from the measurements. This measurement quantity was used because the outer loop power control and the fast power control keep the received uplink quality constant. The improvements of the base station sensitivity with the antenna solutions can be seen in the mobile transmission power. The mobile transmission power was collected slot-by-slot, i.e. every 0.625 ms. The mobile station of the experimental WCDMA system is shown in Figure 14.
Figure 14. Experimental WCDMA mobile station
The laboratory measurement setup is illustrated in Figure 15. The signal is transmitted via cables with attenuators and with a fading channel emulator. The Propsim channel emulator [26] allows to define multipath profile and mobile speed. A power splitter and two independent fading channels in the emulator are used to model the base station antenna diversity. The measurement results can be compared to the simulation results which can help to find out possible imperfections in the implementation, as shown in [P13], and to make the simulation modelling more accurate. The same kind of mobile and base stations were used in the field measurements as in the laboratory measurements. The main output in the field measurements was the mobile transmission power. The mobile antenna was located on top of the measurement

32 A Study of UMTS Terrestrial Radio Access Performance
van. The base station antennas were located on the roof top. The measurement area was in Espoo, Finland, where the area is urban and suburban type. An example antenna configuration on the roof top is shown in Figure 16. [P12] [27]
WCDMAmobile
WCDMAmobile
Attenuation30 dB
Attenuation30 dB SplitterSplitter
2-branchchannelemulator
2-branchchannelemulator
Attenuation60 dB
Attenuation60 dB
Attenuation 60 dB (100 dB to remove diversity branch)
Attenuation 60 dB (100 dB to remove diversity branch)
WCDMAbase stationWCDMA
base station
Power control feedback
Main branch
Diversity branch
Measure transmission power slot-by-slot
Measure transmission power slot-by-slot
Figure 15. Measurement setup in the laboratory measurements
Figure 16. Example antenna setup in the field measurements
A GPS receiver in the measurement van was used to make consecutive measurements comparable. The mobile station transmission powers were averaged in dBs over the measurement route. Several iterations were driven on each of the pre-defined measurement routes and the measurement results were averaged over the iterations. The field measurements are valuable in evaluating the performance of different base station antenna configuration. The modelling of the multipath environment and the antenna correlation should be as realistic as possible in the simulations in order to get reliable results for the different antenna configurations. The simulation results depend heavily on those assumptions, see [P11]. No such assumptions are needed in the measurements. The comparison of the simulation and measurement results help to validate the simulation assumptions.

System Models and Theoretical Analysis 33
3 SYSTEM MODELS AND THEORETICAL ANALYSIS The key modelling issues in the simulations are discussed in this chapter. We consider these modelling aspects separately in the link level and in the system level simulations. Theoretical capacity calculations are presented using these modelling assumptions.
3.1 Link Level Modelling The link level simulations typically include a transmitter, fading channel and a receiver. Several mobiles are included if a multiuser detection receiver is used. The simulation also includes several base stations if soft handover is modelled. Table 3 lists the transceiver modelling assumptions, Table 4 the traffic assumptions and Table 5 the environment modelling assumptions.
Table 3. Base station modelling assumptions Number of receiver branches1 1-4 Antenna configuration Antenna diversity or beamforming Rake finger allocation Simulations use fixed allocation, no delay estimation
Measurements use finger allocation based on the pilot symbols
Total number of Rake fingers per connection2
Simulations max 20 Measurements max 8
Amplitude and phase estimation of each Rake finger
From pilot symbols
Signal-to-interference ratio estimation for fast power control
Signal power estimation from pilot symbol Interference estimation from wideband received power3
1The effect of antenna diversity is tested in the simulations and in the measurements. 2This is the total number of Rake fingers that is divided between receiver antennas. 8 Rake fingers in total with 4 antennas implies 2 fingers per antenna. 3This interference estimation is known to be biased because the interference estimate includes part of the signal power. Since the signal power is clearly below the interference in these simulations, the effect of the bias is small, and it is corrected by the outer loop power control.
Table 4. Traffic modelling assumptions Bit rate1 Simulation 8 kbps, 74 kbps, 144 kbps, 384 kbps and
2 Mbps Measurement 8 kbps
Interleaving Simulations 10 ms and 40 ms Measurements 10 ms
BLER target2 Voice 1% Data 1-20%
1Different bit rates are tested to evaluate the sensitivity of the performance to the bit rates 2Good quality voice typically requires 1% block error rate while non-real time data tolerates higher error rate because of retransmissions.

34 A Study of UMTS Terrestrial Radio Access Performance
Table 5. Environment modelling assumptions Multipath in simulations ITU Pedestrian A [28]
ITU Vehicular A [28] Codit Macro cell [29] Codit Micro cell [29]
Base station antenna correlation in simulations
0.0, 0.7, 1.0
Measurement area Urban, suburban type in Leppävaara, Espoo, Finland
3.2 System Level Modelling The system level modelling issues are discussed in [P9] and in [24]. The system level simulations assume macro cellular Okumura-Hata propagation model. Macro cell environment is used because the majority of today’s networks are based on macro cells and that will also be the case in the initial phase of the UMTS networks. The environment modelling follows the guidelines given in [28].
3.3 Theoretical Analysis In this section a theoretical WCDMA capacity is calculated with load factor formulas from [3, Chapter 8]. The uplink load factor formula is shown in Eq. (3). The pole capacity corresponds to the case where ηUL equals 1. The parameters and their typical values are shown in Table 6.
( ) ∑=
⋅⋅
+⋅+=
K
j
jjj
b
UL
RNE
Wi
1
0
1
11
υ
η
(3)
The downlink load factor formula is shown in Eq. (4). This load calculation assumes that the same bit rate is allocated for all users. If the same power would be allocated for all users instead, the bit rates would be higher close to the base station, and the average throughput would be higher [3, Chapter 10].
( ) ( )[ ]jjj
jbK
jjDL i
RWNE
+−⋅⋅= ∑=
αυη 1// 0
1
(4)
We allocate additionally 15% of the total capacity for the common channels in downlink [4]. The results of the capacity calculations are shown in Table 7. The total throughput is obtained by multiplying the number of users with 64 kbps x (1-BLER). The results of Table 7 show that the maximum air interface capacities in uplink and downlink are very similar. These capacity results will be compared to the simulation results in Section 4.1.

System Models and Theoretical Analysis 35
Table 6. System level assumptions Parameter Uplink
value Downlink
value Notes
η Load factor 0.6 0.8 Uplink value equals 4 dB noise rise1. Downlink load factor can be higher than in uplink because of more power [3].
Eb/N0 Energy per bit divided by noise spectral density for BLER of 10%
1.5 dB 3.7 dB From [30] and [31] in static channel with 64 kbps
αj Orthogonality of user j - 0.5 Typical macro cell value [4]. No orthogonal codes used in uplink.
I Other-to-own cell interference ratio
0.65 Typical 3-sector macro cell [4]2
K Number of users To be calculated W Chip rate 3.84 Mcps Rj Bit rate of user j 64 kbps The first WCDMA terminals will
support bit rates 64-128 kbps in uplink3
υj Activity factor of user j 1.0 Continuous data transmission assumed
1Since coverage is uplink limited, we want to limit the uplink noise rise to a reasonable low value to prevent excessive cell breathing. 2Assumes that the users are equally distributed over the cell area. If the users are on average closer to the cell site, the other cell interference is lower, and the capacity is higher. 3This bit rate is the user bit rate while the channel bit rate is higher because of channel coding.
Table 7. Theoretical capacity results Number of
64-kbps users Total throughput
Uplink 15.8 911 kbps Downlink 15.1 872 kbps


Achieved Results 37
4 ACHIEVED RESULTS
4.1 Evaluation of Basic UTRA FDD Performance 4.1.1 UTRA FDD Spectral Efficiency Link and system level simulations are used in [P3] and in [P5] to evaluate the WCDMA capacity. Those simulation results are compared to the theoretical calculations from Section 3.3 in Table 8 and Table 9, and the comparison is shown in Figure 17 and Figure 18. This benchmarking can be used to verify that the simulation tool gives such results which are in line with the theoretical capacities. The simulation results are further compared to the results given in other references [2, 3, 4, 32 and 33].
Table 8. Uplink capacity per cell per 5-MHz carrier Calculations in Section 3.3 911 kbps Calculations in [P5] 1000 kbps Calculations in [3, Section 8.2] 860 kbps Simulations in [P5] 850 kbps Simulations in [2] 1020 kbps Simulations in [4, Section 7.11] 640 kbps Simulations in [32] 830-960 kbps
Table 9. Downlink capacity per cell per 5-MHz carrier
Calculations in Section 3.3 871 kbps Calculations in [3, Section 8.2] 820 kbps Simulations in [P3] 845 kbps Simulations in [2] 615 kbps Simulations in [4, Section 7.11] 640 kbps Simulations [33] 700-800 kbps
Uplink throughput per sector [kbps per 5 MHz]
0
200
400
600
800
1000
1200
CalculationsSection 3.3
Calculations[P5]
Calculations[3]
Simulations[P5]
Simulations[2]
Simulations[4]
Simulations[32], low
Simulations[32], high
Figure 17. WCDMA uplink cell throughput estimates
38 A Study of UMTS Terrestrial Radio Access Performance
Downlink throughput per sector [kbps per 5 MHz]
0200400600800
10001200
CalculationsSection 3.3
Calculations[3]
Simulations[P3]
Simulations[2]
Simulations[4]
Simulations[33], low
Simulations[33], high
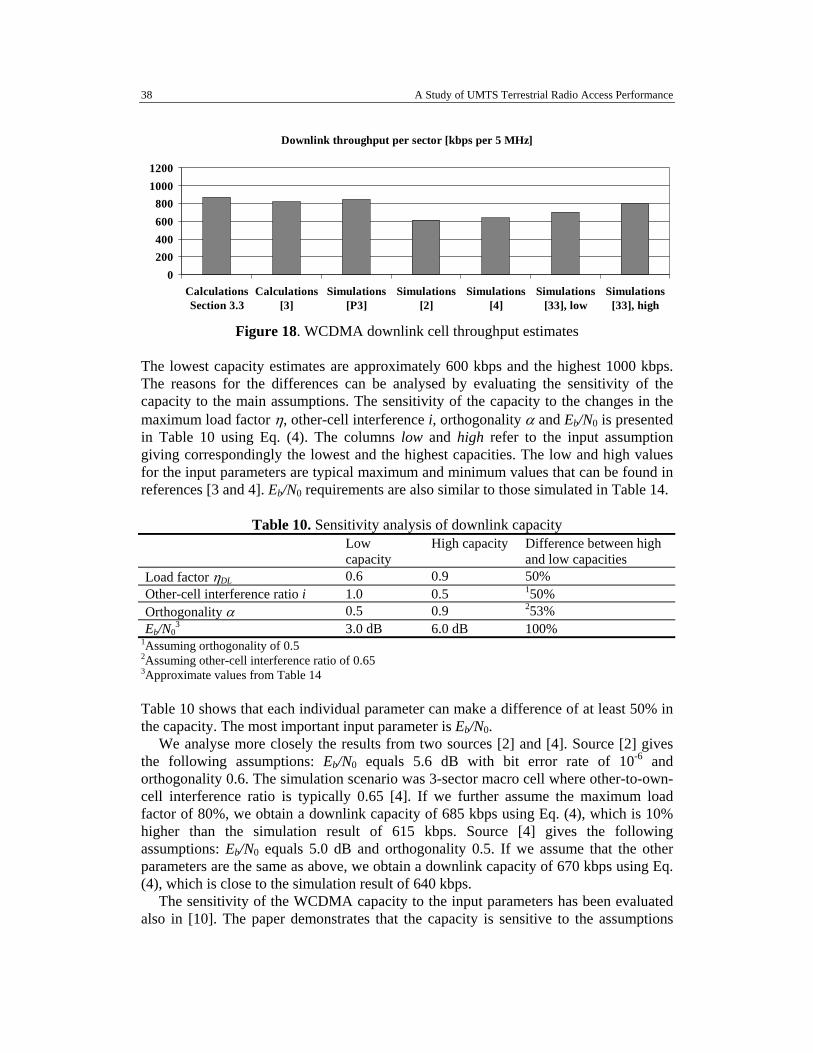
Figure 18. WCDMA downlink cell throughput estimates
The lowest capacity estimates are approximately 600 kbps and the highest 1000 kbps. The reasons for the differences can be analysed by evaluating the sensitivity of the capacity to the main assumptions. The sensitivity of the capacity to the changes in the maximum load factor η, other-cell interference i, orthogonality α and Eb/N0 is presented in Table 10 using Eq. (4). The columns low and high refer to the input assumption giving correspondingly the lowest and the highest capacities. The low and high values for the input parameters are typical maximum and minimum values that can be found in references [3 and 4]. Eb/N0 requirements are also similar to those simulated in Table 14.
Table 10. Sensitivity analysis of downlink capacity Low
capacity High capacity Difference between high
and low capacities Load factor ηDL 0.6 0.9 50% Other-cell interference ratio i 1.0 0.5 150% Orthogonality α 0.5 0.9 253% Eb/N0
3 3.0 dB 6.0 dB 100% 1Assuming orthogonality of 0.5 2Assuming other-cell interference ratio of 0.65 3Approximate values from Table 14 Table 10 shows that each individual parameter can make a difference of at least 50% in the capacity. The most important input parameter is Eb/N0. We analyse more closely the results from two sources [2] and [4]. Source [2] gives the following assumptions: Eb/N0 equals 5.6 dB with bit error rate of 10-6 and orthogonality 0.6. The simulation scenario was 3-sector macro cell where other-to-own-cell interference ratio is typically 0.65 [4]. If we further assume the maximum load factor of 80%, we obtain a downlink capacity of 685 kbps using Eq. (4), which is 10% higher than the simulation result of 615 kbps. Source [4] gives the following assumptions: Eb/N0 equals 5.0 dB and orthogonality 0.5. If we assume that the other parameters are the same as above, we obtain a downlink capacity of 670 kbps using Eq. (4), which is close to the simulation result of 640 kbps. The sensitivity of the WCDMA capacity to the input parameters has been evaluated also in [10]. The paper demonstrates that the capacity is sensitive to the assumptions

Achieved Results 39
regarding the noise rise, i.e., the load factor, the cell size and the propagation path loss that affects the other to own cell interference ratio. These calculations show that the simple methods used in the system level performance evaluation provide similar capacity estimates as the other references. The differences can be mainly explained by the different input assumptions. The different input values reflect the differences in the propagation environment, network planning, network algorithms and mobile algorithms. It was shown above that the WCDMA capacity is sensitive to the environment, especially to the cell isolation and to the multipath propagation, and to the transceiver performance, especially to the required Eb/N0. Average WCDMA capacity is estimated to be between 600 kbps and 1000 kbps per carrier per sector both in uplink and in downlink. 4.1.2 Benchmarking with cdma2000 WCDMA capacity results can be compared also to the results from cdma2000 simulations. Cdma2000 system is based on code division multiple access technology and has similar features as WCDMA [3], and therefore, the resulting capacities should be similar. Figure 19 shows WCDMA capacity results from Section 4.1.1 and cdma2000 capacity results from nine different references. The calculations assume 3 cdma2000 carriers in 5 MHz spectrum. Cdma2000 capacities range from 600 kbps to 1100 kbps in 5 MHz bandwidth. These cdma2000 capacity results are in line with the presented WCDMA capacity estimates.
Throughput per sector [kbps per 5 MHz]
0200400600800
10001200
WCDM
A low
WCDM
A high
cdma [
34]
cdma [
35] lo
w
cdma [
35] h
igh
cdma [
36]
cdma [
37]
cdma [
38]
cdma [
39]
cdma [
40]
cdma [
41]
Figure 19. Benchmarking WCDMA capacity with cdma2000 from nine different
references 4.1.3 Link Level Performance of UTRA FDD This section studies the WCDMA link level performance in uplink with simulations and with laboratory measurements. The effect of mobile speed, multipath profile and base station antenna diversity is studied. Measurement results are compared to the simulation results. The measurement setup of the laboratory measurements is shown in Figure 15 in Section 2.4.

40 A Study of UMTS Terrestrial Radio Access Performance
4.1.3.1 Effect of Mobile Speed The effect of mobile speed to the mobile transmission power is studied in this section. Example fading channel profile with 3 km/h and with 20 km/h is illustrated in Figure 20.
0 0.2 0.4 0.6 0.8 1-15
-10
-5
0
5
10
dB
3 km/h
0 0.2 0.4 0.6 0.8 1-15
-10
-5
0
5
10
Seconds
dB
20 km/h
Figure 20. Fading of ITU Pedestrian A channel with 3 km/h and 20 km/h
The measurement results are scaled so that the average mobile transmission power at 3 km/h is the same as the corresponding simulation results. With that approach we can compare the relative mobile transmission powers at different mobile speeds. The differences between the required transmission powers as compared to 3 km/h are shown in Table 11. We can note that the transmission power is lowest at highest mobile speed 120 km/h. The reason is that channel coding and interleaving provide time diversity when the fading rate is high enough at high mobile speeds. The effect of the mobile speed is more distinct in ITU Pedestrian A channel with deeper fades than in ITU Vehicular A channel. We can also notice that there are differences between simulated and measured results especially at 20 km/h without antenna diversity where the measured power is higher than the simulated one. The mobile speed of 20 km/h is such a speed where the fast power control cannot any more fully compensate the fast fading, and also the interleaving of 10 ms cannot provide proper time diversity. The accurate performance of fast power control is important for the performance at 20 km/h. These results reveal that there are some inaccuracies in the implementation of the signal-to-interference estimation in the experimental base station. The measured performance at 120 km/h is relatively better than the simulated performance when the results are set equal at 3 km/h. With the mobile speed of
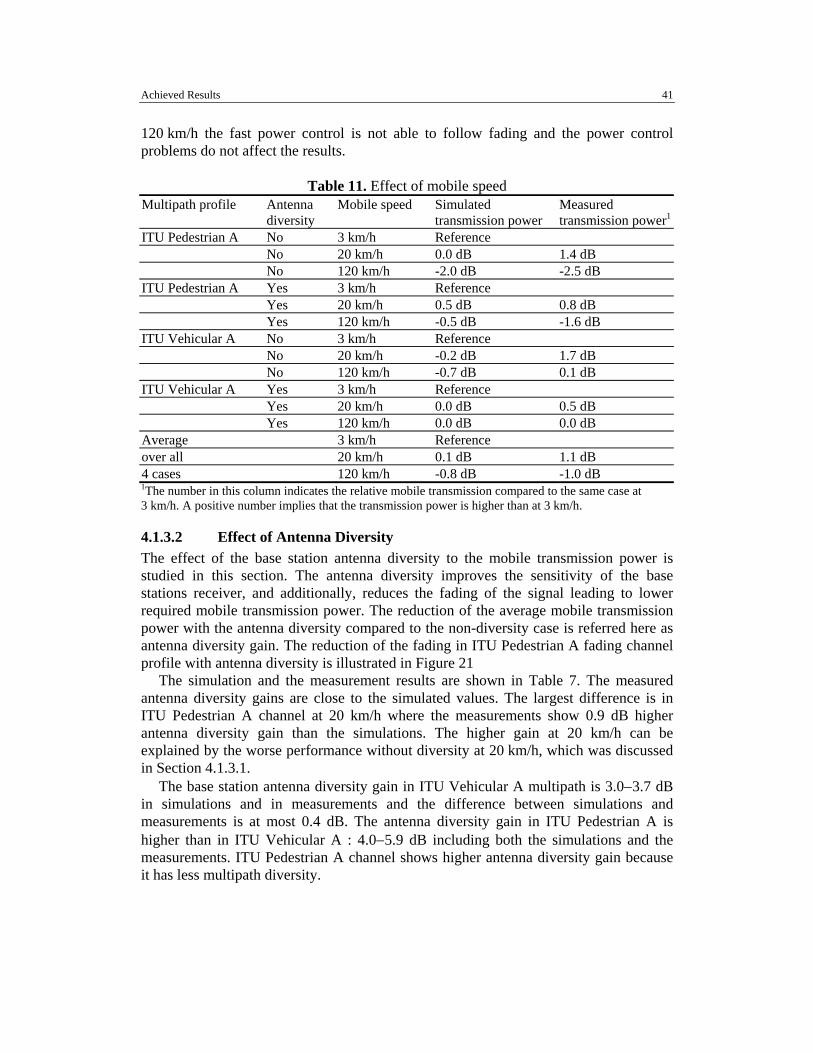
Achieved Results 41
120 km/h the fast power control is not able to follow fading and the power control problems do not affect the results.
Table 11. Effect of mobile speed Multipath profile Antenna
diversity Mobile speed
Simulated transmission power
Measured transmission power1
ITU Pedestrian A No 3 km/h Reference No 20 km/h 0.0 dB 1.4 dB No 120 km/h -2.0 dB -2.5 dB ITU Pedestrian A Yes 3 km/h Reference Yes 20 km/h 0.5 dB 0.8 dB Yes 120 km/h -0.5 dB -1.6 dB ITU Vehicular A No 3 km/h Reference No 20 km/h -0.2 dB 1.7 dB No 120 km/h -0.7 dB 0.1 dB ITU Vehicular A Yes 3 km/h Reference Yes 20 km/h 0.0 dB 0.5 dB Yes 120 km/h 0.0 dB 0.0 dB Average 3 km/h Reference over all 20 km/h 0.1 dB 1.1 dB 4 cases 120 km/h -0.8 dB -1.0 dB 1The number in this column indicates the relative mobile transmission compared to the same case at 3 km/h. A positive number implies that the transmission power is higher than at 3 km/h.
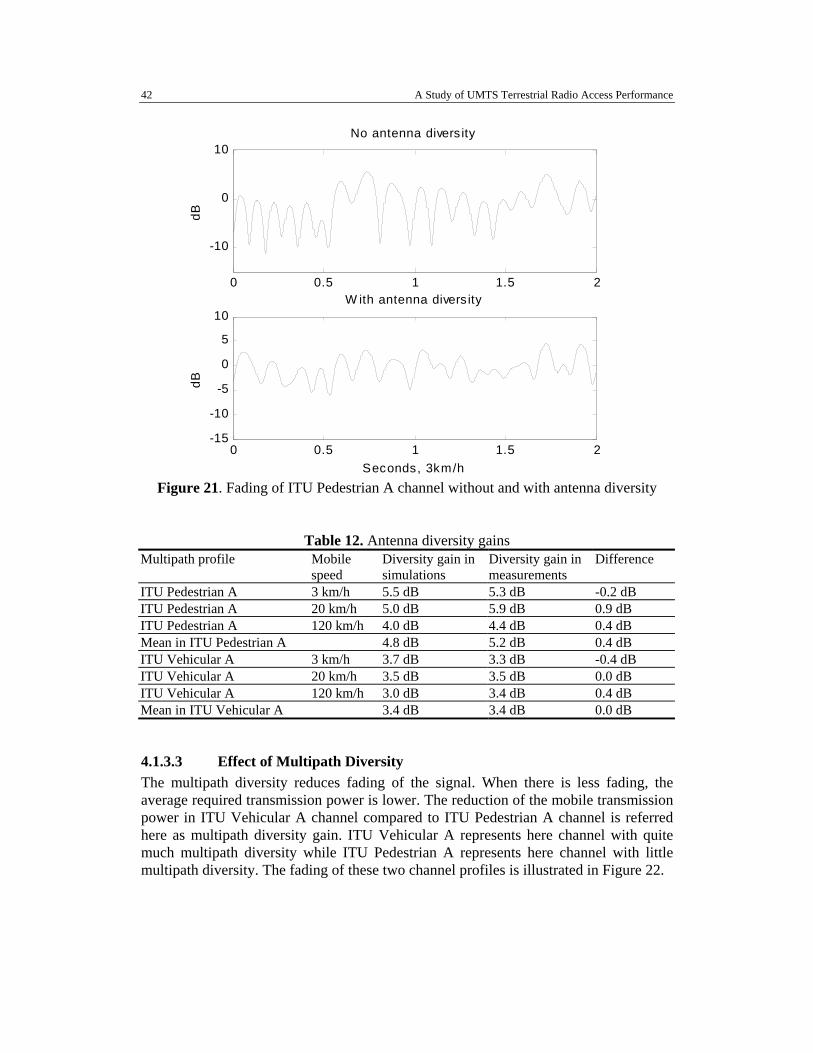
4.1.3.2 Effect of Antenna Diversity The effect of the base station antenna diversity to the mobile transmission power is studied in this section. The antenna diversity improves the sensitivity of the base stations receiver, and additionally, reduces the fading of the signal leading to lower required mobile transmission power. The reduction of the average mobile transmission power with the antenna diversity compared to the non-diversity case is referred here as antenna diversity gain. The reduction of the fading in ITU Pedestrian A fading channel profile with antenna diversity is illustrated in Figure 21 The simulation and the measurement results are shown in Table 7. The measured antenna diversity gains are close to the simulated values. The largest difference is in ITU Pedestrian A channel at 20 km/h where the measurements show 0.9 dB higher antenna diversity gain than the simulations. The higher gain at 20 km/h can be explained by the worse performance without diversity at 20 km/h, which was discussed in Section 4.1.3.1. The base station antenna diversity gain in ITU Vehicular A multipath is 3.0−3.7 dB in simulations and in measurements and the difference between simulations and measurements is at most 0.4 dB. The antenna diversity gain in ITU Pedestrian A is higher than in ITU Vehicular A : 4.0−5.9 dB including both the simulations and the measurements. ITU Pedestrian A channel shows higher antenna diversity gain because it has less multipath diversity.
42 A Study of UMTS Terrestrial Radio Access Performance
0 0.5 1 1.5 2
-10
0
10
dB
No antenna divers ity
0 0.5 1 1.5 2-15
-10
-5
0
5
10
Seconds, 3km/h
dB
W ith antenna divers ity
Figure 21. Fading of ITU Pedestrian A channel without and with antenna diversity
Table 12. Antenna diversity gains Multipath profile Mobile
speed Diversity gain in simulations
Diversity gain in measurements
Difference
ITU Pedestrian A 3 km/h 5.5 dB 5.3 dB -0.2 dB ITU Pedestrian A 20 km/h 5.0 dB 5.9 dB 0.9 dB ITU Pedestrian A 120 km/h 4.0 dB 4.4 dB 0.4 dB Mean in ITU Pedestrian A 4.8 dB 5.2 dB 0.4 dB ITU Vehicular A 3 km/h 3.7 dB 3.3 dB -0.4 dB ITU Vehicular A 20 km/h 3.5 dB 3.5 dB 0.0 dB ITU Vehicular A 120 km/h 3.0 dB 3.4 dB 0.4 dB Mean in ITU Vehicular A 3.4 dB 3.4 dB 0.0 dB
4.1.3.3 Effect of Multipath Diversity The multipath diversity reduces fading of the signal. When there is less fading, the average required transmission power is lower. The reduction of the mobile transmission power in ITU Vehicular A channel compared to ITU Pedestrian A channel is referred here as multipath diversity gain. ITU Vehicular A represents here channel with quite much multipath diversity while ITU Pedestrian A represents here channel with little multipath diversity. The fading of these two channel profiles is illustrated in Figure 22.

Achieved Results 43
0 0.5 1 1.5 2
-10
0
10
dB
ITU Pedestrian A
0 0.5 1 1.5 2
-10
0
10
Seconds, 3km/h
dB
ITU Vehicular A
Figure 22. Fading of ITU Vehicular A and ITU Pedestrian A channel profiles
The number of Rake fingers must be large enough in the receiver to be able to collect all the multipath components. If there are not enough Rake fingers in the receiver, part of the multipath energy is not captured and multipath diversity gain cannot be fully obtained. The number of fingers in the simulations was 5 with single antenna and 10 with antenna diversity. That number of fingers is large enough to collect the energy of all the multipath components. The measured base station uses total 8 fingers which are divided between the antennas. 4 fingers per antenna allows to collect on average 98% of the energy in ITU Vehicular A channel, and therefore, the difference in the number of fingers in the simulations and in the measurements is not expected to be relevant for the results. The simulation and measurement results are shown in Table 13. The multipath diversity gain at low mobile speed is 2.8 dB in the simulations and 3.3 dB in the measurements without antenna diversity. With antenna diversity the corresponding gains are smaller, 1.0 dB and 1.3 dB, because the antenna diversity reduces fading and the multipath diversity is less important. At higher mobile speeds the multipath diversity gains are smaller both in the simulations and in the measurements than at 3 km/h. At high mobile speeds interleaving extends over several fades and provides time diversity, and the need for additional multipath diversity is lower than at low mobile speeds. The measured multipath diversity gains are close to the simulated values. The higher gain at 20 km/h in the measurements can be explained by the worse performance without diversity at 20 km/h, which was discussed in Section 4.1.3.1. In all other cases the differences are below 1 dB.

44 A Study of UMTS Terrestrial Radio Access Performance
Table 13. Multipath diversity gains Mobile speed Antenna
diversity Diversity gain in simulations
Diversity gain in measurements
Difference
3 km/h No 2.8 dB 3.3 dB 0.5 dB 20 km/h No 3.0 dB 4.0 dB 1.0 dB 120 km/h No 1.5 dB 0.7 dB -0.8 dB Average without antenna diversity
2.4 dB 2.7 dB 0.3 dB
3 km/h Yes 1.0 dB 1.3 dB 0.3 dB 20 km/h Yes 1.5 dB 1.6 dB 0.1 dB 120 km/h Yes 0.5 dB -0.3 dB -0.8 dB Average with antenna diversity
1.0 dB 0.9 dB -0.1 dB
We can also note that the antenna diversity gives 2–3 dB more gain than multipath diversity. The reason is that antenna diversity uses two receiver chains that allow to collect more energy in addition to the diversity gain. On the other hand, the cost of antenna diversity is higher than multipath diversity because two complete receiver chains are needed including RF components, while multipath diversity only requires more fingers in the baseband Rake receiver.
4.1.3.4 Summary of Link Level Diversity Gains The link level diversity gain results are summarized in this section. Antenna diversity gain results from simulations are shown in Figure 23 and multipath diversity gain results in Figure 24. The antenna diversity gains are lower in ITU Vehicular A channel than in ITU Pedestrian A channel since ITU Vehicular channel has already more multipath diversity. Also, high mobile speeds show lower antenna diversity gains because coding and interleaving provides time diversity with high mobile speeds. The multipath diversity gains show similar behaviour where the gains are lower when there is either more antenna or more time diversity.
0
1
2
3
4
5
6
ITU Pedestrian A ITU Vehicular A
[dB]
3 km/h20 km/h120 km/h
Figure 23. Simulated antenna diversity gains

Achieved Results 45
0
1
2
3
4
5
6
No antenna diversity With antenna diversity
[dB]
3 km/h20 km/h120 km/h
Figure 24. Simulated multipath diversity gain The simulation and the measurement results show that there is no constant value for the diversity gains but the gains depend on the amount of other diversity sources: the more diversity is already available, the smaller is the additional diversity gain. 4.1.4 High Bit Rates in UTRA FDD 3GPP Release 99 specifications support the transmission of 2 Mbps both in uplink and in downlink [42]. The terminal capability class for downlink 2 Mbps is defined in [43]. The transmission of 2 Mbps in cellular environment, however, faces some challenges that are addressed in this section. The main challenges in providing high bit rates in cellular environment are capacity, uplink coverage and link performance in terms of inter-symbol interference. The capacity results of Section 3.3 show an average capacity of 800 kbps per cell. Therefore, on average it is not possible to support a 2-Mbps user in every cell at the same time. The high bit rate capacity is further evaluated in [P1] and in [P2]. According to [P1] 15–20 MHz spectrum is needed to support one active 2-Mbps user in every cell with WCDMA. [P2] shows that advanced receiver structures including interference cancellation can be used to improve the capacity of CDMA networks. The coverage is a challenge in providing high bit rates in uplink direction. When the bit rate increases and the mobile maximum output power remains constant, there is less energy per bit available. The reduction of the cell radius ∆r as a function of bit rate R can be calculated as follows assuming path loss exponent of 3.5 and assuming the same Eb/N0 is needed for all bit rates.
5.31
=∆
RR
r ref
(5)
where Rref is the reference bit rate. If we assume that the network is dimensioned for Rref of 64 kbps, the relative cell range for 2 Mbps is 37% of the 64 kbps cell range, and the corresponding cell area is 0.372 = 14%. The relative cell ranges and cell areas are shown in Figure 25. One approach to tackle this coverage challenge is to use the antenna structures that are evaluated in Section 4.2.3.

46 A Study of UMTS Terrestrial Radio Access Performance
0 %
20 %
40 %
60 %
80 %
100 %
Cell range Cell area
64 kbps128 kbps384 kbps1024 kbps2048 kbps
Figure 25. Relative cell range and cell area for different uplink bit rates. 64 kbps used
as the reference case.
The link level performance is another challenge for high bit rates. When the bit rate increases, the required carrier-to-interference ratio C/I increases, which implies that the interference resistance of the WCDMA signal is reduced. A typical voice connection operates with C/I in the order of –20 dB while 2-Mbps connection requires C/I of 0 dB [3]. The lower interference resistance implies that the high bit rate WCDMA signal can be affected by the inter-symbol interference that is caused by multipath propagation. It is shown in [P1] that larger bandwidth improves the performance of 2-Mbps transmission in downlink because the higher processing gain allows lower C/I and makes the signal more robust against inter-symbol interference. The effect of inter-symbol interference can be reduced also by using advanced receivers. In [P1] multiuser detection receivers are used to reduce the inter-symbol interference in uplink. The uplink capacity in [P1] is clearly higher than the downlink capacity mainly because of the advanced base station receiver. Based on [P1] we can conclude that with about 5 MHz bandwidth the transmission of 2 Mbps is possible from the link performance point of view but it would benefit from advanced receiver structures. The link level performance of 512 kbps in uplink and 2 Mbps in downlink is further analysed in [P8]. The effect of inter-symbol interference is presented and the possible gains from advanced receiver structures in cancelling inter-symbol interference are evaluated. The results show that the effect of inter-symbol interference to uplink 512 kbps is less than 0.5 dB and the gain of advanced receivers would be small. The effect of inter-symbol interference to downlink 2-Mbps transmission is shown in Figure 26: 2 dB in 2-path channel and up to 4-dB in 3-path channel. These results show that 2 Mbps can be provided with a basic Rake receiver with 5 MHz WCDMA but the performance can be improved with advanced receivers. The 2-Mbps performance evaluation in this section shows that 2-Mbps is feasible for WCDMA downlink for packet data where the users would be sharing a high bit rate channel. 2-Mbps circuit switched service is not feasible with 5 MHz because of the capacity limitations. It is also shown that advanced receivers could be used to improve the performance of 2-Mbps in multipath channels.

Achieved Results 47
0 2 4 6 8 10 1210
-2
10-1
100
3-path2-path1-path
Performance degradation due to inter-
symbol interference
Eb/N0 [dB]
FER
Figure 26. Downlink 2-Mbps link level results
4.2 Evaluation of UTRA FDD Performance Enhancements This section evaluates a few performance enhancements for WCDMA : soft combining for packet data retransmissions in Section 4.2.1, base station multiuser detection in Section 4.2.2 and higher order base station antenna diversity in Section 4.2.3. The soft combining is a layer 1 solution for improving the efficiency of the packet data transmission. Base station multiuser detection refers to the baseband processing that improves the signal-to-interference ratio of the received uplink signal. Higher order antenna diversity improves the quality of the uplink signal by using four antenna branches in the reception. 4.2.1 Soft Combining for UTRA FDD Packet Data Interactive and background services, like web browsing and email downloading, tolerate delay and retransmission can be used to improve the transmission efficiency. In 3GPP Release 99 the downlink retransmissions originate from layer 2 of radio network controller [44]. If the packet is not correctly received by the mobile, the packet is discarded and it is retransmitted. WCDMA Release 99 solution is illustrated in Figure 27. The performance of the packet data could be improved by combining the retransmission with the first transmission. This approach is called soft combining. By using soft combining all the transmitted data is used for the signal detection thus reducing unnecessary interference. The soft combining solution is presented in Figure 28.

48 A Study of UMTS Terrestrial Radio Access Performance
Retransmission request
Retransmissions
Layer 1 Layer 2
Base station Radio network controller
Erroneous packets
discarded
Figure 27. WCDMA Release 99 packet retransmission scheme without soft combining
Retransmission request
Retransmissions
Layer 1
Base station Radio network controller
Erroneous packets combined with retransmission
Figure 28. WCDMA retransmission scheme with soft combining
The performance of the soft combining is evaluated in [P7] and compared to the non-combining solution. The results are summarized in Table 14.
Table 14. Soft combining gains Minimum required Eb/N0 for correctly received bit
No soft combining
With soft combing
Gain by soft combining
3 km/h, with fast power control 7.2 dB 6.9 dB 0.3 dB 3 km/h, no fast power control 4.8 dB 2.8 dB 2.0 dB 120 km/h, with fast power control 5.5 dB 4.8 dB 0.7 dB The results in [P7] show that the gain from soft combining is highest, up to 2.0 dB, when fast power control is not used and the mobile speed is low. With fast power control the gain is 0.3–0.7 dB depending on the mobile speed. The results also show that highest spectral efficiency is obtained with soft combining and without fast power control – the difference is up to 4.4 dB compared to the solution with fast power control

Achieved Results 49
and no soft combining. The difference of 4.4 dB corresponds to a 175% (=104.4/10) increase in the interference limited capacity. The gain from soft combining alone is 2.0 dB when fast power control is not used. The gain of 2.0 dB corresponds to 58% increase in the capacity. This result indicates that for delay tolerant data it is better to rely on retransmissions during the fading and not to increase the transmission power with fast power control. The results of this paper have been used in 3GPP when specifying a so-called limited power rise algorithm in Release 99 [45]. That algorithm allows the base station to prevent too fast increase of the downlink transmission power for packet data users to improve the spectral efficiency. The packet data capacity in WCDMA with and without fast power control has been evaluated also in [46]. It is shown that the packet data capacity with retransmissions is not sensitive to the frequency of power control but slow power control yields similar capacity as a system with ideal power control. The difference between fast power control and slow power control in [46] is small because large amount of multipath diversity is assumed in 4-path Rayleigh fading channel. The simulations in this section assumed ITU Pedestrian A multipath profile with deep fades and only little multipath diversity. The concept of soft combining and no fast power control is utilized in 3GPP High Speed Downlink Packet Access, HSDPA, that is standardized in 3GPP Rel’5 [47]. The HSDPA performance has been analysed in [48]. It is shown that HSDPA can improve the downlink capacity approximately 100% compared to 3GPP Release 99. 4.2.2 Base Station Multiuser Detection in UTRA FDD
4.2.2.1 Introduction and Algorithms CDMA systems are inherently interference limited from the capacity point of view [49]. If the number of users is large enough, an increase in signal-to-noise ratio does not improve bit error rate performance because of multiple access interference from other users. Multiple access interference is generated in the receiver since the received spreading codes are not completely orthogonal. If the spreading factor is large, the received powers of users are equal (no near–far problem), and the number of interfering users is large (>10), by the central limit theorem the multiple access interference can be modelled as increased background noise with a Gaussian distribution [49]. Using this approximation it was concluded that the matched filter is the optimal receiver for CDMA systems in additive white Gaussian noise (AWGN) channels. In frequency-selective channels, the Rake receiver [50] can be considered optimal with corresponding reasoning. Although multiple access interference can be approximated as AWGN, it inherently consists of received signals of CDMA users. The structure of the multiple access interference can be taken into account in CDMA receiver for improving the performance over the conventional matched filter receiver. Verdú was the first to analyse the optimal multi-user detectors. Verdú was able to show that CDMA is not inherently interference-limited, but that is a limitation of the matched filter receiver. [51]

50 A Study of UMTS Terrestrial Radio Access Performance
The optimal multi-user detectors [51] can use either maximum a posteriori detection or maximum likelihood sequence detection which can be obtained, for example, with Viterbi algorithm [50]. The drawback of the optimal detectors is their implementation complexity which is an exponential function of the number of users. Thus, they are not feasible for most practical CDMA receivers. This section evaluates the performance of a sub-optimal base station multiuser detector in the link and system level simulations. The sub-optimal receiver is the multistage detector given originally in [52] and [53], and for multipath channels in [54]. The problem formulation is given in [55]. Rake receivers are used as a pre-stage to obtain the initial symbol estimates and multistage iterations are used to subtract the multiple access interference. The fast power control is based on the signal-to-interference ratio that is estimated from the cleaned matched filter outputs. The complexity of the suboptimal receiver is substantially lower than the optimal receiver especially for high number of users. The multiuser detection base station receiver with antenna diversity and closed loop power control is shown in Figure 29. The corresponding solution with only Rake receivers is shown in Figure 30. The performance of the multiuser detection is summarized in this section based on the work in [P5]. The performance of other sub-optimal multiuser detection receivers is extensively evaluated in [15, 16, 17 and 18].
4.2.2.2 Link Level Performance The bit error rate (BER) performances in Monte Carlo simulations is used to assess the efficiency of multiuser detection (MUD) β. This efficiency denotes the percentage of intra-cell interference being removed by multiuser detection at the base station receiver. We assume here that the multiuser receiver is taking only those users into account in the cancellation whose signal it has to receive in any case, i.e., the intra-cell users. The efficiency β is a useful way of taking into account the effect of multiuser detection in the system level performance analysis. The effect of multiuser detection is illustrated in Figure 31. The efficiency of MUD is estimated from the load that can be accommodated with a specific Eb/N0 value with a conventional Rake receiver and with a multiuser receiver. The additive white Gaussian noise N0 is used to represent both thermal noise and inter-cell interference while intra-cell interference is represented by actual signals. The target BER is 10-3. In the analysis, we denote the number of users with a Rake receiver by KRAKE and that with a MUD receiver by KMUD. We define now the efficiency β of MUD at a given Eb/N0 value by
MUDRAKE KK )1( β−= (6) Link simulations in Figure 32 are used to estimate the required Eb/N0 when 10 users are received by the MUD receiver. The capacity of the conventional Rake receiver with the same Eb/N0 is found to be between 3 and 4 users yielding a MUD efficiency of 60 % to 70 %. In the following sections we evaluate the effect of multiuser detector to the cell capacity and coverage using the MUD efficiency from above. The estimation of the capacity and coverage gains is presented in Figure 33.

Achieved Results 51
Multiuserdetector
Rakefor user 1
Rakefor user 2
Rakefor user K
Symbol estimates
Inputs from antennas,2-branch diversity
…
Pre-stage symbol
estimates
SIR estimation from cleaned Rake outputsPower control
commands to the mobiles
…
Figure 29. Structure of the multiuser detection receiver for K users
Rakefor user 1
Rakefor user 2
Rakefor user K
Inputs from antennas,2-branch diversity
…Symbol
estimates
Power control commands to the
mobiles
Figure 30. Structure of the Rake receivers for K users

52 A Study of UMTS Terrestrial Radio Access Performance
N0 N0
Iown
Iown,MUD
Interference level
Iother = inter-cell interference
Iown = intra-cell interference without MUD
MUD reduces intra-cell interference
Iown,MUD = intra-cell interference with MUD = (1-β)· Iown
N0 = thermal noise
Iother Iother
Figure 31. MUD removes part of intra-cell interference
1 2 3 4 5 6
10−3
10−2
10−1
Link level, macro cell, 50 km/h
Eb/N0 per antenna /dB
BE
R
Rake 4 usersMUD 10 usersRake 3 usersSingle user
Figure 32. BER as a function of Eb/N0 in macro cell channel
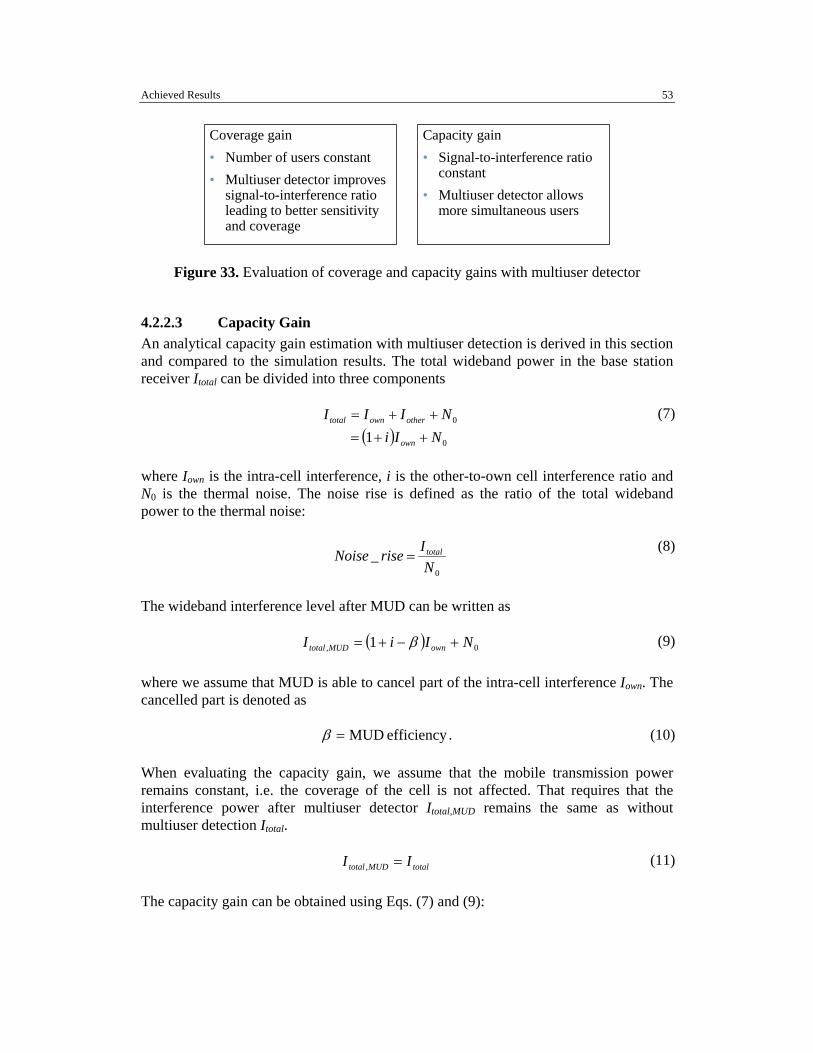
Achieved Results 53
Coverage gain• Number of users constant• Multiuser detector improves
signal-to-interference ratio leading to better sensitivityand coverage
Capacity gain• Signal-to-interference ratio
constant• Multiuser detector allows
more simultaneous users
Figure 33. Evaluation of coverage and capacity gains with multiuser detector
4.2.2.3 Capacity Gain An analytical capacity gain estimation with multiuser detection is derived in this section and compared to the simulation results. The total wideband power in the base station receiver Itotal can be divided into three components
( ) 0
0
1 NIiNIII
own
otherowntotal
++=++=
(7)
where Iown is the intra-cell interference, i is the other-to-own cell interference ratio and N0 is the thermal noise. The noise rise is defined as the ratio of the total wideband power to the thermal noise:
0
_NIriseNoise total= (8)
The wideband interference level after MUD can be written as
( ) 0, 1 NIiI ownMUDtotal +−+= β (9) where we assume that MUD is able to cancel part of the intra-cell interference Iown. The cancelled part is denoted as
efficiency MUD=β . (10) When evaluating the capacity gain, we assume that the mobile transmission power remains constant, i.e. the coverage of the cell is not affected. That requires that the interference power after multiuser detector Itotal,MUD remains the same as without multiuser detection Itotal.
totalMUDtotal II =, (11) The capacity gain can be obtained using Eqs. (7) and (9):

54 A Study of UMTS Terrestrial Radio Access Performance
( ) ( ) 00 1_1 NIiNIgainCapacityi ownown ++=+⋅⋅−+ β (12) Solving the equation above gives the capacity gain
β−++
=i
iainCapacity_g1
1 (13)
Assuming efficiency β of 65% and typical macro cellular other-to-own cell interference ratio i of 0.65, we obtain a capacity gain of 65%. The capacity gain as a function of the efficiency is shown in Figure 34. In micro cellular environment the cells tend to have higher isolation making other-to-own cell interference ratio smaller. The assumed value is i=0.3. Assuming multiuser detector efficiency β of 65%, gives a capacity gain of 100% in micro cellular environment. Reference [P5] presents system simulations with multiuser detection to show the increase in the cellular capacity obtained by using multiuser detection. The capacity is studied in urban micro and macro cell environments assuming multiuser detection efficiency of 65%. The other-to-own cell interference ratio in the simulation was 0.38. These values in Eq. (13) would give a capacity gain of 89% while the simulations are showing a capacity gain of 96%. The calculated and the simulated values are close to each other.
0 20 40 60 80 1000
50
100
150
200
250
300
350
MUD efficiency [%]
[%]
Capacity gain
i=0.30 (micro)i=0.65 (macro)
Figure 34. Capacity gain with multiuser detector

Achieved Results 55
4.2.2.4 Coverage Gain The coverage gain is evaluated assuming that the number of mobile stations remains constant, i.e. the capacity of the cell is not affected. The coverage gain is defined as the decrease in the mobile station output power, which alternatively could be used to extend the cell range. The interference power Itotal,MUD after MUD is decreased as follows
( ) 0, _1 N
gainCoverageI
iI ownMUDtotal +−+= β (14)
The coverage gain is equal to the reduction in the interference power after MUD:
( )( )
( )
( ) 1_
11
11_
_1
1_
_
0
0
0
0
,
+⋅⋅−+
+⋅+=
+⋅−+
+⋅+=
=
NI
gainCoveragei
NIi
gainCoverage
NgainCoverage
Ii
NIigainCoverage
IIgainCoverage
own
own
own
own
MUDtotal
total
β
β
(15)
Using Eqs. (7) and (8) gives
iriseNoise
NIown
+−
=1
1_
0
(16)
Solving Coverage_gain from Eqs. (15) and (16) gives the coverage gain
( )i
ainCoverage_g+
−+=
11rise Noise1 β (17)
The coverage gain as a function of the initial noise rise is shown in Figure 35 and in Table 15 assuming multiuser detector efficiency β of 65% and other-to-own cell interference ratio i of 0.65. The coverage gain of multiuser detection increases when the loading increases. If the noise rise is 4.0 dB without multiuser detection, the coverage gain is 2.0 dB. The link level improvement of 2.0 dB corresponds to 14% larger cell range with path loss exponent of 3.5 and 30% larger cell area using Eq. (5). The noise rise of 4.0 dB corresponds to 60% load factor that was assumed in Table 6. In the initial deployment phase the noise rise typically is smaller than 4.0 dB. If the noise rise is 2.0 dB originally, the introduction of multiuser detection receiver improves the coverage by 0.9 dB. The link level improvement of 0.9 dB can be used to increase the cell area by 13%.

56 A Study of UMTS Terrestrial Radio Access Performance
0 1 2 3 4 5 60
0.5
1
1.5
2
2.5
3
3.5
Noise rise without MUD [dB]
[dB
]
Coverage gain [dB]
Figure 35. Link level coverage gain with multiuser detector in macro cell environment
Table 15. Coverage gains in cell area with multiuser detector
Noise rise without MUD
Coverage gain in the link performance [dB]
Increase in cell area with path loss exponent of 3.5
1.0 dB 0.4 dB 5% 2.0 dB 0.9 dB 13% 3.0 dB 1.4 dB 20% 4.0 dB 2.0 dB 30% 5.0 dB 2.7 dB 43% 6.0 dB 3.4 dB 56%
4.2.2.5 3GPP Specifications and Products In this section we consider the expected gain of the multiuser detection from the system performance point of view. The multiuser detection algorithm presented above can be applied to the 3GPP Release 99 base station products. In the initial WCDMA deployment phase the limiting factor is the uplink coverage [3]. We can assume that the uplink noise rise is below 2 dB in the initial phase because the amount of traffic is low. In that case the maximum coverage gain is below 1 dB according to Table 15. This gain is relatively small compared to those gains of 2.5–3.0 dB provided by simple antenna structures in Section 4.2.3. When the amount of traffic in the network increases, the downlink capacity typically becomes the limiting factor since more traffic is expected to the downlink than to the uplink. The capacity increase of the base station receiver solutions apply only to the uplink but do not improve the downlink capacity. The base station multiuser detection
Achieved Results 57
receivers may become more important with new frequency allocations if more spectrum is allocated for the downlink than for the uplink. The discussion above applies for UTRA FDD and all the simulation results with multiuser detection in this work are done for UTRA FDD. The base station multiuser detection, however, is more important in UTRA TDD than in UTRA FDD. The main reasons for the differences are
− UTRA TDD does not use fast power control which results into higher near-far problems than in UTRA FDD. Also, UTRA TDD uses smaller spreading factors than UTRA FDD which are not able to cope with the high near-far values. Because of these reasons there is more need for multiuser detection in UTRA TDD.
− The maximum number of simultaneous users per time slot in UTRA TDD is 16 which makes the implementation of multiuser detection receivers easier than in UTRA FDD where the number of simultaneous users can exceed 100.
− UTRA TDD can reallocate capacity from uplink to downlink by moving the duplex switching point. All uplink capacity improvements, like multiuser detection, can be used to increase the downlink capacity as well.
The multiuser detection for UTRA TDD type of system has been extensively evaluated in [19, 20, 21 and 56]. 4.2.3 UTRA FDD Base Station Antenna Solutions
4.2.3.1 Antenna Configurations In this section the performance of base station antenna solutions is evaluated both in the simulations and in the measurements. In the initial deployment phase it is important to improve the coverage to be able to provide third generation services to as many customers as possible, and to reduce the required number of base station sites and the related costs. The uplink coverage can be extended by improving the base station sensitivity. That sensitivity improvement can be achieved with
1. base station radio frequency, RF, solutions, like lower noise figure 2. base station baseband solutions, like multiuser detection 3. base station antenna solutions, like higher order diversity
The 3GPP sensitivity requirement of –121 dBm for 12.2 kbps voice [31] implies a RF noise figure of approximately 5 dB assuming Eb/N0 performance of 7 dB. The average base station noise figures are even lower because all the products must meet that minimum requirement. Since the RF noise figures are already so low, it is difficult to obtain a substantial coverage gain in the RF area with today’s component technology. The coverage gains of multiuser detection are evaluated in Section 4.2.2.4 and shown to be typically below 2 dB.

58 A Study of UMTS Terrestrial Radio Access Performance
In this section the base station antenna solutions are evaluated as a potential way of improving the coverage. The evaluated antenna configurations are shown in Figure 36. A beam here refers to the spatial filtering that is applied before the Rake receiver. A beam can be obtained with analog filtering or with digital filtering. The antenna assumptions are shown in Table 16. The antenna gain is assumed to be 3 dB and 6 dB higher for 2-beam and for 4-beam solutions correspondingly than for 4-branch diversity. On the other hand, diversity solutions can collect more energy through multiple diversity branches and take also benefit of the increased diversity. Taking benefit of the increased diversity requires that the channel parameters – multipath amplitude and phase – of each diversity branch are estimated for the coherent combining. The following performance evaluation is essentially comparing a higher antenna gain to the increased diversity with realistic channel estimation from the coverage point of view. The reference point is 2-branch diversity without beams. Maximum ratio combining of different diversity branches is assumed in the simulations and in the measurements. It is shown in [57] that the performance of maximum ratio combining cannot be improved by using interference rejection combining with practical WCDMA uplink data rates since there are no dominant interferers but the received power of each individual interferer is clearly below the total noise and interference power.
4 beamsno diversity
2 beams2-branch diversity
1 beam4-branch diversity
Figure 36. Antenna configurations per 60-degree sector
Table 16. Antenna gain and diversity branches
4-beam 2-beam, 2-branch diversity
4-branch diversity
Relative antenna gain 6 dB 3 dB 0 dB Number of multipath components to be estimated
L 2⋅L 4⋅L
4.2.3.2 Simulation Results The simulations are done in ITU Pedestrian A channel which provides limited multipath diversity and in ITU Vehicular A channel with provides clearly more multipath diversity [28]. The simulated bit rates are 8 kbps speech and 144–384 kbps packet data. The coverage gain is evaluated at the edge of the coverage area when the mobile is transmitting with constant full power. Therefore, the coverage gain is simulated without

Achieved Results 59
fast power control. In this section we present the simulation results for packet data. The more detailed simulation results including voice service can be found from [P11]. The simulated coverage gain as compared to 2-branch diversity without beams is shown in Figure 37. The results show that 4-branch diversity provides clearly the best performance of the studied antenna configurations in ITU Pedestrian A channel with little multipath diversity. The difference between 4-branch diversity and 4-beam solution is 3 dB in single link case. The 4-branch diversity shows the importance of additional diversity in case the amount of multipath diversity is low. The difference between the antenna configurations is below 1 dB when there is more multipath diversity in ITU Vehicular A. When the mobile is in soft handover and is able to obtain macro diversity, the beamforming solutions perform better than in the case of single link. The macro diversity is beneficial for the beamforming that does not have the benefit of the antenna diversity. In ITU Vehicular A channel the 4-beam configuration performs slightly better than 4-branch diversity because the 4-branch diversity suffers from the high number of channel parameters that need to be estimated for the coherent combining. The 4-branch diversity need to estimate channel parameters for each 5 multipath components from each 4 antennas from 2 soft handover base stations, i.e. total 40 independent parameters.
0
1
2
3
4
Single link Soft handover Single link Soft handover
Gai
n ov
er 2
-bra
nch
dive
rsity
[dB
]
4-diversity2-beam, 2-diversity4-beam
ITU Pedestrian A ITU Vehicular A
Figure 37. Simulated coverage gain compared to 2-branch diversity We can conclude from the simulations that the coverage performance of these three antenna configurations in ITU Vehicular A channel is very similar and the performance differences are small, below 1 dB. When the amount of multipath diversity is low, the 4-branch diversity is the preferred solution.

60 A Study of UMTS Terrestrial Radio Access Performance
The simulation results above assume that all the diversity branches are uncorrelated which implies that the separation of the antennas must be large. From practical site solution point of view it is desirable to have a small antenna configuration. When the antennas are close to each other, the received signals are correlated. The following simulation results show the effect of antenna correlation with 4-branch receiver diversity. It is assumed that the 4-branch diversity is obtained with two polarization diversity antennas as shown in Figure 39. It is further assumed that the polarization branches are uncorrelated. With small antenna separation the correlation of the same polarization directions increases. The simulation results are shown in Figure 38. The results show that the effect of antenna correlation is higher in ITU Pedestrian A channel which has less multipath diversity than ITU Vehicular A. The performance difference between the correlation of 0.0 and 1.0 in ITU Pedestrian A channel is 1.5 dB and in ITU Vehicular A channel 0.5 dB. The effect of the antenna correlation is small in ITU Vehicular A channel because the received signal has enough diversity already without uncorrelated antennas: multipath diversity and polarization diversity. The remaining fading of the signal is so small that the additional diversity with uncorrelated antennas brings only marginal gain. In ITU Pedestrian A the effect of antenna correlation is larger because the amount of multipath diversity is lower.
0
1
2
3
4
0.0 0.7 1.0
Antenna correlation
Gai
n ov
er 2
-bra
nch
dive
rsity
[dB
]
ITU Pedestrian AITU Vehicular A
Figure 38. Simulated coverage gain of 4-branch diversity with correlated antennas
The coverage gain of 4-branch diversity with antenna correlation of 1.0 and with ideal channel estimation and coherent combining should be 3 dB. The 3-dB gain comes from the fact that two times more antenna branches can ideally collect two times more energy, and there is no additional diversity gain with fully correlated antennas. The corresponding simulated gains are 2.4 dB in ITU Vehicular A and 2.5 dB in ITU Pedestrian A in Figure 38, which show that the performance loss due to channel
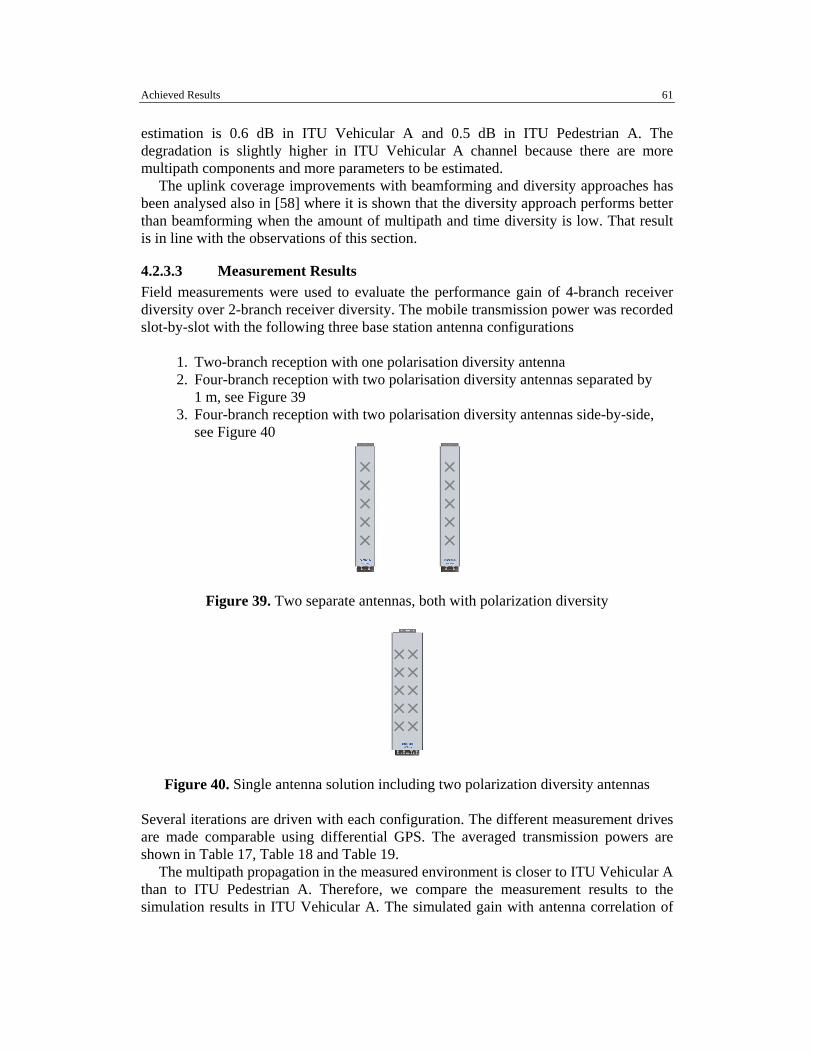
Achieved Results 61
estimation is 0.6 dB in ITU Vehicular A and 0.5 dB in ITU Pedestrian A. The degradation is slightly higher in ITU Vehicular A channel because there are more multipath components and more parameters to be estimated. The uplink coverage improvements with beamforming and diversity approaches has been analysed also in [58] where it is shown that the diversity approach performs better than beamforming when the amount of multipath and time diversity is low. That result is in line with the observations of this section.
4.2.3.3 Measurement Results Field measurements were used to evaluate the performance gain of 4-branch receiver diversity over 2-branch receiver diversity. The mobile transmission power was recorded slot-by-slot with the following three base station antenna configurations
1. Two-branch reception with one polarisation diversity antenna 2. Four-branch reception with two polarisation diversity antennas separated by
1 m, see Figure 39 3. Four-branch reception with two polarisation diversity antennas side-by-side,
see Figure 40
Figure 39. Two separate antennas, both with polarization diversity
Figure 40. Single antenna solution including two polarization diversity antennas Several iterations are driven with each configuration. The different measurement drives are made comparable using differential GPS. The averaged transmission powers are shown in Table 17, Table 18 and Table 19. The multipath propagation in the measured environment is closer to ITU Vehicular A than to ITU Pedestrian A. Therefore, we compare the measurement results to the simulation results in ITU Vehicular A. The simulated gain with antenna correlation of

62 A Study of UMTS Terrestrial Radio Access Performance
0.0 is 2.9 dB in ITU Vehicular A [P12]. The measurement results with 1 m separation between the antennas show a gain of 2.5−3.3 dB. On average, the measurement results are close to the simulated values. The simulated difference between the antenna correlation of 1.0 and 0.0 is 0.5 dB. The measured difference is only 0.2−0.4 dB. In the measurements the antenna correlation is never completely 0.0 and 1.0, which explains the smaller difference in the measurements than in the simulations.
Table 17. Measurement results on route A Antenna separation 2-branch 4-branch 4-branch gain 1 m separation 6.95 dBm 4.44 dBm 2.5 dB no separation 6.95 dBm 4.83 dBm 2.1 dB
Table 18. Measurement results on route B
Antenna separation 2-branch 4-branch 4-branch gain 1 m separation 7.90 dBm 4.59 dBm 3.3 dB no separation 7.90 dBm 4.86 dBm 3.0 dB
Table 19. Measurement results on route C
Antenna separation 2-branch 4-branch 4-branch gain 1 m separation 5.63 dBm 2.54 dBm 3.1 dB
The receiver in the simulations had maximum 20 Rake fingers while the base station in the measurements had maximum 8 Rake fingers. The effect of the number of Rake fingers was evaluated in the simulations shown in Figure 40. With 8 fingers the required Eb/N0 is 0.6 dB higher than with 20 Rake fingers. This difference is not taken into account in the analysis of the measurement results. The field measurements include a number of factors that cannot be controlled and may affect the accuracy of the results, for example, changing environment and varying mobile speeds from one drive to another. These possible inaccuracies were tackled by taking the average values from several measurements and by comparing only relative values between two antenna configurations. The WCDMA fast power control also contributes to the accuracy of the results by keeping the received power level constant. Another source of inaccuracy comes from the measurement accuracy of the mobile transmission power since the measurements are based on the power values that are reported by the mobile. A broader picture of the antenna performance could be obtained by more extensive measurements using
− a number of different measurement environments. Only one base station antenna location was tested here.
− a number of different base station receiver algorithms. Only one channel estimation algorithm was tested here.
− a number of different real mobiles station. Only one type of test mobile was used here.

Achieved Results 63
1.E-02
1.E-01
1.E+00
-3.0 -2.0 -1.0 0.0 1.0 2.0Eb/N0 [dB]
BLER
8 rake fingers20 rake fingers
Figure 41. Simulated performance of 4-branch diversity with 8 and 20 Rake fingers
4.3 Evaluation of UTRA TDD Interference The spectrum allocation for UMTS is shown in Figure 42: for UTRA FDD 2 x 60 MHz and for UTRA TDD 15 + 20 MHz are allocated. Both FDD and TDD modes are needed to fully utilize the existing spectrum. In ETSI the air interface for the 3rd generation system is WCDMA for the paired FDD (frequency division duplex) bands and Time Division Code Division Multiple Access TD/CDMA for the unpaired TDD (time division duplex) bands. The UTRA TDD mode is introduced in [56]. There are a few characteristics that are typical of TDD systems and different from FDD systems. Those characteristics are listed below and they apply for UTRA TDD as well.
− Utilization of an unpaired band. The TDD system can be implemented on an unpaired band, while the FDD system always requires a pair of bands.
− Flexible capacity allocation between uplink and downlink. Uplink and
downlink are divided in the time domain in TDD operation. It is possible to change the duplex switching point and move capacity from uplink to downlink, or vice versa, if the capacity requirement is asymmetric between uplink and downlink.
− Interference between uplink and downlink. Since both uplink and downlink
share the same frequency in TDD, the signals of the two transmission directions can interfere with each other.

64 A Study of UMTS Terrestrial Radio Access Performance
TDD UMTSFDD uplink
UMTSsatelliteTDD UMTS
FDD downlinkUMTSsatellite
MHz
1900 1920 1980 2010 2025 2110 2170
Figure 42. UMTS Spectrum allocation The interference between uplink and downlink is evaluated in this section. The interference may occur if the cells are not synchronized or if different capacity split between uplink and downlink is used. The overlapping part is referred to as synchronization error. An example scenario is shown in Figure 43 where mobile to mobile interference can occur at the cell border if different asymmetry is used in the neighbouring cells.
BTS 1 BTS 2
Cell 1 Cell 2
MS1->BTS1
MS 1 MS 2
BTS1->MS1
MS2->BTS2 BTS2->MS2
Interference from MS2 to MS1
Different asymmetryCells are frame synchronized
Figure 43. Interference between uplink and downlink between two mobiles
With toffset as the absolute frame offset and tslot the duration of one time slot, the frame synchronization error is given by the ratio
slot
offseterror t
t=α .
(18)
The effect of the interference is simulated as a function of the frame synchronization error αerror. In the synchronized case αerror = 0.01 with 1 % offset representing a non-ideal synchronization. Similarly, αerror = 0.99 is assumed to be the frame synchronized case employing opposite transmission directions, i.e. the base station in the middle cell

Achieved Results 65
is receiving while the base stations in the adjacent cells are transmitting. αerror = 0.5 gives the results for a non-synchronized case with an offset time toffset of half the duration of a time slot tslot. The total amount of interference received during one slot is the combination of the interference from the other-cell base stations and from the other-cell mobiles as shown Figure 44.
TXTX
BTS1MS1
TXTX
BTS2MS2
Downlink Uplink
TXtoffset
tslot
Interference from BTS1
Interference from MS1
Figure 44. Modelling of the overlapping of uplink and downlink
The uplink simulation results are given as the percentage of the capacity M with interference compared to the single cell capacity without any inter-cell interference Mo. The case of M/Mo = 1 indicates that the additional inter-cell interference does not reduce the capacity in the cell of interest, whereas M/Mo = 0 means that the capacity is completely destroyed in the time slot under consideration. The downlink simulation results are given as the percentage of the cell area where the required signal-to-interference ratio can be met. 4.3.1 Intra-Operator Interference Evaluation The simulation results for a co-channel interference scenario with a bit rate of 16 kbps are presented below. The bit rate of 16 kbps assumes a spreading factor of 8 in UTRA TDD, and therefore, the maximum number of 16-kbps users per slot is 8. The values of the synchronization error αerror as well as the number of users in the interfering time slots are varied. The simulation results are shown in Figure 45. The uplink capacity degrades quite linearly as the portion of the base station-to-base station interference increases, i.e. αerror increases, in Figure 45 a). For only one user in each interfering cell, 68 % of the initial capacity is left in the worst case (αerror = 0.99). If there are 4 users per slot in the neighboring cells, 70 % of the single cell capacity is left for the synchronized case (αerror = 0.01), and with 17 % time offset or more, there is no capacity left in the middle cell.

66 A Study of UMTS Terrestrial Radio Access Performance
The downlink performance is not as sensitive to the frame synchronization as the uplink performance. In the one-user case, the performance degrades only slightly, as the portion of the mobile-to-mobile interference increases (αerror increases). The 4–8 users case is different: 4 or more users is not possible in multi-cell case even if the cells are synchronized. 4 users can be served 25% of the cell are in opposite transmission directions are used.
0.1 0.2 0.3 0.4 0.5 0.6 0.7 0.8 0.90
0.1 0.2 0.3 0.4 0.5 0.6 0.7 0.8 0.9
1
Frame synchronization error
M/M
o
Remaining Uplink Capacity Remaining TDD Uplink Capacity
Same Channel Interference, Continuous Coverage
1 x 16 kbps 4 x 16 kbps 8 x 16 kbps
0.1 0.2 0.3 0.4 0.5 0.6 0.7 0.8 0.9 0
0.1
0.2
0.3
0.4
0.5
0.6
0.7
0.8
0.9
1
Frame synchronization error
Eb/No achieved per cell area
1 x 16 kbps 4 x 16 kbps 8 x 16 kbps
The TDD Cell Area that Fulfils the Eb/No Requirement,Same Channel Interference, Continuous Coverage
Fractionof theCellArea
0.01 0.010.99 0.99
a) Uplink b) Downlink
Figure 45. The effects of the same channel TDD-to-TDD interference with different loads in the interfering cells and different values of the frame synchronization error
αerror The study shows that synchronization of the adjacent cells is beneficial for UTRA TDD uplink performance. It is not possible to use a full loading in all times slots in adjacent cells, and dynamic channel allocation should be used to optimise the resource allocation. 4.3.2 Inter-Operator Interference Evaluation The scenario considered for evaluating the inter-operator interference is shown in Figure 46. The cell of interest with an inner radius 100 m is in the middle and is surrounded by two tiers (six cells in the inner and twelve in the outer tier) of interfering cells of inner radius 100 m. The cells are arranged so that they produce continuous coverage but do not overlap. It is assumed that cells beyond the second tier around the center cell do not contribute significantly to the interference levels. An adjacent channel protection of 30 dB is assumed in the simulations. The adjacent channel protection is shown in Figure 47. The simulation results for adjacent channel interference for 4 users per slot and for 8 users per slot in the interfering TDD cells are shown in Figure 48 and Figure 49. The results for different synchronization scenarios are shown as a function of the base station separation. The bit rate is set to 16 kbps.

Achieved Results 67
-400 -200 0 200 400 600
-400
-300
-200
-100
0
100
200
300
400
-400 -200 0 200 400 600
-400
-300
-200
-100
0
100
200
300
400
-400 -200 0 200 400 600
-400
-300
-200
-100
0
100
200
300
400
-400 -200 0 200 400 600
-400
-300
-200
-100
0
100
200
300
400
Cell of interest
Interfering cells
Figure 46. Simulation scenario for adjacent channel interference
Frequency
5 MHz 5 MHz 5 MHz
Adjacent channel protectionof 30 dB assumed
Figure 47. Adjacent channel protection assumption
The co-location of the base stations destroys the uplink capacity if synchronization is not used. The base station separation less than 5 m is considered as co-location in this work. When the base stations are co-located, the UTRA TDD system works only if the operators' base stations are synchronized, i.e. αerror = 0.01. In the case of synchronized base stations 92% of the single cell capacity is achieved if the interfering cells on the adjacent frequency have 4 users per time slot. If the number of users is increased to 8, the interference levels increase and the remaining capacity is 42% of the single cell capacity is achieved. As the distance between the base stations becomes larger, the capacity figures improve. It can be seen in Figure 48 a) and Figure 49 a) that the capacity is relatively independent of the frame synchronization error of the two systems, if the distance between the base stations is at least 50 m, i.e. half of the cell radius 100 m. Figure 48 a) shows that for distances smaller than 50 m more capacity is gained in the synchronized case (αerror = 0.01).

68 A Study of UMTS Terrestrial Radio Access Performance
In the downlink, the performance does not depend as strongly on the base station separation as in uplink. Slightly better performance can be obtained with αerror = 0.99 with opposite transmission directions when the adjacent operator’s base stations are at the edge of the other operator’s cell areas. In all cases the required quality can be obtained in 70–90% of the cell area. The study shows that the co-location of two operators’ UTRA TDD base stations is feasible only if the networks are synchronized and if an identical split between uplink and downlink is used. The synchronization is needed to guarantee the uplink performance. If the base stations are not co-located, the synchronization is not necessary. According to the latest 3GPP specifications the adjacent channel protection between base stations will be higher than the assumed 30 dB in this thesis [59]. The results in this thesis are pessimistic with small base station separations. The effect of the adjacent channel interference in UTRA TDD has been evaluated also in [60]. The results show that from the uplink point of view synchronized case is preferred while the opposite transmission directions are preferred from the downlink point of view. Dynamic channel allocation algorithms are proposed to find the optimum transmission direction.
10 20 30 40 50 60 70 80 90 1000
0.1 0.2 0.3 0.4 0.5 0.6 0.7 0.8 0.9
1
BS separation m
M/M
o
Remaining Uplink Capacity
= 0.01 = 0.50 = 0.99
Remaining TDD Uplink Capacity,Adjacent Channel Interference, Load = 4 x 16 kbps,
Continuous Coverage
α = 0.01α = 0.50α = 0.99
10 20 30 40 50 60 70 80 90 1000
0.1
0.2
0.3
0.4
0.5
0.6
0.7
0.8
0.9
1
BS separation m
4.014.504.99
α = 0.01 α = 0.50 α = 0.99
The TDD Cell Area that Fulfils the Eb/No Requirement, Adjacent Channel Interference, Load = 4 x 16 kbps,
Continuous Coverage
Fractionof theCellArea
a) Uplink b) Downlink Figure 48. The effects of the adjacent channel TDD-to-TDD interference with different
base station separations and values of the frame synchronization error αerror. The loading is 4 x 16 kbps.

Achieved Results 69
10 20 30 40 50 60 70 80 90 1000
0.1 0.2 0.3 0.4 0.5 0.6 0.7 0.8 0.9
1
BS separation m
M/M
o Remaining Uplink Capacity
= 0.01 = 0.50 = 0.99
Remaining TDD Uplink C itAdjacent Channel Interference, Load = 8 x 16 kbps,
Continuous Coverage
α = 0.01α = 0.50α = 0.99
10 20 30 40 50 60 70 80 90 1000
0.1
0.2
0.3
0.4
0.5
0.6
0.7
0.8
0.9
1
BS separation m
Eb/No achieved per cell area
8.018.508.99
α = 0.01 α = 0.50 α = 0.99
The TDD Cell Area that Fulfils the Eb/No R i tAdjacent Channel Interference, Load = 8 x 16 kbps
Continuous Coverage
Fractionof theCellArea
a) Uplink b) Downlink Figure 49. The effects of the adjacent channel TDD-to-TDD interference with different base station separations and values of the frame synchronization error α. The loading is
8 x 16 kbps.

Conclusions 71
5 CONCLUSIONS The thesis considered the performance evaluation of UMTS Terrestrial Radio Access (UTRA) network. The performance was evaluated using theoretical calculations, link and system level simulations, and laboratory and field measurements. The thesis showed that the different evaluation approaches could be used to verify the simulation assumptions and to obtain more reliable results. The applied evaluation methods were shown to give similar results and these methods are applicable for the performance evaluation. The average UTRA Frequency Division Duplex (FDD) capacity was evaluated to be 600–1000 kbps per sector per 5 MHz carrier. The capacity was shown to be sensitive to the assumptions regarding environment and transceivers. It was further shown that user bit rates up to 2 Mbps can be supported locally for packet services, but not for circuit switched connections with full coverage. The thesis demonstrated that the WCDMA performance could be improved with advanced receiver structures and packet data techniques. The soft combining of the retransmissions was shown to improve capacity up to 60%. The receiver baseband multiuser detection was shown to improve uplink coverage by 1–2 dB and uplink capacity up to 100%. The 4-branch antenna solution was shown to improve uplink coverage up to 3 dB. UTRA Time Division Duplex (TDD) was studied as a solution to enhance UTRA FDD capacity. The results show that it is beneficial to synchronize UTRA TDD base stations to improve the uplink performance. The study also shows that the co-location of two operators’ UTRA TDD base stations is feasible only if the networks are synchronized and if an identical split between uplink and downlink is used. The dynamic radio resource management algorithms will affect the system capacity and service quality. The system simulation results in this thesis are based on static system simulations and can be obtained only if the resource management algorithms are properly designed and implemented. Further simulation studies are needed to optimise these algorithms, and to quantify their effect to the system capacity. When there are large UMTS networks running, the capacity and coverage could be tested in the network trials with real products, real environments and real user behaviour. These measurements can help improving the accuracy of the simulation modelling, and help in a faster development of new features in 3GPP standard and in the radio network and terminal products.


Main Contents and Contributions of the Publications 73
6 MAIN CONTENTS AND CONTRIBUTIONS OF THE PUBLICATIONS The main contents of the publications are summarized in this section. Westman, T. and Holma, H. “CDMA System for UMTS High Bit Rate Services”, IEEE Vehicular Technology Conference VTC’97, Phoenix, Arizona, May 4–7, 1997, in proceedings pp. 825–829. The performance of 2 Mbps with WCDMA is considered in this paper. The performance is evaluated by link level simulations, cell range calculations and network level capacity simulations in urban macro cell, urban street micro cell and indoor cell environment using three operator bandwidths. The required uplink Eb/N0 values are low even with lowest studied bandwidth of 5.1 Mcps because of antenna diversity and multiuser detection. The required downlink Eb/N0 values are also low with large bandwidths of 10.22 and 20.46 Mcps but suffers from multipath propagation and inter-symbol interference with 5.1 Mcps. Sufficient cell ranges can be realized using reasonable power levels in the indoor and micro cell environments. The uplink capacity was clearly higher than the downlink capacity because of antenna diversity and multiuser detection. The uplink capacity in macro cells was typically 0.16 users/MHz/sector. The corresponding downlink capacity was 0.05 users/MHz/sector. The results show that supporting one active 2-Mbps user in every cell simultaneously requires 15 - 20 MHz bandwidth. Pehkonen, K., Holma, H., Keskitalo, I., Nikula, E. and Westman, T. “A Performance Analysis of TDMA and CDMA Based Air Interface Solutions for UMTS High Bit Rate Services”, IEEE International Symposium on Personal, Indoor and Mobile Radio Conference PIMRC’97, Helsinki, September 1–4, 1997, in proceedings pp. 22–26. This paper presents a performance comparison between four TDMA schemes and one CDMA scheme that all can provide the user data rate of 2-Mbps. The evaluation considers link level performance, noise limited uplink range and cellular capacity. The results show that the performance of these different schemes is very similar when the transmission of 2-Mbps user data is considered. Advanced receiver structures including interference cancellation can be used to improve the capacity of both TDMA and CDMA networks. Hämäläinen, S., Holma, H., Toskala, A. and Laukkanen, M. “Analysis of CDMA Downlink Capacity Enhancements”, IEEE International Symposium on Personal, Indoor and Mobile Radio Conference PIMRC’97, Helsinki, September 1–4, 1997, in proceedings pp. 241–245. WCDMA downlink capacity is considered in this paper using system simulator. The capacity enhancements with downlink interference cancellation are evaluated. The results show that the WCDMA downlink capacity is typically 170 kbps/MHz/cell in macro cells and 220 kbps/MHz/cell in micro cells. If the intra-cell interference could be fully removed, the macro cell capacity would be 500 kbps/MHz/cell and in micro cells 440 kbps/MHz/cell. The results also show that the cancellation of the intra-cell interference is more important for the capacity than the inter-cell interference.

74 A Study of UMTS Terrestrial Radio Access Performance
Hämäläinen, S., Slanina, P., Hartman, M., Lappeteläinen, A. and Holma, H. “A Novel Interface Between Link and System Level Simulations”, ACTS Mobile Telecommunications Summit’97, Aalborg, Denmark, October 7-10, 1997, in proceedings pp. 599–604. This paper presents the conventional way to interface link and system level, and a novel approach developed, and comparison of the two methods. The new method, referred here as actual value interface, is a more accurate way to build an interface between link and dynamic system level simulations. This paper describes the two approaches and deals with advantages and disadvantages of actual and average value interfaces. Both CDMA and TDMA systems are considered in this paper. Toskala, A., Hämäläinen, S. and Holma, H. “Link and System Level Performance of Multiuser Detection CDMA Uplink”, Wireless Personal Communications, Issue 8, Kluwer Academic Publisher, 1998, pp. 301–320. The link level performance and the cellular system capacity in the uplink direction of a CDMA cellular system utilising multiuser detection base station receivers is analysed by simulation. Parallel multistage multiuser detection is employed together with two-antenna diversity reception and fast closed-loop power control. A system level simulator is built to utilise the link level simulation results and to show the increase in cellular capacity obtained by using multiuser detection. The capacity is studied in urban micro and macro-cell environments. The system level simulator is calibrated with analytical capacity calculations. The link level simulation shown that the multiuser detector is able to remove 60–70% of the intra-cell interference. The system level simulations show capacity improvements of over 100% in micro cell environment and up to 100% in macro cellular environment. Holma, H., Toskala, A. and Latva-aho, M., “Asynchronous Wideband CDMA for IMT-2000”, Telecommunications Review, SK Telecom Co., Ltd, Vol. 8, No. 6, 1998, pp. 1007–1021. This paper presents an overview of the wideband CDMA concept which was chosen in ETSI (European Telecommunications Standards Institute) in January 1998 as a basis for UMTS air interface for FDD. The current 3GPP standard includes most of the solutions and parameters shown in this paper. Raitola, M. and Holma, H. “Wideband CDMA Packet Data with Hybrid ARQ”, IEEE International Symposium on Spread Spectrum Techniques & Applications ISSSTA'98, Sun City, South Africa, September 2–4, 1998, in proceedings pp. 318–322. The performance of WCDMA packet data with soft combining of packets is analysed in this paper. The results show that the soft combining can increase capacity up to 2 dB if no fast power control is used. With fast power control the gain is 0.3–2.0 dB. It is also shown that using slow power control instead of fast power control can increase packet data capacity 2–4 dB at slow mobile speeds.
Main Contents and Contributions of the Publications 75
Holma, H. and Heiska, K. “Performance of High Bit Rates With WCDMA Over Multipath Channels”, IEEE Vehicular Technology Conference VTC’99 Spring, Houston, USA, May 16-20, 1999, in proceedings pp. 25–29. This paper studies the performance of 512 kbps to 2 Mbps with WCDMA in multipath channels. The evaluation is based on the link level simulations with a Rake receiver in different multipath profiles. The performance of high bit rates in the air interface is affected by the multipath propagation. The multipath propagation gives diversity gain but causes also inter-path interference. The effect of inter-path interference is analyzed and the possible gains from advanced receiver structures in canceling inter-path interference are evaluated. The results show that inter-path interference can cause a degradation of about 2 dB for 2-Mbps transmission in 2-path Rayleigh fading channel if an ordinary Rake receiver is used. The more multipath components are present, the higher the degradation. It is also shown that the required transmission power is lower in multipath channels than in a 1-path channel because the multipath diversity gain is typically larger than the loss due to the inter-path interference. Hämäläinen, S., Holma, H. and Sipilä, K. “Advanced WCDMA Radio Network Simulator”, IEEE International Symposium on Personal, Indoor and Mobile Radio Conference PIMRC'99, Osaka, Japan, September 12–15, 1999, in proceedings pp. 951–955. This paper introduces a dynamic system level simulation tool: modelling principles, link and system level interface and application areas. The paper presents propagation modelling, interference modelling, traffic modelling, mobility modelling, and radio resource algorithm modelling. The application areas include development of radio resource management algorithms, capacity and coverage estimation, and network planning and optimisation. Holma, H., Lehtinen, O., Toskala, A. and Heikkinen, S., “Time Division Duplex Mode of UMTS Terrestrial Access”, IEEE Journal on Selected Areas on Communications, Special issue on Wideband CDMA, Volume: 18 Issue: 8, Aug. 2000, pp. 1386–1393. The interference between uplink and downlink in UTRA TDD is evaluated in this paper. This interference can occur between two terminals or between two base stations. The interference evaluation is based on the system simulations. The results show that the main problem is the interference between two base stations. Therefore, it is beneficial to frame synchronize the adjacent TDD cells of the same operator. The co-location of two operators UTRA TDD base stations in adjacent frequencies is feasible only if the networks are synchronized and if identical splitting between uplink and downlink is used. Tölli, A. and Holma, H. “Comparison of WCDMA Uplink Antenna Solutions with 4 Receiver Branches”, CDMA International Conference (CIC), South Korea, October 25-28, 2000, in proceedings pp. 57–61. In this paper base station antenna solutions with 4 receiver branches are studied for improving the coverage and capacity in WCDMA uplink compared to the traditional 2-branch diversity. The studied macro cellular antenna configurations include beamforming, antenna diversity and a combination of those two. It is shown in the

76 A Study of UMTS Terrestrial Radio Access Performance
paper that the 4-branch diversity provides the best performance in the environment with little multipath diversity. When the amount of multipath diversity is large, all the antenna configurations provide very similar performance. All the solutions provide typically 3-dB gain in uplink coverage over 2-branch diversity in macro cells. The uplink capacity increase is typically in the order of 100%. Holma, H. and Tölli A. “Simulated and Measured Performance of 4-branch Uplink Reception in WCDMA”, IEEE Vehicular Technology Conference VTC'2001 Spring, Greece, May 6–9, 2001, in proceedings pp. 2640–2644. In this paper a base station 4-branch receiver antenna solution is studied using simulations and field measurements as an approach to increase the coverage area of the WCDMA cell. The effect of the 4-branch reception to the uplink capacity is also studied. The simulations show that the four-branch reception gives an average coverage gain of 3 dB compared to the traditional 2-branch receiver diversity in ITU Vehicular A channel. When the amount of multipath diversity is lower, like in ITU Pedestrian A channel, the gain is higher - up to 4 dB. The 4-branch reception can be implemented with two polarisation diversity antennas. When the correlation of those antennas is 1.0, i.e. the antennas are very close to each other, the gain reduces 0.5 dB in ITU Vehicular A channel. The field measurements indicate an average reduction of 3 dB in the mobile transmission power, which is well in line with the simulation results. When the antennas are close to each other, the gain is reduced 0.2–0.4 dB which is also close to the corresponding simulation result. Holma, H., Soldani, D. and Sipilä, K. “Simulated and Measured WCDMA Uplink Performance”, IEEE Vehicular Technology Conference VTC'2001 Fall, Atlantic City, NJ, USA, October 7-11, 2001, in proceedings pp. 1148–1152. This paper studies the WCDMA mobile transmission power and its variations due to fast power control with theoretical calculations, simulations, laboratory measurements and field measurements. The effect of mobile speed, multipath profile and base station reception antenna diversity is studied. The results show that the mobile speed of 120 km/h requires less transmission power than low mobile speeds because of time diversity provided by interleaving. With little multipath diversity and without antenna diversity the difference in terms of transmitted power is up to 2 dB. The measurements and simulations show that the multipath diversity gain of ITU Vehicular A channel compared to ITU Pedestrian A channel is 3 dB without antenna diversity and 1 dB with antenna diversity at 3 km/h. At higher mobile speeds the multipath diversity gains are smaller. The base station antenna diversity gain is shown to be 3–4 dB in ITU Vehicular A channel and 4–6 dB in ITU Pedestrian A channel. The results show good agreement between simulations and measurements.
References 77
REFERENCES [1] Viterbi, A.J., CDMA: Principles of Spread Spectrum Communication, Addison-
Wesley Wireless Communications Series, Addison-Wesley, Reading, MA, 1995. [2] ETSI SMG2 WCDMA Evaluation Document Tdoc UMTS 111/97, November
1997. [3] Holma H. and Toskala A. (Editors.). “WCDMA for UMTS”. John Wiley & Sons,
April 2000, 344 p. [4] Laiho, J., Wacker, A. and Novosad, T. (Editors.). “Radio Network Planning and
Optimisation for UMTS”. John Wiley & Sons, November 2001, 484 p. [5] Hiltunen, K. and de Bernardi, R. “WCDMA Downlink Capacity Estimation”,
IEEE Vehicular Technology Conference VTC’2000-Spring, Tokyo, Japan, May 15–18, 2000, in proceedings pp. 992–996.
[6] Osselran, A. Ericson, M. Barta, J., Goransson, B. and Hagerman, B. “Downlink Capacity Comparison Between Different Smart Antenna Concepts in a Mixed Service WCDMA System”, IEEE Vehicular Technology Conference VTC’2001-Fall, Atlantic City, USA, October 7–11, in proceedings pp. 1528–1532.
[7] Butt, G. and Woodfield, K. “Experiences of Ericsson's WCDMA Evaluation System in the UK”, 3G Mobile Communication Technologies, 2000, pp. 14–18.
[8] Burley, S. “Downlink Capacity Estimation in a WCDMA Cellular Network”, IEEE International Symposium on Personal, Indoor and Mobile Radio Conference PIMRC’2001, San Diego, US, September 30–October 3, 2001, in proceedings pp. 26–30.
[9] Calin, D., Goeusse, F. and Sartori, P. “Performance and Interference Analysis of WCDMA System”, IEEE Vehicular Technology Conference VTC'2001 Spring, Greece, May 6–9, 2001, in proceedings pp. 2479–2483.
[10] Jones, P. and Owen, R. “Sensitivity of UMTS FDD System Capacity and Coverage to Model Parameters”, 3G Mobile Communication Technologies, 2000. pp. 224–229.
[11] Haardt, M., Klein, A., Koehn, R., Oestreich, S., Purat, M., Sommer, V. and Ulrich, T. “The TD-CDMA Based UTRA TDD Mode”, IEEE Journal on Selected Areas in Communications, Volume: 18 Issue: 8, Aug. 2000, pp. 1375–1385.
[12] Bahrenburg, S., Euscher, C., Mayer, J., Schlee, J., Weber, T. “Outdoor Measurements with a TD (time division)-CDMA Hardware Demonstrator for UMTS”, IEEE International Symposium on Spread Spectrum Techniques & Applications ISSSTA'98, Sun City, South Africa, September 2–4, 1998, in proceedings pp. 625–629.
[13] Lister, D., Dehghan, S., Owen, R. and Jones, P. “UMTS Capacity and Planning Issues”, 3G Mobile Communication Technologies, 2000. pp. 218–223.
[14] Joyce, R.M., Griparis, T., Swinburne, M. and Rouz, A. “Orange/Fujitsu Wideband CDMA Field Trials-system Overview”, 3G Mobile Communication Technologies, 2000, pp. 6–10.
[15] Juntti, M. “Multiuser Demodulation for DS-CDMA Systems in Fading

78 A Study of UMTS Terrestrial Radio Access Performance
Channels”, Ph.D. Thesis, University of Oulu, 1998. [16] Johansson, A.-L., ”Successive Interference Cancellation in DS-CDMA Systems”,
Ph.D. Thesis, Chalmers University of Technology, 1998. [17] Latva-aho, M. “Advanced Receivers for Wideband CDMA Systems”, Ph.D.
Thesis, University of Oulu, 1998. [18] Ojanperä, T. “Multirate Multi-user Detectors for Wideband Code Division
Multiple Access”, Ph.D. Thesis, Delft University, 1999. [19] Klein, A. ”Multiuser Detection of CDMA Signals - Algorithms and Their
Application to Cellular Mobile Radio”, PhD Thesis, Fortschrittberichte VDI, Reihe 10, No. 423, Düsseldorf: VDI-Verlag, University of Kaiserslautern, 1996.
[20] Vollmer, M., Haardt, M. and Gotze, J. “Comparative Study of Joint-detection Techniques for TD-CDMA Based Mobile Radio Systems”, IEEE Journal on Selected Areas in Communications, Volume: 19 Issue: 8, Aug. 2001, pp. 1461–1475.
[21] Blanz, J. “Emphangsantennendiversität in CDMA-Mobilfunksystemen mit Gemeinsamer Detection der Teilnehmersignale”, Ph.D. Thesis, University of Kaiserslautern, 1998.
[22] Klingenbrunn, T., “Downlink Capacity Enhancements of UTRA FDD Networks”, Ph.D. Thesis, Aalborg University, 2001
[23] Haas, H. and McLaughlin, S. “A Dynamic Channel Assignment Algorithm for a Hybrid TDMA/CDMA-TDD Interface Using the Novel TS-opposing Technique”, IEEE Journal on Selected Areas in Communications, Volume: 19 Issue: 10, Oct. 2001, pp. 1831–1846.
[24] Wacker, A., Laiho-Steffens, J., Sipilä, K. and Jäsberg, M., “Static Simulator for Studying WCDMA Radio Network Planning Issues”, IEEE Vehicular Technology Conference VTC’99 Spring, Houston, USA, May 16–20, 1999, in proceedings pp. 2436–2440.
[25] Adachi, F., Sawahashi, M. and Suda, H. “Wideband DS-CDMA for Next-generation Mobile Communications Systems”, IEEE Communications Magazine, Volume: 36 Issue: 9, September 1998, pp. 56 –69.
[26] http://www.elektrobit.fi/propsim/ [27] Grandell J. and Salonaho O. "Macro cell measurements with the Nokia WCDMA
Experimental System", IEE Antennas and Propagation Conference, Manchester, April 2001
[28] ETSI Technical report, UMTS30.03, v.3.0.0, “Selection Procedures for the Choice of Radio Transmission Technologies of the UMTS”, 1997.
[29] Pizarroso, M., Jimenez, J, ”Common Basis for Evaluation of ATDMA and CODIT System Concepts”, MPLA/TDE/SIG5/DS/P/001/b1, 1995.
[30] 3GPP Technical Specification 25.101 “UE Radio Transmission and Reception (FDD)”.
[31] 3GPP Technical Specification 25.104 “UTRA (BS) FDD; Radio transmission and Reception”.
[32] Akhtar, S. and Zeghlache, D. “Capacity Evaluation of the UTRA WCDMA Interface”, IEEE Vehicular Technology Conference VTC’99-Fall, September 19-22, 1999, Amsterdam, Holland, in proceedings pp. 914–918.
References 79
[33] Elsey, M, Farrell, E. and Johnson, C. “Matching WCDMA Site Configuration with Coverage and Capacity Requirements“, 3G Mobile Communication Technologies, 2001. pp. 73 –77.
[34] Perry, R. “cdma2000 1xEV-DO Business Case”, December 2001. cdma2000 1xEV-DO e-seminar
[35] Ma, L. and Rong, Z. “Capacity Simulations and Analysis for cdma2000 Packet Data Service”, IEEE Vehicular Technology Conference VTC’2000-Fall, September 24–28, 2000, Boston, US, in proceedings pp. 1620–1626.
[36] Presentation of CDMA Development Group, “A viable solution for TDMA operators in Latin America”, CDMA Americas Congress, December 2002
[37] Searles, S. “Maximizing Capacity, Coverage and Performance with cdma2000”, Nortel presentation, 2002.
[38] Barot, A. “Implementing CDMA in TDMA Networks”, Motorola presentation, April 2002.
[39] Nemish, R. “cdma2000 & UMTS Evolution”, Nortel presentation, 2001. [40] Badra, R. “Estimating Uplink RF Capacity in cdma2000 1X Systems”, IEEE
Vehicular Technology Conference VTC’2002-Fall, September 24–29, 2002, Vancouver, Canada, pp. 1394–1394.
[41] Esteves, E. “On the Reverse Link Capacity of cdma2000 High Rate Packet Data Systems”, IEEE International Conference ICC’2002, New York, USA, April 28 – May 2, 2002, in proceedings, pp. 1823–1828.
[42] 3GPP Technical Specification 25.211 “Physical channels and mapping of transport channels onto physical channels (FDD)”.
[43] 3GPP Technical Specification 25.306 “UE Radio Access Capabilities”. [44] 3GPP Technical Specification 25.331 “RRC Protocol Specification”. [45] 3GPP Technical Specification 25.214 “Physical layer procedures (FDD)”. [46] Johansson, B. “Packet Data Capacity in a Wideband CDMA System”, IEEE
Vehicular Technology Conference VTC’98, Ottawa, Canada, May 18–21, 1998, in proceedings pp. 1878–1883.
[47] 3GPP Technical Specification 25.848 “Physical layer aspects of UTRA High Speed Downlink Packet Access”.
[48] Moulsley, T. “Throughput of High Speed Downlink Packet Access for UMTS”, 3G Mobile Communication Technologies, 2001, pp. 363 –367.
[49] Gilhousen, K.S., Jacobs, I.M., Padovani, R., Viterbi, A.J., Weaver, L.A. and Ill, C. E.W., “On the Capacity of a Cellular CDMA System”, IEEE Trans. Vehic. Tech., Vol. 40, No. 2, 1991, pp. 303–312.
[50] Proakis, J.G., Digital Communications, 3rd edn, McGraw-Hill, New York, 1995. [51] Verdú, S., ‘Minimum Probability of Error for Asynchronous Gaussian Multiple-
Access Channels’, IEEE Trans. Inform. Th., Vol. 32, No. 1, 1986, pp. 85–96. [52] M.K. Varanasi and B. Aazhang, “Multistage Detection in Asynchronous Code-
Division Multiple-Access Communications”, IEEE Trans. Comm., vol. COM-38, pp. 509-519, April 1990.
[53] M.K. Varanasi, B. Aazhang, “Near-Optimum Detection in Synchronous Code-Division Multiple-Access Communications”, IEEE Trans. Comm., vol. COM-39, pp. 725–736, April 1991.
[54] U. Fawer, B. Aazhang, “A Multiuser Receiver for Code Division Multiple

80 A Study of UMTS Terrestrial Radio Access Performance
Access Communications over Multipath Channels”, IEEE Trans. Comm., vol. COM-43, pp. 1556–1565, February/March/April 1995.
[55] A. Hottinen, H. Holma, A. Toskala, “Multiuser Detection for Multirate CDMA Communications”, IEEE International Conference ICC’96, Dallas, USA, June 23 –27, 1996, in proceedings, pp. 1819–1823.
[56] Klein, A. and Haardt, M. “The TD-CDMA Based UTRA TDD Mode”, IEEE Journal on Selected Areas on Communications, Special issue on Wideband CDMA, Volume: 18 Issue: 8, Aug. 2000, pp. 1375–1385.
[57] Astely, D. and Artamo, A. “Uplink Spatio-temporal Interference Rejection Combining for WCDMA”, IEEE Third Workshop on Signal Processing Advances in Wireless Communications SPAWC'01, Taiwan, March 20–23, 2001, in proceedings, pp. 326–329.
[58] Tiirola, E. and Ylitalo, J. “Comparison of Beamforming and Diversity Approaches for the Coverage Extension of WCDMA Macro Cells”, IEEE Vehicular Technology Conference VTC'2001 Fall, Atlantic City, NJ, USA, October 7–11, 2001, in proceedings pp. 1274–1278.
[59] 3GPP Technical Specification 25.105 “UTRA (BS) TDD; Radio Transmission and Reception (TDD)”.
[60] Haas, H. and Povey, G. "The Effect of Adjacent Channel Interference on Capacity in a Hybrid TDMA/CDMA-TDD System Using UTRA-TDD Parameters", IEEE Vehicular Technology Conference VTC’99-Fall, September 19–22, 1999, Amsterdam, Holland, in proceedings pp. 2616–2620.