A study of cost‑effective reinforced concrete structural ...
88
This document is downloaded from DR‑NTU (https://dr.ntu.edu.sg) Nanyang Technological University, Singapore. A study of cost‑effective reinforced concrete structural systems Li, Shengping 2005 Li, S. (2005). A study of cost‑effective reinforced concrete structural systems. Master’s thesis, Nanyang Technological University, Singapore. https://hdl.handle.net/10356/11899 https://doi.org/10.32657/10356/11899 Nanyang Technological University Downloaded on 06 Apr 2022 22:02:37 SGT
Transcript of A study of cost‑effective reinforced concrete structural ...

This document is downloaded from DR‑NTU (https://dr.ntu.edu.sg)Nanyang Technological University, Singapore.
A study of cost‑effective reinforced concretestructural systems
Li, Shengping
2005
Li, S. (2005). A study of cost‑effective reinforced concrete structural systems. Master’sthesis, Nanyang Technological University, Singapore.
https://hdl.handle.net/10356/11899
https://doi.org/10.32657/10356/11899
Nanyang Technological University
Downloaded on 06 Apr 2022 22:02:37 SGT
A Study of Cost-Effective
Reinforced Concrete Structural Systems
LI SHENGPING
SCHOOL OF CIVIL AND ENVIRONMENTAL ENGINEERING
NANYANG TECHNOLOGICAL UNIVERSITY
2005
ATTENTION: The Singapore Copyright Act applies to the use of this document. Nanyang Technological University Library
A Study of Cost-Effective Reinforced Concrete
Structural Systems
SUPERVISED
Assoc. Prof. Robert L. K. Tiong
SUBMITTED
Li Shengping
SCHOOL OF CIVIL AND ENVIRONMENTAL
A Thesis presented to the Nanyang Technological
Jan 2005
BY
BY
ENGINEERING
University in fulfillment of the requirements for the Degree of Master of Engineering
2
ATTENTION: The Singapore Copyright Act applies to the use of this document. Nanyang Technological University Library
Acknowledgment The author wishes to express his sincere appreciation and gratitude to Assoc. Prof.
Tiong Lee Kong, who has helped in the successful completion of the author’s Master
of Engineering study and has shared his vast knowledge with the author. His tireless
patience and reassuring advice are appreciated very much. His commitment and
brilliance have been inspiring and the author feels the most pleasure and enjoyment
working with him.
The sincere appreciation also goes to Mr. Andrew Seet, Managing Director and Ms
Florence Lim, Quantity Surveyor of Santarli Construction Pte Ltd, for supplying the
information and providing guidance on the carrying out of the project. Dr. Susanto
Teng from NTU, Ms. Annie Yee from Jurong Consultant (Sin), Mr. Eddy Tan from
Consoft Pte Ltd, Mr. Gary Soon from Utracoss and Mr. Suresh from VSL have been
providing generous help and encouragement to make this study successful.
i
ATTENTION: The Singapore Copyright Act applies to the use of this document. Nanyang Technological University Library

Table of contents
ACKNOWLEDGMENT ...................................................................................................I
TABLE OF CONTENTS................................................................................................. II
SUMMARY .....................................................................................................................IV
LIST OF TABLES ........................................................................................................... V
LIST OF FIGURES ........................................................................................................VI
LIST OF SYMBOLS AND ABBREVIATIONS ........................................................ VII
CHAPTER 1.......................................................................1 INTRODUCTION .............................................................1
1.1. BACKGROUND.......................................................................................................... 1 1.2. OBJECTIVES............................................................................................................. 3 1.3. RESEARCH METHODOLOGY ..................................................................................... 4 1.4. OUTLINE OF THE THESIS.......................................................................................... 4
CHAPTER 2.......................................................................6 LITERATURE REVIEWS...............................................6
2.1. COMMON REINFORCED CONCRETE SYSTEMS ....................................................... 6 2.1.1. Conventional RC System................................................................................... 6 2.1.2. Flat Slab System................................................................................................ 9 2.1.3. Precast Concrete System................................................................................. 12 2.1.4. Post-Tensioned System.................................................................................... 15
2.2. PREVIOUS COST STUDIES...................................................................................... 19 2.2.1. Deductive and Inductive Cost modeling of building....................................... 19 2.2.2. Trial-design cost comparison for various structural systems......................... 22 2.2.3. Project-based cost comparisons for various structural systems..................... 27
2.3. OTHER COST THEORIES ........................................................................................ 29 2.3.1. Cost significance in construction project........................................................ 29
CHAPTER 3.....................................................................31 DEVELOPMENT OF RESEACH FRAMEWORK ....31
3.1. RESEARCH FRAMEWORK ....................................................................................... 31 3.2. THE TRIAL-BUILDINGS ............................................................................................ 34 3.3. DESIGN ASSUMPTIONS .......................................................................................... 37 3.4. FINITE ELEMENT ANALYSIS SOFTWARE ................................................................. 39 3.5. ACCURACY OF THE CALCULATION ......................................................................... 39 3.6. CONSTRUCTION COST AND COST DATA COLLECTION ........................................... 42
ii
ATTENTION: The Singapore Copyright Act applies to the use of this document. Nanyang Technological University Library
3.6.1. Study scope of the construction cost ............................................................... 42 3.6.2. Cost data collection and the Unit rates .......................................................... 43
CHAPTER 4.....................................................................48 DESIGN QUANTITIES AND CALCULATIONS.......48
4.1. CONCRETE, FORMWORK AND PRESTRESS TENDON............................................. 49 4.2. REINFORCING STEEL QUANTITIES ......................................................................... 52
4.2.1. Reinforcing steel quantities in columns .......................................................... 53 4.2.2. Reinforcing steel quantities in beams ............................................................. 54 4.2.3. Reinforcing steel quantities in slabs ............................................................... 56 4.2.4. Total reinforcing steel quantities .................................................................... 56
CHAPTER 5.....................................................................58 RESULTS AND DISCUSSIONS....................................58
5.1. MODIFIED UNIT RATES AND OTHER CONSIDERATIONS .......................................... 58 5.1.1. Flat slab unit rates .......................................................................................... 58 5.1.2. Precast costing................................................................................................ 59 5.1.3. Other modified unit rates ................................................................................ 61 5.1.4. Precast member mass...................................................................................... 61
5.2. STRUCTURAL COST (SC) ...................................................................................... 62 5.2.1. Total structural cost ........................................................................................ 62 5.2.2. Structural cost breakdown .............................................................................. 65 5.2.3. Other cost implications ................................................................................... 69
CHAPTER 6.....................................................................70 CONCLUSION AND RECOMMENDATIONS...........70
6.1. CONCLUSION ......................................................................................................... 70 6.2. LIMITATIONS AND RECOMMENDATIONS FOR FUTURE RESEARCH ......................... 72
REFERENCES................................................................................................................ 74
APPENDICES ................................................................................................................. 78
iii
ATTENTION: The Singapore Copyright Act applies to the use of this document. Nanyang Technological University Library
Summary Reinforced Concrete (RC) is the most commonly used building material in Singapore.
Various RC structural systems have been developed to fully utilize the properties of
RC. Some examples of RC structural systems are conventional cast in-situ beam-slab
system, post-tensioned flat slab system, and precast system.
With the various RC structural systems available in the market, finding a cost-
effective structural system becomes a pressing issue in the construction industry.
Attempts on construction cost comparison for various structural systems have been
made to identify the cost-effective system. However, due to the complexity of building
construction, no comprehensive study on this topic has been done.
This study provides a comprehensive cost comparison of the common RC structural
systems. The structural cost calculation framework was developed. Trial-buildings
were designed using finite element software and material quantities were found out.
The structural costs were calculated utilizing the input of current unit rates from local
construction industry. It was hoped that this cost calculation framework could be
helpful in the field of construction cost study.
With the available cost information, the cost-effective ranges for various RC structural
systems in grid size and live load were identified in terms of the structural cost. The
results might serve as a useful guideline in the early construction cost estimate and the
selection of the cost-effective RC structural system.
iv
ATTENTION: The Singapore Copyright Act applies to the use of this document. Nanyang Technological University Library

List of Tables TABLE 2.1. COST COMPARISON: PRESTRESSED VS. REINFORCED FLAT SLAB ..................... 23
TABLE 2.2. COST COMPARISON: PRECAST VS. CONVENTIONAL.......................................... 24
TABLE 2.3. COST COMPARISON: RC VS. STEEL.................................................................. 25
TABLE 2.4. COST COMPARISON: PRECAST VS. SEMI-PRECAST ........................................... 26
TABLE 2.5. COST COMPARISON: FLAT PLATE VS. OTHERS ................................................. 27
TABLE 2.6. COST COMPARISON: FLAT PLATE, FLAT SLAB AND BEAM-SLAB ...................... 28
TABLE 2.7. COST COMPARISON: FLAT SLAB IN MIXED DEVELOPMENT ............................... 29
TABLE 3.1. TRIAL BUILDINGS CONFIGURATIONS ................................................................ 36
TABLE 3.2. CPG UNIT RATES 2003 Q3 .............................................................................. 46
TABLE 4.1 (1). MEMBER SIZES FOR CONVENTIONAL SYSTEM............................................. 49
TABLE 4.1 (2). MEMBER SIZES FOR PRECAST SYSTEM........................................................ 49
TABLE 4.1 (3). MEMBER SIZES FOR PT FLAT SLAB SYSTEM ............................................... 49
TABLE 4.2. OVERALL CONCRETE AND FORMWORK QUANTITIES FOR VARIOUS
CONFIGURATIONS....................................................................................................... 51
TABLE 4.3. SAMPLE STEEL QUANTITIES FOR COLUMNS ...................................................... 53
TABLE 4.4. SAMPLE STEEL QUANTITIES CALCULATION FOR BEAMS.................................... 55
TABLE 4.5. TOTAL STEEL QUANTITY FOR THE TRIAL-BUILDING ......................................... 57
TABLE 5.1. PROPORTIONS OF DELIVERY AND INSTALLATION COST IN TOTAL PC MEMBER
COST........................................................................................................................... 60
TABLE 5.2. MODIFIED CPG UNIT RATES 2003 Q3 ............................................................. 60
TABLE 5.3. PRECAST MEMBER MASS.................................................................................. 61
TABLE 5.4. SC (S$/M2) AND COST DIFFERENCES................................................................ 62
TABLE 5.5 (1). COST BREAKDOWN FOR BUILDING MATERIALS IN CONVENTIONAL
CONSTRUCTION .......................................................................................................... 65
TABLE 5.5 (2). COST BREAKDOWN FOR BUILDING MATERIALS IN PT FLAT SLAB
CONSTRUCTION .......................................................................................................... 65
TABLE 5.6. COST BREAKDOWN ACCORDING TO STRUCTURAL MEMBERS............................ 67
v
ATTENTION: The Singapore Copyright Act applies to the use of this document. Nanyang Technological University Library

List of figures
FIGURE 3.1. RESEARCH FRAMEWORK FOR STRUCTURAL COST CALCULATION ......................... 33
FIGURE 3.2. DIFFERENT RC STRUCTURAL SYSTEMS.............................................................. 34
FIGURE 3.3. SAP2000 6M×6M GRID MODELING.................................................................. 35
FIGURE 3.4. SECONDARY BEAM LAYOUT ............................................................................... 36
FIGURE 3.5. MOMENT DISTRIBUTION FOR FLOOR 4 TO FLOOR 1............................................ 40
FIGURE 3.6. REINFORCED STEEL REQUIREMENT (MM2) IN VARIOUS BEAM SECTIONS FOR
DIFFERENT FLOORS ..................................................................................................... 41
FIGURE 3.7. MOMENT DISTRIBUTION IN SLAB FROM SAFE 6.20 AND SAP2000..................... 42
FIGURE 4.1. SAMPLE TENDON LAYOUT ................................................................................. 52
FIGURE 4.2. SAMPLE REINFORCING STEEL ARRANGEMENT IN BEAMS...................................... 54
FIGURE 5.1. STRUCTURAL COST (S$/M2) VS. GRID SIZES (M) FOR VARIOUS LIVE LOADS........ 63
FIGURE 5.2. COST BREAKDOWN TO BUILDING MATERIALS ..................................................... 66
FIGURE 5.3. COST BREAKDOWN TO STRUCTURAL MEMBERS .................................................. 68
vi
ATTENTION: The Singapore Copyright Act applies to the use of this document. Nanyang Technological University Library

List of symbols and abbreviations
A Area
b Width of the structural member
BCA Building and Construction Authority, Singapore
BS British Standard
CIDB Construction Industry Development Board, Singapore
Conv. Conventional
CPG CPG Corporation
d Depth of the structural member
fcu Value of the cube strength of concrete
fy
GFA
Value of the yield strength of reinforcement
Gross floor area
LL Live load
RC Reinforced concrete
P Force
PC Precast
PT Post-tensioned
Sec. Secondary
vii
ATTENTION: The Singapore Copyright Act applies to the use of this document. Nanyang Technological University Library

CHAPTER 1
INTRODUCTION
1.1. Background
Reinforced Concrete (RC) is the most commonly used building material in Singapore
construction industry. Reinforced concrete has the advantages of relatively low
construction cost, low maintenance cost, flexibility in construction and it is more familiar
to the builders in the business. Various RC structural systems have been developed to
fully utilize the properties of RC. Some examples of RC structural systems are
conventional cast in-situ beam-slab system, flat slab system, prestressed system and
precast system.
With the many RC structural systems in choice, finding a suitable structural system
becomes a pressing issue in the construction industry for builders to secure the work and
increase the profit margin. In fact, this study was a direct result of a local contractor’s
proposal for research into the cost advantages of the commonly used RC structural
systems in the market.
1
ATTENTION: The Singapore Copyright Act applies to the use of this document. Nanyang Technological University Library

Different RC structural systems have various pros and cons but the emphasis of this study
was on the cost-effectiveness of various RC structural systems in terms of structural cost.
The costs of the different systems vary from each project. The design schemes,
architectural layouts, construction methodologies and the industry infrastructure of the
region all affect the structural cost.
Previous cost modeling of buildings was classified into deductive and inductive methods
(Wilson 1982). The deductive method is to relate the building cost to some design
variables through past cost data. The relation is normally figured out from previous cost
data by statistical means. The inductive method focuses on studying the design and
construction process to relate the cost to the process element.
For the specific studies into cost of various RC structural systems, a deductive kind of
approach was considered not feasible due to the inability to find a reasonably large pool
of historical cost data for each of the structural systems studied. On the other hand,
inductive attempts on construction cost comparison for various structural systems have
been made to identify the cost-effective system. However, due to the complexity of
building construction, no comprehensive study has been done. Previous studies include
comparisons on a few trial-designed buildings and comparisons on real projects. Trial-
design approach is normally to conceptually design structures in different RC structural
systems to calculate the different material quantities. Some of the trial-design attempts
include the ones conducted by Dorwrick & Narasimhan (1978) on prestressed vs.
reinforced flat slab and Neo (1997) on precast vs. semi-precast concrete structures.
Project-based comparisons are carried out on real projects and some of the examples
include Mo (1998) on flat slab and Mayer (1998) on flat slab.
The trial-design approach is a general approach but time consuming. The real project
based comparison (case study) is carried out on a certain project with normally one extra
design besides the original design to compare the cost effectiveness. The main limitations
of project-based comparison are that the study is much subjected to the characteristics of
that project and is usually limited to 2 systems. Another disadvantage of such comparison
2
ATTENTION: The Singapore Copyright Act applies to the use of this document. Nanyang Technological University Library

is that it is largely based on the experience of the design engineer. Different engineers
have different safety factors in design. Some may attempt to use very big safety factors,
which will result in the inaccuracy of the comparison.
Some clarification on the cost and price on a building project is necessary. In the short
term, the bidding price is market-oriented rather than merely contractor’s cost plus
markup in a competitive bidding environment. In the long term, the price has to be based
on the cost incurred (Rafety 1991, Runeson 2000). In the context of the author’s work,
price and cost are used interchangeably referring to the cost to the developer (price to the
contractor).
1.2. Objectives
The purpose of the study was to construct a research framework to compare the structural
costs of some commonly used RC structural systems utilizing finite element (FEM)
design software. The relative cost information was to be collected and studied. A study of
the structural costs using the proposed framework was to be carried out in Singapore
construction industry. The advantages and disadvantages of various systems were also to
be summarized.
Based on a trial building of fixed size, the important design variables were identified as
RC structural systems, gird sizes and live loads. The cost-effective range in terms of grid
sizes and live loads for the various RC structural systems would be identified with the
available cost information.
The study was intended to propose a way of cost comparison for various structural
systems. The result could help the decision-makers in the schematic design for choosing
the most economical structural system for a project.
3
ATTENTION: The Singapore Copyright Act applies to the use of this document. Nanyang Technological University Library

1.3. Research methodology
A RC trial building of 4-storey high with a GFA of 2304m2 was adopted as the base for
the design. Details on the conceptual building were explained in Section 3. After the
construction of the research framework, a structural cost comparison for the trial building
was done for the common RC structural systems, namely conventional column-beam-slab,
prestressed flat slab and precast column-beam-slab systems. The trial buildings were
designed in different RC structural systems; grid sizes and live loads using FEM design
software. The material quantities were tabulated; and the structural cost of the trial-
buildings was calculated based on local cost information. Cost for different systems
would be compared in terms of the other two design variables including live loads and
grid sizes and the relative cost-effective RC structural system would be identified.
This study by the author was considered to be an inductive approach because the cost was
related to the design process and the relatively detailed material quantities were worked
out based on the designs. The cost information (unit rates) was extracted from local
market prices, which was done by local authority and company through statistical means.
The software SAP2000, SAFE and ADAPT Floor were chosen as the design software.
SAP2000 generates the design quantities for beam and column while SAFE generates the
conventional slab reinforcing output. ADAPT Floor was used to design post-tensioned
flat slab structures. Cost data was acquired through references and interviews. Microsoft
Excel spreadsheets were used to help calculate the quantities and costs. More details on
the research methodology could be found in Section 3.
1.4. Outline of the thesis
After the introduction from Chapter 1, Chapter 2 gives the literature review. Different RC
structural systems were summarized and their advantages and disadvantages were given.
Previous researches on construction cost were reviewed and the deductive and inductive
4
ATTENTION: The Singapore Copyright Act applies to the use of this document. Nanyang Technological University Library

approaches were mentioned. The inductive approach on the topic of cost-effective
structural systems were grouped into trial-design approach and project-based approach.
Some relevant theories on construction cost were also mentioned in this chapter.
Chapter 3 is the development of the research framework. The framework was presented
and the illustration and clarifications of the framework were given. The cost data
collection was also discussed in this chapter.
Chapter 4 shows the analysis of the design software and the calculation of the building
material quantities. How the quantities were sorted out was explained in detail in this
chapter.
Chapter 5 is the results and discussions. The structural costs were calculated and some
relevant issues were discussed. The costs were also broken down to building materials
and structural members to give better illustrations on structural cost.
Finally, Chapter 6 concludes the author’s study. The findings were summarized and some
limitations of the research and recommendations for future research were presented in
this chapter.
5
ATTENTION: The Singapore Copyright Act applies to the use of this document. Nanyang Technological University Library

CHAPTER 2
LITERATURE REVIEWS
2.1. Common Reinforced Concrete Systems
Various RC structural systems have been studied for the pros and cons of each. There are
many considerations to take besides the cost evaluation (some might try to quantified
every aspect using cost, but it is still difficult at this moment). The advantages and
disadvantages of the main RC structural systems studied were summarized. The summary
was done with reference to Huntington and Mickadeit (1981), FIP (1994), Teng and Sui
(2003) and Goodchild (1997).
2.1.1. Conventional RC System
The conventional reinforced concrete system is the traditional cast in-situ RC system,
which adopts column/wall, beam and slab system. It is the earliest type of reinforced
concrete system employed in Singapore and is still the most popular RC system in
Singapore till now. However, with the advancement of technology and higher demand on
quality and duration shortening, this system is slowly replaced by other systems in the
construction industry.
6
ATTENTION: The Singapore Copyright Act applies to the use of this document. Nanyang Technological University Library

The following was summarized from the work done by Teng and Sui (2003) and Holland
(1997).
Advantages
1. Structural Continuity. As the beam and slab are cast monolithically, there will
be more structural interaction between the elements and complicated connection
designs can hence be avoided.
2. Relatively Simple and Standard Construction Techniques. Engineers are more
confident in the construction site planning and management as they have been
practicing this method for the past decades. No requirement of specialized skills or
equipments; all operations are the basic construction processes, which can be carried
out by workers under the supervision of site supervisors or any authorized personnel.
This is important, as most of the construction labors are unskilled foreign workers
who have little or no knowledge in this field.
3. Design Flexibility. There will be more flexibility for any changes in the design or
architectural layout during the construction stages. Whereas in the precast system,
changes might not be feasible as the precast components have been prefabricated in
the factories.
Disadvantages
1. Longer Construction Duration. Apart from the amount of time needed to erect
the falsework and formwork, this system needs considerable time for mixing, casting
and curing of the concrete, all of which affect the final strength of concrete if any of
7
ATTENTION: The Singapore Copyright Act applies to the use of this document. Nanyang Technological University Library

the stated activities is not carried out according to the requirements. The time
schedule of the in-situ works can also be readily affected by inclement weather.
2. High Usage of Formwork and Falsework. More formworks and falseworks are
required for the holding of the cast members in place until they gain sufficient
strength to support themselves. This reduces their useful recycle time and in today’s
construction industry, formwork usage tends to be very expensive and the cost can
amount to one to two-thirds (in cases of low formwork recycling rates) of the total
cost of conventional system.
3. Construction Defects. Shrinkage cracks and honeycombs due to poor concrete
placing will affect the concrete strength. Although these defects will also occur in the
other systems, the chances of them occurring in conventional system are the highest
due to the difficulty in quality control on site and the higher number of members
designed and cast on site.
4. Section Limitation. The low strength per unit weight of concrete leads to heavy
members. This becomes an increasingly important matter for long spanning structures
where concrete’s large dead weight has a great effect on bending moments. Similarly,
the low strength per unit volume of concrete means member will be relatively large
and this is an important consideration for tall buildings and long spanning structures.
5. Labor Intensive and Massive Material Flow. The adoption of this system
requires a higher manpower usage (for assembling & dissembling of formworks and
falseworks, concreting works and curing) and since all the works occur on-site,
materials such as steel reinforcement bars, formworks, falseworks, vibrators and
others need to be properly stored, thereby requiring better housekeeping and extra
storage area.
8
ATTENTION: The Singapore Copyright Act applies to the use of this document. Nanyang Technological University Library

2.1.2. Flat Slab System Flat slab is defined in ACI code as a concrete slab reinforced in two or more directions,
generally without beams or girders to transfer the loads to its supports. The supports are
usually columns. To assist in transferring the loads to its supports, the column heads are
sometimes enlarged to form a column capital. Flat slab is suitable for bays, which are
approximately square. The reinforcement is usually arranged in two directions parallel to
the sides of the panel. The minimum permissible thickness of the slab with drop panels is
one-fourth of the longest span but in no cases is to be less than 100mm. The side of the
drop panel must be at least one-third the parallel span. The maximum effective central
angle of the column capital is 90deg. The advantages and disadvantages of flat slab
construction as stated below were summarized from Teng and Sui (2003) and Huntington
and Mickadeit (1981).
Advantages
1. Shorter Construction Time. This system facilitates builders to adopt big table
form to increase site productivity. From observation, moving of system formwork
from one end to the other and from floor to floor can be carried out within a day with
minimum manpower. Welded steel mesh as bottom reinforcement and prefabricated
steel reinforcement are placed over columns and walls the following day. Concreting
to the floor can then be carried out on the third day of the floor cycle. Since the
setting up of columns and walls is done in parallel with the curing of concrete slab, a
floor cycle time of 6 to 7 days for a floor area of 2,000 m2 is possible at construction
sites nowadays.
2. Height Reduction and Unobstructed Ceiling Space. Flat slab construction
places no restrictions on the positioning of horizontal services and partitions and can
minimize floor-to-floor heights when there is no requirement for a deep false ceiling.
9
ATTENTION: The Singapore Copyright Act applies to the use of this document. Nanyang Technological University Library

A reduction in floor-to-floor height may results in an additional floor without
increasing the height of the building and alternatively a lower building height for the
same number of floors. This can have knock-on benefits such as reduced external
cladding costs and prefabricated services. Cost of vertical services runs can also be
lowered due to the reduced floor-to-floor height.
3. Flexibility in Room Layout. This system of construction offers considerable
flexibility in terms of architectural layout to the occupier who can easily alter internal
layouts to accommodate changes in the use of the structure. Columns and beams need
not be aligned and brick wall position could be placed anywhere on the slab structure
without affecting the structural behavior (subjected to the wall load constraint). This
flexibility results from the use of a square or near-square grid and the absence of
beams, downstands or drops that complicate the routing of services and location of
partitions.
4. Standardization of Members. By nature of the design, flat slab requires a
minimum section of floor thickness and size of the columns to be provided to satisfy
punching shear criteria. This indirectly deters changes to be freely made to the
dimensions of these members and enables them to be standardized for ease and speed
of construction. The effort given to the standardization of members and keeping the
types of structural elements to a bare minimum will encourage builders to adopt
lighter formwork system for the vertical structural members.
5. Ease of Installation of M&E Services. For Flat Slab design, the underside of
floor system is kept free of beams within the dwelling units. As a result, all M&E
services can be mounted directly on the underside of the slab instead of bending them
to avoid the position of beams as normally experienced in the beam and slab case. It
helps to avoid the occurrence of incidents such as having the problem to hack through
beams for subsequent installation of services that are required by the owner after the
handling over of the units. This certainly will help smooth over some of the teething
maintenance issues during the defects liability period.
10
ATTENTION: The Singapore Copyright Act applies to the use of this document. Nanyang Technological University Library

6. BCA Buildability Score. BCA buildability score in Singapore is a measure of
productivity of construction. A minimum score is required for a building project to be
approved. By virtue of its simplicity in structural layout and adaptability to precast
technology, it will allow standardized structural members and prefabricated sections
be integrated into the design for ease of construction. This process will make the
structure more buildable and reduce the number of site workers and increase the
productivity at construction site. Hence it is more buildable and has a natural
tendency to achieve a higher BCA buildability score.
Disadvantages
1. Problem of Punching Shear. Flat slab construction is not ideal from the
structural point of view, due to stress concentration at points of support, such as
columns. In reinforced concrete design, the problem is a matter of preventing brittle
punching shear failure.
2. Dealing with Deflections. For thin flat slabs, serviceability criteria are likely to
govern the design. Deflections will generally be greatest at the centre of each panel.
However, as partitions may be placed along column lines, it is usual to check
deflection here also. The possible effect of deflections on cladding should also be
considered carefully. In most cases, a simplified approach using span/depth ratios will
be perfectly adequate.
3. Dealing with Construction Loads. A high ratio of dead to live load is an
inherent feature of flat slabs. With the trend towards faster construction and lower
design imposed loads, the ‘spare capacity’ of a slab over its self-weight is being
reduced. There is evidence that early striking and early loading through rapid floor
construction has some impact on long-term deflections. This has implication for the
11
ATTENTION: The Singapore Copyright Act applies to the use of this document. Nanyang Technological University Library

extent of cracking, which can marginally increase deflection when more permanent
loads are applied.
4. Dealing with Holes. Holes in flat slab near columns need special attention as they
reduce local resistance to both bending and punching shear. Very small isolated holes
can be ignored. Holes away from columns are less critical.
5. Other limitations. Flat slab systems are best for light and medium loadings as in
flats and offices. In cases of buildings with heavier building load, thicker floor slabs
will be needed, thereby increasing the overall cost of construction in terms of
concrete and steel reinforcements.
2.1.3. Precast Concrete System
In precast concrete construction, the structure is divided for manufacturing purposes into
separate and distinct structural elements that are later assembled into the final structure.
Precast members cast at the building site or at a casting yard remote from the structure
are transported to the site of structure and positioned by crane. Precast structural concrete
elements can be either conventionally reinforced or prestressed.
Precast slabs are built together via reinforcement bars places in the castellated horizontal
joints. Such connections are able to transmit shear forces vertically as well as horizontally.
In some case, a thin structural screed is cast on top. Beside slab, structural precast
components also include beams, columns and walls.
A precast structure has less continuity than a cast on-site structure. Normally, all precast
components are simply supported and therefore the designer has to put in emphasis on the
structural joints. Structural joints are normally divided in relation to their loading or their
behavior. The benefits of the system summarized below were drawn from the work by
12
ATTENTION: The Singapore Copyright Act applies to the use of this document. Nanyang Technological University Library

Huntington and Mickadeit (1981) and FIP Planning and design handbook on precast
building structures (1994).
Advantages
1. Shorter Construction Duration. Construction will be more rapid and the owner
can take possession of the building in a shorter space of time after the site is made
available. Casting in the precast plant is normally unimpeded by adverse weather
conditions and is carried out in parallel with the site activities.
2. Less Usage in Formwork and Falsework. Reduction in site costs as scaffolding,
shuttering and other temporary supports will not be needed in such quantities as for
in-situ concrete work. Precast units can be made by mass production methods and
there should be a rapid re-use of moulds, which can be made to a precision not
possible on-site and more intricate work can be carried out, resulting in less material
wastage. Precast elements can be designed as beams supporting the weight of wet
concrete and construction loads above. Thus, support scaffolding can be reduced or
even eliminated altogether.
3. Reduction in Labour and On-Site Material Demand. There will be
considerably less in-situ concrete work, thus reducing the amount of wet work on site,
which in turn reduces the demand for local site labour and the import of local raw
material.
4. Better Finishes. Units can be made to a good, even excellent standard due to the
use of a trained and specialized labor working force under factory conditions. Precast
units may also be cast in the most favorable orientation to improve finishes on the
most important faces. Finished products can be inspected before it is erected and there
is an opportunity to reject any substandard work before incorporation in the structure.
13
ATTENTION: The Singapore Copyright Act applies to the use of this document. Nanyang Technological University Library

5. Flexibility in Design. Non-structural elements (timber inserts, electrical conduits
and other services) can be incorporated into the units. Shapes and finishes may be
achieved which would be difficult or impossible with in-situ concrete techniques.
6. Better Quality. Precast concrete can be made denser, more resistant to erosion
and corrosion, less permeable, stronger, and of more uniform quality than
concrete cast-in-place in the field. Improved quality of the concrete will result in
lower maintenance and repair costs and longer service life for the structures.
Disadvantages
1. Detailed Joint Connection Design Required. The joints between precast units
have to be made under site conditions. Skill is required to design and detail a joint
that can be easily formed onsite whilst at the same time providing the necessary
strength. Clumsy details can impair the ultimate appearance of the structure and
details, which may appear satisfactory on paper, might require an excess amount of
time or labour to assemble. Temporary supports may be necessary to ensure stability
while the work of assembling is being carried out. To provide continuity and comply
with ultimate stability requirements, some in-situ reinforced concrete acting in
conjunction with the precast concrete section is often necessary.
2. Less Flexible to Changes. If the advantage of speed of construction is to be
achieved, precast units must be made well in advance of the time when they are
required onsite. Last minute changes cannot be accommodated once the precast
members are cast. The functional aim in precast system is to complete all the
specialized tasks (requiring trained and skilled operators) in the workmanship before
the units are dispatched to site.
3. Considerations on Handling, Transporting and Erection. Some additional
reinforcement and fittings may be required for handling, transporting and erection. It
14
ATTENTION: The Singapore Copyright Act applies to the use of this document. Nanyang Technological University Library

has to be appreciated that the precast concrete member has to be designed not only to
function as part of a total structure but also for the stress conditions obtained during
handling, transporting and erecting. If a large amount of units are required or if they
are large in size, problems can arise concerning storage areas, transportation and
erection costs.
4. Member Standardization Required. Precast tends to be less suitable for
buildings with irregular features. It has already been said that to obtain the greatest
economy from precision moulds, there should be high degree of repetition.
5. Crane. There must be a restriction on the size and weight of precast concrete
units, as they all have to be lifted and placed in the position by some means. The
lifting capacity and range of cranes available can govern the size and weight of the
units. Indeed, the type of crane to be considered not only with regard to the precast
concrete members it has to lift but also thought has to be given to other uses of the
crane throughout the building project. Cranes are expensive and full use must be
made of them while they are onsite. It is no use designing precast concrete members
weighing say 10 tons each if for the rest of the contract loads no greater than 5 tons
are required to be lifted. This would mean the crane provided specially for the precast
concrete units would be uneconomic for the rest of the job. It could, of course be
removed and replaced but this again would be a very expensive operation.
2.1.4. Post-Tensioned System
In today’s construction industry, architects place greater emphasis on the necessity of
providing larger uninterrupted floor space and the flexibility of internal layout.
Prestressing facilitated the construction of concrete floor slabs, giving larger clear spans,
fewer columns and supports and reduced floor thickness. This method of construction has,
over the past 20 years been widely used in many countries and has proven to be more
economical than many of the traditional methods.
15
ATTENTION: The Singapore Copyright Act applies to the use of this document. Nanyang Technological University Library

Prestressing technology includes post-tensioning and pre-tensioning. In post-tensioning,
prestressing force is applied by jacking steel tendons against the hardened concrete
member. The tendons are either inserted in the holes formed by removable cores cast in
the concrete or pre-positioned before the concrete is poured. Once the tendons have been
tensioned to their full force, the jacking force is transferred to the concrete through
special built-in anchorage. The concentrated force applied through the anchorage set up a
complex state of stress within the surrounding concrete & reinforcement is required
around the anchorage to prevent the concrete from splitting. Cement grout is injected to
fill the space between the tendon and the duct. This is to protect the tendon and to
improve the ultimate strength capacity of the member.
The principal structural advantages of post tensioning over the use of pre-tensioning units
are:
1. Structural continuity
2. Monolithic concrete joints at walls and columns
3. Greater freedom in the layout of the tendons
However, there is limitation to the length of the slab that can be post-tensioned at any one
time and in areas where construction and slab-column joints are required; there is a need
for careful detailing.
The advantages and disadvantages as stated below on post-tensioned construction were
summarized from Teng and Sui (2003), Goodchild (1997) and Huntington and Mickadeit
(1981).
Advantages
1. Minimum Deflection and cracking. Concrete is very strong in compression but
weak in tension, i.e. it will crack when forces act to pull it apart. Post-tensioned
16
ATTENTION: The Singapore Copyright Act applies to the use of this document. Nanyang Technological University Library
structures can be designed to have minimal deflection and cracking, even under full
load. Hence, the quality is improved and the durability of the structure enhanced
2. Building Height and Weight Reduction. The reduced slab thickness permits a
maximum exploitation of the floor and building height, meaning a lower overall
building height for the same floor-to-floor height and hence less concrete
requirement. Post tensioning can thus allow a significant reduction in building weight
versus a conventional concrete building with the same number of floors. This reduces
the foundation load and can be a major advantage. A lower building height can also
translate to considerable savings in mechanical systems and facade costs.
3. Larger Span Obtainable. Larger spans are possible which permits a more
flexible arrangement of partition walls. Beams and slabs can be continuous, i.e. a
single beam can run continuously from one end of the building to the other.
Structurally, this is much more efficient than having a beam that just goes from one
column to the next.
4. Structurally Improved. By arranging the tendons in the support strip, crossing
the idealized punching shear cylinder over the columns, the punching shear
conditions are considerably improved. Also, as the slab is virtually crack-free and the
deflection due to live loads is very small, the quality and the durability of the
structure improved.
5. Shorter Construction Duration. The formwork can be removed at an earlier
concrete age because deflection due to creep and shrinkage are significantly less
important. The normal reinforcement steel quantity is considerable reduced and the
arrangement simplified. Therefore, construction time can also be shortened.
6. Reduction/Elimination of Joints. Expansion/Construction joints can practically
be eliminated resulting in cost savings and prevention of slab deterioration from
forklift traffic.
17
ATTENTION: The Singapore Copyright Act applies to the use of this document. Nanyang Technological University Library

7. Improved Durability. Post-tensioned floors are more durable and their resistance
to wear and abrasion is significantly better.
Disadvantages
1. Specialized Skill Requirement. After stressing the tendons, the remaining space
in the ducts may be left empty, or more usually be filled with grout under high
pressure (‘bonded construction’). Although this grout assists in transmitting forces
between the steel and concrete under live loads and improves the ultimate strength of
the member, the principal use is to protect the highly stressed strands from corrosion.
That is why quality of the workmanship of grouting is so important to avoid air
pockets being formed, which may permit corrosion. Cost will therefore be higher as
skilled and experience personnel will be tasked to do the above job.
2. Corrosion and Sensitivity to High Temperature. In safety, if cracks should
occur, corrosion can be more serious in prestressed concrete. In regards of fire
resistance, the high tensile steel used in prestressed members is more sensitive to high
temperatures.
3. Required specialized equipment and material. The adoption of the Post-
tensioned System will bring about a higher unit cost; more auxiliary materials such as
end anchorages, conduits and grouts are required for prestressing.
4. Complicated Construction and Design. More labor is required to place a unit
weight of steel in prestressed concrete, especially when the amount of work involved
is small. More attention and supervision to design is involved and necessary; the
amount of additional work will depend on the experience of engineer and the
construction crew.
18
ATTENTION: The Singapore Copyright Act applies to the use of this document. Nanyang Technological University Library

2.2. Previous cost studies
2.2.1. Deductive and Inductive Cost modeling of building
The approach of building cost modeling could be classified into two different, although
not mutually exclusive types, namely deductive modeling and inductive modeling
(Wilson 1982). According to Skitmore and Marston (1999), the two approaches were
termed product element modeling and production process element modeling.
The deductive modeling is to study a set of design variables and relate them to the cost
through past cost data. It is a process to discover what the buildings should cost based on
what the buildings used to cost. A formal mathematical expression relating the cost and
the set of design variables was derived usually. Some of the typical design variables
include GFA, volume, etc. This modeling method utilizes the statistical techniques and is
largely limited by the suitability of the design variables chosen and the accuracy of the
cost data.
An example of deductive cost modeling is the study of “Predesign cost estimating
function for buildings” by V Kouskoulas and E. Koehn (1974). This study was for the
purpose of preliminary cost estimation and the method utilized past cost information to
syudy some relevant variables, which represented the characters of projects. The 6
independent measurable variables chosen were building locality, price index, building
type, building height, building quality and building technology. A multi-linear cost-
estimation function was derived in the end.
Rather than studying the given cost data, the inductive modeling, on the other hand,
focuses on explaining the cost to the process of the project. It involves the synthesis of
cost of individual discrete design solution from the constituent components of the design.
Inductive methods require the summation of cost over some suitably defined set of
19
ATTENTION: The Singapore Copyright Act applies to the use of this document. Nanyang Technological University Library

subsystems appropriate to the design. The subsystems could be operations, activities and
cost centers and the most detailed subsystem would be the individual resources
themselves.
Two relevant inductive studies with similar methodologies to the author’s were
summarized as follows:
2.2.1.2. The Study by Wilderness Group (1964)
The study by the Wilderness Group was titled “An investigation into building cost
relationships of the following design variables: storey height, floor loading, column
spacing, number of storeys”. It was the product of the group’s “several years’ research”.
A trial design and cost calculation was carried out for steel framed building with RC slab.
This study demonstrates the idea to “go right back to the first principle upon which the
cost of a building arises: in fact that it should embark upon an investigation into the
economics of design”.
The variables used were indicated in the title. The cost was limited to structure,
foundation and basic finishes, and was based on the rate from Spon’s “Architects’ and
Builders’ Price Book” 1956-1957 (82nd Edition). The findings were the relative but not
absolute costs of the “core” for varying storey height, floor loading, column spacing and
number of storeys. The limitations of the study included the following: the size and shape
of the building were not taken into account; the application of steel-framed structure on
low-rise building was not common and the extra cost in hoisting in multi-story building
was not considered.
This study was considered as an inductive approach because individual design was
carried out to sort out the various material quantities and price them accordingly.
Although the costs were represented as varying with the sets of design variables like a
deductive approach, the cost differences were in fact rooted from the different quantities
20
ATTENTION: The Singapore Copyright Act applies to the use of this document. Nanyang Technological University Library
calculated due to the changes in the design variables. And material quantities are process
elements.
2.2.1.2. “The Economics of Factory Buildings” by Stone (1962)
This study is part of the research in the Factory Building Studies by Her Majesty’s
Stationary Office in the 1960’s. It introduced the concept of “cost in use”, which
included the initial and the running cost of the factory. The “model” factory was a single-
storey steel-framed building with an area of 20,000 sq. ft. The cost elements of the
factory included Foundation, Floor, Structure, Walls, Roof, Stairs and Lifts. The running
cost including Maintenance, Heating and Lighting was added to reach the “cost in use” of
the factory.
The design variables studied included area of the factory, plan ratio, number of storeys,
wall types, roof types, etc. (the “model” factory changes with some of the design
variables). Design was prepared for each solution and the works were quantified and
priced. The “pricing” used unit rates to measured bill. The data was collected from
surveys and published price data.
Because a more detailed discussion on the quantities calculation and pricing was not
presented in the study, it was impossible to judge whether sufficient considerations were
given to issues like accuracy of the quantities, extra hoisting cost for multi-storey
building construction, suitability of the pricing data, etc.
For the specific studies into cost of various RC structural systems, judging between the
deductive and inductive cost approaches, the requirement of the deductive approach to
find a reasonable large pool of historical cost data to cover various RC structural systems
was extremely difficult, especially when adequate fairness in the cost comparison need to
be ensued. An inductive cost approach, which goes back to the first principle of
21
ATTENTION: The Singapore Copyright Act applies to the use of this document. Nanyang Technological University Library

economics in design, was then thought to be feasible and reasonable. Some cost
comparisons had been done, but due to the complexity of building construction, it is
difficult to get accurate results to be used as a general reference. While focusing on the
inductive type of study in this field, the inductive studies could be further classified into
trial-design approach and project-based comparison approach of different RC structural
systems. Some previous trial-design and project-based cost comparisons were
summarized at the following sections.
2.2.2. Trial-design cost comparison for various structural systems Trial-design method is to do conceptual designs using the RC structural systems studied.
Normally one whole structure is designed using two or more kinds of structural system to
compare the cost on an equal basis. Effort should be made to ensure the designs in the
different methods are carried out to the same standard, so that to ensure the subsequent
costing are based on quantities not in favor of any single structural system.
2.2.2.1. Prestressed vs. Reinforced flat slab by D. Dowrick and N. Narasimhan (1978) In 1978, David Dowrick and N. Narasimhan from Ove Arup and Partners did a cost
comparison between prestressed and reinforced concrete flat slabs in UK. A trial-design
of 5-storey building was made using reinforced coffer slab, prestressed coffer slab and
prestressed solid slabs. The details of the study are presented in Table 2.1. It was found
that, using coffered slab construction; the prestressed cost was about ten percent less than
the reinforced concrete alterative.
Table 2.1 gives the summary of the trial-building’s design information. The three flab
systems studied include RC coffer slab, prestressed RC coffer slab and prestressed RC
solid slab. The costs of the buildings were estimated based on standard estimating rates
quoted by Quantity Surveyors of Ove Arup and partners in March, 1978 and prestressing
22
ATTENTION: The Singapore Copyright Act applies to the use of this document. Nanyang Technological University Library

rates by the Prestressing Equipment Manufacturers Association in May, 1978. Allowance
was also made for non-structural items, like excavation and cladding to arrive at the final
cost. The cost was calculated in terms of sterling pound.
Table 2.1. Cost comparison: Prestressed vs. Reinforced flat slab Topic Prestressed vs. Reinforced flat slab Time & place of research
1978, UK
Researcher(s) D. Dorwrick & N. Narasimhan Building info 48X28m plan, 5-storey with 3m clear height each floor Grid 10 and 12m in long direction, 8m in short direction Floor live load 4kN/ m2 Structural system RC structure; RC coffer slab vs. PSC coffer slab vs. PSC
solid slab Cost info (£): RC coffer PSC coffer PSC solid Structure 336,783 300,483 359,639 Excavation and earthwork 19,760 11,474 14,102
Cladding (exc. glazing) 53,899 51,511 49,466 Common items 1,942,200 1,888,532 1,888,532 Total cost 2,299,000 2,252,000 2,312,000 Overall unit cost (£/m2) 342 335 344
For the structural cost alone, the cost using prestressed coffer slab is 12 per cent less than
the one using RC coffer slab. For overall unit cost comparison, the difference is fairly
small. The study by David Dowrick and N. Narasimhan did not include economic
implication of timesaving from fast construction. The study was only focused on
construction cost of the building. Meanwhile, only one kind of layout and loading
condition was included, which cannot be used as a general guideline.
2.2.2.2. Precast vs. Conventional by A. Warszaski and D. Carmel (1984) In 1984, A. Warszawaski and Carmel conducted a trial-design cost comparison between
conventional RC construction and precast construction in Israel. The precast elements
23
ATTENTION: The Singapore Copyright Act applies to the use of this document. Nanyang Technological University Library

chosen were floor slabs and exterior walls. The ground floor and roofing were not
included in the comparison. The design model was selected from the standard housing
plans of Israeli Ministry of Building. The evaluation of cost included: the site labor
requirement, the construction cost, the construction time and various considerations of
more subjective nature. The details of the study are presented in Table 2.2. In the study,
the fast construction of precast method was reimbursed with time-saving values, which
was added to the final cost comparison.
Table 2.2. Cost comparison: Precast vs. conventional Topic Utilization of precast concrete element Time & place of research
1984, Israel
Researcher(s) A. Warszawski and D. Carmel Building info 4-storey residential building, 4 units of 94m2 -apartment each floor Grid 9.6m and 6.6m examined respectively Floor live load N. A. Structural system Conventional RC vs. precast floor slab and (or) exterior walls Cost information Direct cost in US$ per dwelling
Precast floor Precast floor on PC bearing walls Conventional 9.6m
span 6.6m span
Non-bearing precast walls 9.6m
span 6.6m span
Horizontal 2,684 3,304 2,548 2,684 2,711 1,955 Vertical 2,269 2,075 2,164 2,906 2,527 2,616 Total 4,952 5,379 4,712 5,590 5,238 4,571 Time saving: Time saving in month - 1 1 1 4 3
Cost adjusted * 4,592 5,099 4,432 5,310 4,118 3,731 The cost of precast elements included their direct fabrication cost and the plant overhead.
The time-saving value was examined from both the developer and contractor viewpoint.
It was further assumed that values of saving of both parties were combined to an amount
of about 1% of the total investment per month of construction time saved according to the
study by Warszawski and Carmel (1984).
24
ATTENTION: The Singapore Copyright Act applies to the use of this document. Nanyang Technological University Library

2.2.2.3. RC vs. Steel by M. M. Ali and T. C. Ang (1984)
Table 2.3. Cost comparison: RC vs. Steel
Topic Structural steel vs. concrete in tall buildings Time & place of research
1984, Singapore
Researcher(s) M. Ali and T. C. Ang ST1 RC1 ST2 RC2 ST3 RC3
Building info 25-sty, 102m high, 21,600m3 total FA
40-sty, 161m high, 56,560m3 total FA
60-sty, 238m high, 153,780m3 total FA
Structural steel: Grade 43 Reinforcing steel: Grade 410 Materials Concrete: G30 (G40 for lower 20 storeys in the 60-storey bldg
Floor live load
2.5kN/m2
ST1 RC1 ST2 RC2 ST3 RC3
Structural system
Steel rigid frame
In-situ RC rigid frame
Frame with wind bracing
In-situ RC frame & shear walls
Steel framed tube
In-situ RC framed tube
Direct cost Total in Singapore dollars Superstructure 4,190,455 2,701,020 13,531,535 9,103,640 46,784,139 35,781,560 Substructure 503,216 568,416 1,030,702 1,180,752 2,350,804 3,052,404 Preliminary, M&E, etc
9,000,000 9,000,000 20,000,000 20,000,000 75,000,000 75,000,000
Timesaving $ -26,653 - -1,071,540 - -10,514,100 - Net bldg cost 13,693,671 12,269,436 33,490,697 30,284,392 113,620,843 113,833,964Unit cost ($/m2)
634.0 568.0 592.1 535.4 738.9 740.1
In 1984, M. M. Ali and T. C. Ang conducted a comprehensive cost comparison study for
tall buildings constructed in both structural steel and reinforced concrete. Although the
study was not about various RC structural systems, it did serve as a guide for cost
comparison of different structural systems.
Three tall buildings were designed in both structural steel and reinforced concrete. The
three configurations as shown in Table 2.3 were 25-storey, 40-storey and 60-storey high.
25
ATTENTION: The Singapore Copyright Act applies to the use of this document. Nanyang Technological University Library

The factors affecting cost effectiveness of high-rise buildings were summarized by the
authors as construction techniques and degree of mechanization, local infrastructure,
speed of construction, performance of steel and concrete and price structure of material
and labor.
The value of time-saving was calculated from early rental of floor space, saving on
borrowed loan minus the income and property tax. After involving in the timesaving
value, the cost of building against number of storeys was plotted. It was found the
“break-even level” was 59 storeys, which means for buildings shorter than 59 storeys,
concrete was more cost-effective; otherwise structural steel would be more economical.
2.2.2.4. Precast vs. semi-precast by Neo R. (1997)
From 1997 to 1998, Neo, R. did a cost comparison among precast, cast in-situ and semi-
precast construction. The study was only focused on the column and beam cost, which
included material, labor, equipment and transportation costs. Table 2.4 summarized the
findings from Dr. Neo’s research.
Table 2.4. Cost comparison: Precast vs. Semi-precast Time & place of research
1997-98, Singapore
Researcher(s) Presented by Dr. Roland Neo, Neo Co. Building info N.A. Grid sizes N.A. Floor live load N.A. Structural system PC, Semi-PC and cast in-situ beam-column Cost info (S$/m3 concrete)
PC beam and column In-situ concrete Shell column & hollow beam
(60% in-situ joint concrete) Unit cost (S$/m3) 750 600 484
Table 2.4 summarized the study on the construction using precast beam-column, in-situ
beam-column and shell column & hollow beam with in-situ filled concrete. The shell
column and hollow beam were pre-fabricated and the internal hollow space to be filled
26
ATTENTION: The Singapore Copyright Act applies to the use of this document. Nanyang Technological University Library

with in-situ concrete occupied 60% of the total member volume. The final finding was
that the shell column and hollow beam with in-filled in-situ concrete was the cheapest
within the three methods studied. The cost was S$484/m3.
2.2.3. Project-based cost comparisons for various structural systems
Many investigations of comparative structural system cost were done at project level in
Singapore. These investigations were normally carried out for existing projects and one
additional system were designed besides the actual design in use to compare the cost
difference. The method is quite accurate but also very much project dependent. Tables
2.5 to Table 2.7 are examples of researches done on different RC structural systems in
recent years in Singapore.
Table 2.5. Cost comparison: Flat plate vs. Others Time & place of research
1998, Singapore
Researcher(s) Presented by Mr. John Mo, BBR construction systems Pte Ltd Building info: N. A. Grid sizes 7.5X3.5m; 8X8m; 8X12m Floor live load 1.5-2kN/m2; 3kN/m2
Flat plate RC conventional Flat slab with drop
panel
One way post-tensioning
banded beam Structural system 7.5×3.5m
, LL=1.5-2kN/m2
8×8m, LL=3kN/m2
7.5×3.5m, LL=1.5-2kN/m2
8X8m, LL=3kN/m2
8X8m, LL=3kN/
m2
8X12m, LL=3kN/m2
Overall unit cost (S$/m2) 76 90.4 95.7 119.9 85.7 110.1
The comparison done by John Mo (1998) as shown in Table 2.5 was between flat plate,
flat slab, conventional and banded beam constructions. The live loading ranged from 1.5-
3kN/m2. The cost elements included concrete, formwork, reinforcing bars and post
tension cost. For different grid sizes, the most economical structural system varied. For a
grid size of 7.5×3.5m, flat plate construction gives the least cost of S$76/m2, and for a
grid size of 8×8m, S$85.7/m2 is provided by flat slab construction with drop panels.
27
ATTENTION: The Singapore Copyright Act applies to the use of this document. Nanyang Technological University Library

The cost comparison done by Max Mayer (1997) as shown in Table 2.6 was between flat
plate, flat slab, and conventional beam-slab constructions. The live loading ranged from
1.5-3kN/m2 and the grid sizes studied included 7.5×3.5m and 8×8m. The cost elements
included concrete, formwork, reinforcing bars and post tension cost. The results show
that for residential building with 7.5×3.5 grid size and live loading of 1.5-2kN/m2, post-
tensioned flat plate construction gives the cheapest unit cost of S$66/m2, and for office
building with 8×8m grid size and live loading of 3kN/m2, flat slab with drop panels is the
most economical one with a rate of S$74.7/m2.
Table 2.6. Cost comparison: Flat plate, Flat slab and Beam-slab Time & place of research
1997-98, Singapore
Researcher(s) Presented by Mr. Max Meyer, VSL (S) Pte Ltd Building info N. A. Grid sizes 7.5X3.5m; 8X8m Floor live load 1.5-2kN/m2; 3kN/m2
Residential bldg (7.5X3.5m, 1.5-2kN/m2) Office bldg (8X8m, 3kN/m2)
Structural system Beam-
slab Post-tensioned
flat plate Beam-
slab Post-tensioned
flat plate
Flat slab with drop
panel Unit direct cost (S$/m2) 83.2 66.0 102.9 79.1 74.7
The cost comparison done by Tong C. and Tan E. P. (2000) as shown in Table 2.7 was
between flat slab and conventional beam-slab constructions. For different usage of the
building, different forms of flat slab consecution were studied due to the different grid
size and live loading requirements. The different forms of flat slab construction included
flat plate, flat slab with drop panels and banded flat slab. Each flat slab construction form
was compared with conventional beam-slab construction. The cost elements included
concrete, formwork, reinforcing bars and post tension cost. Both the price of year 1997
and 2000 were used to compare the cost differences. The results show that for various
construction requirements, the different forms of flat slab construction can give the cost
saving over conventional beam slab construction.
28
ATTENTION: The Singapore Copyright Act applies to the use of this document. Nanyang Technological University Library

Table 2.7. Cost comparison: Flat slab in mixed development
Time & place of research
1999-2000, Singapore
Researcher(s) Tong C. from ADDP Architects and Tan E. P. from Tan Ee Ping & Partners
Building info SunShine plaza, 3 residential blocks, 1 office block and 1 carpark block GFA=26389 m2
Grid N. A. Floor live load N. A.
Residential blocks Carpark blk Office blk Structural system Flat plate Convention
al Flat slab + drop panel Conv. Banded
flat plate Conv.
1997 price 77.41 95.70 79.26 - 99.30 119.85Overall
unit cost (S$/m2)
2000 price 60.26 73.10 60.85 - 76.45 90.80
2.3. Other cost theories
2.3.1. Cost significance in construction project
The principle of cost significance in construction project is that a relatively small number
of cost items contribute to a large portion of the total project cost. Many researches had
been done on this topic and it was found the hypothesis true in the United Kingdoms that
“80 per cent of the value of a project relates to only 20 per cent of the bill items.” This so
called 80/20 rule in fact exists in many fields of human life and it is a very interesting
topic.
The principle of cost significance was also investigated in Singapore. Poh (1993, 1995)
did an investigation on eight student hostels in Singapore to find out that the 80/20
distributions fitted into the bills of quantities. The cost items investigated were pertaining
to Builders Works only, which did not include preliminary and external works. Several
29
ATTENTION: The Singapore Copyright Act applies to the use of this document. Nanyang Technological University Library

cost-significant items were chosen and the study was carried out. The number of cost
significant items to the number of total builders works items were found to have an
average of 20.99%, and the total cost of the cost significant items to the total builders
works cost had a mean of 83.33%.
The cost significant study could greatly reduce the work in cost estimating. The author
would also include this topic in the comparison for the structural cost modeling.
30
ATTENTION: The Singapore Copyright Act applies to the use of this document. Nanyang Technological University Library

CHAPTER 3
DEVELOPMENT OF RESEACH FRAMEWORK In this chapter, the research framework was presented followed by the explanations to the
framework model. Clarifications were made on the trial-buildings, the designs, the Finite
Element design software, the accuracy of the calculations and the construction cost &
cost data collections.
This is a study on construction cost. It did not intend to calculate the “actual”
construction costs of the structures; instead, the “relative” building costs were calculated.
This is due to the constraint of the cost data. Details of the trial building costing method
are explained in Section 3.6.
3.1. Research framework
Two kinds of inductive cost comparison approach were summarized in the previous
chapters. In this study, the trial design approach was adopted because this approach can
give a general overall view on the issue of cost for various structural systems.
The study was limited to three RC structural systems in a fixed-sized trial building in
local context. The other two design variables were grid sizes and live loads. A number of
31
ATTENTION: The Singapore Copyright Act applies to the use of this document. Nanyang Technological University Library

trial-buildings (27 buildings) with different RC structural systems, grid sizes and live
loads were designed conceptually using Finite Element (FEM) software.
The material quantities (including concrete, reinforcement steel, formwork, prestress
tendon, hollow core slab panel, etc) associated with each design were extracted from the
design software outputs. The structural costs were worked out by multiplying the
summarized material quantities and the corresponding unit rates. Only the costs of basic
super-structures were considered in the cost study. Figure 3.1 shows the 4-step research
framework of the cost analysis.
The 1st step is to do the preliminary member sizing. With each combination of structural
system, grid sizes and live load, the preliminary sizes of the structural members were
adopted from the relevant references.
The 2nd step is the analysis and design. For the trial buildings of the same size, each trial
building with a particular RC structural system, grid size and live load combination was
designed with proper FEM software. Software SAP2000 gave the design of the column
and beam, and SAFE gave the design of the conventional slab. ADAPT Floor was used
when designing post-tensioned flat slab. The member sizes were fine tuned if necessary
from the preliminary member sizes adopted in Step 1. The outputs of the reinforcing steel
requirement in each design section were generated.
The 3rd step is the material take-off. With the intensive help of the Microsoft excel
spreadsheet, the quantity outputs generated in the 2nd step were arranged and summarized.
The overall concrete, steel reinforcement, formwork and other building materials’
quantities for the whole building were worked out in this step.
The 4th step is to work out the structural cost of the building by applying the unit rates
onto the material quantities calculated from the previous step. The study did not intend to
calculate the actual costs of the simple structures; instead, the “relative” building costs
were calculated. Details of the building cost were explained in Section 3.6. The unit rates
32
ATTENTION: The Singapore Copyright Act applies to the use of this document. Nanyang Technological University Library

of the various building materials came from trustable sources and the unit rate costing
method was commonly used in Singapore construction industry.
Selection of RC Structural system
Selection of Live load
Selection of Grid size
Preliminary structuralmember sizing withreference to relevantdesign book
Step 1 Preliminary
sizing
Cost tabulation using Singapore unit rates from reliable sources
Spreadsheet sorting up material quantities: concrete, steel, formwork, etc
“SAFE” for conventional RC slab design
“ADAPT Floor” for PT flat slab design
“SAP2000” for RC column/beam design
Analyze and Design of Building: 24m×24m, 4 storey and 4.5-meter floor-to-floor height
Selection of RC Structural system
Selection of Live load
Selection of Grid size
Step 4 Cost tabulation
Step 3 Materials take off
Step 2 Analyze and
Design
Figure 3.1. Research framework for structural cost calculation
33
ATTENTION: The Singapore Copyright Act applies to the use of this document. Nanyang Technological University Library

This study of structural cost has the following advantages:
1. A sufficient number of trial-buildings (27 buildings) were designed to give a general
idea of the relative cost-effectiveness of various structural systems in terms of
structural cost.
2. The cost-effectiveness was assessed through systems, grid sizes and live loads. It is
more comprehensive compare with previous studies on structural systems.
3. The buildings were all conceptually designed using FEM software to keep a similar
standard of designs.
4. Better accuracy in the quantity calculation is achieved due to the use of FEM design
software.
5. The ultimate building products were kept the same even though different structural
systems were used. The functions of the buildings would almost be the same besides
the possible differences in the member sizes of the buildings.
6. The material quantities were calculated, so it is always possible to apply the more
updated or insightful cost information to find out the cost in different time period and
circumstances.
3.2. The trial-buildings
Conventional in-situ beam and slab
recast Hollow Core slab with beams
PFlat Slab with Drop Panels
Figure 3.2. Different RC structural systems
34
ATTENTION: The Singapore Copyright Act applies to the use of this document. Nanyang Technological University Library

The trial-buildings shall be suitably constructed using any of the three kinds of RC
structural systems studied (figure 3.2 shows the general internal layouts). The trial-
buildings were 4-storey high, with dimension of 24m×24m in plan and a total gross area
of 2304m2. The floor-to-floor height was 4.5 meters. The grid sizes included 4.8m×4.8m,
6m×6m and 8m×8m while the live loads ranged from 3kN/m2, 7.5kN/m2 to 15kN/m2.
The trial-buildings were more like industrial buildings rather than residential buildings.
Figure 3.3 shows the whole building and floor layout for a sample 6m×6m grid sized
conventional trial-building extracted from FEM software SAP2000.
Figure 3.3. SAP2000 6m×6m grid modeling
The reason to choose the 3 different grid sizes was that the 3 sizes f
overall 24m×24m floor plan, which corresponded to 5, 4 and 3 bays. Al
used were common layouts for an industrial building. With the 3 differ
column and beam (if any) numbers differed, so were the sizes of the stru
The 3 different live load inputs, 3kN/m2, 7.5kN/m2 and 15kN/m2, were
they were the common live loads in industrial buildings. And the liv
35
ATTENTION: The Singapore Copyright Act applies to the use of this document. Nanyang Technological University Library
6m
itted well
so the 3 g
ent grid s
ctural me
selected
e load ra
6m
Beam
into the
rid sizes
izes, the
mbers.
because
nge well

covered light to heavy loaded buildings. Industrial professionals had also been consulted
on the selection of the live loads.
Table 3.1. Trial buildings configurations
System Live load 4.8m×4.8m 6m×6m 8m×8m 3kN/m2
7.5kN/m2 Conventional in-situ system 15kN/m2
3kN/m2 7.5kN/m2 Post-tensioned flat
slab 15kN/m2 3kN/m2
7.5kN/m2 Full Precast 15kN/m2 3kN/m2
7.5kN/m2 Precast hollow core
slab with in-situ columns & beams 15kN/m2
With the 3 different RC structural systems studied in different grid sizes and live loads,
there would be a total of 27 conceptual designs made. Table 3.1 summarized the 27
configurations analyzed. Precast designs were divided into full precast and partial precast
(precast hollow core slab with in-situ columns and beams) due to the precast member
weight constraint. Details on the weight constraint were discussed in Section 5.1.4.
Secondary beam
Conventional layout withsecondary beam
Precast layout with secondary beam
Secondary beam
Figure 3.4. Secondary beam layout
For 8m×8m grid precast and conventional beam–slab design, secondary beams were
used. The use of secondary beams would significantly save cost. Secondary beams in 2
36
ATTENTION: The Singapore Copyright Act applies to the use of this document. Nanyang Technological University Library

directions were added in the middle for conventional design while precast design added
secondary beams in one direction in the middle. Figure 3.4 shows the layout for the
secondary beams for the conventional and precast systems. Although PT flat slab is
normally used for large span, for the sake of comparison in a complete grid size range,
PT flat slab cost was still studied for the 4.8m and 6m grid sizes.
3.3. Design assumptions
Designs were carried out according to British Standard: Structural Use of Concrete
(BS8110: 1985). Only vertical loads were considered in the designs. Fixed supports and
connections were used in the analysis. 1-hour fire resistance and mild exposure of
concrete were assumed. Main reinforcement had a strength fy =460N/mm2. The roofs
were designed with 1.5kN/m2 live load. The designs of beams and slab for every floor
were assumed to be the same (including the 1st floor). The roof was designed separately
due to the load and member size differences.
The columns were of square shape and beams were rectangular. No overlapping of steel
was considered. Steel in the slab used wired mesh plus steel bars configuration. Wired
mesh were laid throughout the slabs and additional bars were placed in the mid spans and
end spans where required.
The design assumptions for the individual structural systems were summarized below.
Conventional beam-slab design
The slabs were designed as two-way slab. The concrete used had an fcu=30N/mm2. The
imposed dead load (besides the self weight of the member) on floors and roof, which
included services and partitions (if any) were 1.5kN/m2 and 0.5kN/m2 respectively.
The preliminary member sizes of columns, beams and slabs were adopted from
Goodchild (1997).
37
ATTENTION: The Singapore Copyright Act applies to the use of this document. Nanyang Technological University Library

Precast design
The slab used one-way precast prestressed hollow core. Concrete topping was placed on
the hollow core slabs. Beams and columns mould used industrial systems (Neo, 1997).
The concrete used for beams and columns had an fcu=35N/mm2. The imposed dead load
(besides self weight of the member) on floors and roof were 2.7kN/m2 and 1.7kN/m2
respectively, which included topping finishing, services and partitions (if any).
The preliminary member sizes of columns, beams and slabs were adopted from CIDB
(1997).
Post-tensioned flat slab design
Drop panels were used where necessary and in this study, only 8m×8m grid with live
load of 15kN/m2 used drop panels. The concrete used for slabs and columns had fcu of
40N/mm2 and 30N/mm2 respectively. The imposed dead load (besides the self weight of
the member) on floors and roof, which included services and partitions (if any) were
1.5kN/m2 and 0.5kN/m2 respectively. The roofs were designed as conventional since the
live load was quite small.
Class 3 members were adopted in the design. The post-tensioning force over area ratio
P/A was limited to be less than 3.5N/mm2. Necessary cover was provided. The prestress
tendons were bonded and had diameters of 12mm. Ducts were group of 4 tendons and
they run through the spans in the form of simple parabolic.
The preliminary member sizes and post-tensioned tendon numbers were adopted from
Goodchild (1997).
38
ATTENTION: The Singapore Copyright Act applies to the use of this document. Nanyang Technological University Library

3.4. Finite element analysis software
Finite element (FEM) software is commonly used for analysis. More and more designs
are also carried out in FEM software because of the accuracy and saving in material
achieved. FEM software SAP2000 Nonlinear, SAFE and ADAPT Floor were used in the
analysis. Since SAP2000 does not generate slab design information, it was used to design
column and beam while SAFE ver. 6.0 was used for conventional slab design. ADAPT
Floor 1.17b was used to design post-tensioned flat slab.
The designs from FEM software might not be as conservative as the traditional designs.
Since the three types of RC structural systems were all designed using FEM software, the
basis for comparison was still valid and fair.
The study involved intensive design works. 27 trial-buildings were designed conceptually,
which was quite some effort. Only with the help of the FEM software was the author able
to finish the designs within a reasonable timeframe.
3.5. Accuracy of the calculation
Unlike ADAPT Floor, which is a design software, the FEM software SAP2000 and
SAFE ver. 6.20 were more used for analysis. The results from the program were
relatively not as conservative as the designs in practice. But they are still popular design
tools in many parts of the world.
Because in SAP2000, the whole conceptual building, instead of one floor, was modeled
to do analysis, the accuracy of using the same floor design for the 4 storeys became
doubtful. To solve the doubt, the SAP2000 slab moment distributions for each floor were
compared. The comparison is shown in Figure 3.4. This comparison was based on a
39
ATTENTION: The Singapore Copyright Act applies to the use of this document. Nanyang Technological University Library

6m×6m grids building with live load of 7.5kN/m2. It was found that the moment
distributions in every floor were very close.
Figure 3.4 shows that the moment distributions in each floor are quite similar. The graph
on the top left corner is the moment distribution of top floor and the one on the right is
for 3rd floor and similarly, the moment distributions for 2nd and 1st floor are shown on the
bottom left and right corners respectively. The contour for moment value is in the range
of –30 30kN/m2 as shown in the scale at the bottom of each graph.
Top floor 3rd
floor
2nd floor
1st floor
Figure 3.5. Moment distribution for floor 4 to floor 1
40
ATTENTION: The Singapore Copyright Act applies to the use of this document. Nanyang Technological University Library

For the beam design of each floor, the beams’ steel reinforcement amount of the same
positions from each floor was compared. Four representative points (A, B, C and D) were
chosen and the results are shown in Figure 3.5. The steel quantities from the 4 points in
each floor were summed up to find the total steel quantities needed. It is shown that the
coefficient of variance from the total steel quantities from the 4 points was very small
(0.01), which meant the value of total steel amount in each floor was very close. Thus it
was concluded that the steel quantities from one of the floors could be used to represent
the total steel needed.
Level
Point 4 3 2 1 A 325 530 490 425 B 555 486 488 497 C 603 624 615 600 D 1293 1224 1250 1294
2776 2864 2843 2816 Average 2824.75
COV 0.011643
DC
A Bn
Figure 3.6. Reinforced steel requirement (mm2) in various bea
floors
Figure 3.6 is the moment distribution comparison of SAFE an
programs use 6m×6m grid with live load of 7.5kN/m2. The gra
moment distribution generated from SAFE grogram while the o
from SAP2000. The moment pattern is very similar to each ot
used together with SAP2000 for the design of the same trial bu
design slabs while SAP2000 to design columns and beams,
generate slab design information.
41
ATTENTION: The Singapore Copyright Act applies to the use of this document. Nanyang Technological University Library
Beam as shown on pla
m sections for different
d SAP2000 results. Both
ph on the left is the slab
ne on the right is a floor
her, so SAFE 6.0 can be
ilding. SAFE was used to
since SAP2000 does not

Figure 3.7. Moment distribution in slab from SAFE 6.20 and SAP2000
3.6. Construction cost and cost data collection
3.6.1. Study scope of the construction cost
The cost of construction could be classified in 2 ways. According to the elements of
construction work, the cost could be divided into: structural cost, sub-structure cost,
Mechanical and Electrical cost, architectural cost, preliminary cost, etc. The other way is
to divide the cost into site cost and markup. The site cost includes site direct cost and site
overhead and the site overhead cost is the cost associated with the setup and maintaining
of site-office. The cost markup includes company overhead and profit.
In this study, only the cost for the basic superstructure of the 4-storey building was
investigated. The costs of the columns, beams (if any) and slabs were found out. The cost
of staircase was not included. Due to the cost data obtained, the basic superstructure
construction cost included site cost and markup. The cost information was further
explained in Section 3.6.2.
42
ATTENTION: The Singapore Copyright Act applies to the use of this document. Nanyang Technological University Library
3.6.2. Cost data collection and the Unit rates
As summaries by Dagostino (1993), the cost estimating methods could be classified into
two types as detailed and preliminary methods. The detailed method determines the
quantities and cost of everything required to complete the work including material, labor,
equipment, insurance, etc and it is used for competitive bidding. The preliminary method
is to multiply the volume or area of the building with an assumed cost per unit and it is
used for preliminary estimating.
The unit rate costing method as described in this report is to sum up the construction cost
of each construction material. The construction cost of each construction material could
be found by multiplying the construction material quantity by its corresponding unit rate.
For the construction of basic superstructure, the works could be classified into concrete
work, reinforcement steel work, formwork work and other works, e.g. prestress work.
After acquiring the various material quantities and the unit rates for each, the construction
cost of the basic superstructure could be found out using Equation 3.1.
Construction cost (unit cost × material quantities) (Eqn. 3.1) ∑=
The unit rate for each building material, e.g. “$/m3 concrete work, $/ton steel work”
consists the cost of material, labor and necessary equipments and markup. The unit rates
for the same building material under different structural system could be different and
this was explained in details in Section 5.1. As explained in CPG cost index (CPG 2003),
the rates included:
1) Labor and all costs in connection therewith
2) Materials and goods including waste, laps, joints, and all costs in connection with
3) Supplying, transporting, delivering, unloading, storing and hoisting materials and
return of packings
43
ATTENTION: The Singapore Copyright Act applies to the use of this document. Nanyang Technological University Library
4) Straight, raked or circular cutting
5) Fabricating, assembling, fitting, fixing and bedding materials and goods in position
6) Preparing surfaces to receive work
7) Protecting materials and work
8) Machinery, equipment and all costs in connection therewith
9) Cleaning up on completion and making good all work disturbed
10) Establishment charges, overhead charges, preliminaries and profit.
For the unit rate of each construction material, the rate was further clarified and explained
in the CPG cost index as follows:
In-situ concrete rate:
1) Temporary grounds, pipes and boxings to form grooves, chases, mortices, holes and
openings
2) Laying on any types of sub-base and laying on falls and campers
3) Compacting concrete by tamping or vibrating
4) Working between and around reinforcement
Reinforcing steel rate:
1) Cleaning and wire-brushing bars to remove rust, dust, mill scale, dirt, oil and other
deleterious matters
2) Bending, cutting and notching around obstructions
3) Hooks and tying wires at all joints and crossings
4) Non-designed spacers or chairs and distance blocks
The rate of each item of Bar Reinforcement shall be applicable only to bar not exceeding
12m in length and shall include allowances for rolling margin.
Timber formwork rate:
1) Boarding, battens and supports
2) Erecting, framing, bolting and wedging
44
ATTENTION: The Singapore Copyright Act applies to the use of this document. Nanyang Technological University Library
3) Wetting and treating with mould oil
4) Notching, allowance for overlaps and passage at angles
5) Forming chamfered edges and splayed internal angles not exceeding 50mm wide
6) Casting, skirting and removal of formwork
Precast hollow core slab rate:
1) Provision of recesses, brackets, embedded fixtures, covered opening and other
services
2) Sealing the voids with approved epoxy, concrete and other materials
3) Hoisting with a lifting beam and top-lift clamps and accessory safety chains or belts
4) Conforming to water tightness as required
The unit rate, expressed as “fixed schedule of rates” in CPG Cost Index Quarterly, is
“intended to be used for the pricing of variations” (CPG 2003). The rates are not used to
price the whole project, but it could well reflect the relative construction costs of different
construction materials.
As the costs for material, labor, equipment, etc are always fluctuating; a unified cost
system could well reduce the variation and give a clearer overall picture. The unit rates
were worked out through statistical means and they were tracked by both government
agencies and private consultants including BCA (Building and Construction Authority of
Singapore) and CPG Corporation over the years for quantity surveying and cost estimates
purpose. It would be reasonably reliable in Singapore circumstance.
The unit rates from CPG (2003) did not include prestress cost, so the prestress unit rate
was obtained from Singapore prestress contractors. The unit rates as extracted from CPG
cost index quarterly (CPG 2003) and one major prestress contractor in Singapore were
shown in Table 3.2.
Special attention must be paid when the sources of the different building materials’ unit
rates were not the same. In this case, the unit rate for post-tensioned tendon was not the
45
ATTENTION: The Singapore Copyright Act applies to the use of this document. Nanyang Technological University Library

same as the other materials. The basis for comparison might not be very fair in such
circumstance. Cost information was very sensitive and confidential in the construction
market, and in this study, the author tried to use the available cost information to give a
reasonably fair cost comparison. Readers are always encouraged to use their own cost
information (if available) to study the cost together with the material quantities obtained
in this study.
Table 3.2. CPG unit rates 2003 Q3
Material Description Unit Price (S$) Lean concrete Grade 20 m3 83
Grade 30 m3 82 Grade 35 m3 84 Reinforced concrete Grade 40 m3 86
10mm diameter Mild steel ton 1000 10mm diameter HT ton 930 13mm diameter HT ton 990 16mm diameter HT ton 980 20mm diameter HT ton 970 22mm diameter HT ton 960
Reinforcement
25mm diameter HT ton 960 A7 m2 4.11 A8 m2 5.27 A9 m2 6.57 Fabric reinforcement
A10 m2 8.01 Plan surface m2 23 Timber Formwork Plan surface (for flat slab) m2 19.55 215mm thick m2 61 265mm thick m2 69 325mm thick m2 79 Precast hollow core slab
360mm think m2 87 Prestress tendon 12mm bonded, duct of 4 cables m 9.5
Source: CPG cost index 2003 Q3 and information provided by a local prestress company
in Singapore The unit rate information was more suitable to be applied on conventional construction,
which is still the most widely used construction method in Singapore. Thus, necessary
adjustment was carried out for the unit rates in other RC structural systems. For example,
the unit rate of formwork for flat slab construction would generally be less than that for
46
ATTENTION: The Singapore Copyright Act applies to the use of this document. Nanyang Technological University Library

conventional construction. Also, the formwork unit rate in the CPG cost index is for on-
site timber formwork, and modifications on the rates were made for the formwork cost
for precast members. Details of the adjustment were discussed in Section 5.
47
ATTENTION: The Singapore Copyright Act applies to the use of this document. Nanyang Technological University Library

CHAPTER 4
DESIGN QUANTITIES AND CALCULATIONS
Lots of designs were carried out to calculate material quantities for different RC
structural systems. The designs were done with reference to the relevant design
guidebooks, including CIDB (1997) and Goodchild (1997). For 8m×8m grid precast and
conventional beam–slab design, secondary beams were used. The use of secondary
beams would significantly save cost. Secondary beams in 2 directions were added in the
middle for conventional design while precast design added secondary beams in one
direction in the middle.
As mentioned previously, the structural cost can be grouped according to building
materials, which include formwork cost, concrete cost, reinforcing steel cost and other
material cost like prestress tendon cost. For each trial building, the quantities of concrete
and formwork could be easily found after determining the sizes of the structural members.
The tedious part was to find the quantities of steel reinforcement in the members.
48
ATTENTION: The Singapore Copyright Act applies to the use of this document. Nanyang Technological University Library

4.1. Concrete, formwork and prestress Tendon
Table 4.1 (1). Member sizes for conventional system
4.8mX4.8m 6mX6m 8mX8m 8mX8m with sec beams1.5kN/m2 (roof) 140 160 220 135
3kN/m2 152 180 240 140 7.5kN/m2 160 190 252 140
Slab (mm) (d)
15kN/m^2 200 250 300 160 1.5kN/m2 (r) 250x300 250x450 300x600 250x400
3kN/m2 250x400 300x500 300x600 250x400 7.5kN/m2 250x400 300x500 350x650 300x450
Beam (mm) (b×d)
15kN/m2 300x400 300x500 400x650 300x500 1.5kN/m2 (r) 400 450 500 500
3kN/m2 400 450 550 550 7.5kN/m2 400 550 650 650
Column (mm) (d)
15kN/m2 500 650 750 750
Table 4.1 (2). Member sizes for precast system
4.8mX4.8m 6mX6m 8mX8m 8mX8m with sec beams1.5kN/m2 (roof) 215hc* 215hc 265hc 215hc
3kN/m2 215hc 215hc 265hc 215hc 7.5kN/m2 215hc 265hc 265hc 265hc
Slab (mm) (d)
15kN/m2 265hc 325hc 360hc 265hc 1.5kN/m2 (r) 250×450 250×550 600X800 300x700
3kN/m2 250×450 250×650 600X800 300x700 7.5kN/m2 300×500 600×750 800×800 450x700
Beam (mm) (b×d)
15kN/m2 500×600 800×800 1000×900 500x800 3kN/m2 400 400 550 550
7.5kN/m2 450 550 650 650 Column (mm)
(d) 15kN/m2 550 650 800 800
Table 4.1 (3). Member sizes for PT flat slab system
4.8mX4.8m 6mX6m 8mX8m 1.5kN/m2 (roof)(conv.) 140 160 135
3kN/m2 180 200 200 7.5kN/m2 180 200 210
Slab (mm) (d)
15kN/m2 200 220 210DP* 1.5kN/m2 (r)(conv.) 400 450 500
3kN/m2 400 450 550 7.5kN/m2 400 550 650
Column (mm)(d)
15kN/m2 500 650 750
(* DP: with drop panel)
49
ATTENTION: The Singapore Copyright Act applies to the use of this document. Nanyang Technological University Library

Table 4.1 shows the member sizes for the various structural configurations. They were
adopted and modified from the preliminary sizing in the studies mentioned at the
beginning of this Chapter. The beams were rectangular and expressed as the width ×
depth in the table. The sizes of the columns, beams and slabs were expressed in
millimeter. The precast slab used hollow core (hc) slab. The PT flat slab used flat plate
except the configuration of 8m×8m grid with 15kN/m2, which used drop panels.
For conventional and precast construction with 8m×8m grid size, designs were made both
with and without secondary beams. Finally, 8m×8m buildings with secondary beams
were used in the comparison because this configuration was more reasonable. The roof in
PT flat slab construction was the same as conventional in-situ beam-slab system and the
roof beam and slab sizes would be the same as the sizes for conventional construction in
Table 4.1 (1).
With the member sizes determined, the concrete and formwork quantities could be
calculated directly, and they are shown in Table 4.2. In Table 4.2, the concrete quantities
in m3 and formwork quantities in m2 are shown. The quantities were arranged according
to various structural systems, grid sizes and live loads. They were further classified into
column, beam and slab quantities. The formwork was calculated as the material necessary
to cover and do the molding. For precast construction, there were no concrete and
formwork quantities for slabs since they were industrialized hollow core slab. But the
concrete quantities for in-situ topping on precast slabs were summarized.
50
ATTENTION: The Singapore Copyright Act applies to the use of this document. Nanyang Technological University Library

Table 4.2. Overall concrete and formwork quantities for various configurations
Concrete (m^3) Formwork (m^2) Conventional Column Beam Slab Column Beam Slab
3kN/m^2 103.7 136.8 430.9 1036.8 1023.6 2880.0 7.5kN/m^2 103.7 136.8 449.3 1036.8 1005.1 2880.0 4.8×4.8 15kN/m^2 147.4 159.8 541.4 1231.2 970.6 2880.0 3kN/m^2 91.1 171.0 506.9 810.0 1101.6 2880.0
7.5kN/m^2 124.9 171.0 529.9 945.0 1082.4 2880.0 6×6 15kN/m^2 165.4 171.0 668.2 1080.0 967.2 2880.0 3kN/m^2 83.3 244.8 400.3 619.2 1729.0 2880.0
7.5kN/m^2 109.3 301.4 400.3 705.6 1930.6 2880.0 8x8
(with sec. beams) 15kN/m^2 139.5 335.0 446.4 792.0 1972.8 2880.0
Concrete (m^3) Concrete Topping (m^3) Formwork (m^2) Precast
Column Beam Slab Column Beam 3kN/m^2 103.7 162.0 144.0 972.0 1656.0
7.5kN/m^2 131.2 183.6 144.0 972.0 1828.8 4.8×4.8 15kN/m^2 196.0 270.0 144.0 1490.4 2289.6 3kN/m^2 72.0 177.0 144.0 759.4 1812.0
7.5kN/m^2 136.1 315.0 144.0 1141.9 2340.0 6×6 15kN/m^2 190.1 406.2 144.0 1321.9 2628.0 3kN/m^2 87.1 277.2 144.0 777.6 2244.0
7.5kN/m^2 121.7 388.1 144.0 892.8 2402.4 8x8
(with sec. beams) 15kN/m^2 184.32 477.84 144 1065.60 2666.4
Concrete (m^3) Formwork (m^2) Post-tensioned flat slab Column Roof beam Slab Column Roof beam Slab
3kN/m^2 103.7 21.6 495.4 1036.8 164.2 2880.0 7.5kN/m^2 103.7 21.6 495.4 1036.8 164.2 2880.0 4.8×4.8 15kN/m^2 147.4 21.6 541.4 1231.2 164.2 2880.0 3kN/m^2 91.1 27.0 553.0 810.0 199.2 2880.0
7.5kN/m^2 124.9 27.0 553.0 945.0 199.2 2880.0 6×6 15kN/m^2 165.4 27.0 599.0 1080.0 199.2 2880.0 3kN/m^2 83.3 48.9 538.6 619.2 291.4 2880.0
7.5kN/m^2 109.3 48.9 561.6 705.6 291.4 2880.0 8×8 15kN/m^2 139.5 48.9 578.6 792.0 291.4 2961.0
The prestress tendons used in post-tensioned flat slab construction were grouped in flat
ducts, and every duct comprising 4 tendons run through the spans in the form of simple
parabolic. Figure 4.1 shows a tendon layout for the 6m×6m grid with live load of
7.5kN/m2, with each solid line represents one strip of duct consisting 4 tendons of 12mm
diameter each. About 60% to 75% of the post-tensioned tendons were distributed along
the column strips while the remaining in the mid strips.
51
ATTENTION: The Singapore Copyright Act applies to the use of this document. Nanyang Technological University Library

The tendon quantities, in the unit of meter for the 4-tendon-duct, ranged from 4608m to
7296m. 7296m of duct was used for 8m×8m grid with live load of 15kN/m2 and 5760m
of duct was used for 8m×8m grid with live load of 3kN/m2 and 7.5kN/m2. The other
configurations of PT flat slab all used 4608m of PT duct.
Figure 4.1.Sample tendon layout
4.2. Reinforcing Steel quantities
The reinforcing steel design included longitudinal steel and shear steel designs. The shear
reinforcement used 10mm mild steel or high tensile steel. Wire mesh is the first choice
for steel in the slab. The minimum steel reinforcement requirement and maximum
reinforcement spacing were followed accordingly in the quantity collections. Detailed
outputs from the finite element software and the calculation spreadsheets are attached in
the appendices.
The illustration sample of the calculations and results sheets in this section was of
6m×6m grid with 7.5kN/m2 in conventional beam-slab construction. The overall steel
52
ATTENTION: The Singapore Copyright Act applies to the use of this document. Nanyang Technological University Library

quantities together with the concrete, formwork and tendon quantities were summarized
in the tables in Appendix A.
4.2.1. Reinforcing steel quantities in columns
The steel quantities in columns included longitudinal and shear reinforcement. For
simplicity, the longitudinal steel reinforcement in the column was assumed to be the same
continuously throughout for the 4 storey low-rise trial building. The longitudinal
reinforcement bars were welded in connection, so no overlapping of reinforcement bars
was considered.
Table 4.3. Sample steel quantities for columns
Elem Station Longitudinal (mm2)
Shear22 (mm2/mm)
Shear33 (mm2/mm)
1 0 1210 0.55 0.55
1 2160 1210 0.55 0.55
1 4320 1210 0.55 0.55
2 0 1210 0.55 0.55
2 2160 1210 0.55 0.55
2 4320 1210 0.55 0.55
3 0 1210 0.55 0.55
3 2160 1210 0.55 0.55
3 4320 1210 0.55 0.55
4 0 1210 0.55 0.55
4 2160 1210 0.55 0.55
4 4320 1210 0.55 0.55
Table 4.3 gives the simplified column steel quantities output sample from SAP2000.
Bigger sample of the original SAP2000 output for column was attached in Appendix B.
Because this column was of the size 550mm×550mm, 12 no of reinforcement steel bars
were used in each column. The shear link spacing in the column should not exceed 12
times minimum longitudinal bar diameter. In this case, the minimum longitudinal bars
53
ATTENTION: The Singapore Copyright Act applies to the use of this document. Nanyang Technological University Library
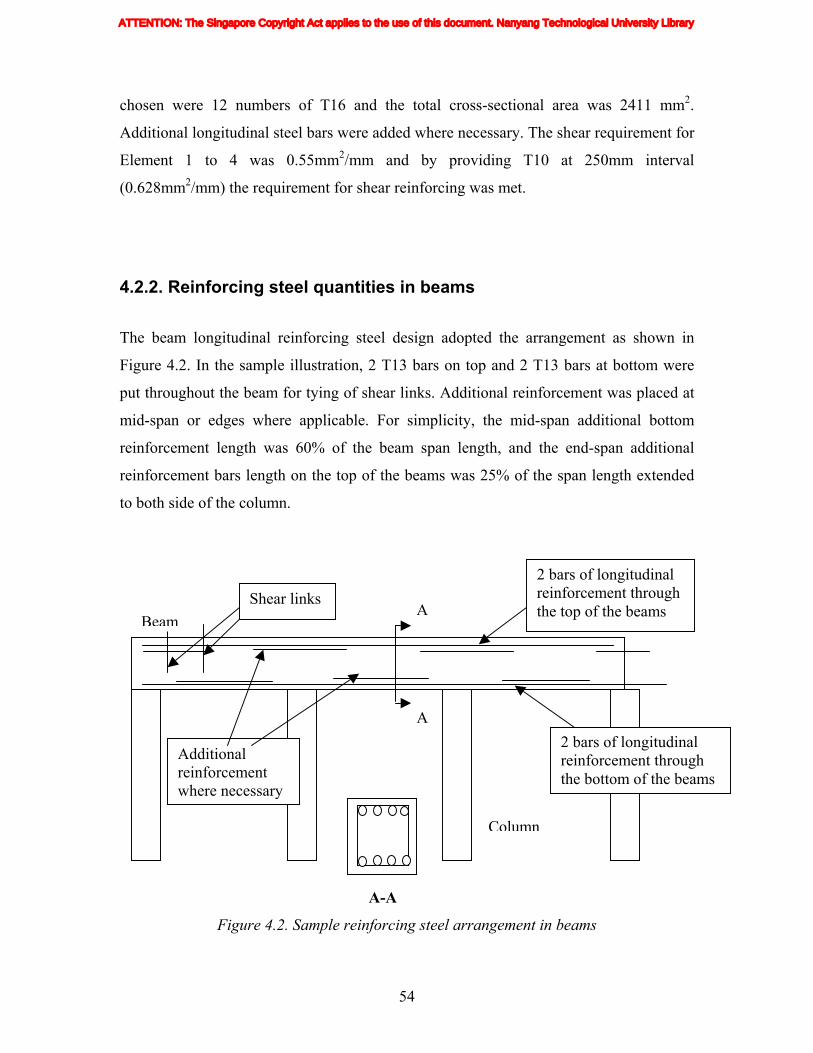
chosen were 12 numbers of T16 and the total cross-sectional area was 2411 mm2.
Additional longitudinal steel bars were added where necessary. The shear requirement for
Element 1 to 4 was 0.55mm2/mm and by providing T10 at 250mm interval
(0.628mm2/mm) the requirement for shear reinforcing was met.
4.2.2. Reinforcing steel quantities in beams
The beam longitudinal reinforcing steel design adopted the arrangement as shown in
Figure 4.2. In the sample illustration, 2 T13 bars on top and 2 T13 bars at bottom were
put throughout the beam for tying of shear links. Additional reinforcement was placed at
mid-span or edges where applicable. For simplicity, the mid-span additional bottom
reinforcement length was 60% of the beam span length, and the end-span additional
reinforcement bars length on the top of the beams was 25% of the span length extended
to both side of the column.
Shear links
A-A
A
ABeam
2 bars of longitudinal reinforcement through the top of the beams
2 bars of longitudinal reinforcement through the bottom of the beams
Additional reinforcement where necessary
Column
Figure 4.2. Sample reinforcing steel arrangement in beams
54
ATTENTION: The Singapore Copyright Act applies to the use of this document. Nanyang Technological University Library
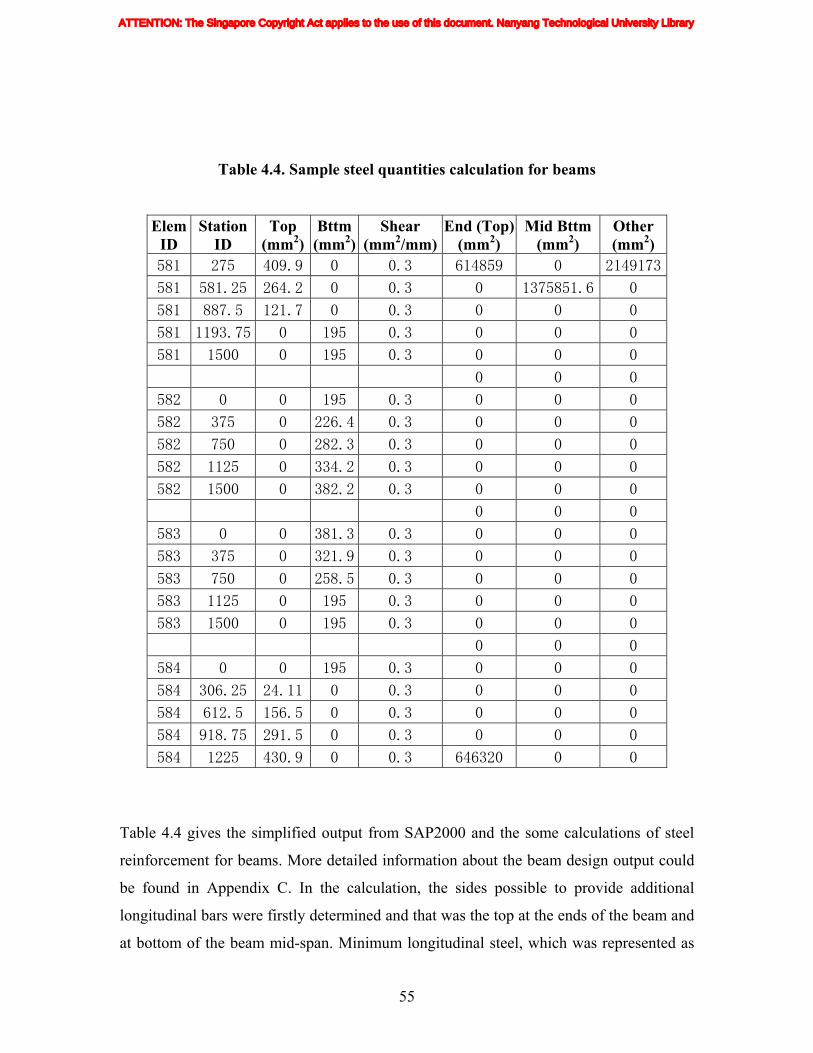
Table 4.4. Sample steel quantities calculation for beams
Elem ID
Station ID
Top (mm2)
Bttm (mm2)
Shear (mm2/mm)
End (Top) (mm2)
Mid Bttm (mm2)
Other (mm2)
581 275 409.9 0 0.3 614859 0 2149173
581 581.25 264.2 0 0.3 0 1375851.6 0
581 887.5 121.7 0 0.3 0 0 0
581 1193.75 0 195 0.3 0 0 0
581 1500 0 195 0.3 0 0 0
0 0 0
582 0 0 195 0.3 0 0 0
582 375 0 226.4 0.3 0 0 0
582 750 0 282.3 0.3 0 0 0
582 1125 0 334.2 0.3 0 0 0
582 1500 0 382.2 0.3 0 0 0
0 0 0
583 0 0 381.3 0.3 0 0 0
583 375 0 321.9 0.3 0 0 0
583 750 0 258.5 0.3 0 0 0
583 1125 0 195 0.3 0 0 0
583 1500 0 195 0.3 0 0 0
0 0 0
584 0 0 195 0.3 0 0 0
584 306.25 24.11 0 0.3 0 0 0
584 612.5 156.5 0 0.3 0 0 0
584 918.75 291.5 0 0.3 0 0 0
584 1225 430.9 0 0.3 646320 0 0
Table 4.4 gives the simplified output from SAP2000 and the some calculations of steel
reinforcement for beams. More detailed information about the beam design output could
be found in Appendix C. In the calculation, the sides possible to provide additional
longitudinal bars were firstly determined and that was the top at the ends of the beam and
at bottom of the beam mid-span. Minimum longitudinal steel, which was represented as
55
ATTENTION: The Singapore Copyright Act applies to the use of this document. Nanyang Technological University Library

“Other” in the table was calculated from the minimum steel requirement due to the beam
size. Additional amount of longitudinal reinforcement was calculated from the results
generated from SAP2000. In this case, the additional steel at top and bottom for Element
581-584 were 614859 and 1375851.6mm3 respectively. The shear link uses T10 at
250mm intervals also and the shear reinforcement area provided was 0.628mm2/mm,
which was greater than the minimum design requirement 0.3mm2/mm for shear
reinforcing at this section.
4.2.3. Reinforcing steel quantities in slabs
The steel quantities in the slabs were calculated by Finite Element software SAFE
(conventional slab) and ADAPT (PT flat slab). Floor slab and roof slab were designed
separately. Sample of SAFE and ADAPT outputs were attached in Appendix D and E.
The steel reinforcement in slabs used wired mesh plus steel bar configuration and the
wired mesh in this sample trial building was of size A8 (for wired mesh code: refer to
Appendix F) for both the floor and roof slabs. The reinforcement in the slab was arranged
according to column-strips and mid-strips. No vertical reinforcement was provided in the
slab.
The minimum steel reinforcement requirement and maximum reinforcement spacing
were followed accordingly in the quantity collection for the slabs.
4.2.4. Total reinforcing steel quantities
After calculating the steel quantities in columns, beams and slabs, the total steel
quantities for a trial-building of 6m×6m grid with 7.5kN/m2 live load in conventional
beam-slab construction was summarized in Table 4.5.
56
ATTENTION: The Singapore Copyright Act applies to the use of this document. Nanyang Technological University Library

Table 4.5. Total steel quantity for the trial-building
Beams Slab Steel quantities Column Floor Roof Floor Roof
Vol (m3) 1.26428 0.958 0.135 1.63 0.71 Main Steel
Mass (ton) 9.8614 7.474 1.05 12.73 Mesh
A8 5.51 Mesh
A8 Shear Steel Vol 0.37445 0.588
(B10) Mass 2.92067 4.585
The overall steel quantities data sheet for the trial buildings with different configurations
can be found in Appendix A.
57
ATTENTION: The Singapore Copyright Act applies to the use of this document. Nanyang Technological University Library

CHAPTER 5
RESULTS AND DISCUSSIONS
5.1. Modified unit rates and other considerations
To work out the cost of each trial-designed building, proper unit rates must be applied
onto the designed quantities. The unit rates directly extracted from CPG cost index are
more suitable for conventional in-situ construction. For flat slab construction and precast
construction, the unit rates should be modified in the cost calculations.
5.1.1. Flat slab unit rates
For flat slab construction, because of the ease in the reinforcing steel and formwork work
in the slab construction, lower unit rates should be provided compared with conventional
reinforcing steel and formwork unit rates.
Lau and Ng (1996) reported a relationship of reinforcing steel and formwork unit rates
for slab between flat slab and conventional beam-slab as 0.8 and 0.85, which meant flat
slab unit rates were lower by 20% and 15% for reinforcing steel and formwork work
respectively. It was assumed the proportion of 0.8 and 0.85 still hold for 2003 Singapore
58
ATTENTION: The Singapore Copyright Act applies to the use of this document. Nanyang Technological University Library
rates, thus the modified flat slab reinforcing steel and formwork unit rates from CPG cost
index were shown in Table 5.2.
5.1.2. Precast costing Precast construction cost was not directly found out by multiplying the quantities with
respective unit rates. The cost of a precast member can be divided into component,
delivery and installation costs. Studies on precast costing include Neo (1997) and BCA
(1999). The component cost could be further divided into concrete, steel and formwork
costs as like conventional construction.
There was a significant cost saving in precast component formwork cost and it was due to
the use of standardized mould (formwork), which facilitated high number of formwork
reuse (Neo 1997). Due to the project size constraint, project-based mould was used. The
mould cost for columns and beams would go down to about 10% of the conventional
formwork if maximum efficiency of the project-based mould was achieved, which was
about 100 times of use.
Efficiencies of 80% for beams and 70% for columns were assumed for mould reuse
because the column number ranged from 64 to 144 and beam number ranged from 210 to
250 from 4.8×4.8m grid to 8m×8m grid. Formwork material cost makes up about 40% of
the formwork unit rate for timber formwork. Assuming the other costs making up the
mould unit rate are the same for in-situ and precast formwork, thus the mould unit rates
for precast column and beam could be reduced to:
Column mould: 23×60% +23×40%×10%÷70%=$15.1/m2
Beam mould: 23×60%+23×40%×10%÷80%=$15.0/m2
The delivery and installation costs also make up significant portions in overall precast
construction cost and the cost percentages were studied by Neo and BCA. Table 5.2
summaries the cost percentages of delivery and installation in the total precast member
59
ATTENTION: The Singapore Copyright Act applies to the use of this document. Nanyang Technological University Library

cost. The cost percentages as studied were quite close. There was on average a 3.25%
cost component on delivery and 18.75% for installation. In total, there was a 22% cost
component for delivery and installation in total. As the CPG unit rate for precast hollow
core slab included delivery and installation cost as discussed in Section 3.6.2, the
additional 22% delivery and installation cost would be applied onto precast column and
beam component costs assuming off-site precasting.
Table 5.1. Proportions of delivery and installation cost in total PC member cost
Delivery Installation Total Neo 1997: 4% 20% 24% BCA 1999 2-3% 15-20% 20% Average 3.25% 18.75% 22%
Table 5.2. Modified CPG unit rates 2003 Q3
Material Description Unit Price (S$)
Lean concrete Grade 20 m3 83 Grade 30 m3 82 Grade 35 m3 84 Reinforced concrete Grade 40 m3 86
10mm diameter Mild steel ton 1000 High Tensile (slab) ton 980 HT (column/beam) ton 980 Reinforcement
HT (flat slab) ton 784 A7 m2 4.11 A8 m2 5.27 A9 m2 6.57 Fabric reinforcement
A10 m2 8.01 Plan surface m2 23 Timber Formwork Plan surface (for flat slab) m2 19.55
Column m2 15.1 Project-based mould (precast) Beam m2 15.0
215mm thick m2 61 265mm thick m2 69 325mm thick m2 79 Precast hollow core slab
360mm think m2 87 Prestress tendon 12mm bonded, duct of 4 cables m 9.5
60
ATTENTION: The Singapore Copyright Act applies to the use of this document. Nanyang Technological University Library

5.1.3. Other modified unit rates
In slab reinforcing, the reinforcing steel was mainly T13; while in beams and columns, it
was mainly T16. So, the reinforcing steel unit rates were averaged and grouped into slab
and column/beam rates from the original different rates for different bar sizes in the CPG
cost index. Take into consideration the different flat slab and precast unit rates; the
overall modified unit rates were presented in Table 5.2.
5.1.4. Precast member mass
One important consideration in precast construction is the member weight and crane
capacity. If the member weight exceeds normal crane capacity, bigger crane has to be
brought in for lifting and the cost would have to be increased by a lot. Neo (1997)
suggested member mass to be less than 3 ton for normal crane to function.
Table 5.3. Precast member mass
Column Beam Precast d
(mm) Length
(m) Weight (ton)
b (mm)
d (mm)
Length (m)
Weight (ton)
3kN/m^2 400 4.5 1.728 250 450 4.8 1.296 7.5kN/m^2 450 4.5 2.187 300 500 4.8 1.728 4.8×4.8 15kN/m^2 550 4.5 3.267 500 600 4.8 3.456 3kN/m^2 400 4.5 1.728 250 650 6 2.34
7.5kN/m^2 550 4.5 3.267 600 750 6 6.48 6×6 15kN/m^2 650 4.5 4.563 800 800 6 9.216 3kN/m^2 550 4.5 3.267 600 800 8 9.216
7.5kN/m^2 650 4.5 4.563 800 800 8 12.2888×8 15kN/m^2 800 4.5 6.912 1000 900 8 17.28 3kN/m^2 550 4.5 3.267 300 700 8 4.032
7.5kN/m^2 650 4.5 4.563 450 700 8 6.048 8x8 (with sec. beam)
15kN/m^2 800 4.5 6.912 500 800 8 7.68
Since the trial buildings in the author’s study were not of big size, it was not practical to
use big cranes. Neo’s finding was followed and the precast members weighted over 3
61
ATTENTION: The Singapore Copyright Act applies to the use of this document. Nanyang Technological University Library

tons were changed to be constructed on site. Table 5.3 shows the member mass for the
various configurations. In this case, as shown in bold italic letters in Table 5.3, only
4.8m×4.8m grid with live load of 3 and 7.5kN/m2 and 6m×6m grid with live load of
3kN/m2 were fully precast. Buildings of other precast configurations were constructed
with precast hollow core slab with in-situ beams and columns.
5.2. Structural cost (SC)
5.2.1. Total structural cost
After the designs were done and the quantity and cost information obtained, the structural
costs (SC) of the trial-buildings were worked out using Equation 3.1. Special attention
must be paid when the sources of the different building material unit rates were not the
same. In this case, the unit rate for post-tensioned tendons was not the same as the other
materials. The basis for comparison with the post-tensioned flat slab system might not be
as consistent.
Table 5.4. SC (S$/m2) and cost differences
Precast PT flat slab Grid
(m) LL
(kN/m2) Conv
(S$/m2) (S$/m2) dif over Conv (S$/m2) dif over Conv 3 98.81 131 32.58% 98 -0.72%
4.8x4.8 7.5 107.19 136 26.87% 98 -8.33% 15 125.44 161 28.01% 105 -15.98% 3 104.04 128 23.02% 99 -5.23%
6x6 7.5 120.05 156 29.60% 103 -14.52% 15 136.26 174 27.82% 109 -19.83%
3 102.44 141 37.86% 99 -3.41% 7.5 113.24 161 42.60% 102 -9.81%
8x8 (with sec.
beams) 15 127.74 178 39.17% 113 -11.32% 31.95% Average -9.91%
Cost information was very sensitive and confidential. In this study, the author tried to use
the available cost information to give a reasonably fair indicative cost comparison. It is
62
ATTENTION: The Singapore Copyright Act applies to the use of this document. Nanyang Technological University Library

always encouraged to use other cost data (if available) to study the cost in conjunction
with the material quantities obtained from this study.
LL=3kN/m^2
$80
$100
$120
$140
$160
4.8 6 8Grid Sizes (m)
Uni
t cos
t (S
$/m
^2) Conv
PCPT Flat
LL=7.5kN/m^2
$80
$100
$120
$140
$160
$180
$200
4.8 6 8Grid Size (m)
Uni
t cos
t (S$
/m^2
)
ConvPCPT Flat
LL=15kN/m^2
$80
$100
$120
$140
$160
$180
$200
4.8 6 8Grid Size (m)
Unit
cost
(S$/
m^2
)
ConvPCPT Flat
Figure 5.1. Structural Cost (S$/m2) vs. Grid Sizes (m) for various Live Loads
The detailed quantities and costs data sheets for the various trial-buildings were attached
in Appendix A. The summary of the structural cost for various live loads, structural
systems and grid sizes were shown in Table 5.4 and they were also plotted in Figure 5.1
for better illustration. As discussed in Section 5.1.4, the figures in italic fonts for the
63
ATTENTION: The Singapore Copyright Act applies to the use of this document. Nanyang Technological University Library

precast construction means fully precast structures with slabs, beams and columns
precasted, while the other precast configurations used only precast hollow core slabs with
in-situ beams and columns due to the member weight constraint.
Figure 5.1 was plotted using the average cost per square meter of building area against
the grid sizes for each of the 3 live loads. Table 5.4 and Figure 5.1 show that the
structural cost of precast is more than the other 2 alternatives for every configuration. For
fully precasted buildings, the increase in unit cost is not as significant as the partially
precasted buildings, which represent larger grid and live load.
On average, full precast buildings cost 27.5% more than conventional construction while
buildings with precast hollow core slab and in-situ beam-column cost 34.2% more than
their conventional counterparts. Precast beams and columns gave cost advantages due to
the use of the special moulds, which gave high number of usage. The high cost of precast
hollow core slab seemed to be the main reason to drive up the building cost, and details
of the individual member costs were discussed in Section 5.2.2. The higher cost of
precast construction could also be partially due to the relatively conservative member size
guidance from the CIDB precast design guidebook.
Post-tensioned flat slab construction was more cost-effective for larger gird sizes and
higher load. The saving ranged from 0.7% to 19.8% over conventional construction. The
cost of PT flat slab construction varies with the design requirements. In this study, the
buildings were designed with class 3 members. Due to the different source of post-
tensioned tendon unit rate, the cost for PT flat slab buildings could be inconsistent with
the other two structural systems to certain extent.
For the same live load value, looking at the grid sizes, it was found that at 6m×6m grid,
the conventional construction gave a slightly higher cost than 4.8 and 8m grid sizes. The
drop of building cost from 6m grid to 8m grid was due to the use of the secondary beams
in the 8m grid sized buildings. The secondary beams effectively reduced the bay size to
4m and the slab thickness was reduced. 8m grid-sized buildings without secondary beams
64
ATTENTION: The Singapore Copyright Act applies to the use of this document. Nanyang Technological University Library

were expected to give a much higher cost compared to 6m grid size buildings. A
relatively flat cost curve for PT flat slab construction reveals that the system has greater
cost advantage for larger spans.
5.2.2. Structural cost breakdown
Table 5.5 (1). Cost breakdown for building materials in conventional construction
Grid LL Total Steel Concrete Formwork (m) (kN/m^2) Cost ($) Cost ($) % Cost ($) % Cost ($) % 3 227658 58981 25.9% 55049 24.2% 113628 49.9%
4.8 7.5 246973 77209 31.3% 56560 22.9% 113204 45.8% 15 289018 102544 35.5% 69593 24.1% 116880 40.4% 3 239720 66454 27.7% 63058 26.3% 110207 46.0% 6 7.5 276607 96021 34.7% 67715 24.5% 112870 40.8% 15 313948 118251 37.7% 82372 26.2% 113326 36.1% 3 236022 56040 23.7% 59734 25.3% 120248 50.9% 8 7.5 260906 67531 25.9% 66504 25.5% 126872 48.6% 15 294313 88965 30.2% 75517 25.7% 129830 44.1%
Ave 30.3% 25.0% 44.8% Std Dev 0.046 0.011 0.046
Table 5.5 (2). Cost breakdown for building materials in PT flat slab construction Grid LL Total Steel Concrete Formwork Tendon (m) (kN/m^2) Cost ($) Cost ($) % Cost ($) % Cost ($) % Cost ($) % 3 226014 42746 18.9% 52874 23.4% 86618 38.3% 43776 19.4%
4.8 7.5 226403 43135 19.1% 52874 23.4% 86618 38.3% 43776 19.3% 15 242840 47551 19.6% 60423 24.9% 91089 37.5% 43776 18.0% 3 227190 43967 19.4% 57241 25.2% 82207 36.2% 43776 19.3%
6 7.5 236435 47339 20.0% 60008 25.4% 85312 36.1% 43776 18.5% 15 251700 52215 20.7% 67292 26.7% 88417 35.1% 43776 17.4% 3 227963 36144 15.9% 57160 25.1% 79939 35.1% 54720 24.0%
8 7.5 235305 37393 15.9% 61267 26.0% 81926 34.8% 54720 23.3% 15 261007 41693 16.0% 65209 25.0% 84793 32.5% 69312 26.6% Ave 18.4% 25.0% 36.0% 20.6% Std Dev 0.018 0.010 0.018 0.030
65
ATTENTION: The Singapore Copyright Act applies to the use of this document. Nanyang Technological University Library

To further breakdown the cost into concrete, formwork, steel and PT tendon cost, more
insights could be found. Table 5.5 shows the building structural cost breakdown for the
building materials for different RC structural systems. Since the precast construction cost
components involved delivering and installing cost, it was not shown in Table 5.5. As
shown in Table 5.5, the standard deviations of the cost components of various
configurations are not very significant. Thus, the average cost components according to
the various materials were plotted in Figure 5.2 to give a clearer illustration.
Figure 5.2 reveals that the formwork cost makes up almost half of the total structural cost
for conventional construction, while for PT flat slab system, the figure is 36%. After
finding out that the overall PT flat slab structure cost is less than the conventional
construction in this study, the saving in formwork cost of PT flat slab construction is
quite significant from conventional construction’s 45%. The saving was due to the use of
flat slab, which is easier to put up the formwork and also eliminates the formwork cost
for floor beams.
From the figure, the formwork cost was always the highest among the building materials
and this suggested that formwork was the factor to give more attention to in value
engineering in order to save cost. The post-tension tendon cost was quite significant at
21% of the total structural cost for PT flat slab construction.
Conventional Steel30%
Concrete25%
Formwork45%
PT Flat Slab Steel18%
PTtendon21%
Formwork
36%
Concrete25%
Figure 5.2. Cost breakdown to building materials
66
ATTENTION: The Singapore Copyright Act applies to the use of this document. Nanyang Technological University Library
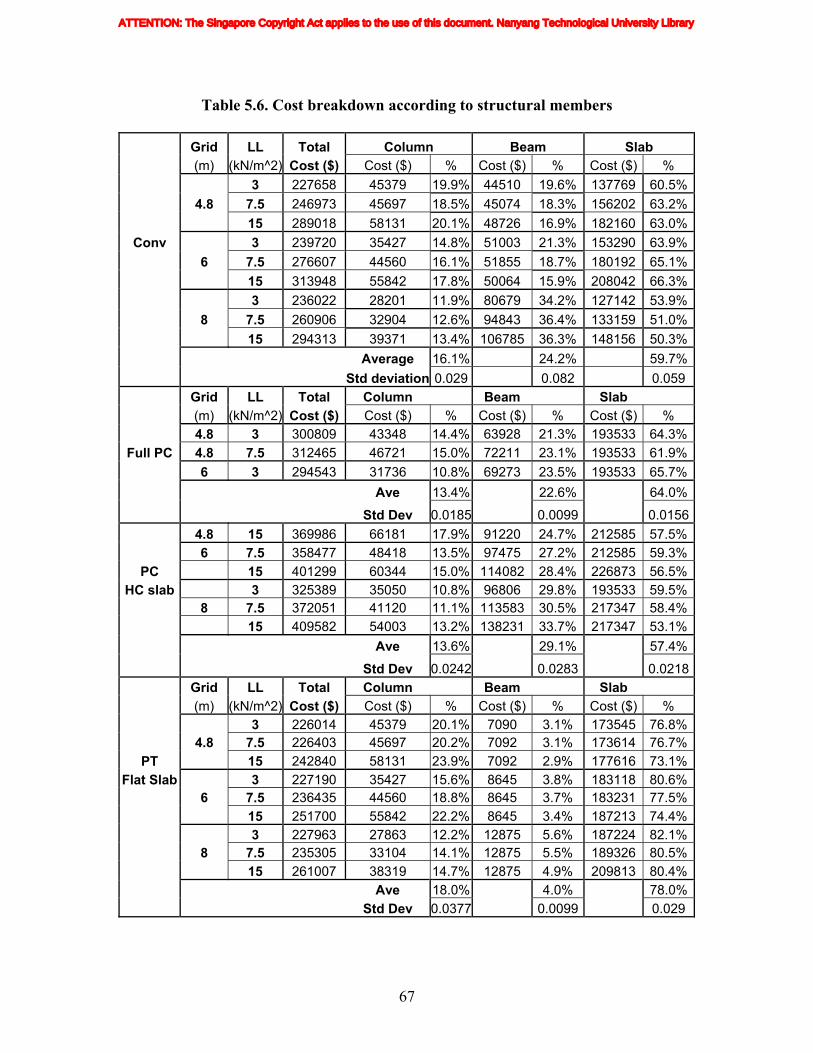
Table 5.6. Cost breakdown according to structural members
Grid LL Total Column Beam Slab (m) (kN/m^2) Cost ($) Cost ($) % Cost ($) % Cost ($) % 3 227658 45379 19.9% 44510 19.6% 137769 60.5% 4.8 7.5 246973 45697 18.5% 45074 18.3% 156202 63.2% 15 289018 58131 20.1% 48726 16.9% 182160 63.0%
Conv 3 239720 35427 14.8% 51003 21.3% 153290 63.9% 6 7.5 276607 44560 16.1% 51855 18.7% 180192 65.1% 15 313948 55842 17.8% 50064 15.9% 208042 66.3% 3 236022 28201 11.9% 80679 34.2% 127142 53.9% 8 7.5 260906 32904 12.6% 94843 36.4% 133159 51.0% 15 294313 39371 13.4% 106785 36.3% 148156 50.3% Average 16.1% 24.2% 59.7% Std deviation 0.029 0.082 0.059 Grid LL Total Column Beam Slab
(m) (kN/m^2) Cost ($) Cost ($) % Cost ($) % Cost ($) % 4.8 3 300809 43348 14.4% 63928 21.3% 193533 64.3%
Full PC 4.8 7.5 312465 46721 15.0% 72211 23.1% 193533 61.9% 6 3 294543 31736 10.8% 69273 23.5% 193533 65.7% Ave 13.4% 22.6% 64.0% Std Dev 0.0185 0.0099 0.0156 4.8 15 369986 66181 17.9% 91220 24.7% 212585 57.5% 6 7.5 358477 48418 13.5% 97475 27.2% 212585 59.3%
PC 15 401299 60344 15.0% 114082 28.4% 226873 56.5%HC slab 3 325389 35050 10.8% 96806 29.8% 193533 59.5%
8 7.5 372051 41120 11.1% 113583 30.5% 217347 58.4% 15 409582 54003 13.2% 138231 33.7% 217347 53.1% Ave 13.6% 29.1% 57.4% Std Dev 0.0242 0.0283 0.0218 Grid LL Total Column Beam Slab
(m) (kN/m^2) Cost ($) Cost ($) % Cost ($) % Cost ($) % 3 226014 45379 20.1% 7090 3.1% 173545 76.8% 4.8 7.5 226403 45697 20.2% 7092 3.1% 173614 76.7%
PT 15 242840 58131 23.9% 7092 2.9% 177616 73.1%Flat Slab 3 227190 35427 15.6% 8645 3.8% 183118 80.6% 6 7.5 236435 44560 18.8% 8645 3.7% 183231 77.5% 15 251700 55842 22.2% 8645 3.4% 187213 74.4% 3 227963 27863 12.2% 12875 5.6% 187224 82.1% 8 7.5 235305 33104 14.1% 12875 5.5% 189326 80.5% 15 261007 38319 14.7% 12875 4.9% 209813 80.4% Ave 18.0% 4.0% 78.0% Std Dev 0.0377 0.0099 0.029
67
ATTENTION: The Singapore Copyright Act applies to the use of this document. Nanyang Technological University Library

The overall structural costs were also broken down into the member cost of column,
beam and slab. The overall cost breakdown is shown in Table 5.6. The values were
arranged according to structural systems, grid sizes and live loads. The precast member
cost was broken down separately for fully precasted construction and precast hollow core
slab with in-situ beam and column construction. The 8m grid sized conventional and
precast buildings were constructed with secondary beams. The slab cost for precast
includes topping cost for hollow core slabs. Since the standard deviations of the various
construction systems are not significant. The average cost components of the different
members were plotted in the pie charts as shown in Figure 5.3.
Conventional
Slab55%
Column15%
Beam30%
PT Flat Slab
Slab78%
Column18%
Beam4%
PC Hollow Core Slab
Column14%
Beam29%
Slab57%
Full Precast
Slab64%
23%Beam
Column13%
Figure 5.3. Cost breakdown to structural members
Figure 5.3 shows the slab cost was always the highest in the 3 different structural
members. This suggested that slab should be given more attention in order to save
structural cost. The cost percentages ranged from 55% for conventional construction to
78% for PT flat slab construction. The second largest cost component came from beams
except PT flat slab construction, where the beam cost only came from the roof beam
68
ATTENTION: The Singapore Copyright Act applies to the use of this document. Nanyang Technological University Library
using conventional beam-slab construction. The significant cost saving from the
elimination of the beams was one of the reasons PT flat slab gave lower overall cost.
For precast construction, when the structures were fully precasted, the slabs made up of
64% of the overall structural cost. When only the slabs were precasted, the slab cost were
only 57% on average. This is due to the fact that in-situ column and beam could not enjoy
the cost saving from the use of standard formwork.
5.2.3. Other cost implications
Choice of RC structural systems would have other impacts on project cost, which include
overhead and interest savings due to faster construction; more revenue as well as tax from
early rental income; less substructure cost due to lighter structure; less M & E costs due
to easier installation; less cost from safety allowance due to safer work, etc.
All the mentioned costs could be project related and would be difficult to quantify. This
part of the cost was not the emphasis of the study but it could be something worth further
studying into. Some previous research did give some cost implication due to early
completion of structural steel construction and precast construction. These studies include
Ali and Ang (1985) and BCA (1999).
69
ATTENTION: The Singapore Copyright Act applies to the use of this document. Nanyang Technological University Library

CHAPTER 6
CONCLUSION AND RECOMMENDATIONS
6.1. Conclusion
This report described a comprehensive trial-design cost study to search for the cost-
effective RC structural systems. The research framework was presented and the focus
was on the construction costs of the basic RC superstructure on the 4 storey trial-
buildings with 24m×24m in plan in local context. The study was initiated to present a
way to compare the structural cost for various RC structural systems.
Previous cost modeling of buildings was classified into deductive and inductive methods
(Wilson 1982). The deductive method is to relate the cost to previous cost data through
mathematical means. The inductive method focuses on studying the design and
construction process to relate the cost to the process element. This research study was an
inductive approach because the cost was calculated based on the different quantities and
unit rates originated from the design differences. The cost information (unit rates) was
extracted from local market prices, which was done by local authority and company
through statistical means.
Two important studies were done with similar methodologies to the author’s but at a
larger scale. Both of the studies were in the 1960’s. The study done by Wilderness Group
70
ATTENTION: The Singapore Copyright Act applies to the use of this document. Nanyang Technological University Library

(1964) and Stone (1962) both focused on low-rise steel-framed structure with the latter
specifically focused on single-storey factory building. Both of the studies did not touch
on the design variables of structural systems because steel frames were used for both
study and conventional in-situ RC system was still the main stream at the time. These two
studies demonstrated the examples of trial design approach, which goes back to the first
principle of building cost: the economics of design.
Comparing with other cost studies focusing on various RC structural systems, this study
was more comprehensive and systematic. With the use of FEM analysis and design
software, a great effort had been taken to design 27 trial-buildings in different RC
structural systems, grid sizes and live loads. The quantities of material were analyzed and
reasonable accuracy could be achieved. The unit rate costing approach was adopted to
find out the construction cost of the superstructure. The modifications of the unit rates for
different structural systems were also studied into.
The intention was not to find out the actual construction cost in the real life. In Singapore,
unit rates are used to price the variation works; and they are not the actual cost incurred
to build the structure.
With the available cost information, the post-tensioned flat slab was found to be cost-
effective in terms of structural cost, especially when the grid sizes were large and the live
loads were high. Precast construction was generally more expensive. The structural costs
breakdown study was also carried out. In terms of building material cost breakdown, the
formwork cost was found to be the most significant. When the costs were broken down
according to structural members, the slab costs were found to be of the highest
percentage, which ranged from 55% to 78% of the total structural cost.
The unit rates of various building materials are always changing, and the changes are
determined by many issues, which include the industry infrastructure, the advancement of
the technology, the raw material supply, etc. The main parts of this study are the research
71
ATTENTION: The Singapore Copyright Act applies to the use of this document. Nanyang Technological University Library

framework and the trial-building designs and quantity collection. The final cost
discussion was only confined to the available cost information.
6.2. Limitations and Recommendations for future research
The study was based on a simplified fixed-sized trial building and the common RC
structural systems were limited to conventional cast in-situ beam-slab system, prestressed
flat slab system and precast system. The other two design variables were chosen as grid
size and live load. More design variables could be investigated to give a more
comprehensive view in choosing the RC structural system, e.g. plan ratio.
This study only included the construction cost of the basic superstructure of the trial-
buildings. Besides the structural cost consideration for the cost-effectiveness of the
structural systems, other considerations should also be considered in the cost evaluation.
These factors include construction duration, quality of finish, weight of the structure,
mechanical & electrical cost, safety, etc. These could be something worth further study
for their association with the project cost.
The costing method is also worth further investigation. The unit rates were used in this
study because they were probably the only accessible comprehensive cost data in
Singapore. More detailed costing breakdown could possibly give better inside view of the
cost implications of the various structural systems if the cost data is comprehensive
enough.
The cost information for post-tensioning tendons was not obtained from the same source
as the other unit rates; there was a possibility that the cost comparison on PT flat slab
construction was not as fair as other structural systems. Because this study provided the
detailed material quantities associated with each design configuration, updated unit rates
or more insightful cost information could always be applied onto the building material
quantities to derive the cost of the trial-building superstructure.
72
ATTENTION: The Singapore Copyright Act applies to the use of this document. Nanyang Technological University Library

The design requirement could also influence the structural cost. In this study, BS 8110:
Structural Use of Concrete was used as the design guide. Others issues like the choice of
class 1, 2 or 3 members for PT flat slab design could well result into different structural
cost.
73
ATTENTION: The Singapore Copyright Act applies to the use of this document. Nanyang Technological University Library

References ADAPT- Floor (1996). Software Manual, ADAPT Structural Concrete Software System.
USA.
Ali M. M. and Ang T. C. (1984), “Comparative Evaluation of High-rise Buildings in
Singapore”, Technical Report, National Iron and Steel Mills Ltd, Singapore.
Ali M. M. and Ang T. C. (1985), “Influence of Material Selection on tall Building
Economics”, The CIDB Review, Singapore, pp. 46-54
Ali M. M. and Ang T. C. (1984), “Cost Effectiveness of Tall Buildings in Singapore:
Structural Steel VS Concrete”, Proceedings of International Conference on Tall
Buildings, Singapore, pp 845-852.
Aoieong R., Tang S. and Ahmed S. (2002), “A Process Approach in Measuring Quality
Costs of Construction Projects: Model Development”, Construction Management and
Economics, Vol 20, pp179-192.
BCA (1999). Architecture in Precast Construction, Building and Construction Authority
of Singapore.
BS 8110 (1985). British Standard: Structural Use of Concrete, British Standard
Institution.
CIDB (1997). Guide to Precast Concrete and Prefabricated Reinforcement for Buildings,
Construction Industry Development Board, Singapore.
CPG (2003), CPG Cost Information Quarterly, Issue 49, CPG Corporation, Singapore.
Dagostino, F. R. (1993), Estimating in Building Construction, 4th edition. Prentice Hall.
74
ATTENTION: The Singapore Copyright Act applies to the use of this document. Nanyang Technological University Library

Dowrick D. J. and Narasimhan N. (1978), "Prestressed VS Reinforced Concrete Flat
Slabs", Concrete, Vol. 12, No.9, pp. 16-19.
FIP (1994), FIP Planning and design handbook on precast building structures, SETO
Ltd, London
Goodchild C. H. (1997), Economic Concrete Frame Elements, British Cement
Association, UK.
Holland, R. (1997), Reinforced Concrete, Thomas Telford, London.
Huntington. W. C. and Mickadeit R.E. (1981) Building Construction, Material and
Types of Construction, 5th ed., Wiley, New York.
Hurst, M. K. (1998), Prestressed Concrete Design, E & FN SPON, London.
Hutchison, K. (1993), Building Project Appraisal. The Macmillan Press Ltd, London
John Mo (1998), Comparison between Flat Plate Construction and other Structural
Systems: cost and speed, BBR Construction Systems Pte. Ltd, Singapore.
Kouskoulas, V. and Koehn, E. (1974), “Predesign cost estimation function for
buildings”, ASCE Journal of Construction Division, Dec 1974, pp589-104.
Lau and Ng (1996), “Comparative costs on RC Slabs”, M.Sc. dissertation, Nanyang
Technological University, Singapore.
Max, Meyer (1998), “An Alternate Cost Efficient Design Solution”, BCA Seminar on
Flat Slab/Plate Structures, VSL (S) Pte Ltd, Singapore.
75
ATTENTION: The Singapore Copyright Act applies to the use of this document. Nanyang Technological University Library

Neo, R. (1997), “Precast and Semi-precast cost comparison”, Seminar on Precast
Concrete Design for Engineers, Singapore.
Poh, S. H. (1993) “Modelling and Predicting New-build Student Hostel Costs in
Singapore”, MBA Dissertation, University of Dundee.
Poh S. H. (1995), “Cost Models for Student Hostels in Singapore”, Proceedings of 1st
International Conference on Construction Project Management, Singapore, pp. 541-550.
Raftery, J. (1991), Principle of Building Economics, BSP Professional Books.
Runeson, G. (2000), Building Economics, Deakin University Press.
Skitmore, M. and Marston, V. (1999), Cost Modelling, E & FN SPON, London.
Stone, P. A. (1962), “The Economics of Factory Buildings”, Factory Building Studies,
Building research Station, Her Majesty’s Stationary Office, London.
Teh, H.S and Ooi, S.T. (2000,) The Use of Flat Plate in Residential Building, T Y Lin
South East Asia Pte Ltd, Singapore
Teng C. W. and Sui W. F. (2003), “An Investigation on Cost Effective Structural
Systems in Singapore Construction Industry”, Final Year Project, Nanyang
Technological University, 2003.
Tong C. Y. and Tang E. P. (2000), “Flat Plate in Mixed Development”, BCA Seminar on
Flat Slab/Plate Structures, ADDP Architects and Tang Ee Ping & Partners, Singapore.
Warszwaski A. and Carmel D. (1984), “Utilization of Precast Concrete Elements in
Building”, Journal of Construction Engineering and Management, Vol. 110, No 4, pp.
476-485.
76
ATTENTION: The Singapore Copyright Act applies to the use of this document. Nanyang Technological University Library

Wilderness Group (1964), “An investigation into building cost relationships pf the
following design variables: storey height, floor loading, column spacing, number of
storeys”, Report to the Royal Institute of Chartered Surveyors.
Wilson, A. J. (1982), “Experiments in probabilistic cost modeling”, Building Cost
Techniques –New Direction, E & FN Spon, pp169-180.
77
ATTENTION: The Singapore Copyright Act applies to the use of this document. Nanyang Technological University Library

78
Appendices
ATTENTION: The Singapore Copyright Act applies to the use of this document. Nanyang Technological University Library