A SHORT INTRODUCTION TO MATLAB -...
26
A SHORT INTRODUCTION TO MATLAB Dawit Assefa Haile, PhD, Addis Ababa University UBORA, December 11-15, 2017 Nairobi, Kenya
Transcript of A SHORT INTRODUCTION TO MATLAB -...

A SHORT INTRODUCTION TO
MATLAB Dawit Assefa Haile, PhD, Addis Ababa
University
UBORA, December 11-15, 2017 Nairobi, Kenya

Overview Matlab=‘Matrix Laboratory’

MATLAB - tool for Engineers/Mathematicians
• MAT = Matrix ( = a rectangular array of
numbers); LAB = Laboratory • High level language with highly optimized built-
in functions. • Not symbolic like MAPLE but … • Matlab toolbox: built-in M-files. • Works in Windows, Macintosh, UNIX
environments. • A standard in universities and the industry.
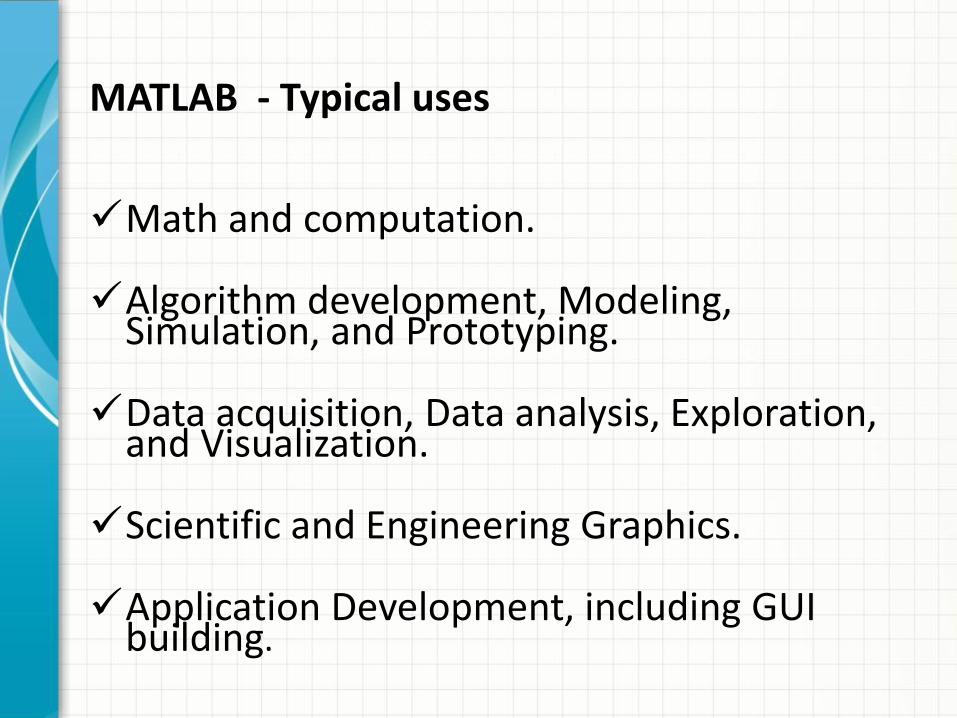
MATLAB - Typical uses Math and computation.
Algorithm development, Modeling,
Simulation, and Prototyping.
Data acquisition, Data analysis, Exploration, and Visualization.
Scientific and Engineering Graphics.
Application Development, including GUI building.

Getting started with Matlab
Desktop Tools and Development Environment
Graphics
External Interfaces
Mathematical Function Library
The Language
•Editor, command window, work space. •Matlab is array based [A(row, column), indices starting at 1]. •Matrix operations are ‘very’ natural. •We can write scripts and M-files. •Loading data, doing maths, plot, etc … •Matlab help.
The Matlab System
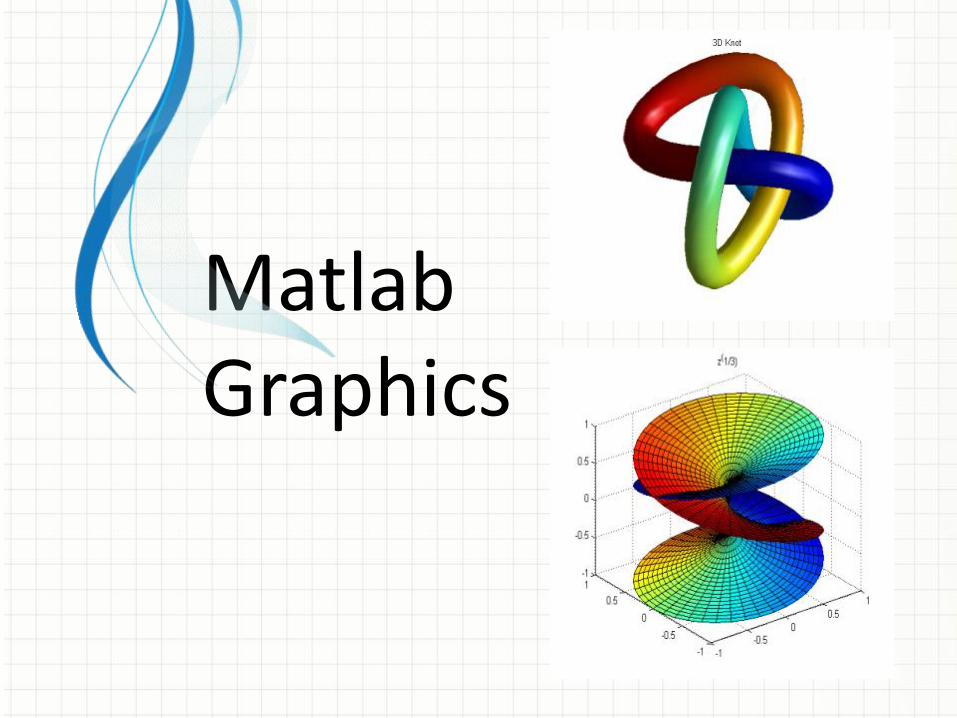
Matlab Graphics

• 2D and 3D data visualization, image processing, animation, and build complete graphical user interfaces.
• Plotting, editing, annotating, printing, exporting, saving, etc …


Doing Mathematics in Matlab

• Matrices and array manipulation (e.g. resize, reshape, multiD arrays, ...)
• Linear algebra (e.g. system of linear equations, determinants, singular values, ...)
• Random numbers. • Polynomials. • Differential equations. • Fourier transforms. • Computational geometry. • Operation research (e.g. optimization). • A lot more …

MATLAB TOOLBOXES

• Special purpose and highly optimized built-in M-files.
• Bioinformatics, Curve Fitting, Financial Derivatives, Signal and Image Processing, GA and Neural Networks, Optimization, PDEs, Parallel Computing, and many more …

Quick exercises Crate a 4x4 square matrix A and do the following
operations:
Compute sum of the rows & columns, total sum, min, max, std.
Compute the sum of its main and anti diagonals of A.
Copy the contents of A to another matrix C; delete the second raw of C and then fill the last column of the resulting matrix with zeros.
Use the find command to extract non-zero values in C. Find the number of unique values of C. Clear the matrix C.
Compute transpose, determinant, and the eigen values of A.
Do SVD on A.
Multiply A with random number matrix of same size and apply the FFT; apply the IFFT to get back the original matrix.
Repeat the above step and perform wavelet transform.
Create a column vector B of length 4 and solve the system Ax = B using the \ operator as well as linsolve.
Find the LU factorization (and the permutation matrix) of A.

Crate a 3x5 matrix from the command prompt and perform the followings:
Save the values on your desktop. Load the original matrix with the load command. Plot the last raw. Create a table of values with sin, cos, sin x cos, of
numbers between 0 and 10 separated in space of 0.1 and do the followings.
What is the size of the resulting matrix. Sort the first column.
Plot the sin x cos values, do some annotations and save the above figure on the desk top.
Export the above figure to the desk top as a tiff file.

Create a vector t with values between 0 and 2pi separated by space of pi/100 and do the followings:
For each discrete point compute sin, shifted sin (by ¼ and ½ ) values and plot all three against t in one plot. Use different line colors and marker types for each and put the necessary legend.
Go to figure pallet and delete the sin curve.
Create the inline function f(x,y) = sinh(x – y)/(e - cosh(x + y) ) and compute f(pi,pi/4), f(0,0).

3D plot: Evaluate the function z = sin(R)/R, where R = sqrt(x.^2+y.^2)+eps, over a mesh grid of values -10 < x, y <10 (say in steps of 0.5) and do the followings.
Generate a mesh plot of x, y, and z. Insert a color bar. Change different color maps.
See how the surface plot looks like. Use pcolor for the last 3D plot in the above example.
Save the resulting figure as a tiff file on your desktop. Close the figure and load it back from your desktop and display it.
Multiple plots: use the subplot command to
generate surface plots for sin(x) sin(y), sin(x) cos(y), cos(x) sin(y), and cos(x) cos(y) in one figure window (0 < x, y < 2pi, in steps of pi/10).

Writing a Matlab Code

• Flow control (conditional statements, Loops,
etc ...).
• Data structures (multi-dimensional data, cell arrays, strings, structures, etc).
• Input/output.
• Scripts and functions.
• Matlab can interact with C and Fortran programs through external interfaces (such as MEX).

Quick exercises
Crate a 20000x20000 matrix A and compute the total matrix sum using for loops as well as using the function ‘sum’. Compare the speeds.
Use the for loop to display the magic squares up to fifth order.
Create and plot the sinc(x) function, for -10 < x < 10, without using the built in `sinc’.
Create the Fibonacci sequence.

Quick exercises Write a Matlab script that does the followings: Clear all variables from your memory and also clear the command
window. Generate the magic square A of order 20, compute its rank , inverse
and determinant. Find the number of unique elements of A. Save the matrix as a text file on your desktop. Clear the matrix from memory and load it back. Generate a column vector B of length 20 and solve the linear system Ax = B. Generate a 1D as well as a surface plot of A. Take the first two columns of A, sort them and do matrix multiplication (in any order) and dot product . Pick a, b, c and d four distinct elements of A. Compute a/b + c/d using only one division operator.
Generate two uniformly distributed random matrices and two normally distributed random matrices of size 100 x 100 each and plot each data in the same figure window (as subplots).
Create the function f(x) = sinc(x) and evaluate f at normally distributed random vectors of length 10, 100 , 1000 and 10000. Plot the values separately (use the for loop).

Create a time series of length 64 composed of sum of two sin waves with frequency of 2 and 10hrtzs respectively. Apply the FFT and plot the amplitude and phase. Apply a uniformly distributed noise to the sine wave and redo the FFT.
For what value of n is ‘e’ best approximated by the function f(n) =(1+1/n)^n. (Hint: generate 10 values of n in logspace between 1 and 20 and evaluate f at each point). Using struct to generate a table of values for n, f(n) and abs(f(n) – e).
Create a tri-diagonal matrix T using a vector P (main diagonal) of length n, and vectors Q and R (off diagonal) of length n-1.

Quick exercises Write a Matlab function that computes the
magic square of any order (if the order is 2, print a warning).
Write a program that does the followings: filter (in the frequency domain) a noisy sinusoidal function using box car filter of a given width. (Hint: first create a function handle to the noisy sinusoidal function). Plot the box car functions in the frequency domain (what is the fourier transform of a box car function???). Plot the filtered function together with the original noisy function.

Some Maths Examples Solve the ODE
(Hint: create a system of ODEs and use Matlab ODE solvers).
Assume f(α,r) = (2µ-2)ΔhR𝑒−𝐷αJ(1,αR)J(0,αr) is the solution of a certain system where, J is the bessel function of the first kind, D = 25, R = 400, h=23, E = 40*10^6, dp = 1.1*10^4, Δh = -h*dp/E, µ = 0.3. Compute (and plot) the integrals of f wrt α (0<=α<=0.00005) for different values of r, 1<=r<=10.
1)0(')0(,')1('' 2 yyyyyy

Quick exercises
Write a Matlab function that prints “Hello World” as many times based on a user input.
Redo ‘e’ approximation using f(n) = (1+1/n)^n and generate a text file containing n, f(n) and the absolute error values (Hint: use fprintf).

Graphical user Interfaces;
Using the toolboxes; Simulink