A REVIEW ON ILLUMINATION AND NOISE SURVEYS IN MINES IN ...
19
ISSN NO: 0745-6999 JOURNAL OF RESOURCE MANAGEMENT AND TECHNOLOGY Page No:403 www.jrmat.com Vol 12, Issue4, 2021 A REVIEW ON ILLUMINATION AND NOISE SURVEYS IN MINES IN INDIAN MINING INDUSTRY 1 DEVARAKONDA RAJENDRA PRASAD, 2 Mr.K.MANOJ, 3 Mr. K.S. RAMBABU 1 M.Tech Student, 23 Assistant Professor Department Of Mechanical Engineering(MINING) KAKINADA INSTITUTE OF TECHNOLOGICAL SCIENCES, Ramachandrapuram ABSTRACT In both surface and underground mines, providing a comfortable work environment for employees is critical to increasing output and productivity. Poor lighting and loud working environments have a detrimental impact on employee morale, as well as their safety, health, and productivity. Systematic lighting and noise surveys must be performed using suitable legislative criteria in order to evaluate the state of illumination and noise levels in mines and to implement effective control measures. With this in mind, the goal of this research was to conduct a lighting and noise assessment in a few non-coal and coal mines in Orissa. 1. INTRODUCTION Providing sufficient lighting and ensuring a safe visual working environment is a problem that virtually all mining companies confront. Because of the dark surroundings and poor reflectivity, lighting in mines poses unique challenges. Effective lighting is needed in opencast mines where work is done during night shifts in order to ensure productivity and safe operation of diverse equipment at varied work locations. Open-cast mines span a wide area and change form as the mining process progresses. Because there is no natural light and huge equipment work in a restricted, dusty, and possibly explosive environment, lighting is very essential in the underground coal mining sector. Since humans started living together, noise, which is defined as unwanted sound, has been a cause of dissatisfaction. Rapid industrialization as a result of technical advances to satisfy the ever-increasing demand for industrial goods has exacerbated the issue. Noise pollution is not a new occurrence in the mining sector. The noise issue has certainly been exacerbated by the advent of automation. Opencast mining has become the most popular technique owing to its high production, economic feasibility, improved safety, and environmental benefits, among other factors. Hundreds of tonnes of explosives may be used to break up overburden rocks and coal thanks to the availability of big diameter drills and different kinds of explosives. Large capacity coal handling units and an in-pit crushing system with mobile crusher are being built. All of these activities contribute significantly to noise pollution. For the exploitation of deep seated reserves, advances in underground mining technology, higher capacity underground projects, and mechanised shaft sinking and drilling activities are being undertaken, which necessitate the planning of large output mines with captive mineral handling plants, coal washeries, thermal power plants, and so on. Noise is produced by a variety of subterranean machineries used for drilling, loading, and transportation operations, and it often surpasses the permitted noise limits of 90 decibels. All of this generates a lot of noise both within the mine and in the neighbouring neighbourhoods and residential areas. Systematic lighting and noise surveys must be performed using suitable legislative criteria in
Transcript of A REVIEW ON ILLUMINATION AND NOISE SURVEYS IN MINES IN ...

ISSN NO: 0745-6999
JOURNAL OF RESOURCE MANAGEMENT AND TECHNOLOGY
Page No:403 www.jrmat.com Vol 12, Issue4, 2021
A REVIEW ON ILLUMINATION AND NOISE SURVEYS IN MINES IN
INDIAN MINING INDUSTRY 1DEVARAKONDA RAJENDRA PRASAD, 2Mr.K.MANOJ, 3Mr. K.S. RAMBABU
1M.Tech Student, 23Assistant Professor
Department Of Mechanical Engineering(MINING)
KAKINADA INSTITUTE OF TECHNOLOGICAL SCIENCES, Ramachandrapuram
ABSTRACT
In both surface and underground mines,
providing a comfortable work environment
for employees is critical to increasing output
and productivity. Poor lighting and loud
working environments have a detrimental
impact on employee morale, as well as their
safety, health, and productivity. Systematic
lighting and noise surveys must be performed
using suitable legislative criteria in order to
evaluate the state of illumination and noise
levels in mines and to implement effective
control measures. With this in mind, the goal
of this research was to conduct a lighting and
noise assessment in a few non-coal and coal
mines in Orissa.
1. INTRODUCTION
Providing sufficient lighting and ensuring a safe
visual working environment is a problem that
virtually all mining companies confront.
Because of the dark surroundings and poor
reflectivity, lighting in mines poses unique
challenges. Effective lighting is needed in
opencast mines where work is done during night
shifts in order to ensure productivity and safe
operation of diverse equipment at varied work
locations. Open-cast mines span a wide area and
change form as the mining process progresses.
Because there is no natural light and huge
equipment work in a restricted, dusty, and
possibly explosive environment, lighting is very
essential in the underground coal mining sector.
Since humans started living together, noise,
which is defined as unwanted sound, has been a
cause of dissatisfaction. Rapid industrialization
as a result of technical advances to satisfy the
ever-increasing demand for industrial goods has
exacerbated the issue. Noise pollution is not a
new occurrence in the mining sector. The noise
issue has certainly been exacerbated by the
advent of automation. Opencast mining has
become the most popular technique owing to its
high production, economic feasibility, improved
safety, and environmental benefits, among other
factors. Hundreds of tonnes of explosives may
be used to break up overburden rocks and coal
thanks to the availability of big diameter drills
and different kinds of explosives. Large capacity
coal handling units and an in-pit crushing system
with mobile crusher are being built. All of these
activities contribute significantly to noise
pollution.
For the exploitation of deep seated reserves,
advances in underground mining technology,
higher capacity underground projects, and
mechanised shaft sinking and drilling activities
are being undertaken, which necessitate the
planning of large output mines with captive
mineral handling plants, coal washeries, thermal
power plants, and so on. Noise is produced by a
variety of subterranean machineries used for
drilling, loading, and transportation operations,
and it often surpasses the permitted noise limits
of 90 decibels. All of this generates a lot of noise
both within the mine and in the neighbouring
neighbourhoods and residential areas.
Systematic lighting and noise surveys must be
performed using suitable legislative criteria in
ISSN NO: 0745-6999
JOURNAL OF RESOURCE MANAGEMENT AND TECHNOLOGY
Page No:404 www.jrmat.com Vol 12, Issue4, 2021
order to evaluate the state of illumination and
noise levels in mines and to implement effective
control measures. With this in mind, the goal of
this research was to conduct a lighting and noise
assessment in a few non-coal and coal mines in
Orissa.
Objectives of the Project:
Basic knowledge of the principles of
illumination and noise.
In surface and underground coal/non-
coal mines, a digital luxmeter is used to
measure the illuminance level of
luminaries.
A noise study will be conducted in a few
opencast and underground coal/non-coal
mines. To determine the appropriateness
of mine lighting and noise levels in
comparison to Indian norms.
2. LITERATURE REVIEW
2.1 ILLUMINATION IN MINES
2.1.1 PHOTOMETRIC
TERMINOLOGIES
➢ Light Physics
For the quantification of light, two main
systems of units are presently used:
illumination Engineering Society (IES) and
international systems of units (SI). The
main distinction between the IES and SI
systems is that the IES system use US
standard linear dimensions. The SI system
utilises metric measurements in its unit
definitions. IES units are often used in coal
mine lighting standards in the United
States.
All standard light unit systems use the
same basic principles, which are based on
practical and relevant methods of
measuring and quantifying light energy.
Luminous flux, illumination (illuminance),
luminous intensity, and luminance are the
four fundamental notions.
Flux of light
The luminous flux sign is and the
flux unit n in both the IES and SI systems
is the lumen (lm). Luminous flux is the
pace at which light energy flows across
time. In the same way that horsepower is a
power number, flux is. The lumen is the
most common unit of luminous flux used
to describe the illumination power of light
sources.
Lumen is a unit of measurement for
light (unit)
The lumen (symbol: lm) is a SI unit
for luminous flux, which is a measurement
of light's perceived strength. Luminous
flux varies from radiant flux, which is a
measurement of the total amount of light
emitted, in that luminous flux is adjusted to
account for the human eye's varied
sensitivity to various wavelengths of light.
➢ Illuminance
The quantity of light falling on a surface is
referred to as illuminance. The SI system
uses lux (lx) and lumen /min2 (or lumens
per square metre = 10.76 foot candles, fc)
as measuring units. It is measured using a
light metre. The measurements are
collected from a variety of angles and
locations.

ISSN NO: 0745-6999
JOURNAL OF RESOURCE MANAGEMENT AND TECHNOLOGY
Page No:405 www.jrmat.com Vol 12, Issue4, 2021
(Source: http://www.ccohs.ca)
Figure 2.1 Illuminance
➢ Luminance
The quantity of light reflected from a
surface is known as luminance. Candela
per square metre is the measuring unit
(equals 0.29 foot-lamberts). It is measured
using an illuminance metre. Several
measurements are taken and the average is
calculated. For reference values, luminance
tables are used
.
(Source: http://www.ccohs.ca)
Figure 2.2: Luminance
This is the proportion of incident to
reflected luminous flux. To put it another
way, the ratio of light energy reflected off a
surface to that which strikes it. Under the
same lighting circumstances, objects with
greater levels of reflectivity will seem
brighter than those with lower levels of
reflectance
.
(Source: http://www.ccohs.ca)
Figure 2.3: Reflectance
➢ Contrast:
The relative difference in luminance between
two adjacent surfaces. In other words, how
bright one surface looks compared to the other
or the background against which it is being
viewed.

ISSN NO: 0745-6999
JOURNAL OF RESOURCE MANAGEMENT AND TECHNOLOGY
Page No:406 www.jrmat.com Vol 12, Issue4, 2021
(Source: http://www.ccohs.ca)
Figure 2.4: Contrast
There are two types of glare: disability glare
and discomfort glare .Disability glare is
defined as glare resulting in decreased visual
performance and visibility. The cause is stray
light which enters the eye and scatters inside.
This produces a veiling luminance over the
retina, which has the effect of reducing the
perceived contrast of the objects being
viewed. Discomfort glare causes fatigue and
pain caused by high and non-uniform
distributions of brightness in the observer’s
field of view.
➢ Luminaire
The complete lighting assembly, less the
support assembly. For purposes of
determining total light output from a
luminaire, lighting assemblies which include
multiple unshielded or partially shielded
lamps on a single pole or standard shall be
considered as a single unit.
2.1.2 EFFECTS OF LIGHTING ON
HUMAN HEALTH AND
PSYCHOLOGY
Medical research on the effects of
excessive light on the human body
suggests that a variety of adverse health
effects may be caused by light pollution or
excessive light exposure, and some lighting
design textbooks use human health as an
explicit criterion for proper lighting. Health
effects of over-illumination or improper
spectral composition of light may include:
increased headache incidence, worker
fatigue, medically defined stress, and
increase in anxiety. Common levels of
fluorescent lighting in offices are sufficient
to elevate blood pressure by about eight
points. Specifically within the USA, there
is evidence that levels of light in most
office environments lead to increased stress
as well as increased worker errors. The
case against light pollution is strengthened
by a range of studies on health effects,
suggesting that excess light may induce
loss in visual acuity, hypertension,
headaches and increased incidence of
carcinoma.
2.1.3 LIGHT AND VISION
RELATIONSHIPS
This section addresses the visual needs of
the worker, which are the ultimate basis for
illumination design. These needs are
defined by (1) the requirements for optimal
functioning of the visual sensory system,
and (2) the light needed to establish an
appropriate level of visibility necessary for
safe, efficient work performance. The
lighting design process begins by carefully
determining these needs. Then practical,
technical, and economic factors are
considered in establishing an appropriate
system design. It identifies the visual needs

ISSN NO: 0745-6999
JOURNAL OF RESOURCE MANAGEMENT AND TECHNOLOGY
Page No:407 www.jrmat.com Vol 12, Issue4, 2021
of coal miners and indicates, in general
terms, what can be done to accommodate
those needs. First, the functions of the eyes
and the rest of the visual sensory system
are examined. Then, various environmental
factors that affect the visibility of
surroundings.
The Eye and its Function
The eye (fig.2.5) is the organ of sight. It
senses the light that enters it and acts as the
first processor of this light. It then provides
this information to the brain information
for determination of the form, size, shape,
color, position, and motion of the objects in
view. To understand how light and vision
interact, it is helpful to consider the eye as
a mechanism made up of two subsystems:
(1) the light control system and (2) the
receiver- decoder system. The parts of
each system are outlined in the following
tabulation.
Table 2.1: Parts of light control & receiver-decoder system
Light control system Receiver-decoder system
Eyelid Retina and its photoreceptors, Which are the
rods and cones Cornea
Iris-pupil.
Lens and its ciliary muscle.
(Source: www.cdc.govnioshminingpub.9073.pdf)
2.2 NOISE SURVEY IN MINES
2.2.1 TERMINOLOGIES OF NOISE
▪ Sound and Noise
Sound is what we hear. Noise is unwanted
sound. Sound is a form of energy which is
emitted by a vibrating body and on
reaching the ear causes sensation of
hearing through nerves. Sounds produced
by all vibrating bodies are not audible. The
frequency limits of audibility are from 20
HZ to 20,000 HZ.
A noise problem generally consists of three
inter-related elements- the source, the
receiver and the transmission path. This
transmission path is usually the atmosphere
through which the sound is propagated, but
can include the structural materials of any
building containing the receiver.
(Source : http://discovery.bits-pilani.ac.in)
Figure2.11: Inter-relationship between the elements of noise

ISSN NO: 0745-6999
JOURNAL OF RESOURCE MANAGEMENT AND TECHNOLOGY
Page No:408 www.jrmat.com Vol 12, Issue4, 2021
Noise may be continuous or intermittent.
Noise may be of high frequency or of low
frequency which is undesired for a normal
hearing. The discrimination and
differentiation between sound and noise also
depends upon the habit and interest of the
person/species receiving it, the ambient
conditions and impact of the sound generated
during that particular duration of time.
Decibel
The decibel (dB) is a logarithmic unit of
measurement that expresses the magnitude of
a physical quantity (usually power or
intensity) relative to a specified or implied
reference level. Since it expresses a ratio of
two quantities with the same unit, it is a
dimensionless unit. A decibel is one tenth of a
bel, a seldom-used unit.
The decibel can be expressed as: decibel = 10
log (P / Pref) (1)
Where P = signal power (W)
Pref = reference power (W)
▪ Sound Power Level
Sound power is the energy rate - the energy
of sound per unit of time (J/s, W in SI-units)
from a sound source. Sound power can more
practically be expressed as a relation to the
threshold of hearing - 10-12 W - in a
logarithmic scale named Sound Power Level
- Lw:
Lw = 10 log (N / No) (2)
Where, Lw = Sound Power Level in Decibel
(dB) N = sound power (W)
The lowest sound level that people
of excellent hearing can discern
has an acoustic sound power about
10-12 W, 0 dB
The loudest sound generally
encountered is that of a jet
aircraft with a sound power of
105 W, 170 dB.
▪ Sound Intensity Level
Sound Intensity is the Acoustic or
Sound Power (W) per unit area.
The SI-units for Sound Intensity are
W/m2.
The Sound Intensity Level can be
expressed as: LI = 10 log ( I / Iref )
3. ILLUMINATION AND NOISE
SURVEY IN PATHPAHAR
DOLOMITE QUARRY: CASE
STUDY
3.1.1 INTRODUCTION
Location:- Bisra Stone Lime Company
Limited's Pathpahar Dolomite quarry is
located in Birmitrapur District, Sundargarh
Orissa, on NH-23, 30 kilometres north of
Rourkela, and is well linked by rail. In the
SOI Topo-Sheet No.73/B/16, the lease
hold area is 1961.93 acres or 793.966
hectares and is located between 22o-15' N
and 22o-30' N latitude and 840-30'E to
84o-45' E longitude.
Brief history: At 1922, the company
began mining and operating a lime kiln in
Birmitrapur. After shutting the limekiln in
1962, the company shifted to producing
flux quality limestone and dolomite to
meet the needs of eastern India's steel
mills. In 1980, the business was placed
under the administrative control of the
Government of India's Ministry of Steel.
The rocks in this region are from the
middle Dharwarian age's Birmitrapur stage
of the Gangpur series. This series' rocks are
all meta-sedimentary in nature. Proper
Limestone overlies Dolomite in the

ISSN NO: 0745-6999
JOURNAL OF RESOURCE MANAGEMENT AND TECHNOLOGY
Page No:409 www.jrmat.com Vol 12, Issue4, 2021
leasehold, indicating that the limestone is
newer than the dolomite.
Mining Plan: The deposit has been split
into four mines for ease of mining: Kaplas
East, Kaplas West, Gurpahar, and
Patpahar. Between the limestone and
dolomite bands, there are low-grade stones,
which need selective mining. Limestone
and dolomite deposits are estimated to be
375 MT and 265 MT, respectively.
Limestone extraction and transport:
Drilling and blasting are used to produce
all of the limestone, as well as a dumper
loading and transportation system. Loaders
load blasted coal onto dumpers, which are
then delivered to the feeder breaker's apron
feeder. To achieve the apron feeder feed
size, some of the sizing is done manually
on the mine site. Further crushing takes
place in the crusher, yielding a variety of
products of varying sizes that are
subsequently delivered straight to the
railway sidings and ultimately to the
consumers.
Figure3.1: Location of BSL Mines
ISSN NO: 0745-6999
JOURNAL OF RESOURCE MANAGEMENT AND TECHNOLOGY
Page No:410 www.jrmat.com Vol 12, Issue4, 2021
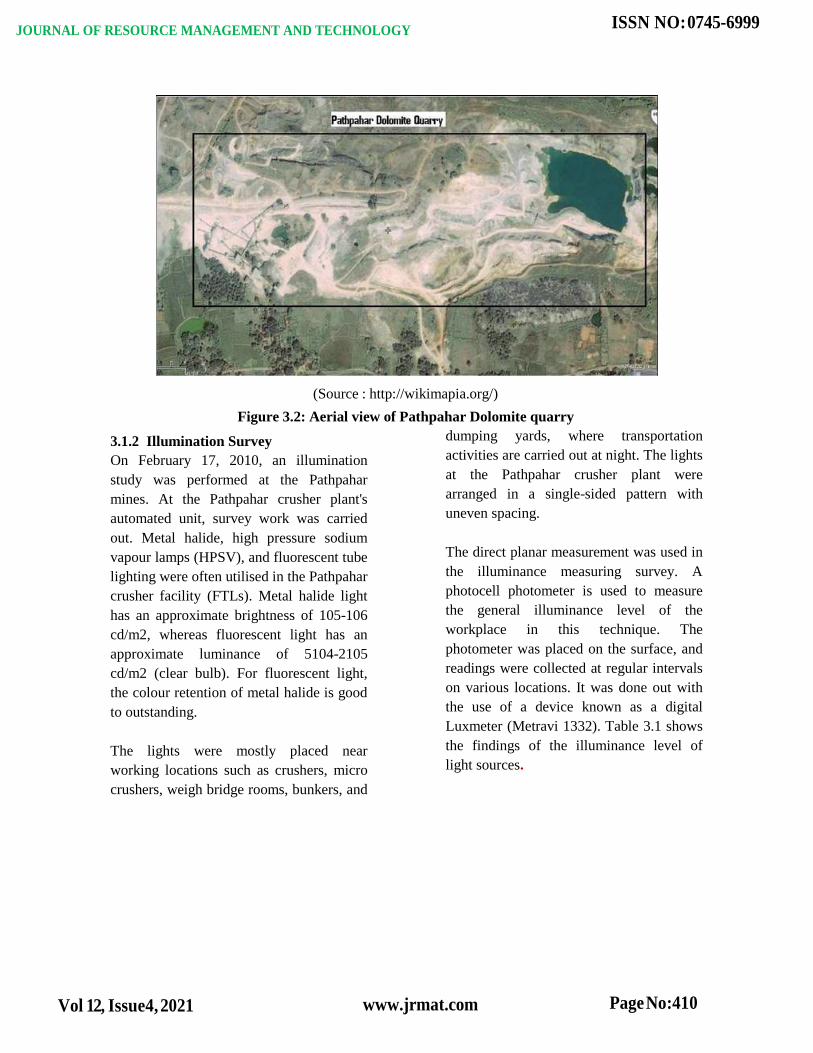
(Source : http://wikimapia.org/)
Figure 3.2: Aerial view of Pathpahar Dolomite quarry
3.1.2 Illumination Survey
On February 17, 2010, an illumination
study was performed at the Pathpahar
mines. At the Pathpahar crusher plant's
automated unit, survey work was carried
out. Metal halide, high pressure sodium
vapour lamps (HPSV), and fluorescent tube
lighting were often utilised in the Pathpahar
crusher facility (FTLs). Metal halide light
has an approximate brightness of 105-106
cd/m2, whereas fluorescent light has an
approximate luminance of 5104-2105
cd/m2 (clear bulb). For fluorescent light,
the colour retention of metal halide is good
to outstanding.
The lights were mostly placed near
working locations such as crushers, micro
crushers, weigh bridge rooms, bunkers, and
dumping yards, where transportation
activities are carried out at night. The lights
at the Pathpahar crusher plant were
arranged in a single-sided pattern with
uneven spacing.
The direct planar measurement was used in
the illuminance measuring survey. A
photocell photometer is used to measure
the general illuminance level of the
workplace in this technique. The
photometer was placed on the surface, and
readings were collected at regular intervals
on various locations. It was done out with
the use of a device known as a digital
Luxmeter (Metravi 1332). Table 3.1 shows
the findings of the illuminance level of
light sources.

ISSN NO: 0745-6999
JOURNAL OF RESOURCE MANAGEMENT AND TECHNOLOGY
Page No:411 www.jrmat.com Vol 12, Issue4, 2021
Figure 3.3: Location of light sources in Pathpahar mines
Table: 3.1 Illumination measurements at Pathpahar
Measurement
Areas
Pole
no.s
Light source Make Illuminance level
(lux)
Remarks
Near mini crusher
No. of luminaries:3
Ht. of poles:5m
1 100 W
HPSV
Philips 34.7 lux at 5m
distance
(horizontal)
Satisfactory
2 100W HPSV Philips 24.3 lux Satisfactory
3 2×36 W
FTLs
Bajaj 26.9 lux at 5m
distance
Satisfactory
Near main Crusher
No. of poles :1
Ht.of pole:10m
4
2×36 W
FTLs
Bajaj 11.7 lux at 10m
distance (vertical )
Satisfactory
Near Bunker
Ht of luminaire:5m
5 70W HPSV Bajaj 25.6 lux Satisfactory
Dumping yard
No. of luminaries:2
Ht. of poles:10m
6 100 W
HPSV
Bajaj 20.4 lux (vertical) Satisfactory
7 100 W
HPSV
Bajaj 23.6 lux (vertical ) Satisfactory
ISSN NO: 0745-6999
JOURNAL OF RESOURCE MANAGEMENT AND TECHNOLOGY
Page No:412 www.jrmat.com Vol 12, Issue4, 2021
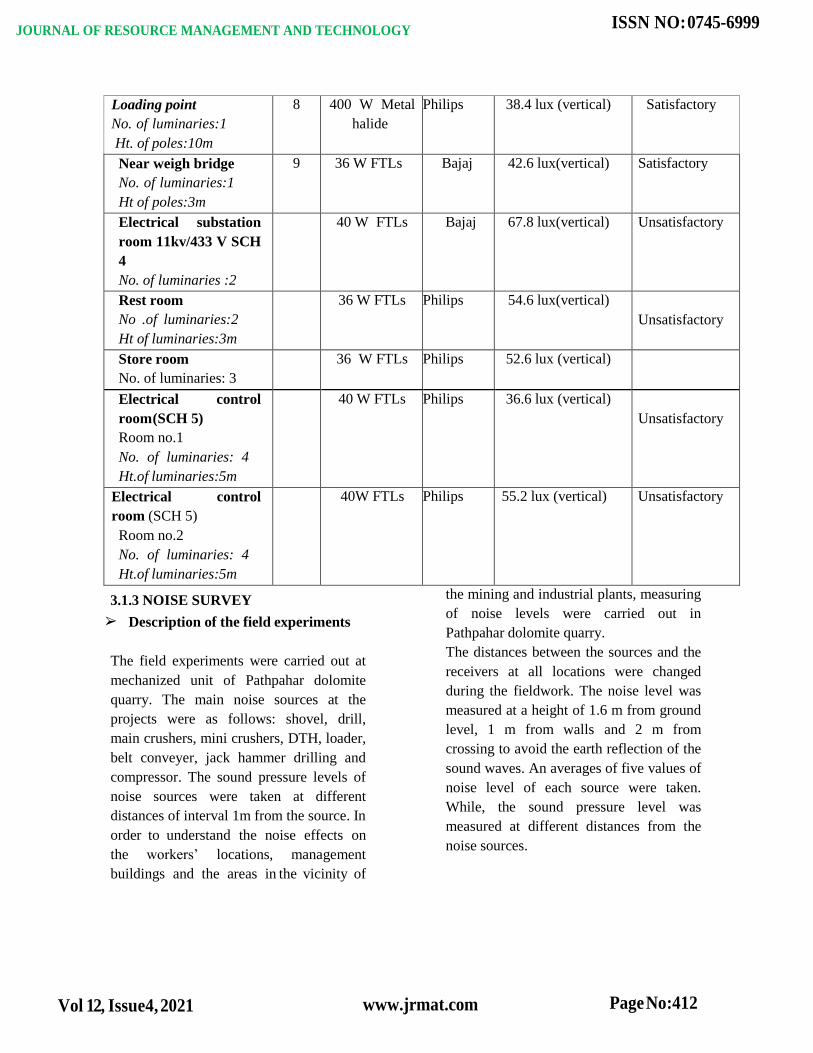
Loading point
No. of luminaries:1
Ht. of poles:10m
8 400 W Metal
halide
Philips 38.4 lux (vertical) Satisfactory
Near weigh bridge
No. of luminaries:1
Ht of poles:3m
9 36 W FTLs Bajaj 42.6 lux(vertical) Satisfactory
Electrical substation
room 11kv/433 V SCH
4
No. of luminaries :2
40 W FTLs Bajaj 67.8 lux(vertical) Unsatisfactory
Rest room
No .of luminaries:2
Ht of luminaries:3m
36 W FTLs Philips 54.6 lux(vertical)
Unsatisfactory
Store room
No. of luminaries: 3
36 W FTLs Philips 52.6 lux (vertical)
Electrical control
room (SCH 5)
Room no.1
No. of luminaries: 4
Ht.of luminaries:5m
40 W FTLs Philips 36.6 lux (vertical)
Unsatisfactory
Electrical control
room (SCH 5)
Room no.2
No. of luminaries: 4
Ht.of luminaries:5m
40W FTLs Philips 55.2 lux (vertical) Unsatisfactory
3.1.3 NOISE SURVEY
➢ Description of the field experiments
The field experiments were carried out at
mechanized unit of Pathpahar dolomite
quarry. The main noise sources at the
projects were as follows: shovel, drill,
main crushers, mini crushers, DTH, loader,
belt conveyer, jack hammer drilling and
compressor. The sound pressure levels of
noise sources were taken at different
distances of interval 1m from the source. In
order to understand the noise effects on
the workers’ locations, management
buildings and the areas in the vicinity of
the mining and industrial plants, measuring
of noise levels were carried out in
Pathpahar dolomite quarry.
The distances between the sources and the
receivers at all locations were changed
during the fieldwork. The noise level was
measured at a height of 1.6 m from ground
level, 1 m from walls and 2 m from
crossing to avoid the earth reflection of the
sound waves. An averages of five values of
noise level of each source were taken.
While, the sound pressure level was
measured at different distances from the
noise sources.

ISSN NO: 0745-6999
JOURNAL OF RESOURCE MANAGEMENT AND TECHNOLOGY
Page No:413 www.jrmat.com Vol 12, Issue4, 2021
Table 3.2: Distance of Measurements from Noise Sources in Pathpahar Mines
Noise Source Distance Sound Pressure Level, dB(A)
(SCH 4) CRUSHER 1m 117
2m 117
3m 116
4m 115
5m 114
Mini Crusher 1m 116
2m 114
3m 113
4m 112
5m 111
JCB 3D Loader Bucket
capacity: 0.8 m3 Power:50
hp
1m 111
2m 111
3m 110
4m 108
5m 107
JCB Loader
Bucket capacity: 0.8 m3
Power:50 hp
1m 111
2m 110
3m 109
4m 107
5m 106
Loader 2021
Make :Hindustan machines
Bucket capacity: 1.7 m3
Power : 124 HP
1m 109
2m 108
3m 107
4m 106
5m 105
Shovel PC 300
Make : L& T Komatsu
Bucket capacity:1.4 m3
1m 109
2m 108
3m 108
4m 107
5m 106
Noise sources Distance Sound Pressure Level, dB(A)
Jack Hammer Drill 1m 120

ISSN NO: 0745-6999
JOURNAL OF RESOURCE MANAGEMENT AND TECHNOLOGY
Page No:414 www.jrmat.com Vol 12, Issue4, 2021
Make :Mine drilling Service
Penetration rate:425mm/min
RPM: 215
Impact/min :2000
Air requirement (at 6 Bar m³/min- 2.4)
2m 119
3m 118
4m 116
5m 113
DTH Drill 1m 117
2m 116
3m 114
4m 113
5m 111
Compressor
Make :Ingersoll rand H450
Cfm,100 Psi
1m 105
2m 104
3m 103
4m 100
5m 98
Belt conveyor 1m 90
2m 87
3m 84
4m 82
5m 80

ISSN NO: 0745-6999
JOURNAL OF RESOURCE MANAGEMENT AND TECHNOLOGY
Page No:415 www.jrmat.com Vol 12, Issue4, 2021
Figure 3.5: Measured sound Pressure Levels at Pathpahar Mines
3.1.4 RESULTS AND DISCUSSION
(A) Illumination Survey
The results of illuminance levels of
Pathpahar mine are given in Table: 3.1.it
can be seen that the illuminance level near
loading points, bunkers, dumping yards,
near mini crushers illuminance level were
adequate & are within the standards as
prescribed by regulations.
Illuminance measurement done in
electrical substation, control room, rest
room, store room and office were
inadequate covering a range of 30-70 lux.
According to Indian lighting standards the
illuminance level in electrical substation,
control rooms, rest rooms, and store rooms
should be of 100-200 lux.
In opencast mines mounting height of pole
is very important in order to achieve all the
required lighting standards nearer to
loading or unloading points, bunkers &
work place of heavy machinery. With low-
wattage of HPSV & FTLs lamps, the pole
height should be kept lowered to achieve
the necessary lighting standards in transfer
points. HPSV lamps, in general, possess
better illumination where loading &
unloading work is carried on. Mounting
height should be higher for high-wattage
HPSV lamps for better performance.
(B) Noise Survey
Results of sound pressure levels at
Pathpahar dolomite quarry are presented in
given Table 3.3 and in figure.3.5. The
maximum sound pressure level was found
at jack hammer drill of 120 dB
(A) & Down the hole drill (DTH) of 117dB
(A). This is due to the jackhammer & DTH
dealing with hard ore drilling rock, as face
dressing or blasting. During the field study
it was observed that the workers engaged
in drilling operations were not equipped
with ear plugs and ear muffs which can
lead to hearing loss. So implementation of
hearing protectors aid should be provided
to the mine workers when exposed to
harmful level of noise.

ISSN NO: 0745-6999
JOURNAL OF RESOURCE MANAGEMENT AND TECHNOLOGY
Page No:416 www.jrmat.com Vol 12, Issue4, 2021
The minimum sound pressure level was
found at compressor of small horsepower,
when compared with other sources. From
figure 3.5, it is found that, the sound
pressure level due to crushers was higher.
This is due to the high horsepower and the
friction between the crusher material and
the ore.
The sound pressure level from belt
conveyers was found to be lower than
that from other sources, where it was
located in an enclosed compartment. Also,
it can be seen that, the sound pressure
levels were greater than that acceptable
level (90 dBA).The measured noise level at
the management building and the
workshop area in Pathpahar crusher plant
was higher than the acceptable level.
Measurements of noise levels in Pathpahar
dolomite quarry prove that the workers are
suffering from high noise levels more than
the acceptable levels.
3.2 ILLUMINATION AND
3.2.1 NOISE SURVEY
➢ Description of the Field Experiments
The field experiment was carried out at
Hirakhand Bundia mines from 26/03/2010
to 27/03/10. The main noise sources at the
projects were as follows: LHD, coal drill,
auxiliary fan, and main fan, belt conveyers
in underground & surface. The sound
pressure levels of noise sources were taken
at different distances from the sources.
The distances between the sources and the
receivers at all locations were changed
during the fieldwork. The noise level was
measured at a height of 1.6 m from ground
level. Five values of noise level from each
source were recorded. While, the sound
pressure level was measured at different
distances from the noise sources.
➢ Instrumentation
The instruments used was a standard CEL -
283 integrating impulse sound Level meter
(U.K) .It measured noise levels produced
both near the source and the operator’s
level covering a range of 40 -120 dB(A)
and had a selectable A/ Flat frequency
characteristics .Fast slow time constants
and impulsive response . The A-network
was used in the present work, which
approximates the human response.
➢ Results
Results of the noise study are given in Table 3.5

ISSN NO: 0745-6999
JOURNAL OF RESOURCE MANAGEMENT AND TECHNOLOGY
Page No:417 www.jrmat.com Vol 12, Issue4, 2021
Figure 3.9: Location of noise sources in Hirakhand Bundia mines
Table 3.5: Distance of measurements from noise sources in Hirakhand Bundia Mines
Noise source Distance Sound pressure level, dB(A)
LHD B 14A
Make :Emco-Elcon (Gujarat)
Bucket capacity:1.25 m3
1m 108
2m 107
3m 105
4m 104
5m 103
LHD B 7
Make :Emco -Elcon (Gujarat)
Bucket capacity: 1.25 m3
1m 110
2m 109
3m 108
4m 106
5m 104
LHD B2
Make : Emco-Elcon
(Gujarat)
Bucket capacity:1.25 m3
2m 106
3m 104
4m 103
5m 101

ISSN NO: 0745-6999
JOURNAL OF RESOURCE MANAGEMENT AND TECHNOLOGY
Page No:418 www.jrmat.com Vol 12, Issue4, 2021
6m 99
Auxiliary fan 1m 117
2m 117
3m 116
4m 115
5m 114
Coal drill 1m 116
2m 116
3m 115
4m 114
5m 113
Main fan in surface Model :
VF 2000/2 stage Maximum :
HP 250 KW Type :axial flow
adjustable blade, belt driven
Mfd.by :Voltas limited
Blade angles:33.5
1m 111
3m 108
5m 105
10m 94
15m 81
Figure 3.10: Measured sound pressure levels at Hirakhand Bundia mines
Sou
nd
pre
ssu
re l
eve
l dB
(A)

ISSN NO: 0745-6999
JOURNAL OF RESOURCE MANAGEMENT AND TECHNOLOGY
Page No:419 www.jrmat.com Vol 12, Issue4, 2021
4. CONCLUSION
In both surface and underground mines,
providing a comfortable work environment
for employees is critical to increasing
output and productivity. Poor lighting and
loud working environments have a
detrimental impact on employee morale, as
well as their safety, health, and
productivity. Systematic lighting and noise
surveys must be performed using suitable
legislative criteria in order to evaluate the
state of illumination and noise levels in
mines and to implement effective control
measures. With this in mind, the goal of
this research was to conduct a lighting and
noise assessment in a few non-coal and
coal mines in Orissa.
The results of an illumination survey
conducted in the Pathpahar mines of BSL's
mechanised unit revealed that illumination
levels near loading points, near crushers,
mini crushers, and dumping yards were
adequate and within Indian standards,
whereas illuminance levels in the electrical
substation, store room, rest rooms, and
electrical control rooms were insufficient.
The study findings at MCL's underground
coal mines revealed that the roads were
very small and difficult to light evenly due
to the restricted height underground.
Because it is uneconomical to supply lights
at all locations in a mine below ground
because to the enormous length of roads,
they are focused at the most busy areas,
such as pit bottoms, loading points, and so
on. With an average illuminance of 30 lux,
the illuminance level measured in inclined
shafts and travelling roads conveyance for
man riding in Hirakhand Bundia mines was
sufficient.
The average illuminance level of 24 lux
was recorded in inclined shafts and
travelling roads at various levels of
Nandira colliery, Talchir. The results of the
poll
Most underground mines use fluorescent
lighting, which provides better light
dispersion, longer life, greater
effectiveness, better colour concentration,
and lower glare potential.
Noise has become an inextricable element
of the mining industry. Noise issues are
anticipated to grow as more automation
and stronger equipment is introduced,
resulting in increased noise doses and
related physiological and psychological
concerns for the exposed populations.
Hearing loss may occur as a result of
repeated or extended exposure to high
noise levels. Compressors, drilling
machines, crushers, auxiliary fans, and
other mechanical equipment utilised in a
mine are all potential sources of noise
emissions. To decrease noise emissions to
tolerable levels, such noise sources should
be muffled using an efficient acoustic
absorbing material wherever feasible.
Noise management may sometimes be as
simple as increasing the distance between
the noise source and the listener. Every
individual exposed to noise levels above 90
dB should use comfortable and practicable
personal hearing protection equipment,
such as certified ear plugs or ear muffs, if
such noise control measures are not
feasible (A).
The findings revealed that the sound
pressure levels of different machineries

ISSN NO: 0745-6999
JOURNAL OF RESOURCE MANAGEMENT AND TECHNOLOGY
Page No:420 www.jrmat.com Vol 12, Issue4, 2021
utilised in BSL's Pathpahar mines and
MCL's underground coal mines exceeded
the permissible limits (>90dB (A)). Most
mine employees in the research were
exposed to SPL (sound pressure level)
levels over TLV (90dBA) owing to
equipment noise. As a result, in order to
protect mine employees from NIHL
(Noise-Induced Hearing Loss) and to
maintain the environment safe, control
mechanisms for equipment should be
implemented in mines, as well as hearing
protection devices should be provided to
workers.
REFERENCES
➢ Hartman, L. Howard (1992) SME
Engineering Handbook, Colorado,
Vol. I, Chapter - 11.9, pp. No
.1127-1132.
➢ Sengupta, M. (1990) Mine
Environmental Engineering.
Florida, Vol. I, Chapter -1 Noise,
pp.7-9, 21, chapter 2. Illuminance-
pp-25.
➢ Ghatak.S, S. (1997). A Study of
Mine Management Legislation and
General Safety, 4th Edition, pp -
101-106.
➢ D. Trotter, (1982)'The Lighting of
Underground Mines'. Trans Tech
Publications, West Germany.
➢ H. W. Lewis. (1986) 'Underground
Coal Mine Lighting Handbook,
Part 1: Background'. US Bureau
of Mines Information Circular
9073, Chapter -3, pp-20-22.
➢ H W Lewis. (1986) 'Underground
Coal Mine Lighting Handbook,
Part 2: Application'. U S Bureau of
Mines Information Circular 9074,
Chapter -1, pp-2-4.
➢ Aruna, M., Rao, Y.V., Harsha
Vardhan and Karmakar,
N.C.(2004) Some Problems in
Mine Lighting. Light Newsletter,
IV, pp 34 – 38.
➢ Wells, C. (1997). Personal
communication on illumination
and lighting legislation &
Standards in India. Calcutta, India.
➢ Crooks, W.H. and Peay, J.M.
(1981). Developing luminance
requirements for underground
metal and nonmetal mines. In
Bureau of Mines Information
Circular IC 8866.United States
Department of the Interior.
➢ European Coal and Steel
Community. (ECSC) 1990.
Guidelines on the ergonomics of
underground illumination in coal
mines. Community ergonomics
Action Report No15, series 3.pp-
92.
➢ Odendaal, E.P.S. (1997). The
Consequences of Poor Illumination
on Underground Mine Workers
and the Subsequent Effects on
productivity and Safety.
NOSHCON’97, Annual
NOSA Occupational Health, Safety
and Environment Convention,
Kempton Park, 14-16 May.
Johannesburg: NOSA.

ISSN NO: 0745-6999
JOURNAL OF RESOURCE MANAGEMENT AND TECHNOLOGY
Page No:421 www.jrmat.com Vol 12, Issue4, 2021
➢ Davis, J. (1997).Personal
communication on illumination and
lighting legislation &
standards in NSW, Australia.
International Mining Consultants
Pty Ltd, New South Wales,
Australia.


![Illumination-Aware Age Progressionnovel illumination-aware age progression technique, lever-aging illumination modeling results [1,31], that properly account for scene illumination](https://static.fdocuments.net/doc/165x107/5e72745a0ac7de5cbf4199be/illumination-aware-age-progression-novel-illumination-aware-age-progression-technique.jpg)