A review of fish sampling methods commonly used in ... review of fish sampling methods commonly used...
58
A review of fish sampling methods commonly used in Canadian freshwater habitats. C.B. Portt 1 , G.A. Coker 1 , D.L. Ming 2 , and R.G. Randall 3 1 C. Portt and Associates 56 Waterloo Avenue Guelph, Ontario N1H 3H5 2 Fisheries and Oceans Canada Ontario Great Lakes Area 867 Lakeshore Road Burlington, Ontario L7R 4A6 3 Fisheries and Oceans Canada Great Lakes Laboratory for Fisheries and Aquatic Sciences 867 Lakeshore Road Burlington, Ontario L7R 4A6 2006 Canadian Technical Report of Fisheries and Aquatic Sciences 2604 Fisheries and Oceans Pêches et Océans Canada Canada AR-1240
Transcript of A review of fish sampling methods commonly used in ... review of fish sampling methods commonly used...
A review of fish sampling methods commonly used in Canadian freshwater habitats.
C.B. Portt1, G.A. Coker1, D.L. Ming2, and R.G. Randall3
1C. Portt and Associates 56 Waterloo Avenue Guelph, Ontario N1H 3H5
2Fisheries and Oceans Canada Ontario Great Lakes Area 867 Lakeshore Road Burlington, Ontario L7R 4A6
3Fisheries and Oceans Canada Great Lakes Laboratory for Fisheries and Aquatic Sciences 867 Lakeshore Road Burlington, Ontario L7R 4A6
2006
Canadian Technical Report of Fisheries and Aquatic Sciences 2604
Fisheries and Oceans Pêches et OcéansCanada Canada
AR-1240

Canadian Technical Report of Fisheries and Aquatic Sciences
Technical reports contain scientific and technical information that contributes to existing knowledge but which is not normally appropriate for primary literature. Technical reports are directed primarily toward a worldwide audience and have an international distribution. No restriction is placed on subject matter and the series reflects the broad interests and policies of Fisheries and Oceans Canada, namely, fisheries and aquatic sciences.
Technical reports may be cited as full publications. The correct citation appears above the abstract of each report. Each report is abstracted in the data base Aquatic Sciences and Fisheries Abstracts.
Technical reports are produced regionally but are numbered nationally. Requests for individual reports will be filled by the issuing establishment listed on the front cover and title page. Out-of-stock reports will be supplied for a fee by commercial agents.
Numbers 1-456 in this series were issued as Technical Reports of the Fisheries Research Board of Canada. Numbers 457-714 were issued as Department of the Environment, Fisheries and Marine Service, Research and Development Directorate Technical Reports. Numbers 715-924 were issued as Department of Fisheries and Environment, Fisheries and Marine Service Technical Reports. The current series name was changed with report number 925.
Rapport technique canadien des sciences halieutiques et aquatiques
Les rapports techniques contiennent des renseignements scientifiques et techniques qui constituent une contribution aux connaissances actuelles, mais qui ne sont pas normalement appropriés pour la publication dans un journal scientifique. Les rapports techniques sont destinés essentiellement à un public international et ils sont distribués à cet échelon. II n'y a aucune restriction quant au sujet; de fait, la série reflète la vaste gamme des intérêts et des politiques de Pêches et Océans Canada, c'est-à-dire les sciences halieutiques et aquatiques.
Les rapports techniques peuvent être cités comme des publications à part entière. Le titre exact figure au-dessus du résumé de chaque rapport. Les rapports techniques sont résumés dans la base de données Résumés des sciences aquatiques et halieutiques.
Les rapports techniques sont produits à l'échelon régional, mais numérotés à l'échelon national. Les demandes de rapports seront satisfaites par l'établissement auteur dont le nom figure sur la couverture et la page du titre. Les rapports épuisés seront fournis contre rétribution par des agents commerciaux.
Les numéros 1 à 456 de cette série ont été publiés à titre de Rapports techniques de l'Office des recherches sur les pêcheries du Canada. Les numéros 457 à 714 sont parus à titre de Rapports techniques de la Direction générale de la recherche et du développement, Service des pêches et de la mer, ministère de l'Environnement. Les numéros 715 à 924 ont été publiés à titre de Rapports techniques du Service des pêches et de la mer, ministère des Pêches et de l'Environnement. Le nom actuel de la série a été établi lors de la parution du numéro 925.

Canadian Technical Report of Fisheries and Aquatic Sciences 2604
2006
A review of fish sampling methods commonly used in Canadian freshwater habitats.
by
C.B.Portt1, G.A. Coker1, D.L. Ming2, and R.G. Randall3
1C. Portt and Associates 56 Waterloo Avenue
Guelph, Ontario N1H 3H5
2Fisheries and Oceans Canada Ontario Great Lakes Area
867 Lakeshore Road Burlington, Ontario
L7R 4A6
3Fisheries and Oceans Canada Great Lakes Laboratory for Fisheries and Aquatic Sciences
867 Lakeshore Road Burlington, Ontario
L7R 4A6

© Her Majesty the Queen in Right of Canada, 2006. Cat. No.Fs97-6/2604E ISSN 0706-6457
Correct citation for this publication:
Portt, C.B., G.A. Coker, D.L. Ming, and R.G. Randall. 2006. A review of fish sampling methods commonly used in Canadian freshwater habitats. Can. Tech. Rep. Fish. Aquat. Sci. 2604 p.
ii
TABLE OF CONTENTS
TABLE OF CONTENTS ................................................................................................ iii
ABSTRACT....................................................................................................................... v
RÉSUMÉ ........................................................................................................................... v
INTRODUCTION............................................................................................................. 1
TERMINOLOGY DESCRIBING SAMPLING GEAR AND METHODS................. 1
Catchability, Efficiency, Selectivity and Catch-Per-Unit-Effort ........................................ 2
FACTORS TO CONSIDER WHEN DETERMINING WHAT FISH SAMPLING GEARS AND METHODS TO USE ........................................................................ 2
The Sampling Objective ..................................................................................................... 3 Presence/Absence and Species Richness ............................................................................ 3 Relative Abundance, Absolute Abundance and Density .................................................... 3
GEAR REVIEWS ............................................................................................................. 4
1. Gill Nets.......................................................................................................................... 4Description and method of use ........................................................................................... 4 Habitat considerations........................................................................................................ 5 Selectivity/Efficiency ........................................................................................................... 6 Quantification of Effort....................................................................................................... 7 Fish Injury/survival............................................................................................................. 8 Summary ............................................................................................................................. 8 References ........................................................................................................................... 8
2. Beach Seines ................................................................................................................ 10Description and method of use ......................................................................................... 10 Habitat considerations...................................................................................................... 11 Selectivity/Efficiency ......................................................................................................... 11 Quantification of Effort..................................................................................................... 13 Fish Injury/survival........................................................................................................... 13 Summary ........................................................................................................................... 13 References ......................................................................................................................... 13
3. Hoop Nets, Fyke Nets and Trap Nets ........................................................................ 14Description and method of use ......................................................................................... 14 Habitat considerations...................................................................................................... 16 Selectivity/Efficiency ......................................................................................................... 16 Quantification of Effort..................................................................................................... 17
iii
Fish Injury/survival........................................................................................................... 18 Summary ........................................................................................................................... 18 References ......................................................................................................................... 18
4. Electrofishing............................................................................................................... 19Description and method of use ......................................................................................... 19 Habitat considerations...................................................................................................... 21 Selectivity/Efficiency ......................................................................................................... 22 Quantification of Effort..................................................................................................... 25 Fish Injury/survival........................................................................................................... 26 Summary ........................................................................................................................... 27 References ......................................................................................................................... 27
5. Underwater Observation............................................................................................ 31Description and method of use ......................................................................................... 31 Habitat considerations...................................................................................................... 32 Selectivity/Efficiency ......................................................................................................... 33 Quantification of Effort..................................................................................................... 33 Fish Injury/survival........................................................................................................... 33 Summary ........................................................................................................................... 33 References ......................................................................................................................... 34
6. Gee or Minnow Traps................................................................................................. 35Description and method of use ......................................................................................... 35 Habitat considerations...................................................................................................... 35 Selectivity/Efficiency ......................................................................................................... 36 Quantification of Effort..................................................................................................... 36 Fish Injury/survival........................................................................................................... 36 Summary ........................................................................................................................... 37 References ......................................................................................................................... 37
7. Enclosure (pop, drop and throw) Traps ................................................................... 37Description and method of use ......................................................................................... 37 Habitat considerations...................................................................................................... 38 Selectivity/Efficiency ......................................................................................................... 39 Quantification of Effort..................................................................................................... 40 Fish Injury/survival........................................................................................................... 40 Summary ........................................................................................................................... 40 References ......................................................................................................................... 41
CONCLUSIONS ............................................................................................................. 41
REFERENCES................................................................................................................ 43
iv
ABSTRACT
The efficacy of different gears for conducting fish surveys in Canadian freshwater habitats is reviewed. Application is limited to shallow water in streams, rivers and littoral habitats of lakes, and the information is targeted for fish habitat biologists. Seven commonly used gear types are included in the review: 1) gill nets; 2) beach seines; 3) hoop, fyke and trap nets; 4) electrofishing; 5) underwater observation; 6) Gee or minnow traps; and 7) enclosure (drop, pop and throw) traps. The literature-based synopsis of each gear includes a description, method of use, habitat considerations, selectivity and efficiency, quantification of effort, fish injury/survival and a list of references specific to each gear. The review provides basic guidelines on limitations and efficacy of each gear type to aid in the selection of the appropriate gear depending on the habitat and the objectives of the survey. Selection of an appropriate gear is based on the objectives of the survey, the type of habitat, the efficiency of the gear, manpower requirements and animal health.
RÉSUMÉ
Nous passons en revue l’efficacité de divers engins de pêche pour les relevés sur les poissons réalisés dans les habitats dulcicoles au Canada. L’application de ces engins est limitée aux eaux peu profondes des milieux lotiques et aux habitats littoraux des lacs, et l’information est destinée aux biologistes spécialistes de l’habitat des poissons. Sept types d’engins couramment employés ont fait l’objet de notre étude : 1) filets maillants; 2) sennes de plage; 3) verveux et trappes; 4) pêche électrique; 5) observationsubaquatique; 6) pièges à ménés ou pièges Gee; et 7) pièges clos (calés, dépliants ou lancés). Pour chaque engin, le survol de la littérature comporte une description, la méthode d’utilisation, les aspects touchant à l’habitat, la sélectivité et l’efficacité, la quantification de l’effort, la survie des poissons ou les blessures subies, et une liste de références pour chaque type d’engin. L’étude donne des directives de base concernant les limitations et l’efficacité de chaque type d’engin pour aider au choix de l’engin le mieux adapté selon l’habitat et les objectifs du relevé. Le choix de l’engin est fonction des objectifs du relevé, du type d’habitat, de l’efficacité de l’engin, de la main-d’œuvre nécessaire et de la santé des poissons.
v
INTRODUCTION Effective management of fisheries resources requires knowledge of the fish populations and communities to be managed, and knowledge of the relationships between the populations and communities and their habitats. Information about fish populations and communities is normally acquired through some sort of fish ‘sampling’. This sampling usually involves capturing fish, although it may, in some cases, be acquired by simply observing fish in their habitats. Many types of fishing gears have been developed worldwide (von Brandt, 1984), although relatively few of these have been adopted for management and research purposes. There has been, and continues to be, research conducted on the efficacy of the sampling methods that have been adopted, as well as on new approaches to sampling. This document provides an overview of the sampling gears/methods that are most commonly used in Canada to assess fish populations and communities in wadeable streams and the littoral zone of lakes. The emphasis is on aspects of the various methods that biologists will want to consider when they are designing and conducting projects that require fish sampling and when interpreting sampling data. These include factors that influence the efficiency of various sampling methods and the amount of effort that may be required in order to address certain research/management questions. Seven fishing gear types that are commonly used for surveys are reviewed separately below. Gear types include 1) gill nets; 2) beach seines; 3) hoop, fyke and trap nets; 4) electrofishing; 5) underwater observation; 6) Gee or minnow traps; and 7) enclosure traps (pop, drop and throw). Each review includes seven sub-sections that provide information on the characteristics and limitations of each gear type: 1) description and method of use; 2) habitat considerations; 3) selectivity/efficiency; 4) quantification of effort; 5) fish injury/survival; 6) summary and 7) references. Gear selectivity and catch efficiency are defined and described in the next section. This report is intended to provide information to fish habitat biologists on the efficacy of different fishing gear for monitoring land-based or in-water activities that potentially impact on fish habitat in streams or at near shore areas of rivers or lakes. TERMINOLOGY DESCRIBING SAMPLING GEAR AND METHODS Active gear, Passive gear and Point or Quadrant sampling Fishing gear is often referred to as being either active or passive. Active gear is moved in order to capture fish. Passive gear is stationary; fish swim into it. An example of active gear is the beach seine, which is pulled through the water and encircles fish in its path. Gill nets are an example of passive gear. Typically, active gear is used to sample fish over a relatively large area during a short period of time, whereas passive gear is used to sample fish at a specific location over a longer period of time. A third approach, referred
1
to as point sampling or quadrant sampling, samples fish within a small area at a single point in time.
Catchability, Efficiency, Selectivity and Catch-Per-Unit-Effort There are several key terms that are used to describe the ability of fish sampling gears and methods to capture or observe fish and the susceptibility of fish to various gears and methods. Catchability is defined as the proportion of the fish that are available to be captured that is caught by a defined unit of fishing effort (Ricker, 1975). The catchability of fish is equal to the efficiency of the fishing gear. To clarify, if a single pass through a section of stream with an electrofisher is defined as a unit of effort and half of the brook trout in the section of stream are removed by a pass, then both the catchability of brook trout and the efficiency of the electrofishing are 0.5 or 50%. Furthermore, assuming equal catchability among individuals, the probability that any individual will be captured by a defined unit of fishing effort is also equal to the catchability which, in the case of the above example, is 0.5. The number of fish captured by a particular gear with a particular amount of effort is termed catch-per-unit-effort (CPUE). Efficiency varies among gears, among habitats, among species, and even among sizes of the same species. Gears for which efficiency is highly variable among species or sizes of fish are termed selective. Gears that capture a wide range of species and sizes equally are referred to as non-selective. In practice virtually all gears/methods vary to some degree in efficiency among species and sizes of fish. The number of fish available for capture must be known in order to calculate catchability or gear efficiency. Some studies estimate catchability by releasing a known number of marked fish into the sampling area prior to sampling. If the assumptions are made that catchability is equal for marked and unmarked individuals and that all of the marked individuals are available for capture, then catchability is equal to the proportion of the marked fish that are captured. Other studies employ some means of collecting the remaining fish following the sampling (i.e. poisoning or draining the area). Still others estimate abundance using removal or mark-recapture methods, that use the rate at which the catches decline, or that the proportion of unmarked fish in the catches decline, to estimate the size of the population. FACTORS TO CONSIDER WHEN DETERMINING WHAT FISH SAMPLING GEARS AND METHODS TO USE Several factors must be taken into consideration when selecting a method to assess fish communities or populations. Key among these are:
• the question(s) that the investigators wish to answer, • the habitats that are being investigated, • the fish species that are being investigated, and • the time of year when investigations will take place.
2

It is necessary to understand the capabilities and limitations of various gears and methods in order to determine those that will enable investigators to best answer the questions being posed. In practice, the types of gear available and the amount of time and staff available often play a major role in gear/method selection. In these instances, knowledge of the capabilities and limitations of various gears and methods will allow investigators to recognize the questions that can, or cannot, be answered with the resources available. The Sampling Objective Sampling is undertaken to obtain information about characteristics of fish populations or communities, often in relation to the habitats they occupy. The characteristics that are of interest and the accuracy with which these must be estimated determine the sampling approach that is required. Some of the population and community characteristics that are typically examined are discussed below. Presence/Absence and Species Richness The simplest question that can be posed is “Are there any fish present?” It often is the first characteristic that investigators need to determine for small waterbodies or streams about which little or nothing is known. Initially, at least, abundance or density are not of concern, although these may become of interest later. The presence of fish can often be confirmed simply by looking for them, especially in habitats where fish are abundant and visibility is good. If the question is “Are fish present?” and fish are not readily visible, then methods that are effective at capturing a wide range of species in the type or types of habitats that are present should be utilized. It is important that all habitats be sampled and if the habitat characteristics vary widely it may be necessary to use more than one type of gear. Small fishes are usually more abundant than large fishes and within a species small individuals are usually more abundant that large individuals, so a gear that is effective for small fish is usually preferred. It is important to remember that, unlike presence, absence can never be proven. All that can be achieved is to demonstrate that there is a high probability that fish are not present. Sometimes investigators wish to determine what species or how many species are present (species richness), but require no estimates of abundance. The gear selection criteria are similar to those for determining if any fish are present, bearing in mind, once again, that it is important to sample all of the habitats that are present. Investigators may wish to determine whether or not a particular species, or even a particular size/age class of a particular species, is present. In those cases it is often desirable to use a highly selective gear that has a high efficiency for the particular target species/size. Relative Abundance, Absolute Abundance and Density
3
Relative abundance is the ratio of abundance between two or more locations or species or size classes. If catchability is equal between the entities that are being compared, then relative abundance can be calculated from catch-per-unit-effort, without knowing what the catchability is. If catchability differs due to gear differences, habitat differences, or species differences, then this must be taken into account. Absolute abundance is the number of fish present in a specific area. Density is the number of fish present in a unit of area or volume. Knowledge of catchability is necessary to calculate absolute abundance and density. There are three general techniques that are commonly used to estimate catchability:
• mark-recapture methods, • depletion methods, and • known catchability, or calibrated, methods.
In mark-recapture methods, a known number of individuals are marked in some way and released into the population at large. (Population is defined here as the fish of a particular species occupying the area of interest, not in the genetic sense.) The population is then sampled and its size is estimated from the ratio of marked to unmarked individuals. Depletion methods observe the rate at which catches decline with successive sampling. This provides an estimate of catchability that can be used to estimate the size of the population. Calibrated methods, based on detailed knowledge of gear efficiency/catchability, use a pre-determined formula to estimate abundance from the catch that results from a unit of sampling effort. There are assumptions with respect to catchability (among other things) for each of the methods of estimating absolute abundance or density. Mark-recapture methods assume equal catchability of marked and unmarked fish. Most depletion methods assume equal catchability between successive samplings, although if sufficient sampling runs are completed some methods can estimate catchability for each run from the catch data. Calibrated methods assume that catchability is the same as during the calibration studies. These assumptions are critical to the accuracy of the estimates. There is a large volume of literature dealing with methods of estimating abundance that should be consulted by anyone that needs to have a thorough understanding of these issues. GEAR REVIEWS 1. Gill Nets Description and method of use Gill nets consist of mesh with square openings fastened to a positively buoyant line at the top, often referred to as the float line, and a negatively buoyant line at the bottom, often referred to as the lead line because lead has traditionally been used to weight this line (Fig. 1). Gill nets are typically stretched between two fixed points (although drift nets are used in marine fisheries). They are set by attaching one end to an immobile object such as an anchor or a tree along the shoreline and then moving away from that point while paying out the net. Once the other end it reached, it too is attached to an immobile object
4

such as an anchor. The net is left in place and fish are captured when they swim into it. Gill nets are most often set with the lead line resting on the bottom, the float line floating above it, and the mesh stretched between the two. By adjusting the relative buoyancy of the float and lead lines, however, it is also possible to set gill nets that float at the surface and to suspend them at various depths. Gill nets can also be set vertically, a technique that is sometimes used to assess the depth distributions of fish. If boating conditions are favourable, gill nets can easily be set and lifted by two people from a small boat (Fig. 2) Fish are caught in gill nets when they become wedged in the openings in the mesh or become entangled in it. Consequently, the size of the openings, commonly referred to as mesh size, is a critical parameter affecting efficiency. Mesh size is usually measured and described as stretched mesh, which is equal to the sum of the lengths of two sides (the distance between two opposing corners of a square when it is stretched into a straight line). Mesh size can also be described by the length of one side of the square. This is referred to as bar mesh. Thus, for a given square, the stretched mesh size is twice the bar mesh size. Most individual gill nets contain only one mesh size. Often several nets are joined together into what is referred to as a gang. Gangs can contain nets of different mesh sizes and often resource agencies use specific combinations of mesh sizes for index or inventory work. There are also gill nets designed specifically for scientific purposes that contain a range of mesh sizes in a single net. Gill nets are also described in terms of their length, the distance or the number of mesh openings between the float and lead lines, and the material that the mesh is made of. Most gill nets today are made of monofilament nylon, but older nets were made of cotton and multi-filament nylon. An example of a net description would be a 100 metre long by 40 mesh deep, 10 cm stretched mesh monofilament gill net.
Habitat considerations Gill nets can be set wherever there is sufficient unobstructed depth for the lead and float lines to fully separate. Emergent and floating vegetation, and brush, trees and other obstructions near the surface can preclude their use. Gill nets tangle on any rough object, so retrieving them can be difficult and result in damage to the nets in habitats where there is a lot of wood or other debris, as is often the case in reservoirs where forests have been flooded or in areas where logs have been stored. Gill nets cannot be set perpendicular to strong currents, but may be set parallel to them. Even in relatively gentle currents, however, debris can accumulate in gill nets, decreasing their fishing efficiency and increasing their water resistance. In rivers, the accumulation of fallen leaves is often a problem in autumn. Gill nets can be set over any substrate, although efficiency is probably reduced, especially for benthic species, when the substrate is very uneven (i.e., boulders). Visibility plays a role in catch efficiency, so light and turbidity can affect catch (Berst, 1961; Hansson and Rudstam, 1995), as can net colour (Jester, 1973, 1977). Efficiency can decrease with time set if the nets become fouled with algae or debris (Hamley, 1975).
5

Selectivity/Efficiency Gill nets are highly selective and there is a large body of literature addressing the relationships between mesh size and fish size. There are two aspects to the selectivity of gill nets. First, like all passive gear, their efficiency is directly related to the probability that a fish will encounter them. Gill nets are not effective for catching sedentary fishes. Catchability increases as movement of the target species increases. In addition to behavioural differences (sedentary versus roaming), distance traveled can be influenced by swimming ability, which, for a given species, is often related to size. Consequently, some researchers have used fish size to estimate the relative probability that fish of various sizes will encounter the nets (Rudstam et al. 1984; Spangler and Collins, 1992). Seasonal differences in fish movement can be very important in determining the likelihood of encounter. Neumann and Willis (1995) reported that the catch-per-unit-effort of northern pike (Esox lucius) in gill nets was lowest in winter and highest in spring. Changes in movement in response to weather, or any other stimulus, can influence encounter probability. There is a high encounter probability for gear sets along spawning migration routes during spawning season. The second aspect of catchability in gillnets is the probability that a fish that does encounter the net will be retained. Gill nets capture fish by three principal methods, wedging, gilling and tangling (Baranov, 1914). Wedged fish attempt to swim through an opening in the mesh and are eventually prevented from swimming further by the mesh that encircles their body. Gilled fish are not necessarily tightly held by the mesh around them, but are prevented from backing out of the opening because the strands lodge under their opercula. Tangled fish are held by mesh that is tangled on various parts of their bodies such as fin spines, pre-opercles, maxillaries, and teeth. Gill nets can be highly selective with respect to fish size, particularly if wedging is the principal means of retention. McCombie and Berst (1969) examined the relationship between mesh size and fish girth for yellow perch (Perca flavescens), white sucker (Catostomus commersonii), and round whitefish (Prosopium cylindraceum). When girth was standardized by expressing it as a proportion of mesh perimeter, size selectivity was greatest for white sucker; their maximum girth ranged from about 1.0-1.5 times the mesh perimeter. Round whitefish maximum girth ranged from 1.1 – 1.9 times the net perimeter, and yellow perch maximum girth ranged from 0.9 to 1.5 times the net perimeter. The fact that few fish are captured whose maximum girth is less than the mesh perimeter is not surprising, as we would expect that they could swim through the mesh. The fact that the maximum girth is often larger than the mesh perimeter reflects a number of factors: the fish is not always caught at its point of maximum girth, the mesh can compress the body of the fish as it struggles, and nylon thread is somewhat elastic. The relationship between fish girth and retention means that changes in girth due to gravidity or other factors can influence the length of fish that are captured by a given mesh size. Several authors have investigated the difference in size and selectivity between fish that are wedged and fish that are tangled. Not surprisingly, fish caught by tangling tend to
6
have a wider range of relative girths than those caught by wedging (McCombie and Berst, 1969; Hamley, 1975; Hovgård, 1996; Hansen et al. 1997). The third aspect affecting gill net selectivity, retention, is influenced by the material that the mesh is made of. In the 1930s, cotton thread, which was softer and more elastic, replaced linen thread in the construction of net twine (Pycha, 1962). In the late 1940s and early 1950s, net manufacturers switched from cotton twine to multifilament nylon twine (Pycha, 1962; Hamley, 1975). Monofilament nylon is the predominant mesh material used today. Understanding the effect of changing mesh construction on catchability has been important for interpreting long-term catch/effort data series that are based on more than one mesh type. Consequently this topic has received considerable attention. Pycha (1962) found that multifilament nylon nets were 2.25 – 2.8 times as efficient as cotton nets in capturing lake trout. Collins (1979) found that, based on lake whitefish (Coregonus clupeaformis) catches, monofilament nylon nets were 1.8 times as efficient as multifilament nylon nets. Henderson and Nepszy (1992) reported that catches were larger in monofilament gill nets than in multifilament gill nets for 16 of the 23 species caught, with a maximum efficiency increase of approximately 3 fold.
Quantification of Effort Gill net effort is usually calculated by multiplying the length of net by the length of time it was set. Catches are then standardized to units such as number of fish captured per metre-hour, or per 100 metre-days. There are some complicating factors with respect to length of time set. Catches can be expected to decline due to localized depletion of fish unless fish are very abundant or mobile, or both. Also, the efficiency of gill nets can decrease as fish accumulate in the net, a phenomenon known as gear saturation. The rate of saturation depends on the rate at which fish are caught, which in turn is typically related to fish abundance, so that catchability can be inversely related to density (Hansen et al. 1998; Borgstrøm, 1992; Henderson and Nepsy, 1992). Obviously, damage to (holes in) nets decreases their efficiency. The part of the day during which nets are set can also influence catches. Minns and Hurley (1988) observed both increasing and decreasing catch-per-unit-effort with increasing set time in gill nets set in the late afternoon and lifted 1.5 to 12 hours later. Species richness increased with length of time set. They hypothesized that time-of-day influences on activity contributed to differences in catch rates and species richness, as the sets variously included daylight, dusk, overnight and dawn periods. Often gill nets are set in the late afternoon and lifted in the morning. This is referred to as an overnight set, and because an overnight set fishes during dawn and dusk and overnight, as well as during a portion of daylight hours, it should sample fishes that are active during any of these periods. Dawn and dusk are probably important periods as many species demonstrate crepuscular activity. Minns and Hurley (1988) also examined the influence of the length of net on catch-per-unit-effort. For yellow perch, net length did not affect catch-per-unit-effort, but for white perch (Morone americana), alewife (Alosa pseudoharengus) and walleye (Sander vitreus), CPUE decreased with increasing net length.
7

Clearly, it is important to standardize gear and methods as much as possible if gill net catches are to be used as an index of abundance. Even with standardization, gill net catches are notoriously variable and large numbers of sets are likely to be required if the goal is to demonstrate statistically significant differences between locations or years.
Fish Injury/survival Gill nets are not usually thought of as a gear to be used when investigators wish to keep fish alive, except when fine mesh gill net sets are set for short periods on spawning shoals to catch lake trout (Salvelinus namaycush) by their teeth. However, mortality appears to vary widely depending on the species and ambient conditions (C. Portt, personal observation). Fish that become wedged or tangled in a manner that obstructs the opercula or the mouth so that they are prevented from ventilating usually die. However, fish that are able to ventilate after they are caught often survive capture. The likelihood that fish will survive capture also appears to increase as water temperature decreases, which may be related to dissolved oxygen concentrations. Hopkins and Cech (1992) attributed acidosis in gill netted striped bass (Morone saxatilis) to both severe exercise and respiratory impairment. Physical injury during retention and removal can also occur, including injury to the gills and the integument. We are aware of no post-capture survival studies.
Summary Gill nets are an effective but highly selective gear that is relatively simple to use. They are susceptible to damage, and modern nylon mesh must be replaced rather than mended. The lead and float lines are expensive, but can be re-used. Gill nets can be used in most habitats where there is ample unobstructed depth to allow the mesh to be extended between the float and lead lines, except where there are strong currents. Quantification of fishing effort usually considers the length of gear and the time set, but normalizing catches from different mesh sizes and soak times can be complex. Fish mortality varies among species and with habitat conditions, but is typically high.
References Baranov, F.I. 1914. The capture of fish by gillnets. Mater. Poznaniyu Russ. Rybolovstva
3: 56-99. (In Russian, cited in Ricker, 1975). Berst, A.H. 1961. Selectivity and efficiency of experimental gill nets in South Bay and
Georgian Bay of Lake Huron. Trans. Amer. Fish. Soc. 90: 423-418. Borgstrøm, R. 1992. Effect of population density on gillnet catchability in four allopatric
populations of brown trout (Salmo trutta). Can. J. Fish. Aquat. Sci. 49: 1539-1545.
Collins, J.J. 1979. Relative efficiency of multifilament and monofilament nylon gill net
towards lake whitefish (Coregonus clupeaformis) in Lake Huron. J. Fish. Res. Board Can. 36: 1180-1185.
8

Hamley, J.M. 1975. Review of gillnet selectivity. J. Fish. Res. Board Can. 30: 817-830. Hansen. M.J., C.P. Madenjian, J.H. Selgeby and T.H. Helser. 1997. Gillnet selectivity for
lake trout (Salvelinus namaycush) in Lake Superior. Can. J. Fish. Aquat. Sci. 54:2483-2490.
Hansen, M.J. R.G. Schofhaar and J.H. Selgeby. 1998. Gill-net saturation by lake trout in
Michigan waters of Lake Superior. North American Journal of Fisheries Management 18: 847-853.
Hansson, S. and L.G. Rudstam. 1995. Gillnet catches as an estimate of fish abundance: a
comparison between vertical gillnet catches and hydroacoustic abundance of Baltic Sea herring (Clupea harengus) and sprat (Sprattus sprattus). Can. J. Fish. Aquat. Sci. 52: 75-83.
Henderson, B.A. and S.J. Nepszy. 1992. Comparison of catches in mono- and
multifilament gill nets in Lake Erie. North American Journal of Fisheries Management 12: 618-624.
Hopkins, T.E. and J.J. Cech Jr. 1992. Physiological effects of capturing striped bass in
gill nets and fyke traps. Trans. Amer. Fish. Soc. 121: 819-822. Hovgård, H. 1996. A two-step approach to estimating selectivity and fishing power of
research gill nets used in Greenland waters. Can. J. Fish. Aquat. Sci. 53: 1007-1013.
Jester, D.B. 1972. Variations in catchability of fishes with color of gillnets. Trans. Amer.
Fish. Soc. 101: 109-115. Jester, D.B. 1977. Effects of color, mesh size, fishing in seasonal concentrations, and
baiting on catch rates of fishes in gill nets. Trans. Amer. Fish. Soc. 106: 43-56. McCombie, A.M and A.H. Berst. 1969. Some effects of shape and structure of fish on
selectivity of gillnets. J. Fish. Res. Board Can. 26: 2681-2689. Minns, C.K. and D.A. Hurley. 1988. Effects of net length and set time on fish catches in
gill nets. North American Journal of Fisheries Management 8: 216-223. Neumann, R.M. and D.W. Willis. 1995. Seasonal variation in gill-net sample indexes for
northern pike collected from a glacial prairie lake. North American Journal of Fisheries Management 15: 838-844.
Pycha, R.L. 1962. The relative efficiency of nylon and cotton gill nets for taking lake
trout in Lake Superior. J. Fish. Res. Board Can. 19: 1085-1094.
9

Ricker, W.E. 1975. Computation and interpretation of biological statistics of fish populations. Bulletin 191. Fish. Res. Board Can. 382 p.
Rudstam, L.G., J.J. Magnuson and W.M. Tonn. 1984. Size selectivity of passive fishing
gear: a correction for encounter probability applied to gill nets. Can. J. Fish. Aquat.Sci. 41: 1252-11255.
Spangler, G.R. and J.J. Collins. 1992. Lake Huron fish community structure based on
gill-net catches corrected for selectivity and encounter probability. North American Journal of Fisheries Management 12: 585-597.
2. Beach Seines Description and method of use Beach seines consist of a length of fine mesh strung between a positively buoyant line (the float line) and a negatively buoyant line (the lead line) that is pulled through the water to encircle fish. Often a bag of the same mesh that extends behind the plane of the net is built into the midpoint, so that fish move into the bag as the net is pulled forward. Seines with a bag are referred to as bag seines. Seines can be built using a variety of mesh types and sizes, but the typical beach seines used in research are made of a woven (also called knotless) nylon mesh with 6 mm (1/4 inch) openings. The weight or strength of meshes varies and can have a significant effect on durability. A description of a seine normally includes its length, depth, the dimensions of the bag (if present), and the mesh size and material. Sometimes the amount of floatation and weight on the lead and float lines is also provided. Beach seines can be used by wading or deployed from a boat. A single deployment and retrieval of a beach seine is usually referred to as a haul. In the simplest technique two people, one on each end of the seine, walk in parallel through the water with the seine forming a U-shape behind them. Seines are also often deployed by keeping one end fixed and deploying the net in a semi-circle, either by wading or from a boat. To prevent fish from escaping, it is critical that the lead line remain on the bottom. Sometimes a pole is attached to each end of the seine and used as a handle. The lead line is attached to the bottom of the pole, which is kept on or at the substrate. An alternate method is to tie a loop in each end of the lead line and place it over the operators’ feet that are closest to the net, and to hold the float line in the hand closest to the net. The bottom line is pulled forward by the operators leg (Fig. 3). The beach seine haul is culminated by bringing the two ends of the seine together and pulling the net forward so that the encircled fish end up either in the bag or, if no bag is present, in the mesh that is between the lead and float lines. This is achieved by bringing the two ends of the lead line together and retrieving the lead line, slightly in advance of the float line, forcing fish back into the bag or back of the net. This is normally done at the shore (hence beach seine). It is possible to retrieve a seine into a boat, but the efficiency is lower (Bayley and Herndeen, 2000).
10
Habitat considerations Beach seines are normally only used in water depths that are less than one half or two thirds the depth of the seine, so that the lead line remains on the bottom and the float line remains at the surface as the net is pulled forward. Deployment and retrieval is easiest over smooth bottoms with no debris or obstructions. Seine nets can become snagged on rocks, logs, etc., and often can only be freed by pulling the net backward, off the object. Where debris is present it is useful to have a third person follow the net who can free it when it becomes snagged. Often the lead line is raised off the bottom when the net is snagged, and this, in combination with the unsnagging process, can allow fish to escape. Pierce et al. (1990) found that capture efficiency decreased with the number of snags that were encountered. Rough bottoms will also increase the likelihood that fish can escape beneath the lead line. Parsley et al. (1989) found that, generally, efficiency was higher over smooth substrates than rough substrates, although the difference was often not statistically significant (P>0.05). The exception was crappies, for which efficiency was significantly higher (P<0.05) over coarse substrates. Dense macrophytes prevent the lead line from reaching the bottom. Macrophytes or other debris caught in a seine can cause the seine to roll up upon itself, so that the lead line is raised from the bottom and the outside of the net becomes the leading edge, which reduces capture efficiency (Pierce et al. 1990). In some circumstances, debris can prevent water from flowing through the mesh, creating a current away from the front of the net and making it difficult or impossible to pull the net forward. Accumulations of macrophytes or other objects can become so heavy that weight alone makes it impossible to pull the net forward. However, Pierce et al. (1990) found that when corrected for rolling, catchability increased with increasing macrophyte density. They attributed this to fish being less agitated and less likely to flee during capture where macrophytes were present. High turbidity may have a similar effect. Fine mesh seine nets cannot be used in strong currents because the resistance that they create makes it impossible to pull them. Even if the net can be pulled forward, the force of the current can raise the lead line from the bottom, much like accumulated debris can in still water. Larger mesh seines built for use in strong current are often equipped with very heavy lead lines or weighted with chain along the bottom to prevent this from occurring. Seasonal differences in efficiency were reported by Allen et al. (1992). They suggested that these may be due to seasonal differences in fish size, temperature influences on swimming ability, or seasonal differences in turbidity.
Selectivity/Efficiency Like all mesh-based equipment, the minimum size of fish retained is determined by the size of the openings in the mesh. Some fish that could pass through the openings are often retained in small mesh seines, apparently because they are not aligned perpendicular to the openings. Tangling is not prevalent, but can occur. Smelt (Osmerus
11
mordax) sometimes are tangled by their teeth and brown bullheads (Ameiurus nebulosus) by their spines, in the weave of the mesh. Avoidance is a major factor affecting selectivity of seines and it is influenced by swimming ability and behaviour. The efficiency of seining can be broken down into encircling efficiency and retention efficiency. For individuals that attempt to avoid being encircled by fleeing, catchability generally decreases as swimming speed increases (Bayley and Herendeen, 2000). This results in catchability decreasing with fish size. Jackson and Noble (1995) found that the relative efficiency of beach seining for capturing juvenile largemouth bass (Micropterus salmoides) decreased with increasing size over the 30 mm – 60 mm total length range and was very low for fish >60 mm total length. Studies that occur inside blocking nets may not observe this phenomenon because the fish cannot flee the enclosed area (Bayley and Herendeen, 2000). Several researchers have documented that benthic fishes are less likely to be captured than mid-water species (Pierce et al. 1990; Lyons, 1986; Parsley, 1989), presumably because they escape beneath the lead line. Bailey and Herendeen (2000) found that the catchability was highest for surface and mid-water schooling species, intermediate for territorial and cover-seeking species and lowest for demersal and eel-like species. Pierce et al. (1990) found that catchability increased with size for benthic species but not for midwater species. They attributed this to smaller benthic individuals being more likely to pass beneath the net than larger individuals. Pierce et al. (1990) calculated mean capture efficiencies of a single seine haul to be 75% (range 0.13 – 0.96) for mid-water species and 50% (range 0.17 – 0.81) for benthic species. At more than half of their stations, however, too few benthic species were captured to permit abundance, and hence catchability, to be calculated, and this could have been the result of either very low abundance or very low catchability. Parsley et al. (1989) reported capture mean efficiencies of single night seine hauls that ranged from 0.96 for peamouth (Mylocheilus caurinus) over fine substrate to 0.12 for prickly sculpin (Cottus asper) over coarse substrate. Table 1 shows the capture efficiencies for seven species in shallow littoral habitats determined by Lyons (1986). Pierce et al. (2001) reported that seining at night resulted in significantly higher species richness estimates than seining during the day, but total density did not differ significantly between day and night samples. It has been the experience of the senior author that in relatively clear water with adjacent deep habitats, species composition can differ markedly between night and day seine catches. Allen et al. (1992) found that maximum species richness in estuarine habitats was reached after between 6 and 12 seine hauls depending on year and season. Dewey et al. (1989) noted that species richness in seine catches was much higher than in pop net catches. This can be attributed in part to the larger area sampled by seining, and possibly also to the finer mesh of the seine.
12
Quantification of Effort Effort is usually expressed in terms of catch per haul if all hauls are similar, catch per distance hauled (e.g. catch per m) or catch per unit area seined (e,g, catch per m2). Usually in any given study the same seine or identical seines are used for all hauls so that gear characteristics, such as the presence of a bag or the length of the seine, do not contribute to variability. There is rarely an attempt to correct for snags, debris or other factors that can affect the efficiency of individual seine hauls. Such corrections would be difficult since the affect of such events on the probability of fish escaping would vary widely. In practice, investigators will often abort hauls when catchability is compromised, or will complete them but exclude them from analyses that assume constant catchability among hauls.
Fish Injury/survival Seined fish are subject to the stress of capture but are usually not injured. Exceptions are small individuals that are wedged in the mesh and fragile species, including those that lose scales easily (e.g. some Notropis spp). Additional stress and mortality can occur while the catch is being processed. Processing time increases markedly when fish must be sorted from algae, macrophytes or organic debris. Leaving the bag of the seine in the water or placing the catch in a water-filled container during processing reduces stress.
Summary Seining is a simple method of sampling a large area in a relatively short time. It generally cannot be used among dense and robust macrophytes (e.g. cattails), in habitats with abundant stumps or logs, in fast current, or in deep water. Efficiency varies widely among habitats and species. Benthic species are less catchable than mid-water species. Smaller individuals are more susceptible than large individuals. Very small individuals and fragile species may suffer significant mortality, but for robust species survival is high. References Allen, D.M., S.K. Service and M.V. Ogburn-Matthews. 1992. Factors influencing the
collection efficiency of estuarine fishes. Trans. Amer. Fish. Soc. 121: 234-244. Bayley, P.B. and R.A. Herndeen. 2000. The efficiency of a seine net. Trans. Amer. Fish.
Soc. 129: 901-923. Dewey, M.R., L.E. Holland-Bartels and S.J. Zigler. 1989. Comparison of fish catches
with buoyant pop nets and seines in vegetated and non-vegetated habitats. North American Journal of Fisheries Management 9: 249-253.
Jackson, J.R. and R.L. Noble. 1995. Selectivity of sampling methods for juvenile
largemouth bass in assessments of recruitment processes. North American Journal of Fisheries Management 15: 408-418.
13
Lyons, J. 1986. Capture efficiency of a beach seine for seven freshwater fishes in a north-temperate lake. North American Journal of Fisheries Management 6: 288-289.
Parsley, M.J., D.E. Palmer and R.W. Burkhardt. 1989. Variation in capture efficiency of
a beach seine for small fishes. North American Journal of Fisheries Management 9: 239-244.
Pierce, C.L., J.B. Rasmussen and W.C. Legget. 1990. Sampling littoral fish with a seine:
corrections for variable capture efficiency. Can. J. Fish. Aquat. Sci. 47: 1004-1010.
Pierce, C.L., A.M. Corcoran, A.N. Gronbach, S. Hsia, B.J. Mullarkey and A.J.
Schwartzhoff. 2001. Influence of diel period on electrofishing and beach seining assessments of littoral fish assemblages. North American Journal of Fisheries Management 21:918-926.
3. Hoop Nets, Fyke Nets and Trap Nets Description and method of use These three gears trap fish inside mesh enclosures. The fish enter through constrictions, referred to as tunnels or funnels or throats. In hoop nets, the mesh is supported by rigid frames or hoops. These frames were historically made of wood but today are usually made of aluminum tubing. The hoops may be round, D-shaped or square. The tunnels are cones of mesh that are attached to a pair of hoops, so that when the net is set and the hoops are separated the narrow end of the tunnel points to the rear. Usually there are two tunnels per net. The hoops can be held apart by spreader bars that are attached to the hoops, or by stretching the net between fixed points. A fyke net is simply a hoop net to which wings and a lead (or leader) are attached. Wings are short lengths of mesh with float and lead lines that are attached to the lateral margins of the first hoop and extended at ∀45º to the longitudinal plane of the trap. A lead is a length of mesh that is attached to float and lead lines and is fastened to the midpoint of the first hoop and extended forward parallel to the longitudinal plane of the trap. A trap net is similar to a fyke net, in that it has wings and a lead attached and a tunnel or tunnels through which fish enter, but it is does not have rigid frames. It relies instead on floats, weights and attachment to anchors or other fixed points to maintain the shape of the enclosure (Fig. 4). Trap nets have a seam in the top of the heart, the mesh box that contains the trapped fish, that is laced or zipped closed while the net is fishing but can be opened to provide access so that fish can be removed, usually with a dip net. Variations on the basic design of these nets have been developed for specific applications, including a floating version (Miranda et al. 1996) and versions suspended from cables in fast currents (Tsumura and Hume, 1986).
14
Most hoop nets, trap nets and fyke nets used for research purposes can be set and lifted by two people. Both setting and lifting can be difficult in rough water, and lifting trap nets can be dangerous. Often, the lead is fixed to an object on shore and extended perpendicular to shore, with the trap portion at the offshore end. The nets can also be attached to anchors or to stakes driven into the bottom. If it is to be reset at the same location, a trap net is usually emptied by slackening the rope that is attached to the rear of the net, positioning a boat crosswise beneath this rope so that the rope straddles the boat, and then raising part of the heart out of the water so that the fish are confined to a smaller area. The seam is opened and the fish are removed. Once the fish have been removed the seam is closed and tension is re-applied to the rear rope. Kreuger et al. (1998) reported that approximately 10 fyke nets could be lifted in the time required to lift one 45.7 metre long gillnet containing 6 mesh sizes ranging from 3.2 cm to 7.0 cm when large numbers of fish were captured in both types of net. Fyke nets and hoop nets are accessed at the posterior end, where the mesh that extends beyond the last hoop, sometimes referred to as the cod end, is usually closed by a drawstring and secured by a rope that is wrapped around the mesh forward of the drawstring and tied. To lift the net, the rope attached to the rear of the net is slackened. The hoops are then lifted sequentially from the front, forcing fish in the front of the net through the tunnels and into the rear. If the fyke net and its catch are light, the hoops can be raised sequentially by working over the side of the boat. If the net or the catch is too heavy it may be necessary to pass the hoops over the boat or to empty some of the fish before moving fish that are in the forward part of the net to the rear. The fish can be dip-netted through the opening in the rear of the net, or dumped out of this opening if the trap can be lifted out of the water. Hoop nets that use spreader bars are usually lifted completely out of the water and into the boat to remove fish. Hoop nets are described by the size, shape and number of hoops, the size and material of the mesh that covers the hoops and makes up the tunnels, and the number of tunnels and the size of the openings in them. For fyke nets, the length, height and mesh size and material of the wings and lead should also be reported. Trap nets are described by mesh size and material, the dimensions of the heart, the number of tunnels, the size of the throats(s) and the wing and lead dimensions and materials. Many agencies have adopted standards for the construction of these nets, so that the term 4-foot trap net, for example, would imply all of the dimensions and characteristics of the gear. Hoop nets are often baited in order to entice fish to enter. Fyke and trap nets are normally not baited, relying instead on the lead and wings to guide fish into them. These nets can trap a variety of creatures other than fish, including turtles, waterfowl (especially diving ducks) and aquatic mammals such as muskrats, beavers and otters (C. Portt, personal observation). Turtles rarely cause damage to the nets, but waterfowl and mammals often chew holes (sometimes several) in the mesh that allow them and fish to escape and that take time to repair. The probability of catching waterfowl is greatly reduced if the front hoop is completely submerged, so that only birds that dive and enter the net are caught, instead of birds that are swimming on, or flying just above, the
15
surface. The amount of damage caused by mammals is also greatly reduced if the net is completely submerged. Habitat considerations Trap nets can be set in water that is deeper than the height of the net, but they are usually not set in water that is shallower than the height of the net because they rely on floatation to maintain their shape. Hoop nets and fyke nets can be set in water that is deeper or shallower than the height of the hoops, as long as the tunnels are submerged. These nets are difficult to set where the bottom is uneven, such as among boulders, and where there is dense vegetation or an abundance of other obstructions such as logs or stumps. In shallow water it is often easier to set these nets by wading than from a boat. Kreuger et al. (1998) reported that, in deeper water, round fyke nets were easier to set than D-shaped fyke nets because they tended to roll into the proper position. It is difficult to set these nets perpendicular to strong currents. Setting perpendicular to even a moderate current is ill-advised if there is a lot of debris moving downstream that can become caught in the mesh and add to the resistance of the set, as the increased force can dislodge and/or damage the gear. Fyke nets and trap nets can, however, be set parallel to quite strong currents. The attachment of fyke and trap nets depends upon depth, substrate and current velocities. In deep water or over coarse substrate anchors must nearly always be used. In shallow water over soft substrates the net can often be fixed to posts driven into the substrate. In nearshore areas of lakes or rivers, one or more points of attachment can often be trees or other objects on shore. Selectivity/Efficiency There are three aspects to the selectivity/efficiency of these nets. First, like all passive gear, their efficiency is directly related to the probability that a fish will encounter them. The second aspect is the probability that fish that encounter them will enter them, and the third is that fish that enter them will be retained. The probability of a fish encountering these nets increases with distance traveled, so that the behavioral and seasonal factors relevant to all passive gear come into play. Ryan (1984) compared fyke net catch-per-unit-effort to Schnabel population estimates for brook trout (Salvelinus fontinalis) and Atlantic salmon (Salmo salar) in two Newfoundland lakes. The catchability of brook trout did not differ significantly between lakes or between seasons, but the catchability of Atlantic salmon differed significantly between spring and fall. Seasonal differences in catch-per-unit-effort of bluegill (Lepomis macrochirus) were reported by Cross et al. (1995), who suggested that reproductive behavior and seasonal shifts in habitat preferences were responsible. In Lake Erie trap nets, catches of most species varied seasonally (Hamley and Howley, 1985). Hamley and Regier (1973) reported that the catchability of walleye in trap nets increased with fish size, and Latta (1959) found that this was also true for rock bass (Ambloplites rupestris), yellow bullheads (Ameiurus natalis), white suckers and, in two of three lakes, for bluegill. Latta (1959) reported that catchability was highest for intermediate sized
16

brown bullhead. Laarman and Ryckman (1982) found that trap net catchability increased with size, although not necessarily in a linear fashion, for rock bass, walleye, black crappie (Pomoxis nigromaculatus), bluegill, yellow perch and pumpkinseed (Lepomis gibbosus), but that catchability did not appear to increase with size for white sucker and smallmouth bass (Micropterus dolomieu). It is likely that the increase in catchability with size that has been commonly reported is because large fish move farther than small fish in a given period of time, and thus are more likely to encounter the net. Ricker (1975), however, suggested that the greater catchability for larger fish might be due to their tendency to seek cover, which the net could provide. Most studies of catchability in these gear are based on mark-recapture data, and it is possible that larger fish are less affected by handling and marking. In a mark-recapture study of yellow perch, the incidence of fungal infection among recaptured fish was higher for small yellow perch than for large yellow perch (C.Portt, unpublished data). Predation upon small fish by larger fish can also occur in trap and fyke nets, which effectively biases catches. Kreuger et al. (1998) compared catches in gill nets, round fyke nets and D-shaped fyke nets. There was little difference between catches in round and D-shaped fyke nets. Benthic species and species with an affinity for cover made up a higher proportion of the catch in fyke nets than in gill nets. Conversely, pelagic species accounted for a greater proportion of gill net catches. Seasonal variations in catches varied between lakes and between fyke nets and gill nets. The maximum size of fish that can enter these nets is determined by the size of the throat and, like all mesh-based equipment, the minimum size of fish retained is determined by the perimeter of the openings in the mesh in relation to a fish’s maximum girth. Fish that are sufficiently small can, of course, escape through the mesh of trap and fyke nets, but fish also can find their way back out of these gears. Patriarche (1968) found that all marked pumpkinseed and largemouth bass that were large enough to be retained by the mesh escaped from trap nets within three days. Quantification of Effort Effort is usually expressed in terms of catch per net per length of time set. Net dimensions are normally standardized if comparisons between catches are to be made; we are aware of no studies that have attempted to adjust catches for gear size. Hamley and Howley (1985) reported that for Lake Erie trap net catches of rock bass and freshwater drum (Aplodinotus grunniens), as well as total catches, increased approximately in proportion to soak time for up to three days using one dataset, and for 4 to 5 days using another. This was not the case for yellow perch, however. Gear saturation can occur when catches are high, such as during spawning migrations, because the net becomes so full that more fish have difficulty entering (C. Portt, personal observation). The variability in trap net catches is often very high. The result is that large numbers of catches are often required to detect even large changes in abundance (Kreuger et al. 1998; Lester et al. 1996; Hamley and Howley, 1985).
17
Fish Injury/survival Fish captured in hoop, trap and fyke nets are usually not injured, although this is influenced by factors such as water temperature and dissolved oxygen concentrations. It is not unusual for small numbers of fish to be wedged or tangled in the mesh of the net, like they are in gill nets, but the heavy twine used in the mesh of these nets is not very efficient in this regard. There are reports of entire catches being killed by sudden temperature changes when upwelling conditions change in large lakes, or when a seiche exposes captive fish to anoxic hypolimnetic water. Larger fish can, and do, eat small fish inside these nets, thus affecting the apparent catch of small fish and the stomach contents of the larger fish.
Summary Hoop, trap nets and fyke nets can be used to capture fish with little chance of injury in a variety of habitats, but are difficult to use where currents are strong and/or carry a lot of debris. The sizes normally used for research purposes can be set and lifted by two people. Fyke nets tend to be easier and faster to set and to lift than trap nets. These nets are passive gear, and therefore catch fish that are moving. They are size and species selective and catches are often highly variable. These gear are well suited to intercepting fish moving along known migration routes, such as during spawning migrations. References Cross, T.K., M.C. McInerny and D.H. Schupp. 1995. Seasonal variation in trap-net
catches of bluegill in Minnesota Lakes. North American Journal of Fisheries Management 15: 382-389.
Hamley, J.M. and T.P. Howley. 1985. Factors affecting variability of trapnet catches.
Can. J. Fish. Aquat. Sci. 42: 1079-1087. Hamley, J.M. and H.A. Regier, 1973. Direct estimates of gillnet selectivity to walleye
(Stizostedion vitreum vitreum). J. Fish. Res. Board Can. 30: 817-830. Kreuger, K.L., W.A. Jhubert and R.M. Price, 1998. Tandem-set fyke yets for sampling
benthic fishes in lakes. North American Journal of Fisheries Management 18: 154-160.
Laarman, P.W. and J.R. Ryckman, 1982. Relative size selectivity of trap nets for eight
species of fish. North American Journal of Fisheries Management 2: 33-37. Latta, W.C. 1959. Significance of trap-net selectivity in estimating fish population
statistics. Pap. Mich. Acad. Sci. Arts Lett. 44: 123-138. (Cited in Ricker, 1975). Lester, N.P., W.I. Dunlop, and C.C. Wilcox. 1996. Detecting changes in the nearshore
fish community. Can. J. Fish. Aquat. Sci. 53 (Suppl. 1): 391-402.
18

Miranda, L.E., M.S. Schorr, M.S. Allen and K.O. Meals. 1996. Description of a floating trap net for sampling crappies. North American Journal of Fisheries Management 16: 457-460.
Patriarche, M.H. 1968. Rate of escape of fish from trap nets. Trans. Amer. Fish. Soc. 97:
59-61. Ryan, P.M. 1984. Fyke net catches as indices of the abundance of brook trout Salvelinus
fontinalis, and Atlantic salmon, Salmo salar. Can. J. Fish. Aquat. Sci. 41: 377-380.
Tsumura, K. and J.M.B. Hume. 1986. Two variations of a salmonid smolt trap for small
rivers. North American Journal of Fisheries Management 6: 272-276. 4. Electrofishing Description and method of use Electrofishing is the term generally applied to a process that establishes an electric field in the water in order to capture fish. When exposed to the field, most fish become oriented toward the anode and as the density of the electric field increases they swim toward it. In close proximity to the anode, they are immobilized. The actual sequence of responses to the electric field is more complex and varies depending upon the type of current applied (AC, DC, pulsed DC), the initial orientation of the fish with respect to the field and field density. Most electrofishing equipment in North America uses pulsed DC. Lamarque (1990) and Lamarque et al. (1971) offer detailed discussions of the responses, including a proposed neurological basis. Sharber and Black (1999), however, have proposed that the observed responses are not the result of local action of electric fields on nerve and muscle fibres, but rather are epileptic events resulting from central nervous system response to electric shock. There are three types of electrofishing units in general use: backpack units (Fig. 5), stream-side or shore units, and electrofishing boats (Fig. 6). Electric seines consist of a series of electrodes spaced along cables that are stretched between two operators in a seine like fashion, and are much less commonly used (Bayley et al. 1989). Typically the electrofishing operators move through habitats accompanied by assistants who collect shocked fish with dipnets. DeVries et al. (1995) described a variation in which fish were collected in a ‘push net’ attached to the front of an electrofishing boat below the water surface as the boat moved forward. Electrofishing is also used for point sampling with stationary boats (e.g. Cunningham, 1995), thrown anodes, and pre-positioned electrode arrays that are often referred to as prepositioned area electrofishers (PAEs; e.g., Bowen and Freeman, 1998) or prepositioned areal electrofishing devices (PAEDs; e.g., Fisher and Brown, 1993).
19
Backpack units, as their name implies, are carried by the operator and may be powered by either a battery or a small gasoline-powered generator. The operator wades with the unit, holding a pole-mounted anode and trailing a cathode, and is accompanied by one or more assistants who capture shocked fish with dip nets. Streamside or shore units are powered by a gasoline generator. A single cathode is placed in the stream, usually at the upstream end of the reach that is to be sampled, and one or more anodes can be used, again with assistants dip netting fish. Multiple anodes are often used in larger streams as they permit more thorough coverage. The distance between the cathode and the anode can be considerable (at least 100 m) if desired. Sometimes the generator and electronics is floated in a small boat or a raft in which case the cathode is usually attached to the boat or raft. In navigable waters, electrofishing boats can be used. The electronics and generators used in electrofishing boats are essentially the same as those of the shore units. Typically the hull of the boat functions as the cathode, and anodes are suspended from booms attached to the front of the boat. Vaux et al. (2000) used a backpack electrofisher from a small boat with good results. A number of researcher-built electric seines have been described (Bayley et al. 1989; Angermeier et al. 1991). They consist of electrode arrays attached to cables that are stretched across streams, sometimes with a pole-mounted electrode at either end. They too have been powered by generators and power converters that remain on the shore or bank. Unlike most commercial electrofishers used today, these electric seines used AC, and this almost certainly has contributed to their reported high efficiencies (Bayley et al. 1989; Angermeier et al. 1991). As the name implies, the electrode array of prepositioned electrofishers are installed and left in place for some time prior to the sampling. There are a number of designs for PAEDs, including dropper arrays similar or identical to those used on the booms of many electrofishing boats but suspended from rope (Fisher and Brown, 1993), wire electrodes laid parallel and a fixed distance apart along the bottom (Fisher and Brown, 1993), and frames with wire electrodes attached (Dewey, 1992). After the PAED has been in place for a period of time (i.e., at least 15 minutes, Bowen and Freeman, 1998; at least 30 minutes, Dewey, 1992) the array is energized using a generator powered electrofishing unit, and the shocked fish are collected with dip nets or a small seine. The effectiveness of electrofishing in attracting and immobilizing fish is influenced by the characteristics of the electric field that is established. These, in turn, are influenced by the characteristics of the electrical output, the shape and composition of the electrodes and electrode arrays, and the conductivity of the water. All other factors being equal, higher voltage is required when conductivity is lower. Most units allow the operator to adjust the output voltage and frequency, and pulsed DC units usually allow the pulse width to be adjusted as well. Various other aspects of the equipment, such as electrode size and shape, influence the electric field and thus fishing efficiency. Novotny (1990) discusses several aspects of electric output characteristics and electric fields.
20

There are safety concerns associated with electrofishing, and safety training for operators is essential. A discussion of safety issues is presented in Goodchild (1990). Habitat considerations Conductivity influences the power, and hence field density, that an electrofisher creates at a given voltage, which in turn influences efficiency. Conductivity increases as the content of ionized salts increases, and is also temperature dependent, increasing by approximately 2% for each centigrade degree increase in water temperature. Lower conductivity requires output at higher voltage in order to generate the same power. Power can also be increased by increasing the size surface area of electrodes. Burkhardt and Gutreuter (1995) recommend standardizing power output by adjusting voltage to compensate for differences in conductivity and temperature in order to reduce variability in electrofishing catches. Backpack electrofishers can only be used in habitats where operators can safely wade, so depth, current velocity, substrate and debris can all preclude use. The same is true of shore units and electric seines, as their operators also wade. Hickley (1990) considered wading to be too dangerous at depths greater than 0.5 m. In our experience, if current is not an issue, the maximum depth in which a backpack unit can be used is somewhat deeper. Electrofishing boats can sample navigable habitats. Electrofishing efficiency is lower in large streams than in small streams (Paller, 1995). In narrow streams, fish have much less opportunity to escape by avoiding the field, whereas fish are often observed swimming around the field in wider habitats. The ability of fish to avoid capture in wider streams can be reduced by using multiple backpack units or multiple anodes on shore-based units. The multiple electrodes on electric seines create a ‘curtain of energized water’ that is difficult for fish to avoid (Bayley et al. 1989). Electrofishing boats become less efficient in deeper water where fish can avoid the electric field by sounding. The depth at which this occurs will vary with equipment and conditions. Dense macrophytes or woody debris can prevent fish from swimming toward the anode, thus reducing efficiency. Netting efficiency is an important determinant of electrofishing efficiency. Visibility is critical. Generally, visibility decreases with depth and small fish are more difficult to see than large fish. In very turbid environments it can be impossible to see fish that are not at the surface. In these situations one is usually reduced to sweeping or positioning the dip net behind the anode, as there is no opportunity for directed netting. Reynolds (1983) stated that catch rates are highest at intermediate turbidities because when turbidity is low fish see the boat or operators sooner and have more opportunity to flee, while at high turbidity netters cannot see the fish. McInerny and Cross (2000), however, found that the daytime catch per hour of largemouth bass decreased with increasing Secchi depth. Dewey (1992) calculated the mean capture efficiency of PAEDs to be 80% in non-vegetated, relatively clear water but only 5% in vegetated, turbid water, and recommended against their use under the latter conditions.
21

Incident lighting affects visibility and can be affected by cloud conditions, sun angle and shade. During the daytime, it is common practice for operators to wear polarized sunglasses to reduce glare. When using multiple-pass methods that assume effort and efficiency are constant, the changing angle of the sun may make this nearly impossible to achieve. Disturbance of the water surface by currents or wind reduces visibility. Needless to say, good lighting is very important when night electrofishing. Cover of nearly any type can obscure fish from view. Fish in dense cover may never be seen and even fish that are seen initially can be lost in aquatic vegetation and beneath coarse substrates or undercut banks. Habitat factors that affect the maneuverability of dip nets can affect netting efficiency. These include current velocity, substrate, underwater obstructions, and aquatic and bank vegetation. Netting can be difficult in fast currents because the maneuverability of the net is reduced and because fish are carried quickly out of the electric field, reducing the length of time they are immobilized. Obstructions that interfere with netting can be problematic, whether they are in the water or along the banks; it can be nearly impossible to effectively electrofish small streams with dense, overhanging shrubs. Dense macrophytes also interfere with netting. Seasonal influences on fish distributions and activity levels are important factors influencing catch (McInerny and Cross, 2000). Zalewski and Cowx (1990) summarize several studies examining the effect of water temperature and season on efficiency. Selectivity/Efficiency The selectivity/efficiency of electrofishing gear is influenced by avoidance, susceptibility and response to the electronic field, and susceptibility to netting. Fast, actively swimming species that flee in response to disturbances caused by wading operators are more likely to avoid the field than species that freeze or hide when frightened. Species vary in their susceptibility to electric fields (Ruppert and Muth, 1997), and species with lower susceptibility to the electric field are less likely to be captured. Data from Mahon (1980) who conducted multi-pass electrofishing and then poisoned the same stream sections with rotenone, illustrate several factors regarding the catchability of species (Fig. 7). Species that swim actively toward the anode and rise to the surface, such as white sucker are more likely to be captured than those that swim weakly and are negatively buoyant, such as Etheostomatidae. Stonecats (Noturus flavus) live beneath and among rocks and their catchability by electrofishing is extremely low. Visibility is also a factor, as individuals of cryptic species, which also tend to be benthic species, are more likely to be overlooked than others. Within a species, capture efficiency is nearly always higher for larger individuals. Mahon et al. (1979) found that the mean weight of individuals captured decreased with successive electrofishing passes for most species. Peterson et al. (2004) found that the catchability of marked bull trout (Salvelinus confluentus) and cutthroat trout (Oncorhynchus clarki) increased with fish length (Fig. 8) and Thompson and Rahel
22
(1996) observed the same phenomenon with brook trout. The difference in catchability may be due to a combination of greater susceptibility to the field, greater visibility, and the natural tendency of netters to try to capture the largest fish first. It is common practice to attempt to reduce the error introduced by size-related differences in efficiency. One simple approach, when mark-recapture or depletion methods are used to estimate abundance, is to calculate separate estimates for different size ranges (e.g Mahon, 1980). Anderson (1995) proposed an alternative approach in which the relationship between fish size and catchability is estimated directly from mark-recapture data and used to adjust abundance estimates. Several authors have documented decreases in catchability on successive electrofishing passes (Mahon, 1980; Peterson et al. 2004). A number of authors have reported that efficiency was negatively correlated with fish density (Hall, 1986; McInerny and Cross, 2000 and others), while others, such as Edwards et al. (1997) have reported the relationship to be constant. Efficiency will decrease as fish abundance increases if the number of fish exceeds what netters are able to capture before they are swept away, carried into cover, or recover. Several studies have documented higher catch per unit effort with electrofishing boats at night than during the day. Dumont and Dennis (1997) examined the difference in night and day catch rates of several length ranges of largemouth bass, bluegill and gizzard shad (Dorosoma cepedianum) in Texas reservoirs. There were significant differences in 11 of 26 comparisons (P<0.05), and in all cases where significant differences occurred the catch rate was higher at night. McInerny and Cross (2000) reported that catches of largemouth bass 200 mm and longer were generally greater at night (21 of 24 comparisons). Paragamian (1989) found that catch per unit effort of smallmouth bass was higher at night than during the day in an Iowa river. The night CPUE:day CPUE ratio ranged from 1.9 for fish <180 mm total length to 4.1 for fish # 280 mm. Pierce et al. (2001) found that species richness was greater in samples collected at night with an electrofishing boat than those collected during the daytime, and total catch per unit effort was also higher. Increased species richness may occur at night due to inshore movements by species such as walleye. Based on the relationship between length of stream electrofished and sample species richness, for 10 sites on 9 Wisconsin streams, Lyons (1992) recommended electrofishing (1 pass) reaches 35 times the stream mean width (at normal base flow) or 3 complete riffle/pool sequences to determine species richness. The mean widths of the streams he examined ranged from 4.9 m to 17.2 m, and the sample richness ranged from 11 – 28. Paller (1995) determined that reaches 235 m -555 m long (mean 370 m) had to be sampled in order to capture all species in low gradient first to third order South Carolina streams with a single electrofishing pass. This was equal to 60 to 120 stream widths. If fish accounting for less than 1% of total catch or less than 3% of total catch were excluded, the mean required reach length was reduced to 225 m and 136 m respectively. Paller (1995) also determined that, when multiple passes were made through reaches, the number of species captured increased significantly (P<0.05) with successive passes until
23
the fifth pass. Mahon (1980) captured all but the least abundant species in the first electro-fishing pass. However, some of the least abundant species were not captured at all by electrofishing, even after multiple passes, and their presence was only detected following rotenone poisoning. Capture efficiency plays a large role in determining the length of stream that must be sampled and may explain the differences between the results of Paller (1995), who was working in low conductivity streams and reported a mean first pass efficiency of 0.22, and Lyons (1992) whose efficiencies were probably two to three times higher, based on another study using similar equipment (Simonson and Lyons, 1995) in Wisconsin streams. Simonson and Lyons (1995) compared species richness, total abundance and assemblage structure based on three- or four-pass removal estimates in sections isolated with block nets to the same measures based on a single pass through contiguous reaches without blocking nets. Species richness determined by multiple passes in blocked sections was only slightly, and not significantly (P>0.10) higher than determined by a single pass in unblocked sections. Spearman’s rank correlation of total estimated abundance in blocked sections versus total catch following a single pass in unblocked sections was highly correlated (rs = 0.83) and fish assemblage structures estimated by the two methods were very similar. They advocate using catch from a single electrofishing pass for comparing several similar stations or for monitoring trends over time at a single station, but indicate that single-pass catches from stations with substantially different habitat characteristics should not be directly compared, and that multi-pass removal estimates and/or mark-recapture estimates are necessary when precise, unbiased abundance estimates are required. Bowen and Freeman (1998) examined the efficiency of PAEs for estimating species richness. They found that the rates of species accumulation with effort varied between sites. They recommended use of historic data in combination with 70 PAE catches to evaluate rates estimates of species richness in medium-sized rivers. Increasing sampling effort from 60 to 200 PAE catches typically increased bootstrap estimates of species richness by 6 or fewer species. Walsh et al. (2002) compared PAE and multiple-pass electric seine catches in a small stream. Of 11 species captured three ‘rare’ species were captured by only one of the two gears; one was captured only by PAEs and two were captured only by the electric seine. Species richness estimated with the electric seine was less variable than that estimated with PAEs. They estimated that it may be necessary to sample >40% of a sampling site in order to estimated species richness using PAEs. Mean CPUE (fish per second) was higher with the electric seine for seven of the eight species that were captured by both gears, although the difference was only significant (P<0.03) for two species, orangethroat darter (Etheostoma spectabile) and slender madtom (Noturus exilis). There is some confusion between the table and the text with respect to whether the catch was higher with the seine (text) or the PAE (table) for the former species. Length-frequency distributions differed significantly (P<0.05) between the two methods of capture for three of the eight species.
24

Jones and Stockwell (1995) examined the relationship between single pass catches and three-pass removal estimates of abundance of age 0 and age > 0 rainbow (Oncorhynchus mykiss) and brown trout (Salmo trutta) conducted at the same sites three to five weeks later. The regression of removal estimates versus the single-pass catch was highly significant (log-transformed data, r2=0.86) and there were no significant differences in the relationship (P<0.05 Bonferroni-adjusted) between species or between age groups. The authors concluded that estimating abundance from single-pass catches using the regression equation, which allows for more areas to be sampled with the same amount of effort than if multi-pass estimates are conducted, was advantageous for estimating catchment-level population estimates because the reduction in error achieved through sampling additional sites was greater than the reduction in error achieved through the increased precision at individual sites obtained using multi-pass estimates. Since the regression of single-pass catch versus multi-pass estimate is determined by catchability, any factor that affects catchability affects the relationship. Stockwell and Jones (1995) cautioned against applying their regression model to samples collected by other electro-fishing crews, with different gear, or in streams with different physical characteristics, or for different species. Quantification of Effort The make and model of the electrofishing unit, the electrical output settings, and the size of the dip net mesh should be provided in any description of electrofishing. Electrofishing effort can be expressed in terms of the length of stream or shoreline fished, the area fished, the length of time spent fishing, or the amount of time that a current is actually being applied to the water (electroseconds). In some situations, and with some gears, current is continuously applied, so that time spent fishing and electroseconds are the same. The amount of time required to electrofish a reach of stream or shoreline increases as fish abundance increases because of the time required to net fish. Often the operator will leave the anode of backpack or shore units stationary with the power on, or cycling on and off, in order to ‘hold’ fish until they can be netted, so that electro-seconds also increase with fish abundance. Similarly, it is common to reduce boat speed if fish are abundant. Consequently, time is not a satisfactory measure of effort for calculating CPUE using these methods. Usually, a single pass through the subject area is considered to be one unit of effort. The consistency of effort can be increased if certain conventions are adopted, including being sure to electrofish all of the available habitat, attempting to capture all fish that are observed (but not going back and re-shocking areas in order to do so), and standardizing power output to the extent possible. However, as discussed above, large differences in catch efficiency among habitats, species, and sizes of a single species mean that the relationship between CPUE and abundance or density can vary widely. This is one reason that multiple-pass methods, that do not rely on constant catchability between sites, are considered be the most suitable for projects that require sampling sites that exhibit a wide range habitat characteristics. These methods may also be advantageous in long-term studies. Electrofisher manufacturers change their products over time and for long-term projects, sooner or later, a new unit, potentially with different efficiency, will be necessary. While it should be possible to recalibrate a method for a
25
different electrofisher, estimates from multi-pass methods are independent, eliminating the need. Some operators energize PAEs for a specific period of time and report CPUE as fish per second (i.e., Walsh et al. 2002). Others leave the power on until all observed fish are netted and report the catch as number of fish per sample (i.e. Dewey, 1992). As the distance within which fish are immobilized by PAEs varies among species (Fisher and Brown, 1993), and probably also with size, the area sampled by PAEs will also vary with these parameters. Fish Injury/survival The effects of electrofishing on fish health have been the subject of a considerable amount of research. Survival rates, injury rates, growth rates, physiological effects and gamete viability have all been examined. Much of this research has examined the relationship between electrical characteristics (type of current and wave form) and mortality and injury rates, and most has been conducted on salmonids. Mortality rates are generally low for DC electrofishing. Anslie et al. (1998) found mortality rates were low among juvenile rainbow trout exposed to 1 or 3 electrofishing passes with DC or pulsed DC current and held in tanks for 147 days. No fish died that were exposed to 1 pass and 1 fish died in each of the two groups of 70 captured during each of 3 successive passes. Muth and Ruppert (1997) found that survival was reduced in razorback sucker (Xyrauchen texanus) embryos exposed to high voltage gradients, or to higher frequencies at lower voltage gradients. No mortality was observed among razorback sucker larvae exposed to various pulse forms and gradients, but growth was reduced in exposed fish, relative to controls, 21 and 28 days post-exposure. The most commonly reported serious injuries to fish from electrofishing are spinal dislocations and, in extreme cases, vertebral fractures that are apparently caused by strong muscular contractions. Internal hemorrhaging has also been reported and skin discolourations, referred to as branding, also occurs. A large proportion of spinal injuries evident on X-rays are not evident from external examination (Kocovsky et al. 1997). In several studies, fish have been X-rayed to determine the rate of injury. Ainslie et al. (1998) reported spinal injury rates ranging from a high of 39% for juvenile rainbow trout exposed three times to pulsed DC current to a low of 15% for those exposed to a single pass of constant DC current (300 v). For fish exposed to pulsed DC, injury rates increased significantly (P<0.05) with increasing fork length, even though the fish were quite small and the size range narrow (100 – 160 mm fork length). Dalbey et al. (1996) reported spinal injury rates of 40%, 54% and 12% for wild rainbow trout captured using half-pulse, full-pulse and smoothed DC current respectively. Both the rate and severity of injury increased with fish size. Size dependant injury rates were also reported by Thompson et al. (1997a), who reported overall spinal injury rates of 6% - 64% for rainbow trout and 18% - 52% for brown trout. Habera et al. (1999) reported a spinal injury rate of 35% for large brown trout (264 – 647 mm total length) captured using AC current in soft waters.
26

Few data on spinal injuries are available for non-salmonids. Ruppert and Muth (1997) examined the spinal columns of 360 shocked juvenile bonytail (Gila elegans) under a dissecting microscope after the flesh on one side was removed and found no spinal injuries. Data on externally evident spinal injuries indicates that spinal injury rates for longnose sucker (Catostomus catostomus) may be comparable or higher to those for salmonids (Kocovsky et al. 1997). Short-term physiological effects induced by pulsed DC current in the absence of injury include lactacidosis and disturbance of the inter-renal stress response (Mitton and MacDonald, 1994). Field studies examining the effect of electrofishing on growth and condition of salmonids have reported mixed results. Thompson et al. (1997b) found growth of previously shocked and tagged rainbow and brown trout was reduced at some sites and not at others, and that condition was significantly (P<0.05) lower in previously shocked and tagged fish in only two of ten possible comparisons. Hughes (1998) found that previously electrofished and tagged Arctic grayling (Thymallus arcticus) grew more slowly than those not previously shocked and tagged. Dalbey et al (1996) found that growth and condition of fish held in ponds were markedly lower among rainbow trout that experienced spinal misalignment and fracture during electrofishing than among shocked fish that did not experience these injuries. Ainslie et al. (1998) also found that the growth rate of captive juvenile rainbow trout decreased with increasing severity of spinal injuries. The percent hatch of walleye eggs fertilized by males collected by electrofishing was lower than that for those fertilized by males collected by gill netting in 5 of six trials, but overall there was no statistically significant difference (P=0.36; Koupal et al, 1997). Muth and Ruppert (1996) reported that the percent hatch of razorback sucker eggs was significantly lower (P<0.05) when adults were exposed to pulsed DC current prior to gamete collection. Summary Electrofishing is an active fishing method that can be used in a wide range of habitats where safe wading or boating is possible. Safety training is required for operators and the minimum crew is two people. All but very small fish are susceptible to electrofishing, but catchability varies widely among species and is higher for larger individuals. Efficiency also varies with habitat conditions. With DC current, mortality rates are low but spinal injury rates can be high, especially among larger fish. References Ainslie, B.J., J.R. Post and A.J. Paul. 1998. Effects of pulsed and continuous DC
electrofishing on juvenile rainbow trout. North American Journal of Fisheries Management 18: 905-918.
Anderson, C.S. 1995. Measuring and correcting for size selection in electrofishing mar-
recapture experiments. Trans. Amer. Fish. Soc. 124: 663-676.
27
Angermeier, P.L., R.A. Smogoer and S.D. Steele. 1991. An electric seine for collecting fish in streams. North American Journal of Fisheries Management 11: 352-357.
Bayley, P.B., R.W. Larimore and D.C. Dowling. 1989. Electric seine as a fish-sampling
gear in streams. Trans. Amer. Fish. Soc. 118: 447-453. Bowen, Z.H. and M.C. Freeman. 1998. Sampling effort and estimates of species richness
based on prepositioned area electrofishing samples. North American Journal of Fisheries Management 18: 144-153.
Burkhardt, R.W. and S. Gutreuter, 1995. Improving electrofishing catch consistency by
standardizing power. North American Journal of Fisheries Management 15: 375-381.
Cunningham, K.K. 1995. Comparison of stationary and mobile electrofishing for
sampling flathead catfish. North American Journal of Fisheries Management 15: 515-517.
Dalbey, S.R., T.E. McMahon and W. Fredenberg. 1996. Effect of electrofishing pulse
shape and electrofishing-induced spinal injury on long-term growth and survival of wild rainbow trout. North American Journal of Fisheries Management 16: 560-569.
DeVries, D.R., M.J. Van Den Avyle and E.R. Gilliland. 1995. Assessing shad abundance:
electrofishing with active and passive fish collection. North American Journal of Fisheries Management 15: 891-897.
Dewey, M.R. 1992. Effectiveness of a drop net, a pop net, and an electrofishing frame for
collecting juvenile fishes in vegetation. North American Journal of Fisheries Management 12: 808-813.
Dumont, S.C. and J.A. Dennis. 1997. Comparison of day and night electrofishing in
Texas reservoirs. North American Journal of Fisheries Management 17: 939-946. Edwards, C.M., R.W. Drenner, K.L. Gallo and K.E. Rieger. 1997. Estimation of
population density of largemouth bass in ponds by using mark-recapture and electrofishing catch per effort. North American Journal of Fisheries Management 17: 719-725.
Fisher, W.L. and M.E. Brown. 1993. A prepositioned areal electrofishing apparatus for
sampling stream habitats. North American Journal of Fisheries Management 13: 807-816.
Goodchild, G. 1990. Electric fishing and safety. Pp 157-175 in I.G. Cowx and P.
Lamarque [Eds.] Fishing with Electricity. Fishing News Books, Oxford, England.
28
Habera, J.W., R.J. Strange and A.M. Saxton. 1999. AC electrofishing injury of large brown trout in low-conductivity streams. North American Journal of Fisheries Management 19: 120-126.
Hall, T.J. 1986. Electrofishing catch per hour as an indicator of largemouth bass density
in Ohio impoundments. North American Journal of Fisheries Management 6: 397-400.
Hickley, P. 1990. Electric fishing in practice. Pp. 176-187 in I.G. Cowx and P. Lamarque
[Eds.] Fishing with Electricity. Fishing News Books, Oxford, England. Hughes, N. 1998. Reduction in growth due to electrofishing and tagging may change
interannual movement behaviour of stream salmonids: evidence from Arctic grayling in an interior Alaskan stream. Trans. Amer. Fish. Soc. 127: 1072-1077.
Jones, M.L. and J.D. Stockwell. 1995. A rapid assessment procedure for the enumeration
of salmonine populations in streams. North American Journal of Fisheries Management 15: 551-562.
Kocovsky, P.M., C. Gowan, K.D. Fausch and S.C. Riley. 1997. Spinal injury rates in
three wild trout populations in Colorada after eight years of backpack electrofishing. North American Journal of Fisheries Management 17: 308-313.
Koupal, K.D., J.R. Satterfield, Jr. and S.A. Flickinger. 1997. Comparative gear selectivity
for male walleyes and influence of method of capture on resultant hatching success. Progressive Fish Culturalist 59: 218-221.
Lamarque, P. 1990. Electrophysiology of fish in electric fields. Pp 4-33 in I.G. Cowx
and P. Lamarque [Eds.] Fishing with Electricity. Fishing News Books, Oxford, England.
Lamarque, P., J. Etzensperger and N. Charlton. 1971. Etude électro-physiologique des
réactions de la grenouille au courant élecrique continu. Annales d’Hydrobiologie 2: 5-23.
Lyons, J. 1992. The length of stream to sample with a towed electrofishing unit when fish
species richness is estimated. North American Journal of Fisheries Management 12: 198-203.
Mahon, R. E.K. Balon and D.L.G. Noakes. 1979. Distribution, community structure and
production of fishes in the upper Speed River, Ontario: a preimpoundment study. Env. Biol. Fish 4: 219-244.
Mahon, R. 1980. Accuracy of catch-effort methods for estimating fish density and
biomass in streams. Env. Biol. Fishes 5: 343-360.
29
McInerny, M.C. and T.K. Cross. 2000. Effects of sampling time, intraspecific density, and environmental variables on electrofishing catch per effort of largemouth bass in Minnesota Lakes. North American Journal of Fisheries Management 20: 328-336.
Mitton, C.J.A. and D.G. McDonald. 1994. Consequences of pulsed DC electrofishing and
air exposure to rainbow trout (Oncorhynchus mykiss). Can. J. Fish. Aquat. Sci. 51: 1791-1798.
Muth, R.T. and J.B. Ruppert. 1996. Effects of two electrofishing currents on captive ripe
razorback suckers and subsequent egg-hatching success. North American Journal of Fisheries Management 16: 473-476.
Muth, R.T. and J.B. Ruppert. 1997. Effects of electrofishing fields on captive embryos
and larvae of razorback sucker. North American Journal of Fisheries Management 17: 160-166.
Novotny, D.W. 1990. Electric fishing apparatus and electric fields. Pp. 34-88 in I.G.
Cowx and P. Lamarque [Eds.] Fishing with Electricity. Fishing News Books, Oxford, England.
Paller, M.H. 1995. Relationship among number of fish species sampled, reach length
surveyed, and sampling effort in South Carolina plain streams. North American Journal of Fisheries Management 15: 110-120.
Paragamian, V.L. 1989. A comparison of day and night electrofishing: size structure and
catch per unit effort for smallmouth bass. North American Journal of Fisheries Management 9: 500-503.
Peterson, J.T., R.F. Thurow and J.W. Guzevich. 2004. An evaluation of multi-pass
electrofishing for estimating the abundance of stream-dwelling salmonids. Trans. Amer. Fish. Soc. 133: 462-475.
Pierce, C.L., A.M. Corcoron, A.N. Gronbach, S. Hsia, B.J. Mullarkey and A.J.
Schwartzhoff. 2001. Influence of diel period on electrofishing and beach seining assessments of littoral fish assemblages. North American Journal of Fisheries Management 21: 918-926.
Reynolds, J.B. 1983. Electrofishing. Pages 147-164 in L.A. Nielson and D.L. Johnson,
editors, Fisheries Techniques. American Fisheries Society, Bethesda, Maryland. Ruppert, J.B. and R.T. Muth. 1997. Effects of electrofishing fields on capture of juveniles
of two endangered cyprinids. North American Journal of Fisheries Management 17: 314-320.
30

Sharber, N.G. and J.S. Black. 1999. Epilepsy as a unifying principle in electrofishing theory: a proposal. Trans. Amer. Fish. Soc. 128: 666-671.
Simonson, T.D. and J. Lyons. 1995. Comparison of catch per effort and removal
procedures for sampling stream fish assemblages. North American Journal of Fisheries Management 15: 419-427.
Thompson, K.G., E.P. Bergersen, R.B. Nehring. 1997a. Injuries to brown trout and
rainbow trout induced by capture with pulsed direct current. North American Journal of Fisheries Management 17: 141-153.
Thompson, K.G., E.P. Bergersen, R.B. Nehring and D.C. Bowden. 1997b. Long-term
effects of electrofishing on growth and body condition of brown trout and rainbow trout. North American Journal of Fisheries Management 17: 154-159.
Thompson, P.D. and F.J. Rahel. 1996. Evaluation of depletion-removal electrofishing of
brook trout in small Rocky Mountain streams. North American Journal of Fisheries Management 16: 332-339.
Vaux, P. D., T. R. Whittier, G. DeCesare, and J. P. Kurtenbach. 2000. Evaluation of a
backpack electro-fishing unit for multiple-lake surveys of fish assemblage structure. North American Journal of Fisheries Management 20:168–179.
Walsh, M.G., D.B. Fenner and D.L. Winkelman. 2002. Comparison of an electric seine
and prepositioned electrofishing area electrofishers for sampling stream fish communities. North American Journal of Fisheries Management 22: 77-85.
Zalewski, M. and I.G. Cowx. 1990. Factors affecting the efficiency of electrofishing.
Pp. 89-111 in I.G. Cowx and P. Lamarque [Eds.] Fishing with Electricity. Fishing News Books, Oxford, England.
5. Underwater Observation Description and method of use Underwater observations can be made by snorkeling, by using SCUBA, or with underwater video cameras. The observer must be able to identify the fish observed without having them in hand. Diver/snorkeler observations can be recorded on underwater writing tablets and video can be recorded. Fish can be counted across the entire width of streams, using single or multiple observers depending on stream width and visibility. Observations can also be made along transects of known length and width (Pratt, 2004; Buckland et al. 1993). Schill and Griffith (1984) describe the use of PVC pipe to maintain multiple observers in the same relative position along a transect. An alternate to transects is to count fish within a specified radius from a given point (Graham, 1992), which is effectively point sampling.
31
Thurow and Schill (1996) reported coefficients of variation for replicate night snorkeling counts of bull trout to be quite low. Graham (1992) found that counts of bluegills within a prescribed radius of divers were lower when divers first descended than counts made 3 minutes and five minutes after descent. This could occur if fish were scared away by the diver’s descent. It could also occur if fish were attracted to the diver or by some consequence of the diver’s presence, such as disturbed bottom sediments containing food. Fish length can be estimated visually, or by aligning the snout and tail with adjacent objects and measuring that distance (Cunjak and Power, 1986). Objects are magnified by 20%-30% underwater, and some investigators have applied a correction factor to visual estimates of length to compensate for this (e.g., Mullner et al. 1998). There are often significant differences between length-frequency distributions based on visual observations and those based on measurement of electrofished individuals (Roni and Fayram, 2000; Mullner et al. 1998). Because the fish are actually observed in their habitat, rather than removed from it, direct observation can be used to determine specific habitat relationships that are difficult or impossible to determine using any other means (Cunjak and Power, 1986). The effort required to count fish in a section is much lower, in terms of person-hours, than is required to conduct removal-method population estimates by electrofishing (Hankin and Reeves, 1988; Cunjak et al. 1988). Habitat considerations Snorkeling or SCUBA can be used in a wide variety of situations, but is not possible in extremely small or shallow streams, or in extremely high velocity habitats. Accurate counts are difficult or impossible in very shallow habitats (Cunjak et al. 1988; Hillman et al. 1992). Video cameras are most effective where there are no obstructions to camera manipulation. Visibility and cover are both considerations in direct observations. Schill and Griffith (1984) felt that the 3 metre visibility in the Yellowstone River was near the minimum for applying this method in large rivers. Mullner et al. (1998) found that both visibility and amount of instream cover were significant (p<0.05) in multiple regressions of visual counts versus electrofishing depletion estimates in Wyoming streams, but combined they only accounted for 3% of the variability. In most of the streams that they examined, however, both banks were visible from the center of the stream. One would expect that dense cover, such as weed beds and cobble or boulders would reduce the proportion of fish present that are observed. Comparisons of day and night counts have yielded inconsistent results. Thurow and Schill (1996) reported no significant differences between them ( while Roni and Fayram (2000) reported night counts to be much higher. Undoubtedly the differences between night and day counts will vary among habitats, among species and, in some cases, between seasons.
32

Hillman et al. (1992) poisoned stream reaches with cyanide after conducting snorkeling counts, and found that the efficiency of counts of age-0 chinook salmon (Oncorhynchus tshawytscha) and rainbow trout were strongly and positively correlated with water temperature. They attributed this to the fact that both species sought cover and remained sedentary during the day at low water temperatures. Selectivity/Efficiency Because observational methods do not allow any way of marking or removing fish, efficiency has usually been estimated by comparing counts to electrofishing depletion estimates. Some authors have reported highly significant regressions between counts and electrofishing estimates for salmonid species (Hillman et al. 1992; Mullner et al. 1998; Roni and Fayram, 2000; Hankin and Reeves, 1988), while other authors have reported counts to vary widely in efficiency (e.g., Cunjak et al. 1988). In this approach, and other methods that correlate on estimation method with another, it is important to remember that there is error associated with both estimates and that the regression predicts the mean of the dependent variable (Bakke, 2000). Thompson (2003) conducted an evaluation of the accuracy of predictions of abundance using regressions of snorkeling counts versus removal estimates under various error scenarios, based on Hankin and Reeves (1988) data, and concluded that the predictions might be poor if correlations were less than r = 0.90 or removal estimates were less than 85% of actual abundance. Any factor that affects visibility can affect observation efficiency. Thus, count efficiencies are often lower for smaller fish (Cunjak et al. 1988; Thurow and Schill, 1996). Efficiency is expected to be lower for sedentary and cryptic species. Differences in preferred habitats, which differ in ease of observation (e.g. cover versus no cover, shallow versus deep, riffles versus pools), can cause efficiency to vary among species (Cunjak et al. 1988; Hankin and Reeves, 1988; Hillman et al. 1992; Roni and Fayram, 2000). Some studies have shown count efficiency to be lower when fish densities are high (Cunjak et al. 1988; Roni and Fayram, 2000). This is likely to be more of a concern if multiple species are being examined, and may be particularly problematic for schooling species (Hillman et al. 1992). Quantification of Effort Effort is usually expressed in terms of fish observed per length or area of stream or shoreline or per transect of known length and width. The latter can then be expressed as counts per unit area if desired. Fish Injury/survival One of the advantages of direct observation is that it is benign. Summary Direct observation can be used in a most habitats where there is good visibility and adequate depth. The observer must be able to identify the fish observed without having them in hand. Efficiency decreases if fish abundance is high and accurate counts may not
33

be possible if fish are abundant or are in large schools. Efficiency varies with visibility and cover, and with fish size, coloration and behaviour. Some studies have shown differences in night and day counts and differences with water temperature, both of which are related to fish behaviour. Direct observation does not harm fish, which can be especially important when working with endangered populations (Nielsen, 1998). References Bakke, P. 2000. Comment: Snorkelling as an alternative to depletion electrofishing for
estimating abundance of trout in small streams. North American Journal of Fisheries Management 20: 838-840.
Buckland, S.T., D.R. Anderson, K.P. Burnham and J.L. Laake. 1993. Distance sampling:
estimating abundance of biological populations. Chapman and Hall, London, U.K. Cunjak, R.A. and G. Power, 1986. Winter habitat utilization by stream resident brook
trout (Salvelinus fontinalis) and brown trout (Salmo trutta). Can. J. Fish. Aquat. Sci. 43: 1970-1981.
Cunjak, R.A., R.G. Randall and M.P. Chadwick. 1988. Snorkeling versus electrofishing:
a comparison of census techniques in Atlantic salmon rivers. Naturaliste Canadien 115: 89-93.
Graham, R.J. 1992. Visually estimating fish density at artificial structures in Lake Anna,
Virginia. North American Journal of Fisheries Management 12: 204-212. Hankin, D.G. and G.H Reeves. 1988. Estimating total fish abundance and total habitat
area in small streams based on visual estimation methods. Can. J. Fish. Aquat. Sci. 45: 834-844.
Hillman, T.S., J.W. Mullan, and J.S. Griffith. 1992. accuracy of underwater counts on
juvenile Chinook salmon, coho salmon and steelhead. North American Jounral of Fisheries Management 12: 598-603.
Mullner, S.A., W.A. Hubert and T.A. Wesche. 1998. Snorkeling as an alternative to
depletion electrofishing for estimating abundance and length-class frequencies of trout in small streams. North American Journal of Fisheries Management 18: 947-953.
Neilsen, J. 1998. Scientific sampling effects: electrofishing California’s endangered fish
populations. Fisheries 23: 6-12. Pratt, T.C. 2004. Habitat-specific production rate estimates from 5 Canadian Shield lakes.
Canadian Science Advisory Secretariat Research Document 2004/085.
34
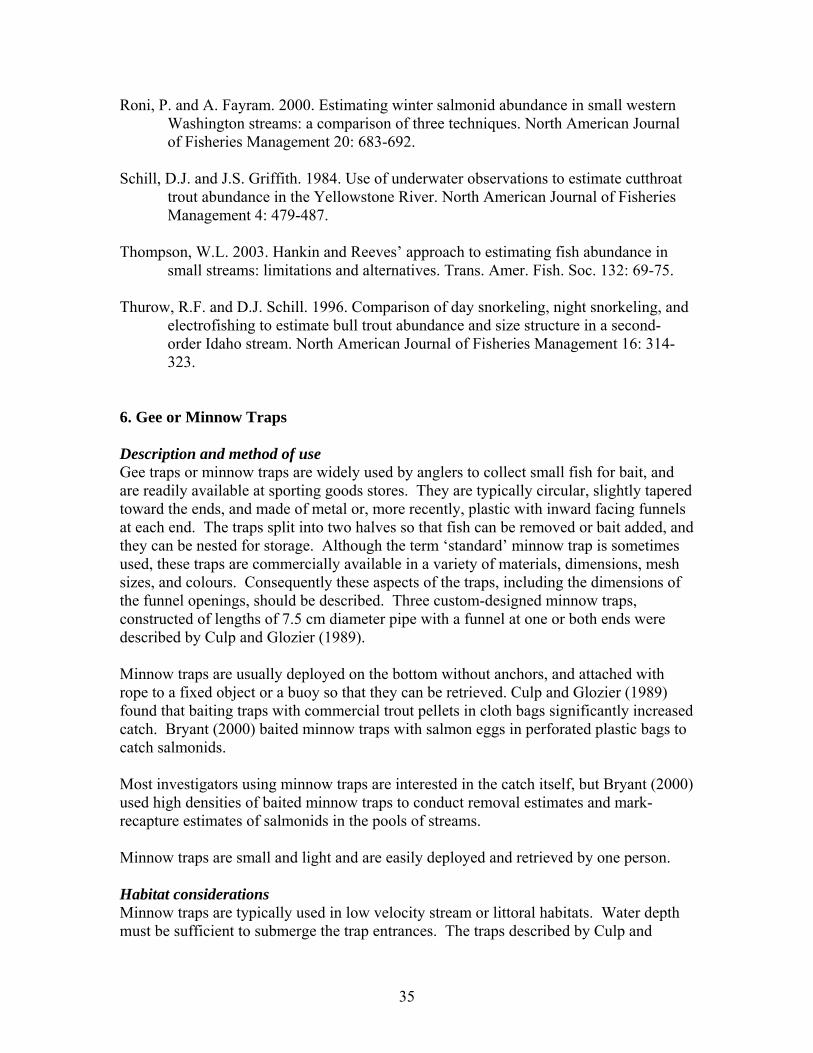
Roni, P. and A. Fayram. 2000. Estimating winter salmonid abundance in small western Washington streams: a comparison of three techniques. North American Journal of Fisheries Management 20: 683-692.
Schill, D.J. and J.S. Griffith. 1984. Use of underwater observations to estimate cutthroat
trout abundance in the Yellowstone River. North American Journal of Fisheries Management 4: 479-487.
Thompson, W.L. 2003. Hankin and Reeves’ approach to estimating fish abundance in
small streams: limitations and alternatives. Trans. Amer. Fish. Soc. 132: 69-75. Thurow, R.F. and D.J. Schill. 1996. Comparison of day snorkeling, night snorkeling, and
electrofishing to estimate bull trout abundance and size structure in a second-order Idaho stream. North American Journal of Fisheries Management 16: 314-323.
6. Gee or Minnow Traps Description and method of use Gee traps or minnow traps are widely used by anglers to collect small fish for bait, and are readily available at sporting goods stores. They are typically circular, slightly tapered toward the ends, and made of metal or, more recently, plastic with inward facing funnels at each end. The traps split into two halves so that fish can be removed or bait added, and they can be nested for storage. Although the term ‘standard’ minnow trap is sometimes used, these traps are commercially available in a variety of materials, dimensions, mesh sizes, and colours. Consequently these aspects of the traps, including the dimensions of the funnel openings, should be described. Three custom-designed minnow traps, constructed of lengths of 7.5 cm diameter pipe with a funnel at one or both ends were described by Culp and Glozier (1989). Minnow traps are usually deployed on the bottom without anchors, and attached with rope to a fixed object or a buoy so that they can be retrieved. Culp and Glozier (1989) found that baiting traps with commercial trout pellets in cloth bags significantly increased catch. Bryant (2000) baited minnow traps with salmon eggs in perforated plastic bags to catch salmonids. Most investigators using minnow traps are interested in the catch itself, but Bryant (2000) used high densities of baited minnow traps to conduct removal estimates and mark-recapture estimates of salmonids in the pools of streams. Minnow traps are small and light and are easily deployed and retrieved by one person. Habitat considerations Minnow traps are typically used in low velocity stream or littoral habitats. Water depth must be sufficient to submerge the trap entrances. The traps described by Culp and
35
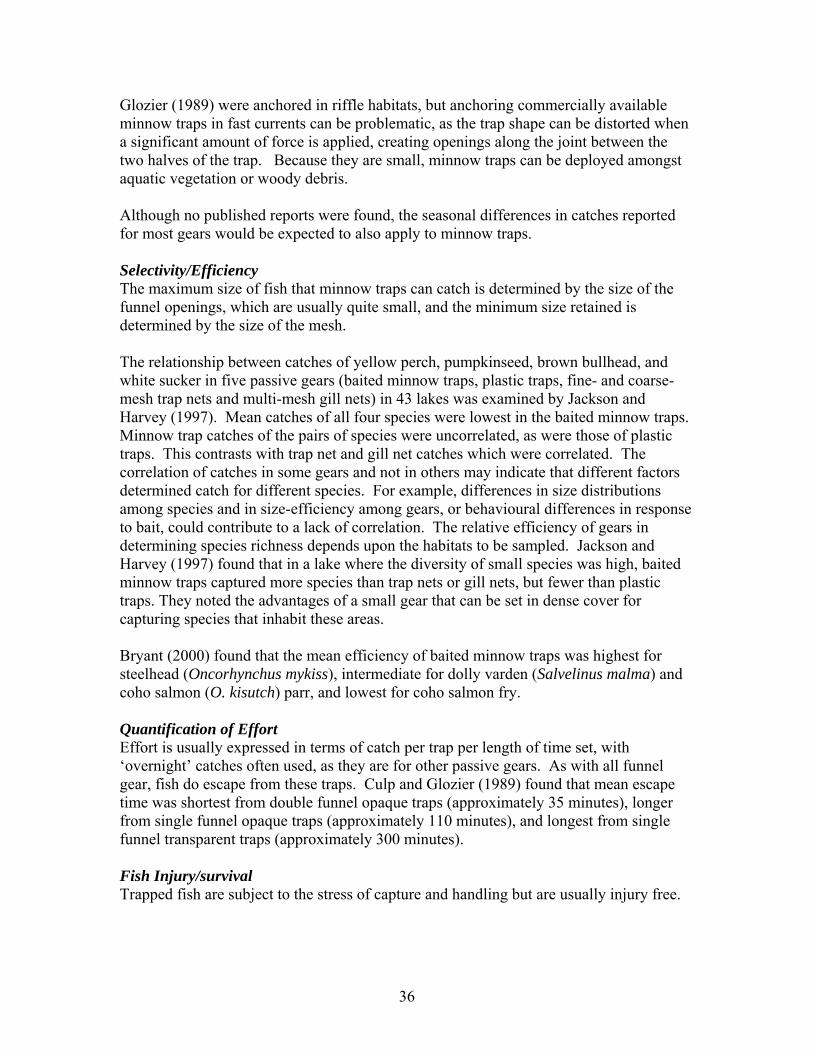
Glozier (1989) were anchored in riffle habitats, but anchoring commercially available minnow traps in fast currents can be problematic, as the trap shape can be distorted when a significant amount of force is applied, creating openings along the joint between the two halves of the trap. Because they are small, minnow traps can be deployed amongst aquatic vegetation or woody debris. Although no published reports were found, the seasonal differences in catches reported for most gears would be expected to also apply to minnow traps. Selectivity/Efficiency The maximum size of fish that minnow traps can catch is determined by the size of the funnel openings, which are usually quite small, and the minimum size retained is determined by the size of the mesh. The relationship between catches of yellow perch, pumpkinseed, brown bullhead, and white sucker in five passive gears (baited minnow traps, plastic traps, fine- and coarse-mesh trap nets and multi-mesh gill nets) in 43 lakes was examined by Jackson and Harvey (1997). Mean catches of all four species were lowest in the baited minnow traps. Minnow trap catches of the pairs of species were uncorrelated, as were those of plastic traps. This contrasts with trap net and gill net catches which were correlated. The correlation of catches in some gears and not in others may indicate that different factors determined catch for different species. For example, differences in size distributions among species and in size-efficiency among gears, or behavioural differences in response to bait, could contribute to a lack of correlation. The relative efficiency of gears in determining species richness depends upon the habitats to be sampled. Jackson and Harvey (1997) found that in a lake where the diversity of small species was high, baited minnow traps captured more species than trap nets or gill nets, but fewer than plastic traps. They noted the advantages of a small gear that can be set in dense cover for capturing species that inhabit these areas. Bryant (2000) found that the mean efficiency of baited minnow traps was highest for steelhead (Oncorhynchus mykiss), intermediate for dolly varden (Salvelinus malma) and coho salmon (O. kisutch) parr, and lowest for coho salmon fry. Quantification of Effort Effort is usually expressed in terms of catch per trap per length of time set, with ‘overnight’ catches often used, as they are for other passive gears. As with all funnel gear, fish do escape from these traps. Culp and Glozier (1989) found that mean escape time was shortest from double funnel opaque traps (approximately 35 minutes), longer from single funnel opaque traps (approximately 110 minutes), and longest from single funnel transparent traps (approximately 300 minutes). Fish Injury/survival Trapped fish are subject to the stress of capture and handling but are usually injury free.
36

Summary Minnow traps are readily available, inexpensive, easily transported, and can be used by one person. They can be used in a range of low velocity habitats, including habitats with dense vegetation or woody debris and custom-designed traps can be used in faster currents. Minnow traps only catch small fish due to the small size of their funnel openings. There are few studies of efficiency, but behavior, including attraction to bait (if it is used) and cover, is likely to have a major affect on catchability. References Bryant, M.D. 2000. Estimating fish populations by removal methods with minnow traps
in southeast Alaska streams. North American Journal of Fisheries Management 20: 923-930.
Culp, J.M. and N.E. Glozier. 1989. Experimental evaluation of a minnow trap for small
lotic fish. Hydrobiologia 175: 83-87. Jackson, D.A. and H.H. Harvey. 1997. Qualitative and quantitative sampling of lake fish
communities. Can. J. Fish. Aquat. Sci. 54: 2807-2813. 7. Enclosure (pop, drop and throw) Traps Description and method of use Enclosure traps surround fish from a relatively small area at a single point in time. Kushlan (1974) described hand-held samplers made of garbage cans or wash tubs with the bottom removed that are plunged through the water and into the substrate, thus trapping fish. He also described a number of drop traps. Drop traps are typically constructed of mesh stretched around a rigid frame, with an open bottom. They are suspended from structures placed on or driven into the bottom. The trap is released remotely, usually by a rope attached to a simple release mechanism, and falls into the water. The fish within it are removed using a dipnet. One variation has a base that rests on the bottom and which is lifted with the trap, so that fish can be easily removed. These traps can be used repeatedly at the same location or moved from place to place. Throw traps are similar to drop traps. Kushlan (1981) described 1 metre square or 1.5 metre square by 0.5 metre high box-like frames of metal pipe, with netting on all four sides. The traps are thrown by one or two persons and the enclosed fishes are collected by dip netting. Kushlan (1981) reported two people could collect 15 samples with a 1 m2 throw net in about 4 hours. It took more time to collect samples with the larger trap and because there was little or no gain from using a larger trap with respect to sampling efficiency, Kushlan (1981) recommended using 1 m2 traps. Peterson and Rabeni (2001) describe a similar quadrat sampler for use in riffles that can be operated by one person. Two 1 m by 1m rigid frames are attached 0.5 m apart to
37
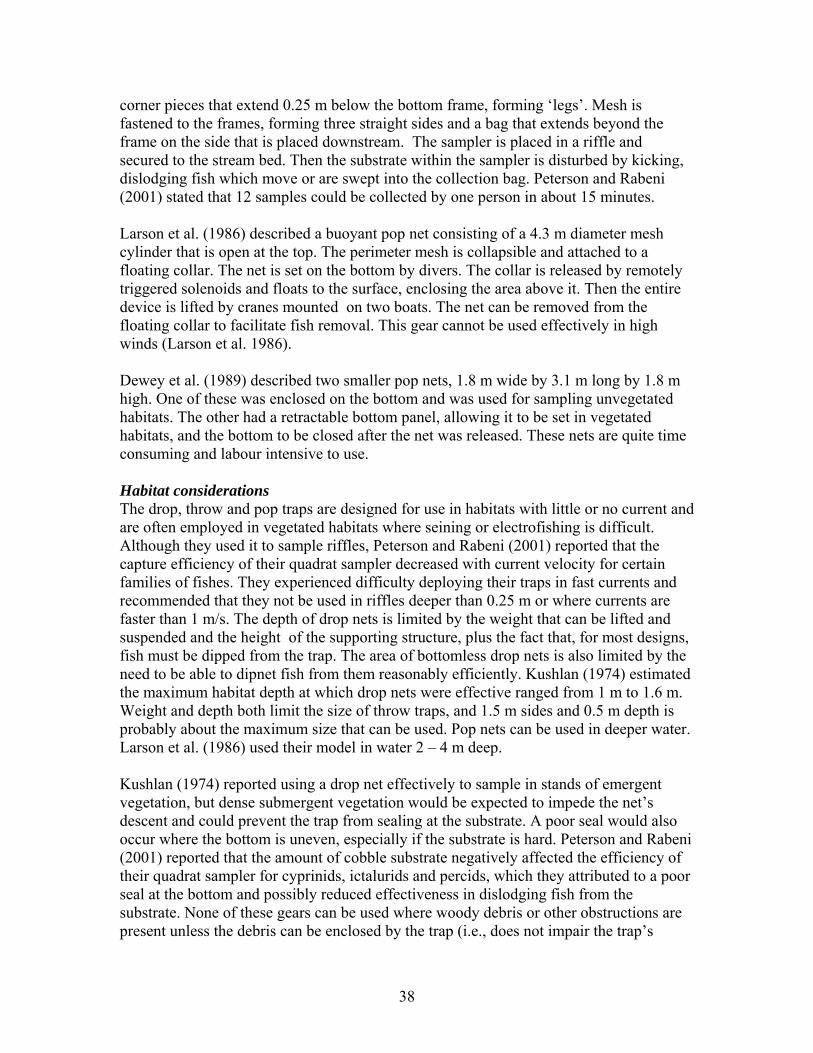
corner pieces that extend 0.25 m below the bottom frame, forming ‘legs’. Mesh is fastened to the frames, forming three straight sides and a bag that extends beyond the frame on the side that is placed downstream. The sampler is placed in a riffle and secured to the stream bed. Then the substrate within the sampler is disturbed by kicking, dislodging fish which move or are swept into the collection bag. Peterson and Rabeni (2001) stated that 12 samples could be collected by one person in about 15 minutes. Larson et al. (1986) described a buoyant pop net consisting of a 4.3 m diameter mesh cylinder that is open at the top. The perimeter mesh is collapsible and attached to a floating collar. The net is set on the bottom by divers. The collar is released by remotely triggered solenoids and floats to the surface, enclosing the area above it. Then the entire device is lifted by cranes mounted on two boats. The net can be removed from the floating collar to facilitate fish removal. This gear cannot be used effectively in high winds (Larson et al. 1986). Dewey et al. (1989) described two smaller pop nets, 1.8 m wide by 3.1 m long by 1.8 m high. One of these was enclosed on the bottom and was used for sampling unvegetated habitats. The other had a retractable bottom panel, allowing it to be set in vegetated habitats, and the bottom to be closed after the net was released. These nets are quite time consuming and labour intensive to use. Habitat considerations The drop, throw and pop traps are designed for use in habitats with little or no current and are often employed in vegetated habitats where seining or electrofishing is difficult. Although they used it to sample riffles, Peterson and Rabeni (2001) reported that the capture efficiency of their quadrat sampler decreased with current velocity for certain families of fishes. They experienced difficulty deploying their traps in fast currents and recommended that they not be used in riffles deeper than 0.25 m or where currents are faster than 1 m/s. The depth of drop nets is limited by the weight that can be lifted and suspended and the height of the supporting structure, plus the fact that, for most designs, fish must be dipped from the trap. The area of bottomless drop nets is also limited by the need to be able to dipnet fish from them reasonably efficiently. Kushlan (1974) estimated the maximum habitat depth at which drop nets were effective ranged from 1 m to 1.6 m. Weight and depth both limit the size of throw traps, and 1.5 m sides and 0.5 m depth is probably about the maximum size that can be used. Pop nets can be used in deeper water. Larson et al. (1986) used their model in water 2 – 4 m deep. Kushlan (1974) reported using a drop net effectively to sample in stands of emergent vegetation, but dense submergent vegetation would be expected to impede the net’s descent and could prevent the trap from sealing at the substrate. A poor seal would also occur where the bottom is uneven, especially if the substrate is hard. Peterson and Rabeni (2001) reported that the amount of cobble substrate negatively affected the efficiency of their quadrat sampler for cyprinids, ictalurids and percids, which they attributed to a poor seal at the bottom and possibly reduced effectiveness in dislodging fish from the substrate. None of these gears can be used where woody debris or other obstructions are present unless the debris can be enclosed by the trap (i.e., does not impair the trap’s
38
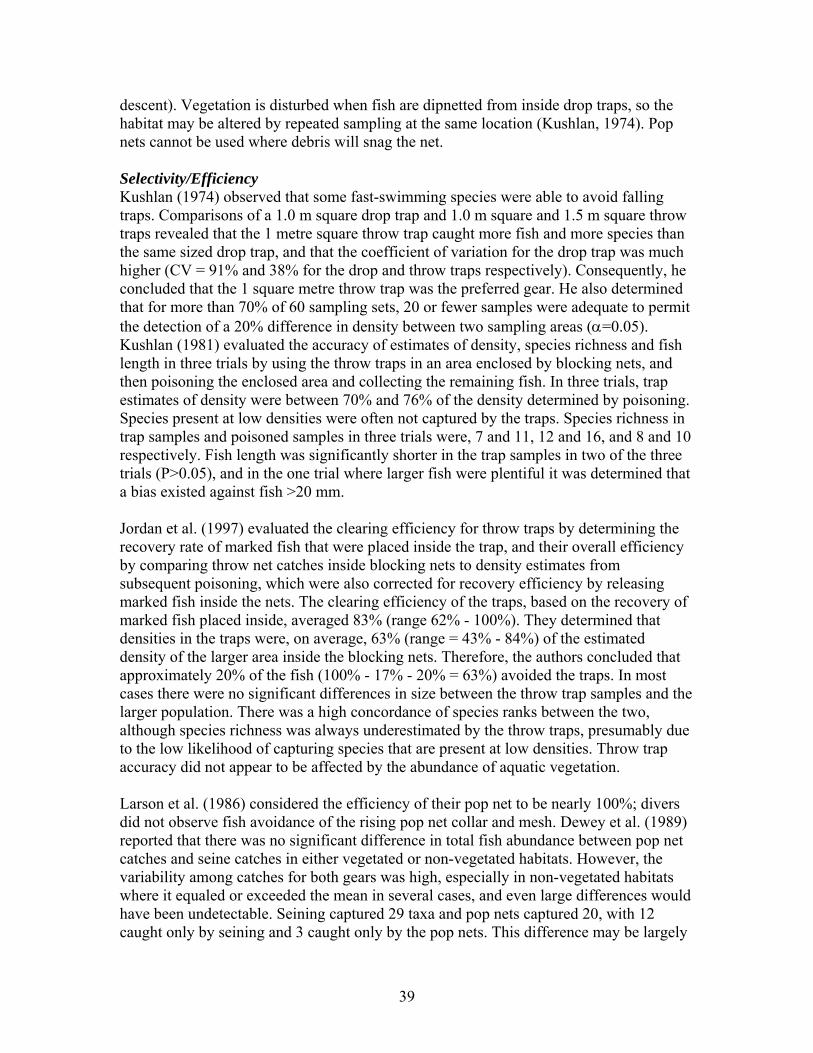
descent). Vegetation is disturbed when fish are dipnetted from inside drop traps, so the habitat may be altered by repeated sampling at the same location (Kushlan, 1974). Pop nets cannot be used where debris will snag the net. Selectivity/Efficiency Kushlan (1974) observed that some fast-swimming species were able to avoid falling traps. Comparisons of a 1.0 m square drop trap and 1.0 m square and 1.5 m square throw traps revealed that the 1 metre square throw trap caught more fish and more species than the same sized drop trap, and that the coefficient of variation for the drop trap was much higher (CV = 91% and 38% for the drop and throw traps respectively). Consequently, he concluded that the 1 square metre throw trap was the preferred gear. He also determined that for more than 70% of 60 sampling sets, 20 or fewer samples were adequate to permit the detection of a 20% difference in density between two sampling areas (α=0.05). Kushlan (1981) evaluated the accuracy of estimates of density, species richness and fish length in three trials by using the throw traps in an area enclosed by blocking nets, and then poisoning the enclosed area and collecting the remaining fish. In three trials, trap estimates of density were between 70% and 76% of the density determined by poisoning. Species present at low densities were often not captured by the traps. Species richness in trap samples and poisoned samples in three trials were, 7 and 11, 12 and 16, and 8 and 10 respectively. Fish length was significantly shorter in the trap samples in two of the three trials (P>0.05), and in the one trial where larger fish were plentiful it was determined that a bias existed against fish >20 mm. Jordan et al. (1997) evaluated the clearing efficiency for throw traps by determining the recovery rate of marked fish that were placed inside the trap, and their overall efficiency by comparing throw net catches inside blocking nets to density estimates from subsequent poisoning, which were also corrected for recovery efficiency by releasing marked fish inside the nets. The clearing efficiency of the traps, based on the recovery of marked fish placed inside, averaged 83% (range 62% - 100%). They determined that densities in the traps were, on average, 63% (range = 43% - 84%) of the estimated density of the larger area inside the blocking nets. Therefore, the authors concluded that approximately 20% of the fish (100% - 17% - 20% = 63%) avoided the traps. In most cases there were no significant differences in size between the throw trap samples and the larger population. There was a high concordance of species ranks between the two, although species richness was always underestimated by the throw traps, presumably due to the low likelihood of capturing species that are present at low densities. Throw trap accuracy did not appear to be affected by the abundance of aquatic vegetation. Larson et al. (1986) considered the efficiency of their pop net to be nearly 100%; divers did not observe fish avoidance of the rising pop net collar and mesh. Dewey et al. (1989) reported that there was no significant difference in total fish abundance between pop net catches and seine catches in either vegetated or non-vegetated habitats. However, the variability among catches for both gears was high, especially in non-vegetated habitats where it equaled or exceeded the mean in several cases, and even large differences would have been undetectable. Seining captured 29 taxa and pop nets captured 20, with 12 caught only by seining and 3 caught only by the pop nets. This difference may be largely
39

due to the much larger area sampled by seining (Dewey et al. 1989). Dewey (1992) reported that pop nets and drop nets were equally effective in sampling juvenile fishes in turbid, vegetated environments, and both were more effective than pre-positioned electrofishing arrays under those conditions. Pre-positioned electrofishing arrays caught more fish than either of the nets in clear water, where dip netters could see the fish better. Peterson and Rabeni (2001) evaluated the efficiency of the quadrat sampler by comparing density estimates based on quadrat samples to abundance estimates based on catches using an electric seine, for which efficiency had been previously determined. They found significant differences among families (Cyprinidae, Cottidae, Ictaluridae and Percidae) as well as family by temperature and family by percent cobble interactions. The sampler was most effective at capturing cyprinids (mean efficiency 84%) and sculpins (mean efficiency 80%) and least effective at capturing catfishes (mean efficiency 31%). Capture efficiency for percids was intermediate. The authors attributed the differences in efficiency to behavioural differences, including the likelihood that fishes would flee as the trap was being deployed, and differences in habitat utilization. The number of species captured increased with total area sampled (i.e. with the number of samples), and it was estimated that the sampler captured 60% of the species present when 18% of a riffle was sampled. Peterson and Rabeni (2001) found no significant length effects on efficiency, but few large fish were present. Pop traps with fixed bottoms and drop traps that are dropped onto a platform alter or cover the substrate, which could attract some species and reduce the abundance of others. The supporting posts drop traps or the shade of the suspended trap could also attract or repel some species of fish. Quantification of Effort Effort for these gears can be expressed as catch per deployment or per unit area. Fish Injury/survival Fish injury and mortality from pop and drop nets should be negligible, but can result from dip netting or net retrieval and subsequent handling. Summary These gears differ from most in that they collect ‘instantaneous’ samples from relatively small areas. They can be used to sample discrete habitats, providing information on small-scale fish/habitat associations that cannot be obtained using more traditional active or passive gears. In this regard, they are similar to pre-positioned electrofishing arrays. Ease of use varies with gear type and size. These types of gear will be most effective for sampling relatively abundant fishes, and many samples may be required to accurately determine species richness. Enclosure traps are more effective than pre-positioned electrofishing arrays where turbidity or vegetation limit visibility and dip netting success.
40
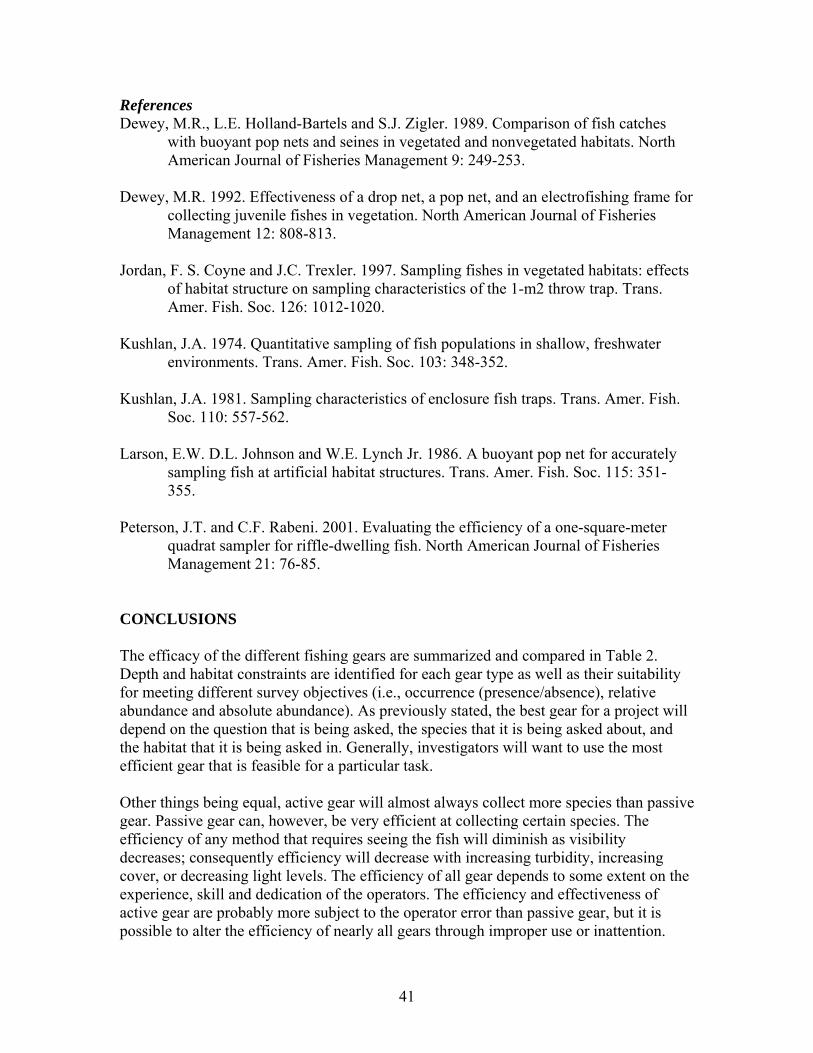
References Dewey, M.R., L.E. Holland-Bartels and S.J. Zigler. 1989. Comparison of fish catches
with buoyant pop nets and seines in vegetated and nonvegetated habitats. North American Journal of Fisheries Management 9: 249-253.
Dewey, M.R. 1992. Effectiveness of a drop net, a pop net, and an electrofishing frame for
collecting juvenile fishes in vegetation. North American Journal of Fisheries Management 12: 808-813.
Jordan, F. S. Coyne and J.C. Trexler. 1997. Sampling fishes in vegetated habitats: effects
of habitat structure on sampling characteristics of the 1-m2 throw trap. Trans. Amer. Fish. Soc. 126: 1012-1020.
Kushlan, J.A. 1974. Quantitative sampling of fish populations in shallow, freshwater
environments. Trans. Amer. Fish. Soc. 103: 348-352. Kushlan, J.A. 1981. Sampling characteristics of enclosure fish traps. Trans. Amer. Fish.
Soc. 110: 557-562. Larson, E.W. D.L. Johnson and W.E. Lynch Jr. 1986. A buoyant pop net for accurately
sampling fish at artificial habitat structures. Trans. Amer. Fish. Soc. 115: 351-355.
Peterson, J.T. and C.F. Rabeni. 2001. Evaluating the efficiency of a one-square-meter
quadrat sampler for riffle-dwelling fish. North American Journal of Fisheries Management 21: 76-85.
CONCLUSIONS The efficacy of the different fishing gears are summarized and compared in Table 2. Depth and habitat constraints are identified for each gear type as well as their suitability for meeting different survey objectives (i.e., occurrence (presence/absence), relative abundance and absolute abundance). As previously stated, the best gear for a project will depend on the question that is being asked, the species that it is being asked about, and the habitat that it is being asked in. Generally, investigators will want to use the most efficient gear that is feasible for a particular task. Other things being equal, active gear will almost always collect more species than passive gear. Passive gear can, however, be very efficient at collecting certain species. The efficiency of any method that requires seeing the fish will diminish as visibility decreases; consequently efficiency will decrease with increasing turbidity, increasing cover, or decreasing light levels. The efficiency of all gear depends to some extent on the experience, skill and dedication of the operators. The efficiency and effectiveness of active gear are probably more subject to the operator error than passive gear, but it is possible to alter the efficiency of nearly all gears through improper use or inattention.
41
In clear, wadeable streams, electrofishing is likely to be capable of capturing the widest variety of species over the widest range of habitat conditions (substrate, current velocity, vegetation, woody debris, undercut banks, etc.). Where conditions are favourable (fine substrate, few obstructions), however, seines can be very efficient, particularly for non-benthic species. The spatial scale at which the habitat is sampled must also be appropriate. If you want to sample specific habitats, then the gear must be capable of sampling at the scale over which the habitat varies. Investigators must realize the limitations of gear with respect to selectivity and efficiency and take these factors into consideration when selecting a gear. Gears collect samples in order to estimate the true value of something of interest, such as fish density. Accuracy is the degree of conformity of the measured value (e.g., fish density) with the true value, and is determined by precision and bias. Precision is the amount of variability in repeated measures and is often expressed as standard deviation. Where multiple samples are collected, the precision of an estimate is readily determined. Precision can be increased by increasing the number of samples collected, although the inherent variability among samples, and practical considerations limiting sampling effort, may mean that the precision of some sampling programs must remain low. If, however, sufficient samples cannot be collected to detect important differences except occasionally, then the sampling program is of little use. Bias is a systematic or non-random error in measurement that causes the estimate to differ from the true value. Bias is more insidious than lack of precision because precision can be assessed through repeated sampling but bias can only be detected with knowledge of the true value that is being estimated. All gears are biased to some extent; as discussed, their efficiency varies among species, with size, among habitats and even among successive uses (i.e. multiple pass electrofishing). Investigators are continually striving to develop sampling methods that reduce or correct for bias, but it is virtually impossible to eliminate. When an investigation involves a comparison, bias is particularly critical. If gear efficiency varies with some variable (e.g. a habitat characteristic, species or individual size), be it one of particular interest or not, then sampling bias can confound results by obscuring real differences or creating perceived differences. Failure to recognize bias can lead to what Anderson et al. (1998) term ”highly precise, wrong answers”. It is therefore essential that investigators recognize, and clearly state, the limitations of their sampling methods. The amount of preparation and field effort required to conduct a survey is also gear-dependent (Table 3). Electrofishing is an effective method for capturing fish in many shallow-water habitats, but it requires extensive training to ensure a safe operation for the field crew. To ensure human safety while working around water, field crews should include at least two people regardless of the gear type, and as many as four people may be needed for boat electrofishing.
42
Animal care is an important factor when selecting gear (Table 3). The Canadian Council for Animal Care requires that work with living fishes be carried out in a humane manner (Canadian Council on Animal Care 2005); animal care protocols must be submitted and approved by a jurisdictional government or university animal care committee before the survey is initiated. In addition, the federal Species at Risk Act requires that special permits are obtained prior to conducting field surveys in areas inhabited by species listed and protected by the Species at Risk Act. Refer to the SARA public registry for more information on the Species at Risk Act at www.SARAregistry.gc.ca. REFERENCES Anderson, D.R., K.P. Burnham and G.C. White. 1998. Comparison of Akaike
information criterion and consistent Akaike information criterion for model selection and statistical inference from capture-recapture studies. Journal of Applied Statistics 25: 263-282.
Canadian Council for Animal Care. 2005. CCAC guidelines on: the care and use of fish
in research, teaching and testing. Draft report. von Brandt, A. 1984. Fish Catching Methods of the World. Fishing News Books Ltd.
Farnham Surrey England, 418 p. ACKNOWLEDGEMENT This project was funded by Fisheries and Oceans Canada (Environmental Science Strategic Research Fund). C. Brousseau aided with the final formatting and editing of this document.
43

Table 1. Seine efficiencies for seven species in shallow nearshore areas in Sparkling Lake, Wisconsin. Means followed by the same letter are not significantly different (P<0.05), as determined by a Newman-Keuls multiple comparison test. From Lyons (1986). Capture efficiency Species
Number of estimates
Total length range (mm)
mean
95% confidence interval
Mimic shiner 6 35-55 0.93z 0.78-1.00 Yellow perch 7 110-145 0.57zy 0.19-0.91 Bluntnose minnow 16 35-85 0.56zy 0.39-0.72 Logperch 6 80-105 0.47zy 0.18-0.77 Iowa darter 12 35-65 0.27 y 0.14-0.43 Rock bass 16 35-150 0.26 y 0.15-0.39 Johnny darter 16 40-65 0.24 y 0.16-0.34
44
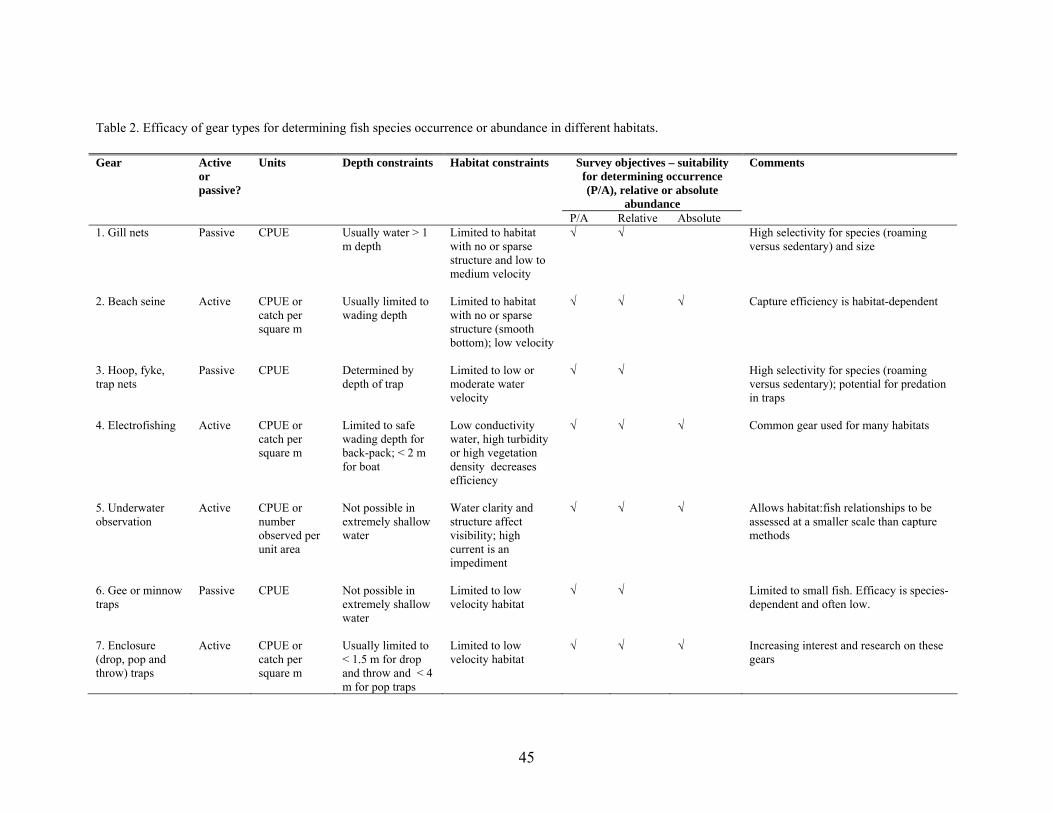
Table 2. Efficacy of gear types for determining fish species occurrence or abundance in different habitats. Gear Active
or passive?
Units Depth constraints Habitat constraints Survey objectives – suitability for determining occurrence (P/A), relative or absolute
abundance
Comments
P/A Relative Absolute 1. Gill nets Passive CPUE Usually water > 1
m depth Limited to habitat with no or sparse structure and low to medium velocity
√ √ High selectivity for species (roaming versus sedentary) and size
2. Beach seine Active CPUE or
catch per square m
Usually limited to wading depth
Limited to habitat with no or sparse structure (smooth bottom); low velocity
√ √ √ Capture efficiency is habitat-dependent
3. Hoop, fyke, trap nets
Passive CPUE Determined by depth of trap
Limited to low or moderate water velocity
√ √ High selectivity for species (roaming versus sedentary); potential for predation in traps
4. Electrofishing Active CPUE or
catch per square m
Limited to safe wading depth for back-pack; < 2 m for boat
Low conductivity water, high turbidity or high vegetation density decreases efficiency
√ √ √ Common gear used for many habitats
5. Underwater observation
Active CPUE or number observed per unit area
Not possible in extremely shallow water
Water clarity and structure affect visibility; high current is an impediment
√ √ √ Allows habitat:fish relationships to be assessed at a smaller scale than capture methods
6. Gee or minnow traps
Passive CPUE Not possible in extremely shallow water
Limited to low velocity habitat
√ √ Limited to small fish. Efficacy is species-dependent and often low.
7. Enclosure (drop, pop and throw) traps
Active CPUE or catch per square m
Usually limited to < 1.5 m for drop and throw and < 4 m for pop traps
Limited to low velocity habitat
√ √ √ Increasing interest and research on these gears
45

Table 3. Minimum crew size, training requirements, and vulnerability of fishes to injury or mortality of different gear types.
Gear Minimum
Crew size Training needed
Mortality/injury to fish
1. Gill nets 2 Moderate Usually high 2. Beach seine 2 or 3 Moderate Low to high, depending on species 3. Hoop, fyke, trap nets 2 Moderate Low, unless rapid change in dissolved O2 or water temperature
during holding 4. Electrofishing 2 to 4 High Injury rate low to high, depending on electrofisher settings,
species and fish size 5. Underwater observation
3 for safety High Nil
6. Gee or minnow traps 2 Low Negligible 7. Enclosure (drop, pop and throw) traps
2 Low Negligible
46

Figure 1. Illustration of a typical gill net set. Fastening the buoy to the opposite (fluke) end of the anchor from the net makes it easier to free an anchor that has become wedged under logs or boulders.
Figure 2. Gill nets are usually retrieved into the wind, which allows tension against the in-place anchor to be maintained so that the net is not dragged across the bottom, which can result in it becoming snagged on logs or other objects. Photo by George Coker.
47

Figure 3. Beach seining can be conducted by a crew of two, but having a third person to free the net if it becomes snagged is often helpful. Photo by Cam Portt.
Figure 4. Aerial photograph of a small mesh trap net, with key features labelled. Photo by Pete Cott.
48

Figure 5. Backpack electrofishers are designed so that the anode (yellow), to which the fish are attracted, is held by the operator, and the cathode (pink) trails behind. Photo by Cam Portt.
Figure 6. Boat electrofishing. Photo by Lydon Kivi.
49
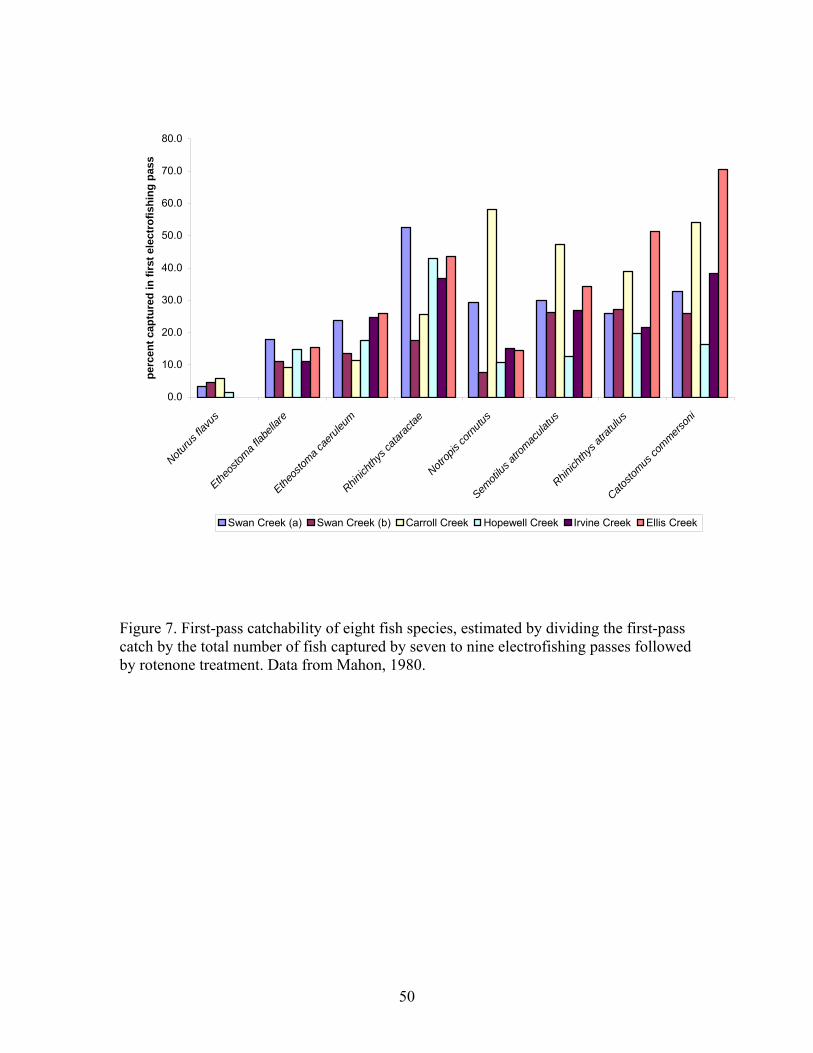
0.0
10.0
20.0
30.0
40.0
50.0
60.0
70.0
80.0
Noturus
flavu
s
Etheos
toma f
labell
are
Etheos
toma c
aerul
eum
Rhinich
thys c
atarac
tae
Notrop
is co
rnutus
Semoti
lus at
romac
ulatus
Rhinich
thys a
tratul
us
Catosto
mus co
mmerson
i
perc
ent c
aptu
red
in fi
rst e
lect
rofis
hing
pas
s
Swan Creek (a) Swan Creek (b) Carroll Creek Hopewell Creek Irvine Creek Ellis Creek
Figure 7. First-pass catchability of eight fish species, estimated by dividing the first-pass catch by the total number of fish captured by seven to nine electrofishing passes followed by rotenone treatment. Data from Mahon, 1980.
50
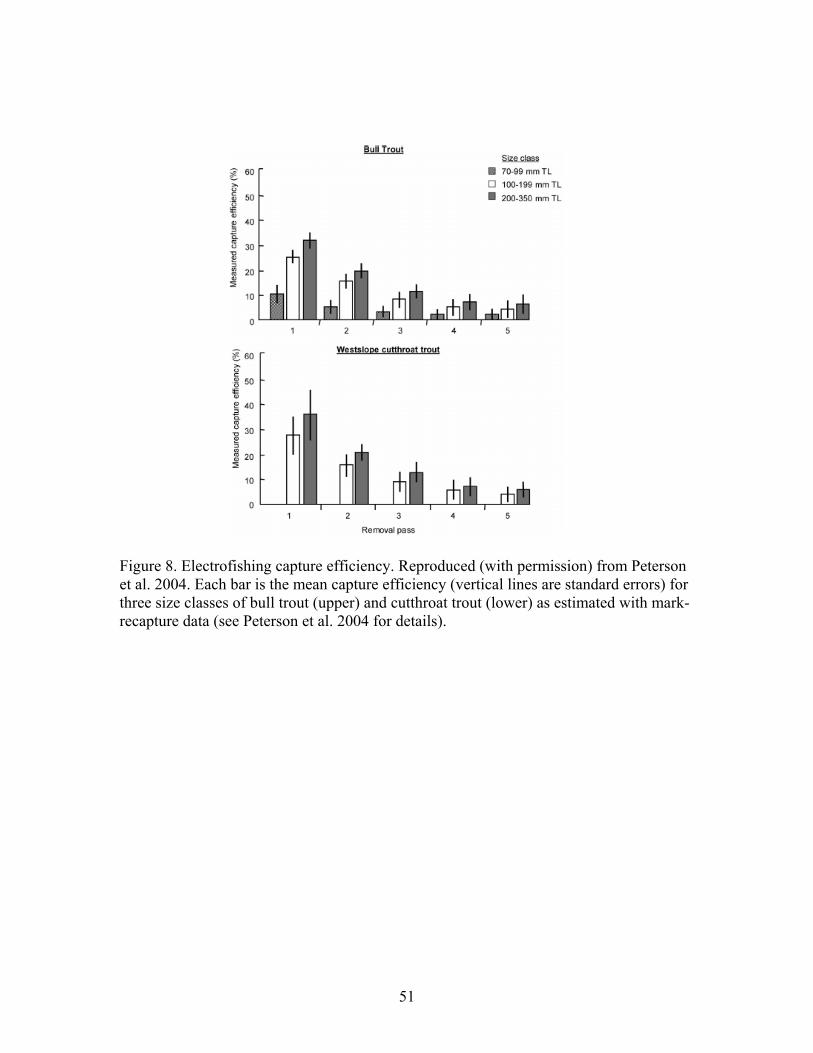
Figure 8. Electrofishing capture efficiency. Reproduced (with permission) from Peterson et al. 2004. Each bar is the mean capture efficiency (vertical lines are standard errors) for three size classes of bull trout (upper) and cutthroat trout (lower) as estimated with mark-recapture data (see Peterson et al. 2004 for details).
51