
Ecological Sampling Design - Usfws National...
24
1 Ecological Sampling Design Overview of designs
Transcript of Ecological Sampling Design - Usfws National...

1
Ecological Sampling Design
Overview of designs

2
Objective
Describe some commonly used sampling designs
Take Home: 1) a poor design can lead to poor data 2) the mean and variance calculat ions ( i.e., est imate and confidence intervals) depend upon the sampling design

3
An Eight Step Approach to Design
1. Define Study Objectives/Hypotheses
2. Specify Assumptions and Constraints (e.g., setting limits on study scope as the study area boundary)
3. Specify parameters to be estimated (the fewer the better- no need to measure everything!)
4. Identify Sources of Variance in Laboratory and Field

4
An Eight Step Approach to Design
5. Identify Limits on Acceptability or how good to we need to be? (data precision [90% confidence intervals ± 20% of estimate], power)
6. Determine Data Collection Process (included in protocol)
7. Develop Most Efficient Design- work toward unbiased estimate with high precision or certainty (included in protocol)
8. Evaluate Ability to Achieve Objectives (e.g., pilot study, power analysis, adequacy of sample size)

5
Criteria for Choosing a Sampling Design
Objectives of study Cost-effectiveness of alternative designs Patterns of ecological or environmental
response and variability Spatial and temporal considerations
Practical considerations (site access, level of public use/security)

6
Methods for Selecting Study Sites or Sampling Locations
Haphazard Judgment sampling Probabilistic sampling

7
Haphazard Sampling
Sites and times selected without scientific rational (any sites will work)
May work if units are homogeneous Potential for bias
Units selected for convenience Variability does often change over populations or
sub-populations Example: Powell River mussel survey

8
Judgment Sampling Subjective selection of sites by an individual,
therefore a potential for bias exists May be useful if all the units are visible and one can
select a “representative” sample Requires extensive knowledge of problem and
sampling area May result in good estimate with unknown variance
- atypical members cannot be used to make inference about a population
May be useful for finding unique attributes Very useful in pilot studies

9
Probabilistic Sampling
Useful when bias and variance are issues Useful when populations are heterogeneous Can be adapted to complex situations May result in unrealistic sampling schemes
sites which are inaccessible streams on maps but don’t exist
Variance estimates may be complex Often require prior information for good design

10
(Some) Probabilistic Sampling Methods Simple random sampling Stratified random sampling Systematic sampling

11 Random sampling required the use of a random number table.
These techniques can be applied to selecting study sites in a stream

12
These techniques also can be used to locate spots where actual sampling takes place
within a study site.
But first, how are study site boundaries determined?
13
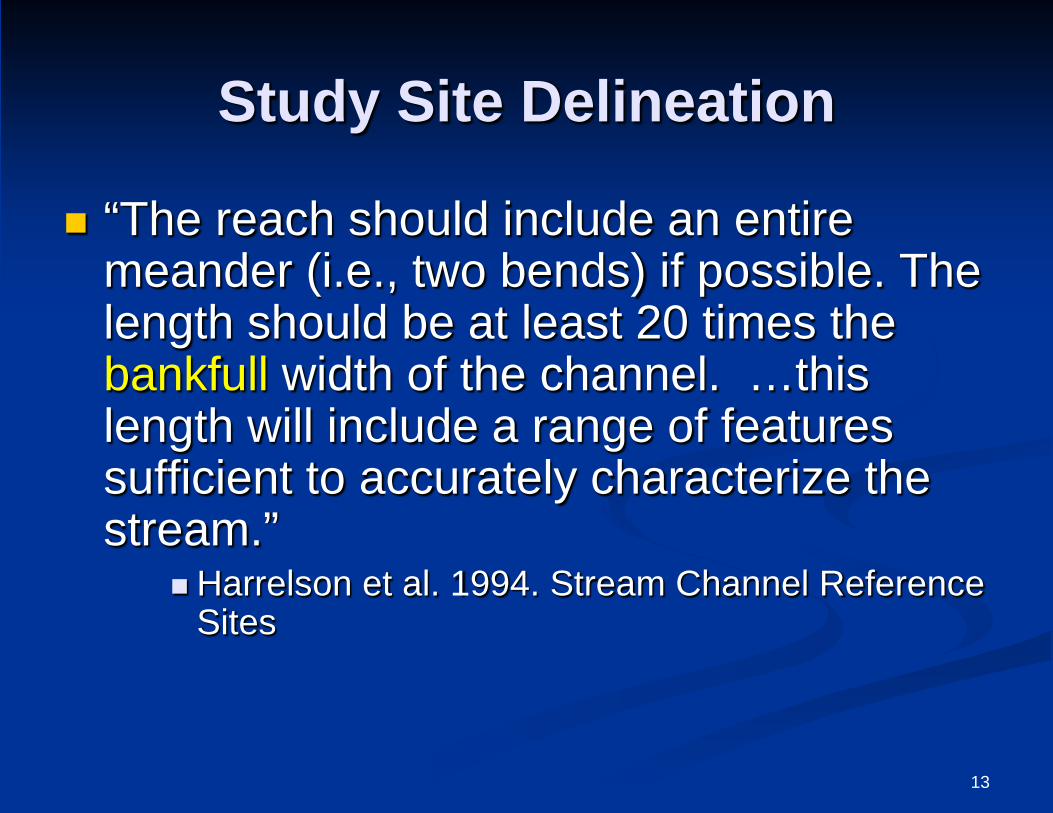
Study Site Delineation
“The reach should include an entire meander (i.e., two bends) if possible. The length should be at least 20 times the bankfull width of the channel. …this length will include a range of features sufficient to accurately characterize the stream.”
Harrelson et al. 1994. Stream Channel Reference Sites

14
Study Site Delineation (continued)
“…the reach length is determined by multiplying the mean wetted channel width by 20. The width is multiplied by 20 because, in meandering streams, 20 times the channel width typically encompasses at least on complete meander wavelength. This ensures that all habitat types are represented in the reach”
Fitzpatrick et al. 1998. Revised Methods for Characterizing Stream Habitat in the NAWQA Program. USGS.

15
Study Site Delineation (continued)
In addition- “the reach should include at least two
examples each of two types of GCU’s. Only those GCU’s that are greater than 50 percent of the channel width are considered”
And Minimum and maximum reach lengths for
wadeable streams are 150 and 300 m, respectively
Fitzpatrick et al. 1998. Revised Methods for Characterizing Stream Habitat in the NAWQA Program. USGS.

16
Study Site Delineation (continued)
Sites were approximately 35 – 40 mean (wetted) stream widths (MSW)in length
Began and ended sites at the downstream end of riffles, if present.
The mean stream width was based on 15 – 20 measurements of wetted stream width from throughout the station.
Simonson, T.D. et al. 1994. Quantifying fish habitat in
streams: Transect spacing, sample size, and a proposed framework. N.A. Journal of Fisheries Management 14:607-615.

17
Sampling Within a Study Site
Now that a study site has been delineated, where do you take observations (“samples”).

18
Simple Random Sampling Simple design Requires
homogeneous population
Other designs are better when there are trends or groups
Simple random sampling
x
x
x x
x
x
x x
19
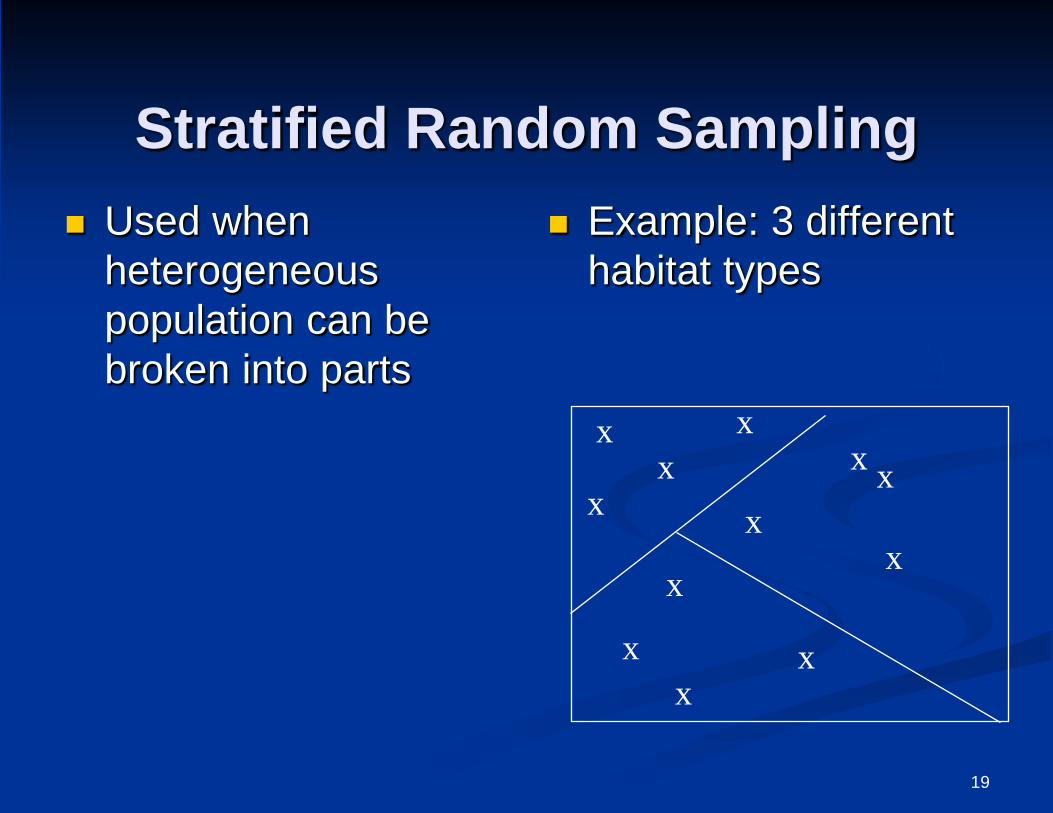
Stratified Random Sampling Used when
heterogeneous population can be broken into parts
Example: 3 different habitat types
x
x x
x
x
x
x x
x
x x
x

20
Systematic Sampling Useful for estimating
trends in time or patterns in space
Provide good spatial coverage
Randomness from selection of starting point
Systematic sampling
x x x
x x x
x x x
x x x

21
Systematic Sampling
• Can be combined with random sampling
Random sampling within blocks
x x x
x x x
x x x
x x x
22
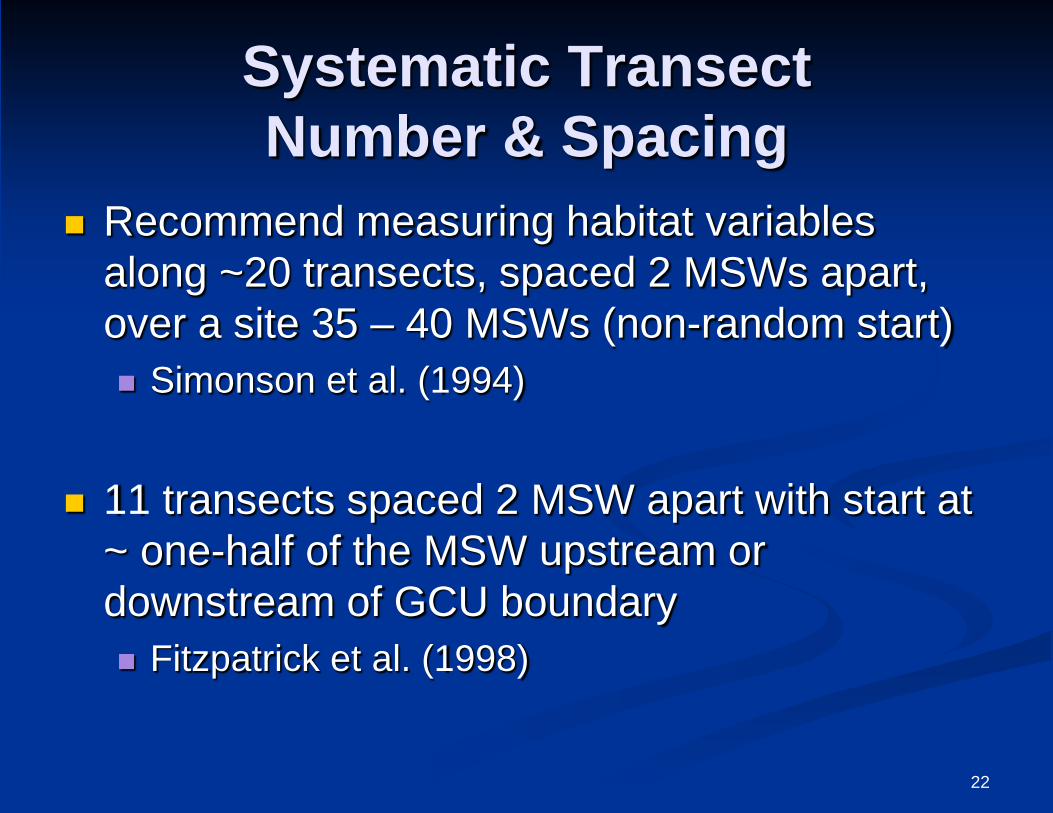
Systematic Transect Number & Spacing
Recommend measuring habitat variables along ~20 transects, spaced 2 MSWs apart, over a site 35 – 40 MSWs (non-random start) Simonson et al. (1994)
11 transects spaced 2 MSW apart with start at
~ one-half of the MSW upstream or downstream of GCU boundary Fitzpatrick et al. (1998)

23
Specialized Methods for Ecological Sampling
Strip transect (Quadrat sampling) –we will use in bank condition sampling
Line transect sampling –we will use for measuring velocities and depths
Line intercept sampling –we will use in estimating instream cover

24
References Gilbert, R.O. Statistical Methods for
Environmental Pollution Monitoring. van Nostrand Reinhold
Seber, G.A.F. 1982 The estimation of animal abundance. MacMillan Publishing Co. New York
Schaeffer, R.L., W. Mendenhall and L. Ott 1990 Elementary Survey Sampling, PWS Kent Publishing Co. Boston.
Thompson S.K. 2002. Sampling. John Wiley and Sons, New York


