A Real-time Analysis Environment for a Wireless BMI...
6
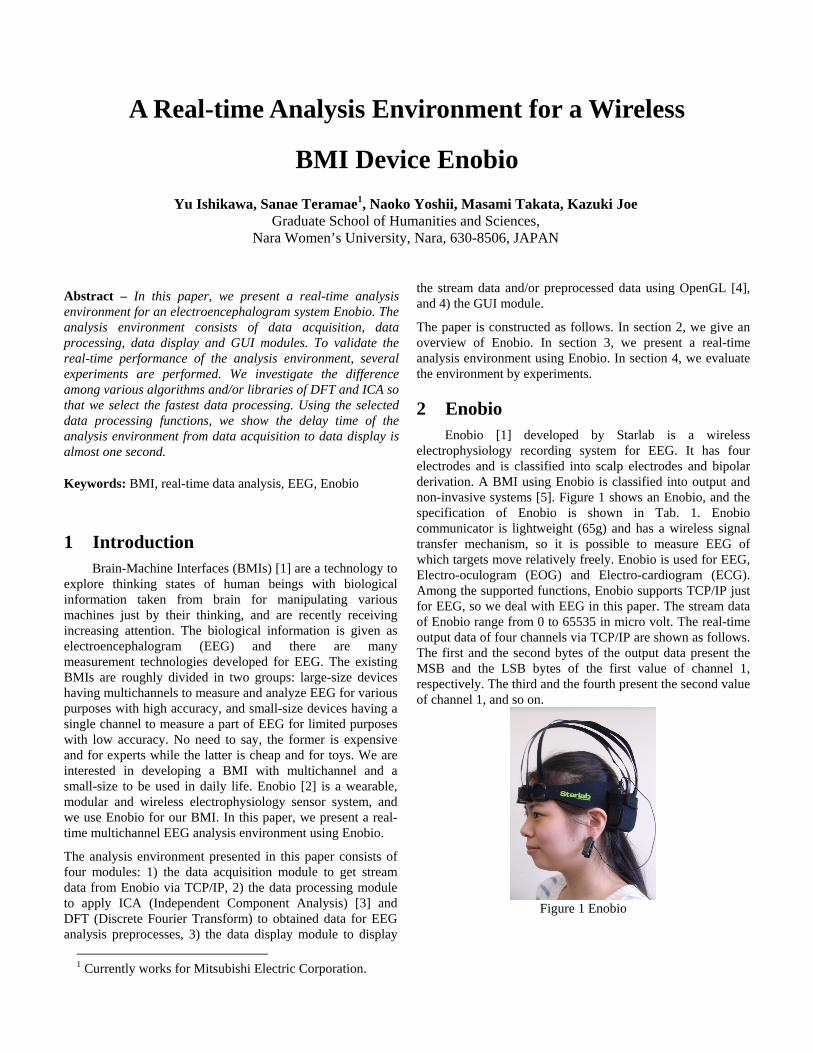
A Real-time Analysis Environment for a Wireless BMI Device Enobio Yu Ishikawa, Sanae Teramae 1 , Naoko Yoshii, Masami Takata, Kazuki Joe Graduate School of Humanities and Sciences, Nara Women’s University, Nara, 630-8506, JAPAN Abstract – In this paper, we present a real-time analysis environment for an electroencephalogram system Enobio. The analysis environment consists of data acquisition, data processing, data display and GUI modules. To validate the real-time performance of the analysis environment, several experiments are performed. We investigate the difference among various algorithms and/or libraries of DFT and ICA so that we select the fastest data processing. Using the selected data processing functions, we show the delay time of the analysis environment from data acquisition to data display is almost one second. 1 Currently works for Mitsubishi Electric Corporation. Keywords: BMI, real-time data analysis, EEG, Enobio 1 Introduction Brain-Machine Interfaces (BMIs) [1] are a technology to explore thinking states of human beings with biological information taken from brain for manipulating various machines just by their thinking, and are recently receiving increasing attention. The biological information is given as electroencephalogram (EEG) and there are many measurement technologies developed for EEG. The existing BMIs are roughly divided in two groups: large-size devices having multichannels to measure and analyze EEG for various purposes with high accuracy, and small-size devices having a single channel to measure a part of EEG for limited purposes with low accuracy. No need to say, the former is expensive and for experts while the latter is cheap and for toys. We are interested in developing a BMI with multichannel and a small-size to be used in daily life. Enobio [2] is a wearable, modular and wireless electrophysiology sensor system, and we use Enobio for our BMI. In this paper, we present a real- time multichannel EEG analysis environment using Enobio. The analysis environment presented in this paper consists of four modules: 1) the data acquisition module to get stream data from Enobio via TCP/IP, 2) the data processing module to apply ICA (Independent Component Analysis) [3] and DFT (Discrete Fourier Transform) to obtained data for EEG analysis preprocesses, 3) the data display module to display the stream data and/or preprocessed data using OpenGL [4], and 4) the GUI module. The paper is constructed as follows. In section 2, we give an overview of Enobio. In section 3, we present a real-time analysis environment using Enobio. In section 4, we evaluate the environment by experiments. 2 Enobio Enobio [1] developed by Starlab is a wireless electrophysiology recording system for EEG. It has four electrodes and is classified into scalp electrodes and bipolar derivation. A BMI using Enobio is classified into output and non-invasive systems [5]. Figure 1 shows an Enobio, and the specification of Enobio is shown in Tab. 1. Enobio communicator is lightweight (65g) and has a wireless signal transfer mechanism, so it is possible to measure EEG of which targets move relatively freely. Enobio is used for EEG, Electro-oculogram (EOG) and Electro-cardiogram (ECG). Among the supported functions, Enobio supports TCP/IP just for EEG, so we deal with EEG in this paper. The stream data of Enobio range from 0 to 65535 in micro volt. The real-time output data of four channels via TCP/IP are shown as follows. The first and the second bytes of the output data present the MSB and the LSB bytes of the first value of channel 1, respectively. The third and the fourth present the second value of channel 1, and so on. Figure 1 Enobio
Transcript of A Real-time Analysis Environment for a Wireless BMI...
A Real-time Analysis Environment for a Wireless
BMI Device Enobio
Yu Ishikawa, Sanae Teramae1, Naoko Yoshii, Masami Takata, Kazuki Joe Graduate School of Humanities and Sciences,
Nara Women’s University, Nara, 630-8506, JAPAN
Abstract – In this paper, we present a real-time analysis environment for an electroencephalogram system Enobio. The analysis environment consists of data acquisition, data processing, data display and GUI modules. To validate the real-time performance of the analysis environment, several experiments are performed. We investigate the difference among various algorithms and/or libraries of DFT and ICA so that we select the fastest data processing. Using the selected data processing functions, we show the delay time of the analysis environment from data acquisition to data display is almost one second.
1 Currently works for Mitsubishi Electric Corporation.
Keywords: BMI, real-time data analysis, EEG, Enobio
1 Introduction Brain-Machine Interfaces (BMIs) [1] are a technology to
explore thinking states of human beings with biological information taken from brain for manipulating various machines just by their thinking, and are recently receiving increasing attention. The biological information is given as electroencephalogram (EEG) and there are many measurement technologies developed for EEG. The existing BMIs are roughly divided in two groups: large-size devices having multichannels to measure and analyze EEG for various purposes with high accuracy, and small-size devices having a single channel to measure a part of EEG for limited purposes with low accuracy. No need to say, the former is expensive and for experts while the latter is cheap and for toys. We are interested in developing a BMI with multichannel and a small-size to be used in daily life. Enobio [2] is a wearable, modular and wireless electrophysiology sensor system, and we use Enobio for our BMI. In this paper, we present a real-time multichannel EEG analysis environment using Enobio.
The analysis environment presented in this paper consists of four modules: 1) the data acquisition module to get stream data from Enobio via TCP/IP, 2) the data processing module to apply ICA (Independent Component Analysis) [3] and DFT (Discrete Fourier Transform) to obtained data for EEG analysis preprocesses, 3) the data display module to display
the stream data and/or preprocessed data using OpenGL [4], and 4) the GUI module.
The paper is constructed as follows. In section 2, we give an overview of Enobio. In section 3, we present a real-time analysis environment using Enobio. In section 4, we evaluate the environment by experiments.
2 Enobio Enobio [1] developed by Starlab is a wireless
electrophysiology recording system for EEG. It has four electrodes and is classified into scalp electrodes and bipolar derivation. A BMI using Enobio is classified into output and non-invasive systems [5]. Figure 1 shows an Enobio, and the specification of Enobio is shown in Tab. 1. Enobio communicator is lightweight (65g) and has a wireless signal transfer mechanism, so it is possible to measure EEG of which targets move relatively freely. Enobio is used for EEG, Electro-oculogram (EOG) and Electro-cardiogram (ECG). Among the supported functions, Enobio supports TCP/IP just for EEG, so we deal with EEG in this paper. The stream data of Enobio range from 0 to 65535 in micro volt. The real-time output data of four channels via TCP/IP are shown as follows. The first and the second bytes of the output data present the MSB and the LSB bytes of the first value of channel 1, respectively. The third and the fourth present the second value of channel 1, and so on.
Figure 1 Enobio

Table 1 Specification of Enobio
Number of Channels 4 Input EEG, EOG, ECG
Digital streaming over TCP/IP Output Raw data files – ASCII output and EDF compliant Sampling 16 bit sampling at 250 S/s
Windows XP/Vista(32bits) or MAX OS X (Intel) 1GB RAM or more JAVA 1.6 RE for Windows and JAVA 1.5 RE for MAC OS X USB2.0 port
System Requirements
CPU Pentium D or better Dimensions 660x550x250 mm
Weight 65 g
Figure 3 Processing flow between server and client by
winsock
3 Real-time Enobio Analysis Environment In this paper, we use a small-size, lightweight and multichannel EEG measurement system Enobio. Although Enobio provides attachment applications, it is insufficient for our target BMI development to observe and analyze the Enobio stream data. Thus, we present a real-time analysis environment for multichannel EEG Enobio to take advantage of its TCP/IP output function. We use Windows XP as the development environment.
Figure 2 Enobio’s optional electrodes
Since each channel data by clock consists of two bytes, the following calculation is required to get the actual electric potential.
3.1 The data acquisition module Enobio supports streaming output via TCP/IP for
measured data. We use winsock for real-time data reception functions via TCP/IP in our developing system. Figure 3 shows the processing flow between Enobio at server-side and the receiving program at client-side. First, the receiving program creates a socket by a socket function. Next, a TCP/IP address is specified for the connection by a connect function. The target address is obtained by the pre-defined number by an attachment application of Enobio. Then, the receiving program receives the data by the recv function with the necessary number of bytes and the storage location.
1st value of channel 1 = 256×byte1+byte2 1st value of channel 2 = 256×byte3+byte4 1st value of channel 3 = 256×byte5+byte6 1st value of channel 4 = 256×byte7+byte8
The drawback of Enobio was its limitation of sensor position: just four positions around frontal cortex. Since our BMI system is to be used for exploring EEGs in daily life to support the person wearing the BMI system, we needed more flexibility about the kind of EEG data, namely sensor positions. Recently Starlab announced that they provide optional electrodes, which can be located with a special hat. The Enobio user can replace the existing four electrodes with the optional electrodes to get other EEGs. Figure 2 shows the optional electrodes.
3.2 The data processing module In this subsection, we expound some signal processing
methods applied to the obtained data in the data processing module. In 3.2.1, we describe ICA (Independent Component Analysis) to separate independent components from the stream data and to remove noises. In 3.2.2, we describe DFT for the frequency distribution analysis of the stream data.
3.2.1 ICA We aim to develop a BMI used in daily life, so we do
not suppose any BMI measurement under special conditions
such as shield rooms to block electromagnetic waves from various peripheral devices and limitation of targets activities where they are forced to keep quiet or close eyes. Therefore, the stream data out of Enobio may include noises from peripheral power supplies and from eye movements or blinks of the targets. The received signals from an electrode can be mixed with other independent EEGs from multiple locations in a brain caused by electrodes arrangement. So we apply ICA to the stream data to remove noises and extract independent components as a pre-process for our BMI. In this paper, we adopt FastICA [6], which is known to have the fast convergence ability, as an ICA algorithm. We use IT++ library that includes the FastICA implemented in C++. The FastICA class library in IT++ library provides separate operations by selecting the type of orthogonalization or nonlinear function methods with an updating rule for the reconstruction matrix W.
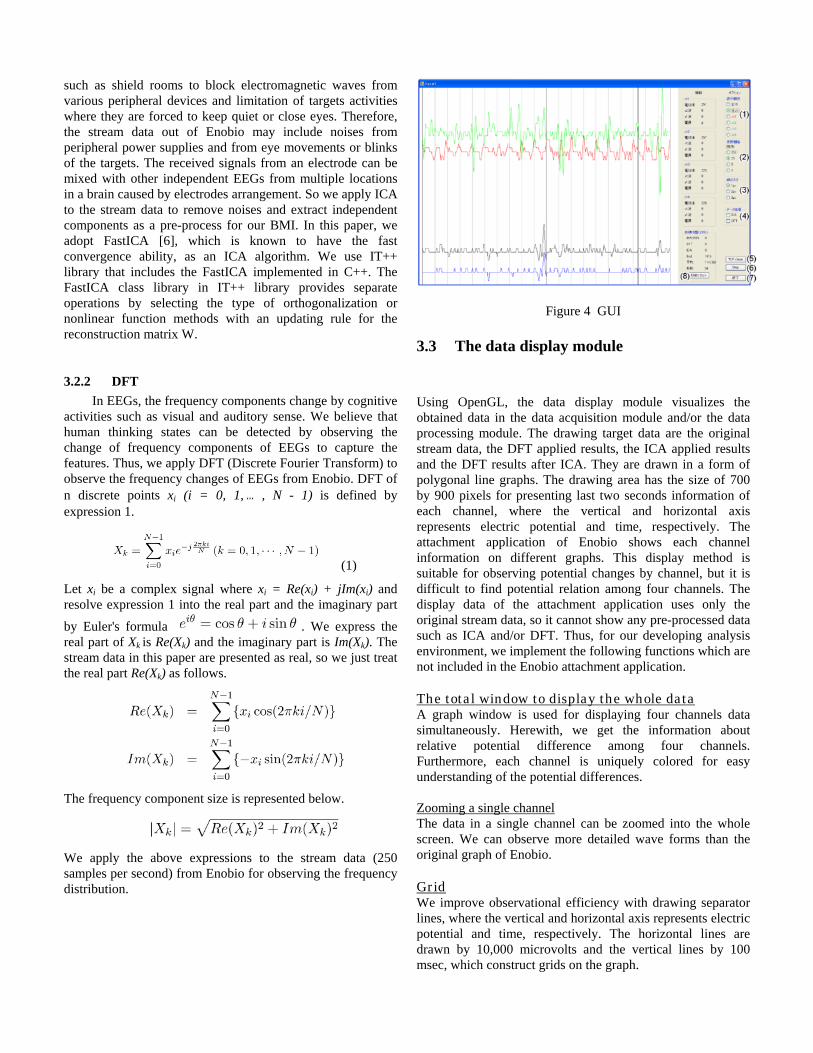
Figure 4 GUI
3.3 The data display module
3.2.2 DFT In EEGs, the frequency components change by cognitive
activities such as visual and auditory sense. We believe that human thinking states can be detected by observing the change of frequency components of EEGs to capture the features. Thus, we apply DFT (Discrete Fourier Transform) to observe the frequency changes of EEGs from Enobio. DFT of n discrete points xi (i = 0, 1,… , N - 1) is defined by expression 1.
Using OpenGL, the data display module visualizes the obtained data in the data acquisition module and/or the data processing module. The drawing target data are the original stream data, the DFT applied results, the ICA applied results and the DFT results after ICA. They are drawn in a form of polygonal line graphs. The drawing area has the size of 700 by 900 pixels for presenting last two seconds information of each channel, where the vertical and horizontal axis represents electric potential and time, respectively. The attachment application of Enobio shows each channel information on different graphs. This display method is suitable for observing potential changes by channel, but it is difficult to find potential relation among four channels. The display data of the attachment application uses only the original stream data, so it cannot show any pre-processed data such as ICA and/or DFT. Thus, for our developing analysis environment, we implement the following functions which are not included in the Enobio attachment application.
(1)
Let xi be a complex signal where xi = Re(xi) + jIm(xi) and resolve expression 1 into the real part and the imaginary part
by Euler's formula . We express the real part of Xk is Re(Xk) and the imaginary part is Im(Xk). The stream data in this paper are presented as real, so we just treat the real part Re(Xk) as follows.
The total window to display the whole data
A graph window is used for displaying four channels data simultaneously. Herewith, we get the information about relative potential difference among four channels. Furthermore, each channel is uniquely colored for easy understanding of the potential differences. The frequency component size is represented below. Zooming a single channel
The data in a single channel can be zoomed into the whole screen. We can observe more detailed wave forms than the original graph of Enobio. We apply the above expressions to the stream data (250
samples per second) from Enobio for observing the frequency distribution.
Grid We improve observational efficiency with drawing separator lines, where the vertical and horizontal axis represents electric potential and time, respectively. The horizontal lines are drawn by 10,000 microvolts and the vertical lines by 100 msec, which construct grids on the graph.

Line width module. Button 3 changes the line width of wave forms. Button 4 controls the pre-processes for the stream data. The button 4 is used for selecting "no pre-process", "just DFT", "just ICA", and "DFT right after ICA". Button 5 gives TCP/IP client services. The button is the toggle for "TCP open" and "TCP close" which creates a socket in the data acquisition module and closes the process, respectively. Button 6 is used for starting or stopping the acquisition of the stream data. By button 7, the program is terminated. Button 8 resets the time counter. The time counter increases by one each time when 250 data are drawn, and is used for time keeping by second.
Table 2 Average processing time in the data processing module
ICA
DEDL SYMM
POW3 TANH GAUSS SKEW POW3 TANH GAUSS SKEW
DFT
data 1 21 2103 3220 3435 166 19 14 12 15
data 2 2931 14276 3500 21003 8 18 24 20 16
data 3 6656 6192 2709 105375 15 29 30 11 15
The line width of the grids is changeable.We get detailed wave forms when the line width is fine while it is easy to observe enhanced wave forms when the line width is thick. Drawing intervals We can change the interval between drawing refreshment. Compared to the data receiving time, drawing a wave form needs longer time. To keep real-time performance in observing wave forms, we reduce the number of drawing refreshments per second.
4 Experiments 3.4 GUI
We develop a GUI to change drawing methods in the data display module and to control pre-processes of the stream data. Figure 4 shows the developed GUI.
In this section, we validate the real-time performance of the developed analysis environment by some experiments. First, we measure each processing time of ICA and DFT in the data processing. To determine which kind of orthogonalization and nonlinear functions are effectively performed in the data processing module, we investigate the processing time for several evaluation functions and optimization methods of ICA in the experiment. Then, we measure the elapsed time from the acquisition of output data from Enobio in a second to the completion of drawing a wave form in the experiment. Furthermore, we compare the time differences among update intervals for drawing with or without data processing. This experiment is performed on a computer with an Intel(R) CoreTM2 Duo E8400 3GHz CPU and 3GB memory.
The GUI is constructed with three parts: the graph display area, the information display area and the control area. The graph display area is used for displaying the graphs drawn in the data display module. In the information display area, the raw stream data and/or processing time are displayed by integer. The control area includes several buttons to control each component part of the analysis environment. The following eight kinds of buttons are located in the graph display area and the information display area.
(1) Display range (2) Refresh interval (3) Line width (4) Data processing 4.1 Experiments in the data processing module (5) TCP open/close
We measure the processing time of the data processing module, which is estimated as the most computation intensive in the proposed analysis environment. In this experiment, we measure the application of ICA and/or DFT to 250 samples from each Enobio channel by second. We adopt FastICA as an ICA algorithm, and use the IT++ library where FastICA is implemented. When the FastICA of IT++ library is executed, the types of orthogonalization and nonlinear functions are selected by option. In the FastICA class library, orthogonalization is selectable from Gram-Schmidt orthogonalization (DEFL) and symmetric orthogonalization (SYMM), while the nonlinear function g(y) is from y3 (POW3), tanh(y) (TANH), y exp(-y2/2) (GAUSS) and y2
(6) Start/Stop (7) Exit (8) Reset time counter
Button 1 defines the display range of a wave form. In the total window for the whole data, the vertical axis drawing range is limited between 0 to 65535 microvolts in the data display module. Ch-all represents all channels and "ch-1" to "ch-4" represents each channel, where calculation results from the minimum potential to the maximum potential are used for the display range of the vertical axis. Button 2 defines the refreshment rate for drawing the wave form in the data display

It is easily expected that the processing times depend on the cumulative waiting time for data reception from Enobio. The data sampling rate of Enobio is 250 Hz so that a chunk of stream data is sent from Enobio every four msec. Therefore, the data acquisition module has a waiting time from a data reception to the next data reception. In the case of drawing intervals of 50 or fewer times, since the sum of the total drawing time and the processing time is shorter than the cumulative waiting time, it is almost same to the case of drawing interval 0 that is just the data acquisition time and waiting time. In the case of drawing interval of 250 and 125, the sum of the total drawing time and the processing time is longer than the cumulative waiting time, which means that the drawing module cannot draw within a waiting time. In summary, the real-time performance of our analysis environment is kept when the drawing intervals are less than equal 50.
Table 3: Average processing time under various conditions
Update Intervals Processes
250 125 50 25 1 0
Non 1400 1050 1006 1007 1006 1007DFT 1409 1060 1007 1007 1007 - ICA 1409 1059 1008 1006 1006 -
DFT&ICA 1422 1070 1007 1007 1007 -
(SKEW). We measure each processing time for all the combinations in this experiment.
Table 2 shows the average processing times of the application of ICA and DFT to three kinds of EEG data out of 100 trials. The data used in the experiment is from a pre-stored text file generated by Enobio. The table indicates that SYMM is faster than DEFL. SYMM calculates all independent components at once, while DEFL calculates each independent component recursively one by one. This is the reason of performance difference. Among SYMM, the processing times with POW3 and SKEW options are relatively short. However, the POW3 option causes performance variation depends on data.
5 Conclusions In this paper, we presented a real-time multichannel EEG analysis environment to support BMI research using Enobio which is a wearable, modular and wireless electrophysiology sensor system. The proposed environment consists of four modules: the data acquisition module, the data processing module, the data display module, and the GUI module. The data acquisition module receives stream data from Enobio via winsock. In the data processing module ICA and DFT are implemented for EEG observation analysis. The data display module is to draw wave forms of the stream data with OpenGL, and several functions which are not included in the Enobio attachment application have been implemented. In the GUI module, many functions for starting and stopping the data acquisition, controlling pre-processes for the stream data, and setting drawing wave forms have been implemented with the Windows form.
From the above considerations, we adopt SYMM and SKEW with the shortest processing time as well as enough stability for FastICA options to observe wave forms in real time. Next, we discuss DFT for observing the frequency components in EEG data. The processing time of DFT is about 15 msec for any chunk of EEG data stream, and it is enough short compared with one second of each chunk. Thus, it keeps the analysis environment with real-time performance to implement DFT. 4.2 Experiments for Drawing Intervals
We measure processing time for 250 data from each channel of Enobio starting from the data acquisition until the completion of drawing wave forms to validate the real time performance of our analysis environment for Enobio. In the experiment, we investigate several measurement conditions of various drawing intervals and pre-processes presence. The conditions for drawing intervals are 250, 125, 50, 25, 1 and 0 times in a second and "no pre-process", "just DFT", "just ICA", and "DFT right after ICA" for pre-processes presence. Drawing interval 0 means just the processing acquisition for stream data without calling the data display module and it does not use any pre-process.
To validate the real-time performance of the analysis environment, we performed some experiments to measure processing times. First, we measured processing times of the data processing module where ICA and DFT are implemented. The experimental results showed that the processing time by the combination of SYMM and SKEW is the shortest among FastICA library options used for the ICA implementation. Next, we measured various processing times from the data acquisition to the wave forms drawing with changing processes applied to the stream data and drawing intervals of the analysis environment. The experimental results showed that we need the drawing intervals of 50 or fewer to the keep real-time performance of the developed analysis environment.
Table 3 shows the average of 100 measurements for the processing time under various conditions. It shows that the processing time is over 1,000 msec under any condition, even with drawing interval 0, which means just data acquisition time. Drawing intervals of 50, 25 and 1 take the processing times as long as drawing interval 0 without pre-processes. In the meantime, drawing intervals of 250 and 125 take longer processing times than the other conditions and pre-processes.
Acknowledgement We would like to thank Dr. Masayo Haneda of Starlab for her helpful comments.

References [1] Guido Dornhege, José del R. Millán, Thilo Hinterberger, Dennis J. McFarland and Klaus-Robert Müller; Toward Brain-Computer Interfacing, MIT Press (2007).
[2] http://starlab.es/products/enobio
[3] Aapo Hyvärinen, Juha Karhunen, Erkki Oja : Independent Component Analysis, Wiley-Interscience (2001).
[4] http://www.opengl.org/
[5] Mikhail A. Lebedev and Miguel A.L. Nicolelis: Brain-machine interfaces: past, present and future, TRENDS in Neurosciences, Vol.29, No.9, pp.536-546 (2006).
[6] A. Hyvarinen and E. Oja.: A Fast Fixed-Point Algorithm for Independent Component Analysis, Neural Computation, 9(7), pp.1483-1492 (1997).