A QUARTERLY PUBLICATION FOR WESTERN DAM ENGINEERS...In this issue ofthe Western Dam Engineering...
26
VOLUME 2 ISSUE 3 OCTOBER 2014 Introduction……………………………………….….. 1 Soil Characterization (Part 2) – Laboratory and Field Shear Strength Testing………..….……...…. 2 How Low Can You Go? The Needs and Considerations for Outlets……....…………. 13 Dam Overtopping Failures – Lessons Learned from the September 2013 Colorado Flood Event…………………………………………………………………………...…………. 19 1 A QUARTERLY PUBLICATION FOR WESTERN DAM ENGINEERS Comments/ Feedback/ Suggestions? Email Colorado Dam Safety to submit feedback on Articles. Please use article title as the subject of the email. Upcoming ASDSO Webinar Dam Safety Training: x Foundation Preparation During Dam Construction, by John France, P.E., October 14, 2014 x Rehabilitation of Concrete Dams, by Robert Kline, P. E., November 12, 2014 x Earthquake Hazards and Ground Motions, by Lelio Mejia, Ph. D., P.E., and William Fraser, December 9, 2014 Upcoming Classroom Technical Seminars: x Inspection and Assessment of Dams, November 5-7, 2014 Austin, TX ASDSO Training Website Link In this issue of the Western Dam Engineering Technical Note, we present articles on shear strength testing, reservoir outlet considerations, and some lessons learned from the September 2013 Colorado flood event . This quarterly newsletter is meant as an educational resource for civil engineers who practice primarily in rural areas of the western United States. This publication focuses on technical articles specific to the design, inspection, safety, and construction of small dams. It provides general information. The reader is encouraged to use the references cited and engage other technical experts as appropriate. The Western Dam Engineering Technical Note is sponsored by the following agencies: 6 Colorado Division of Water Resources 6 Montana Department of Natural Resources 6 Wyoming State Engineer’ s Office This news update was compiled, written, and edited by URS Corporation in Denver, Colorado Funding for the News Update has been provided by the FEMA National Dam Safety Act Assistance to States grant program. Article Contributors: URS Corporation: Julie Heitland; Fernando Castaneda, PE; Ed Villano, PE; Jennifer Williams, PE; Jason Boomer, PE; John France, PE Editorial Review Board: Michele Lemieux, PE, Montana Dam Safety Program Supervisor; Bill McCormick, PE, PG, Colorado Chief Dam Safety Branch; Mike Hand, PE, Wyoming Dam Safety Program; Mark Ogden, PE, Association of State Dam Safety Officials; Matthew Lindon, PE, Loughlin Water Associates; and Steve Becker, PE, Natural Resources Conservation Service The material in this publication has been prepared in accordance with generally recognized engineering principles and practices, and is for general information only. The information presented should not be used without first securing competent advice from qualified professionals with respect to its suitability for any general or specific application. No reference made in this publication constitutes an endorsement or warranty thereof by URS Corporation or sponsors of this newsletter. Anyone using the information presented in this newsletter assumes all liability arising from such use.
Transcript of A QUARTERLY PUBLICATION FOR WESTERN DAM ENGINEERS...In this issue ofthe Western Dam Engineering...

VOLUME 2
ISSUE 3
OCTOBER 2014
Introduction……………………………………….….. 1
Soil Characterization (Part 2) – Laboratory andField Shear Strength Testing………..….……...…. 2
How Low Can You Go? The Needs and Considerations for Outlets……....………….13
Dam Overtopping Failures – Lessons Learned from the September 2013 ColoradoFlood Event…………………………………………………………………………...………….19
1
A QUARTERLY PUBLICATION FOR WESTERN DAM ENGINEERS
Comments/ Feedback/ Suggestions?
Email Colorado Dam Safety to submit feedback on Articles.Please use article title as the subject of the email.
Upcoming ASDSO Webinar Dam Safety Training:
x Foundation Preparation During Dam Construction,by John France, P.E., October 14, 2014
x Rehabilitation of Concrete Dams, by Robert Kline, P.E.,November 12, 2014
x Earthquake Hazards and Ground Motions, by LelioMejia, Ph.D., P.E., and William Fraser, December 9, 2014
Upcoming Classroom Technical Seminars:
x Inspection and Assessment of Dams, November 5-7, 2014Austin, TX
ASDSO Training Website Link
In this issue of the Western Dam EngineeringTechnical Note, we present articles on shear strengthtesting, reservoir outlet considerations, and somelessons learned from the September 2013 Coloradoflood event . This quarterly newsletter is meant as aneducational resource for civil engineers who practiceprimarily in rural areas of the western United States.This publication focuses on technical articles specificto the design, inspection, safety, and construction ofsmall dams. It provides general information. Thereader is encouraged to use the references cited andengage other technical experts as appropriate.
The Western Dam Engineering TechnicalNote is sponsored by the followingagencies:
6 Colorado Division of Water Resources6 Montana Department of Natural
Resources6 Wyoming State Engineer’s Office
This news update was compiled, written,and edited by URS Corporation in Denver,Colorado
Funding for the News Update has beenprovided by the FEMA National Dam Safety
Act Assistance to States grant program.
Article Contributors:URS Corporation: Julie Heitland; Fernando
Castaneda, PE; Ed Villano, PE;Jennifer Williams, PE; Jason Boomer, PE;
John France, PE
Editorial Review Board:Michele Lemieux, PE, Montana Dam SafetyProgram Supervisor; Bill McCormick, PE, PG,Colorado Chief Dam Safety Branch;Mike Hand, PE, Wyoming Dam SafetyProgram; Mark Ogden, PE, Associationof State Dam Safety Officials;Matthew Lindon, PE, Loughlin WaterAssociates; and Steve Becker, PE,Natural Resources Conservation Service
The material in this publication has been prepared in accordance with generally recognized engineering principles and practices, and is for general information only. The informationpresented should not be used without first securing competent advice from qualified professionals with respect to its suitability for any general or specific application. No reference made inthis publication constitutes an endorsement or warranty thereof by URS Corporation or sponsors of this newsletter. Anyone using the information presented in this newsletter assumes allliability arising from such use.
2
Soil Characterization (Part 2) –Laboratory and Field ShearStrength Testing
Introduction
This article presents discussions of the various types oflaboratory and field testing for evaluating the shearstrength of cohesionless (sands and gravels) andcohesive (clays and silts) soils.
A subsequent article (Part 3) on shear strengthcharacterization will elaborate on utilizing laboratoryand field testing results to select and develop shearstrength parameters for use in embankment dam slopestability analyses.
Previous Articles
The fundamentals of soil characterization for dams,including some introductory aspects of shear strengthcharacterization, were presented in the July 2014 issueof the Western Dam Engineering newsletter in anarticle titled “Soil Characterization (Part 1) – Here’s theDirt.” That article presented a broad overview ofproperties pertinent to the overall performance andanalysis of dams.
Additionally, the fundamentals of slope stabilityanalyses were presented in the November 2013newsletter issue in an article titled “Embankment DamSlope Stability 101,” where the topic of shear strengthcharacterization for slope stability analysis wasintroduced. Discussion was also provided on slopestability modeling for the following embankmentloading conditions: steady state, end of construction,rapid drawdown, and seismic.
You are invited to revisit and review those two articles,as this article builds on many of the conceptspresented in the previous articles.
What this Article Does Not Cover
This article does not discuss shear strength testing ofrock or special soils such as cemented sands, stifffissured clays, highly sensitive (“quick”) clays, andorganic soils; the discussion is limited to the mostcommon soils used in dam engineering andconstruction.
Undrained vs. Drained Conditions and Totalvs. Effective Stresses
In this section, the concepts of undrained loadingconditions versus drained loading conditions and totalstress versus effective stress testing and analysismethods are introduced. An understanding of theseconcepts is important in evaluating soil behavior andassigning appropriate shear strengths.
When saturated or partially saturated soils are loadedin shear, they have a tendency to change in volume.Loose sands or normally consolidated clays tend todecease in volume, while dense sands oroverconsolidated clays tend to increase in volume. Ifthe loading is applied slowly enough, pore water willflow into or out of the soil mass, the volume of the soilmass will change, and pore pressures will not change.However, if the loading is applied more quickly thandrainage can occur, pore water pressures will begenerated within the soil mass. Positive pore pressureswill generate in loose sands or normally consolidatedclays due to the tendency to compress, while negativepore pressures will generate in dense oroverconsolidated clays due to the tendency to expand.Coarse-grained soils (sands and gravels) have highhydraulic conductivities (permeabilities) and sufficientdrainage capacity to prevent pore water pressuresfrom changing for most loadings (earthquake loadingbeing an exception that is beyond the scope of thisarticle), while fine-grained soils (clays and silts) havelow hydraulic conductivities and can develop excesspore water pressures during some static loadingconditions.
Undrained conditions occur when loading is appliedmore rapidly than soil drainage can occur. Underundrained conditions, water cannot flow into or out ofthe soil in the length of time the loading is applied. Asa result, pore water pressures increase or decrease inresponse to changes in load, as described above.Drained conditions occur when loading is appliedslowly enough relative to the permeability of the soilthat drainage of pore water can occur. Pore waterpressures do not change under drained loadingconditions, because water can move into or out of thesoil freely in response to changes in load.

3
Hence, whether a particular loading should beconsidered undrained or drained is dependent on rateof loading, soil permeability, and the distance overwhich drainage must occur to prevent pore waterpressure changes. One method for estimating whethera soil will behave in a drained or undrained mannerduring loading is presented in the article “EmbankmentDam Slope Stability 101” from the November 2013newsletter. Alternatively, soils having a coefficient ofpermeability greater than approximately 1 x 10⁻³
centimeters per second (cm/ s) can be considered to befree-draining under static loading, as a general rule ofthumb (Duncan and Wright, 2005). Althoughconditions can be intermediate between undrainedand drained, loading conditions are almost alwaysmodeled as either one or the other. In some cases,when it is not clear whether the loading conditions areundrained or drained, both cases are considered in theanalysis.
Total stresses within a soil mass include both stressesresulting from forces transmitted through interparticlecontacts and pore water pressures. Effective stresseswithin a soil mass include only stresses resulting fromthe forces transmitted through interparticle contacts.At any given location, the effective stress equals thetotal stress minus the pore water pressure.
Soil strengths can be defined as a function of eithertotal stresses or effective stresses. When strengthsdefined in terms of total stress are used in stabilityanalysis, the approach is commonly called the totalstress method, while the term effective stress methodis used when strengths defined in terms of effectivestress are used in stability analysis. Effective stressmethods should always be used for drained loadingconditions. For undrained loading, one needs tochoose between total stress methods and effectivestress methods. Total stress methods are used when itis easier to predict the strength during undrainedloading than it is to predict the pore water pressuresduring undrained loading, which is almost always thecase.
Soil strengths are always governed by effectivestresses, or interparticle forces, regardless of loadingcondition. Total stress strength characterizations aresimply used in those cases where we cannot easily
predict pore water pressure responses and we canmore easily predict the undrained strength. The porewater pressure is implicit in the selected total stressstrength; the pore pressure is whatever value isnecessary to produce an effective stress state thatresults in the predicted strength.
A future article (Part 3 of the series) will provideguidance on when undrained conditions, drainedconditions, total stress methods, and effective stressmethods are generally used for shear strengthcharacterization and slope stability analysis. But first,shear strength parameters and strength testing toevaluate the parameters will be discussed.
Shear Strength Explained
Shear strength can be defined as the ability of soil toresist failure (rupture or sliding) under shear loading.The shear load is the result of gravity forces from thesoil mass and any external loads (e.g. reservoir loads,equipment loads, seismic loads). Soil shear strengthdepends on:
x Types of soil particles and mineralogy
x Consolidation pressure
x Drainage allowed
x Stress history, including overconsolidation
x Stress paths
The most common way of representing orcharacterizing shear strength of soils is the Mohr-Coulomb failure criterion using the followingequations:
s = c + tan (total stress)
s = c’ + tan’( effective stress)
Where s = shear strength; c = cohesion; V =effective or total stress; and I = internal frictionangle.
As represented by the Mohr-Coulomb failure criterion,the shear strength characterization for a soil consists of
Shear strength of a soil is controlled byeffective stresses, whether failure occursunder drained or undrained conditions.

4
a frictional component ( I, I') and a non-frictionalcomponent, or cohesion ( c, c’). Figure1 belowgraphically depicts the Mohr-Coulomb failure criterion.
Figure 1: Mohr-Coulomb failure criterion.
Mohr-Coulomb failure envelopes can be developedthrough the use of Mohr’s circles of stress representingthe stress states at failure for a series of tests (oftenthree tests). As seen in Figure 1, both total andeffective stress failure envelopes can be developed.Failure envelopes for soils are often curved. However,for mathematical simplicity, an analyst willapproximate the failure envelope as linear over thenormal stress range of interest for the analysis. TheMohr-Coulomb failure criterion is, therefore,represented by a straight line (failure envelope) with aslope designated as the friction angle (I,I') and anintercept called the cohesion (c, c’). The normal (orvertical) stress ( acting on soil in an embankmentat a given depth, is represented by the horizontal axis,and can be either total stress or effective stress. Notethat the greater the normal stress, the greater thefrictional component and overall shear strength.
Shear strength tests are performed on soils using arange of consolidation pressures to develop thestrength envelope from Mohr-Coulomb plots. Thefollowing section will discuss various laboratory testsused to evaluate the shear strength of soils, and whichlaboratory tests are appropriate for drained andundrained loading conditions.
Laboratory Shear Strength Tests
The five types of laboratory tests most widely used toestimate shear strength in soils are: direct shear,unconfined compression, triaxial shear, direct simpleshear, and torsional ring shear. These five tests aredescribed in detail below and are performed in
accordance with ASTM standards. The ASTM standardfor each test outlines sample preparation, failurecriterion, and procedures for saturation, consolidation,loading, and pore pressure measurements ( whereapplicable).
Direct Shear Test
The oldest and simplest shear strength test is thedirect shear (DS) test. DS testing is performed asdescribed in ASTM D3080. In the DS test, a thin soilsample is placed in a shear box that is split horizontallyinto halves. A normal force (Pv) is applied to the top ofthe loading head. The normal force typically rangesfrom 0 to 150 pounds per square inch (psi). The lowerhalf of the box is fixed, while a shear force (Ph) isapplied to the upper half, thereby moving the upperhalf parallel to the lower half and forcing the soilspecimen to fail along a horizontal shear plane. Aschematic of the test apparatus is shown in Figure 2.
Figure 2: Direct shear test apparatus.
The DS test is performed in a strain-controlleddeformation-controlled) manner per ASTM D3080. In
the strain-controlled test, a constant rate of sheardisplacement is applied to the top half of the box by amotor that acts through gears. Shear displacement
H) of the top half of the box is measured byahorizontal dial gauge or displacement transducer. Theresisting shear force of the soil can be measured by ahorizontal proving ring or load cell. A dial gauge ordisplacement transducer on the upper loading plate
Reference: Bowles (1988)

5
measures the change in height of the specimen, orvertical displacement (' V). Both peak and post-peakshear strengths can be observed in the strain-controlled test.
DS tests can only be used to accurately evaluatedrained shear strength parameters. The DS test cannotaccurately measure undrained strengths becauseconstant volume conditions are not achieved, sincewater can be expelled from or drawn into thespecimen. Since the shear plane is relatively thin,volume and moisture content changes can easily occuron the shear plane, even if the volume of the totalspecimen does not change. The DS test is generallyapplicable to grained sands, clays, and silts, becausethe typical DS box is too small to accommodate coarseparticles. However, the test is most appropriate for dryor saturated sands. Sand has a relatively highpermeability whereby excess pore water pressuresgenerated due to loading dissipate quickly. Clays andsilts have a low permeability and therefore take longertime to dissipate excess pore water pressures. As aresult, the shear force must be applied very slowly forclays and silts, which can make DS testing of these soilsimpractical.
Generally, a minimum of three specimens are tested toestablish the relation between shear stress and normalstress at failure. Typical results for a DS test arepresented in Figure 3.
Figure 3: Typical direct shear test results.
Unconfined Compression Test
Of the tests mentioned in this article, the quickest andleast expensive is the unconfined compression ( UC)test. Its use is limited to evaluating the undrained
shear strength ( Su) of saturated cohesive soils ( claysand silts). It is not suitable for dry or crumbly soil,materials with fissures or lenses, or uncemented sandsand gravels. Unconfined compression testing isperformed as described in ASTM D2166.
In the UC test, a laterally unsupported specimen ( nohorizontal confining pressure) is placed between twoend plates and loaded in axial compression until shearfailure occurs. The vertical load (Pv) is applied at a ratethat maintains a vertical strain of about 1 to 2 percentper minute. A schematic of the test apparatus is shownin Figure 4.
Figure 4: Unconfined compression test apparatus.
The unconfined compressive strength (qu) is defined asthe maximum axial compressive stress at which failureoccurs, or at which the axial strain reaches 15 percentif there is no sudden failure. Since there is nohorizontal confining pressure, the total minor principalstress at failure ( V3) is zero and the total majorprincipal stress at failure is equal to the unconfinedcompressive strength ( V1 = qu). Thus, the undrainedshear strength ( Su) is equal toone-half of theunconfined compressive strength (1/2qu), as depictedin Figure 5.
The UC test can be considered a special case of theunconsolidated-undrained ( UU) triaxial shear test,described subsequently, in which the lateral stress isset to zero.
Reference: hoskin.ca
Pv

6
Figure 5: Unconfined compression test results.
Triaxial Shear TestThe triaxial shear test is the most common andversatile of the five tests, but also one of the mostinvolved and time consuming. In the triaxial test, ahorizontal confining pressure is applied to thespecimen and drainage conditions are controlled. Thetriaxial shear test can be performed on “undisturbed”samples ( samples obtained from a constructedembankment or its foundation, typically using tubesamplers) or remolded samples ( soil samplescompacted to specified design density and moisturecontent, e.g. to replica fill placement). Strength testson undisturbed samples rely on the integrity of thesample being maintained during sampling,transportation, and specimen preparation. Sampledisturbance can have a significant effect on strengthresults. Care in preserving the tube samplesthroughout collection, transportation, and storage iscritical. Samples should be extruded only in thelaboratory. The engineer needs to rely on the lab toidentify signs of sample disturbance or be presentduring sample extrusion and specimen preparation.Triaxial shear testing is performed as described inASTM D2850 (UU test) and D4767 (CU’ test).
In the triaxial shear test, a cylindrical soil specimen isencased in a rubber membrane and placed in a triaxialtest chamber that is filled with a fluid (usually water).The specimen is subjected to an all-around confiningpressure laterally by pressurization of the fluid in thechamber. An axial load is applied by means of a loadingpiston through the top of the chamber. The confiningpressure is held constant while the axial load isincreased ( compression testing) or decreased
extension testing) until shear failure of the soilspecimen occurs. A drainage system consisting ofporous stones and drainage lines is connected to thesample on the bottom and/or top to allow for drainageand pore pressure measurement. Figure 6 illustratesthe principles of the triaxial compression test. Aschematic of the test apparatus is shown in Figure 7.
Figure 6: Principles of triaxial compression tests: ( a)application of stresses, ( b) representation of principalstresses, ( c) usual arrangement for effective stresstests, (d) representation of total and effective stresses.
Figure 7: Triaxial shear test apparatus.
Total stress Mohr’scircle at failure
V3 = 0
Su
V1 = qu
V1
V1I = 0
V
W
Reference: Das (2006)
Reference: Head (1986)

7
The tests are generally performed in a controlled-strainmanner (specimen strained axially at a predeterminedrate); usually performed at a strain rate between 0.5and 1.25 mm/hr.
A minimum of three specimens, each under a differentconfining pressure, are generally tested to establishthe relationship between shear stress and normalstress, which allows construction of a Mohr-Coulombfailure envelope and estimation of the shear strengthparameters ( c, I, c’, I’). Confining pressures shouldbracket the range of normal stresses expected in thefield. Often, confining pressures representative of thein-situ stress state in addition to two larger stressstates are specified.
Four types of triaxial tests are typically conducted:
1.Unconsolidated-Undrained (UU or Q [quick]) Test
2.Consolidated-Drained (CD or S [ slow]) Test
3.Consolidated-Undrained (CU or R [rapid]) Test
4.Consolidated-Undrained ( CU’ or R-bar) Test withPore Pressure Measurements
Unconsolidated-Undrained (UU or Q) Test
In the UU test, drainage is prevented and, although achamber pressure is applied, the soil specimen is notconsolidated under a confining pressure prior to axialloading. The drainage valve remains closed duringapplication of the confining pressure and axial loadingand shearing of the specimen. The water content ofthe soil prior to testing remains the same duringtesting. Pore water pressures are not measured duringthe test. The UU test therefore measures total stressstrength parameters ( c, I) and is applicable forcohesive soils (clays and silts).
If the UU specimen is fully saturated, increasing thechamber pressure to larger total stresses will induce anequivalent increase in pore water pressure, in whichcase, the effective stress of the sample remainsunchanged. Therefore, the measured shear strength,which is referred toas theI0 strengthcharacterization, will be the same for all chamberpressures. Some variability may occur in the resultingshear strengths due to sample variation, sampledisturbance, and testing imperfections. Figure 8illustrates idealized UU test results and the I 0
strength characterization. In reality, the specimens aretypically not fully saturated, and there isa slightincrease in shear strength with increasing chamberpressure. This is because the effective confiningstresses actually increase since the pore pressureresponse is less than the confining pressure.
Figure 8: UU test results on saturated soil.
Examples of when to perform a UU test include thefollowing conditions: rapid loading of a slowlypermeable soil, rapid construction of an embankmentor other type of loading) over a soft clay, and
excavation in a soft clay.
Consolidated-Drained (CD or S) Test
In the CD test, drainage is permitted throughout thetest. The specimen is first saturated and consolidatedunder chamber pressure and back pressure resulting ina specified effective confining pressure. Pore waterpressures generated by application of the confiningpressure are allowed to dissipate until the specimenreaches its state of consolidation under the specifiedeffective confining pressure. The CD test can beperformed using either isotropically consolidated ( IC-D) samples or anisotropically consolidated ( AC-D)samples, in which load is applied to the piston so thatthe vertical consolidation load is generally higher thanthe lateral load.
During axial loading, the specimen is sheared to failurewith an open drainage valve at a slow enough ratesuch that excess pore water pressures dissipate duringthe test. The pore water volume change ( either adecrease or increase) is measured during the shearstage of the test. The CD test therefore evaluatesdrained effective stress strength parameters ( c’, I’).Effective stress strength parameters for moist samplesare often assumed to be the same as that for saturated
Reference: Head (1986)
8
samples. This is conservative, but eliminates the needto perform moist CD tests, which are very complex.The CD test is applicable for both cohesionless soilssands and gravels) and cohesive soils (clays and elastic
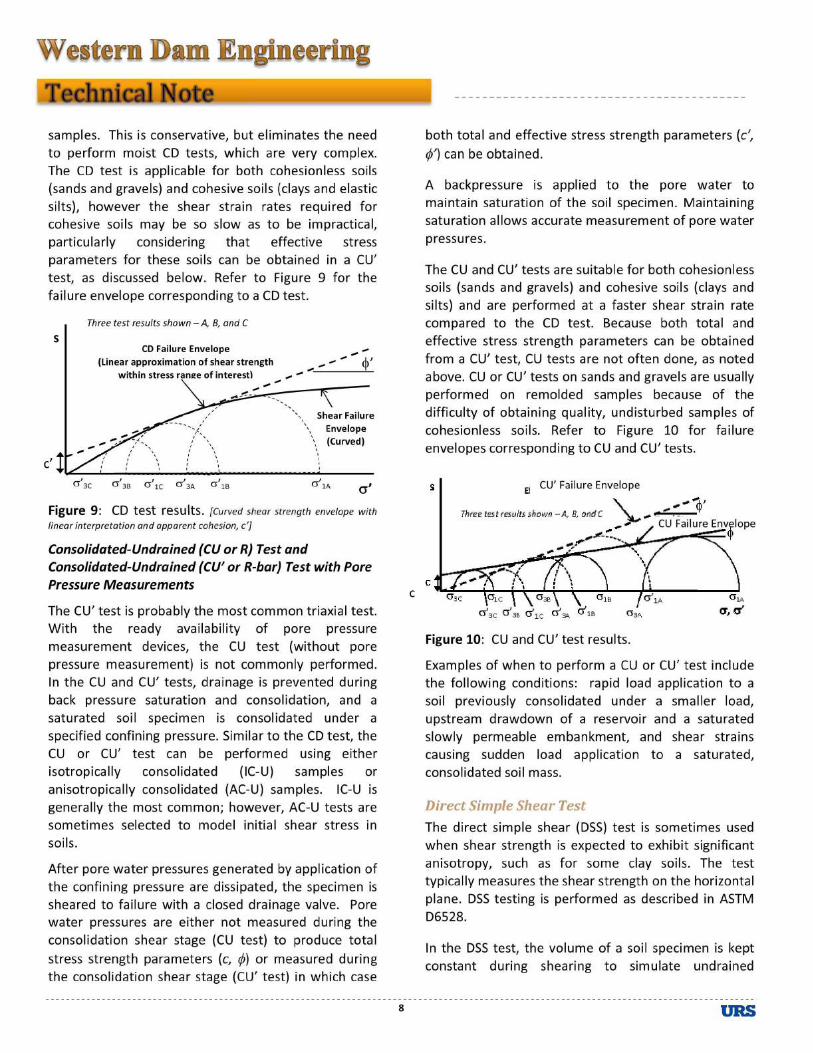
silts), however the shear strain rates required forcohesive soils may be so slow as to be impractical,particularly considering that effective stressparameters for these soils can be obtained in a CU’test, as discussed below. Refer to Figure 9 for thefailure envelope corresponding to a CD test.
Figure 9: CD test results.[ Curved shear strength envelope withlinear interpretation and apparent cohesion, c’]
Consolidated-Undrained (CU or R) Test andConsolidated-Undrained (CU’ or R-bar) Test with PorePressure Measurements
The CU’ test is probably the most common triaxial test.With the ready availability of pore pressuremeasurement devices, the CU test ( without porepressure measurement) is not commonly performed.In the CU and CU’ tests, drainage is prevented duringback pressure saturation and consolidation, and asaturated soil specimen is consolidated under aspecified confining pressure. Similar to the CD test, theCU or CU’ test can be performed using eitherisotropically consolidated ( IC-U) samples oranisotropically consolidated ( AC-U) samples. IC-U isgenerally the most common; however, AC-U tests aresometimes selected to model initial shear stress insoils.
After pore water pressures generated by application ofthe confining pressure are dissipated, the specimen issheared to failure with a closed drainage valve. Porewater pressures are either not measured during theconsolidation shear stage ( CU test) to produce totalstress strength parameters (c, I) or measured duringthe consolidation shear stage (CU’ test) in which case
both total and effective stress strength parameters (c’,I’) can be obtained.
A backpressure is applied to the pore water tomaintain saturation of the soil specimen. Maintainingsaturation allows accurate measurement of pore waterpressures.
The CU and CU’ tests are suitable for both cohesionlesssoils (sands and gravels) and cohesive soils (clays andsilts) and are performed at a faster shear strain ratecompared to the CD test. Because both total andeffective stress strength parameters can be obtainedfrom a CU’ test, CU tests are not often done, as notedabove. CU or CU’ tests on sands and gravels are usuallyperformed on remolded samples because of thedifficulty of obtaining quality, undisturbed samples ofcohesionless soils. Refer to Figure 10 for failureenvelopes corresponding to CU and CU’ tests.
Figure 10: CU and CU’ test results.
Examples of when to perform a CU or CU’ test includethe following conditions: rapid load application to asoil previously consolidated under a smaller load,upstream drawdown of a reservoir and a saturatedslowly permeable embankment, and shear strainscausing sudden load application to a saturated,consolidated soil mass.
Direct Simple Shear Test
The direct simple shear (DSS) test is sometimes usedwhen shear strength is expected to exhibit significantanisotropy, such as for some clay soils. The testtypically measures the shear strength on the horizontalplane. DSS testing is performed as described in ASTMD6528.
In the DSS test, the volume of a soil specimen is keptconstant during shearing to simulate undrained
V’
s
I’
c’V’1CV’3C V’1BV’3B V’3A V’1A
CD Failure EnvelopeLinear approximation of shear strength
within stress range of interest)
Three test results shown – A, B, and C
c
Shear FailureEnvelopeCurved)
CU’ Failure Envelope
CU Failure Envelope
9
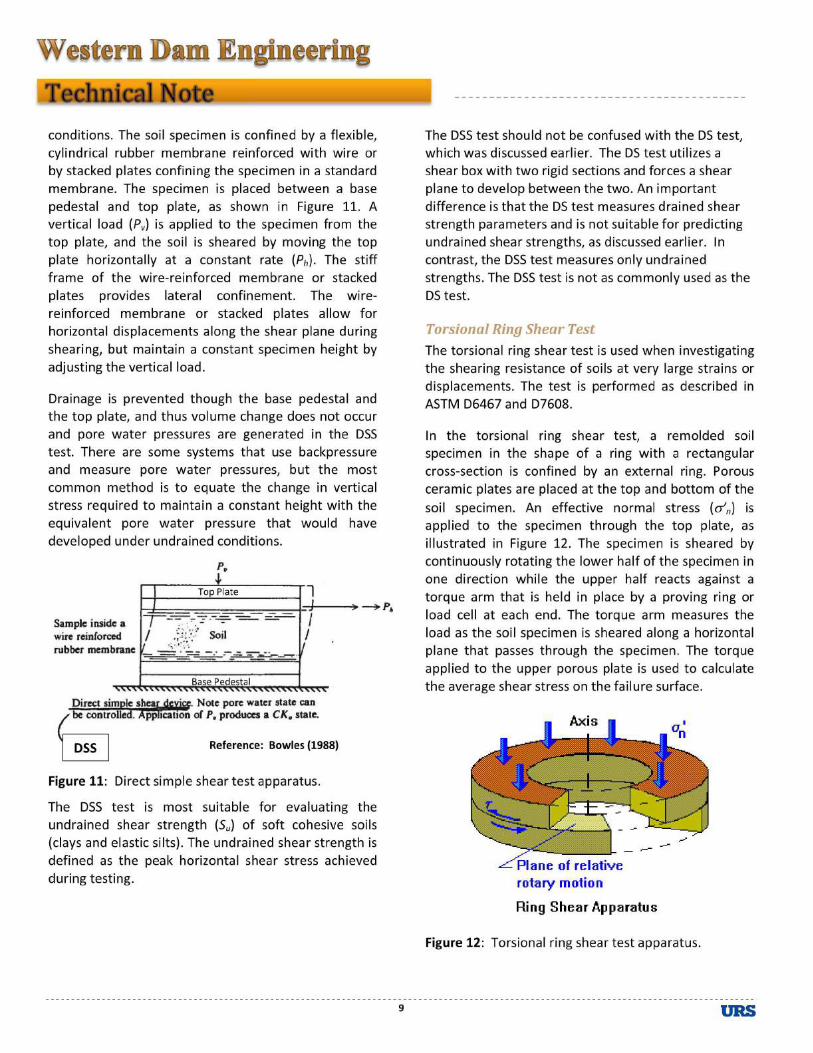
conditions. The soil specimen is confined by a flexible,cylindrical rubber membrane reinforced with wire orby stacked plates confining the specimen in a standardmembrane. The specimen is placed between a basepedestal and top plate, as shown in Figure 11. Avertical load (Pv) is applied to the specimen from thetop plate, and the soil is sheared by moving the topplate horizontally at a constant rate ( Ph). The stiffframe of the wire-reinforced membrane or stackedplates provides lateral confinement. The wire-reinforced membrane or stacked plates allow forhorizontal displacements along the shear plane duringshearing, but maintain a constant specimen height byadjusting the vertical load.
Drainage is prevented though the base pedestal andthe top plate, and thus volume change does not occurand pore water pressures are generated in the DSStest. There are some systems that use backpressureand measure pore water pressures, but the mostcommon method is to equate the change in verticalstress required to maintain a constant height with theequivalent pore water pressure that would havedeveloped under undrained conditions.
Figure 11: Direct simple shear test apparatus.
The DSS test is most suitable for evaluating theundrained shear strength ( Su) of soft cohesive soilsclays and elastic silts). The undrained shear strength is
defined as the peak horizontal shear stress achievedduring testing.
The DSS test should not be confused with the DS test,which was discussed earlier. The DS test utilizes ashear box with two rigid sections and forces a shearplane to develop between the two. An importantdifference is that the DS test measures drained shearstrength parameters and is not suitable for predictingundrained shear strengths, as discussed earlier. Incontrast, the DSS test measures only undrainedstrengths. The DSS test is not as commonly used as theDS test.
Torsional Ring Shear Test
The torsional ring shear test is used when investigatingthe shearing resistance of soils at very large strains ordisplacements. The test is performed as described inASTM D6467 and D7608.
In the torsional ring shear test, a remolded soilspecimen in the shape of a ring with a rectangularcross-section is confined by an external ring. Porousceramic plates are placed at the top and bottom of thesoil specimen. An effective normal stress ( V’n) isapplied to the specimen through the top plate, asillustrated in Figure 12. The specimen is sheared bycontinuously rotating the lower half of the specimen inone direction while the upper half reacts against atorque arm that is held in place by a proving ring orload cell at each end. The torque arm measures theload as the soil specimen is sheared along a horizontalplane that passes through the specimen. The torqueapplied to the upper porous plate is used to calculatethe average shear stress on the failure surface.
Figure 12: Torsional ring shear test apparatus.
DSS Reference: Bowles (1988)
Top Plate
Base Pedestal

10
The torsional ring shear test can measure shearstresses over any magnitude of displacement and istherefore suitable for estimating residual shearstrength, as shown in Figure 13. The test is primarilyused for evaluating the drained residual shear strengthof cohesive soils (clays and silts). The specimen mustbe sheared slowly enough that pore water pressuresdo not develop. This is generally not a problembecause of the small sample height and resulting shortdrainage path. A minimum of three remoldedspecimens is generally tested under different normalstresses that are representative of field conditions toevaluate the drained residual failure envelope.
Figure 13: Torsional ring shear test results.
Laboratory Testing Shear StrengthCharacterization Summary
The table below presents a summary of theaforementioned laboratory tests and the shearstrength characterization evaluated by each test.
Laboratory Test Shear Strength Characterization
Direct Shear (DS)Drained effective stress shear strengthparameters (I’, c’) for fine-grainedsands, clays, and silts
UnconfinedCompression (UC)
Undrained shear strength (Su) forsaturated cohesive soils (clays and silts)
Unconsolidated-Undrained Triaxial
UU orQ)
Undrained total stress strengthparameters (I, c) for cohesive soils (claysand silts)
Consolidated-Drained Triaxial
CD or S)
Drained effective stress shear strengthparameters (I’, c’) for cohesionless soilssands and gravels) and cohesive soilsclays and elastic silts)
Consolidated-Undrained Triaxial
CU or R)
Undrained total stress strengthparameters (I, c) for cohesionless soilssands and gravels) and cohesive soilsclays and silts)
Laboratory Test Shear Strength Characterization
Consolidated-Undrained Triaxialwith Pore Pressure
Measurements (CU’)
Undrained total stress strengthparameters (I, c) and drained effectivestress strength parameters (I’, c’) forcohesionless soils (sands and gravels)and cohesive soils (clays and silts)
Direct Simple ShearDSS)
Undrained shear strength (Su) mostsuitable for soft cohesive soils (clays andelastic silts)
Rotational RingShear
Drained effective stress residual shearstrength parameters (Ir’, cr’) mostsuitable for cohesive soils (clays andsilts)
Evaluation of Laboratory Test Data
Engineers should be capable of prescribing andcritically reviewing laboratory test data with regard tosoil strength characterization. Listed below are themain categories of data that should be criticallyevaluated:
x Method of sample preparation
x Initial sample data
x Backpressure data (when applicable)
x Consolidation data (when applicable)
x Final water contents
x Stress, strain, and pore pressure data
x Plotted data
Field Testing for Shear Strength
In-situ testing of embankment or foundation materialsfor direct shear strength measurements is performedby the following methods:
x Vane Shear Test (ASTM D2573)
x Pocket Penetrometer Test
x Torvane Test
The vane shear test is the most widely used field testfor measuring the undrained shear strength of soft tomedium stiff clays. In the field vane shear test, a four-bladed vane is pushed into the soil and rotated untilthe soil fails in shear along a cylindrical surface. Theresisting torque is measured to evaluate the undrainedshear strength. A schematic of the vane shear testapparatus is shown in Figure 14.

11
Figure 14: Vane shear test apparatus.
Both the pocket penetrometer and torvane tests arequick field tests which provide approximatemeasurements of undrained shear strength, subject toappropriate limitations. The pocket penetrometer testprovides an approximate measure of the unconfinedcompressive strength of soils through a small scalebearing capacity test. The piston at the end of apocket pentrometer, shown in Figure 15, is pressedinto the soil to get a measurement of the unconfinedcompressive strength. It can give misleading resultsbecause it only tests a small area of soil and can easilybe affected by disturbance.
Figure 15: Pocket penetrometer.
The torvane test provides an approximate measure ofundrained shear strength rather than the unconfined
compressive strength; remember that undrained shearstrength ( Su) is equal to one-half of the unconfinedcompressive strength ( qu). In a torvane test, a soilsample is removed from an area of interest and thevane end of a torvane, shown in Figure 16, is pushedinto the soil sample. The torvane is twisted until itbreaks free from the sample. The dial gauge is used tomeasure the shear strength.
Figure 16: Torvane.
Field testing is a crude method of measuring shearstrengths in comparison to laboratory testing. Fieldtesting should be used only as an approximate firstestimate of undrained shear strength, with thestrength estimates further refined by laboratory testsfor purposes of analysis and design.
The Standard Penetration Test ( SPT), ConePenetrometer Test ( CPT), and shear wave velocitymeasurements can be used to estimate shear strengthparameters through the application of empiricalcorrelations. These methods of investigation aredescribed in numerous geotechnical engineeringreference books and will be discussed in the follow-onPart3) to this article. Several recommended
references are listed at the end of this article.
Conclusion
Shear strength characterization is a fine art thatrequires experienced and knowledge to assign testsrelevant for the soil/ sample type and loadingconditions needing to be analyzed. Interpreting theresults also requires an educated eye to evaluate allpertinent test parameters to determine the confidencelevel in the results. A subsequent article will discussutilizing laboratory and field testing results forselection and development of shear strengthparameters to be used in analyses.
Su

12
Useful References1] Strength of Materials for Embankment Dams, United States Society on
Dams, February 2007.
2] Soil Strength and Slope Stability, J. Michael Duncan and Stephen G.Wright, 2005.
3] Engineering Field Manual, Chapter 4 - Elementary Soil Engineering,U.S. Dept of Agriculture, Natural Resources Conservation ServiceNRCS), July 1984 (Fourth Printing).
4] Earth Manual, Part 1, U.S. Department of the Interior, Bureau ofReclamation, 1998 (Third Edition).
5] EM 1110-1-1804, Geotechnical Investigations, U.S. Army Corps ofEngineers, January 2001.
6] EM 1110-1-1802, Geophysical Exploration for Engineering andEnvironmental Investigations, Department of the Army, U.S. ArmyCorps of Engineers, 31 August 1995.
7] FHWA NHI-06-088, Soils and Foundations, Reference Manual –Volume 1, U.S. Department of Transportation, Federal HighwayAdministration, December 2006.
8] Manual on Estimating Soil Properties for Foundation Design, EPRI EL-6800,Electric Power Research Institute (EPRI), August 1990.

13
How Low Can You Go? The Needsand Considerations for Outlets
Photo 1: Releasing 300 ft3/ sec through a Low Level Outlet at Dam in Utah
IntroductionWhether your dam is a modern wonder of the world ora low-head earthen dam tucked away in a ruralcommunity, your dam impacts the environment andpopulations on both sides of the structure. One of themore routine operations of managing a dam isreservoir drawdown. This article will discuss thereasons for drawing down a reservoir, the methodsavailable for reservoir drawdown, the potentialimpacts, and other things to consider when drawingdown a reservoir. Dam ownership, regulation, andoperation vary from the federal government, stategovernment, local municipalities, utility providers, andin some cases private individual or group owners.Because no two dams are the same and theirownership, operations, obligations, and impacts arevery specific to their individual circumstances, thisarticle will discuss these topics in generalities.
Reasons for DrawdownReservoir drawdown simply means the release ofwater stored behind a dam such that the reservoirwater level decreases. The reasons for drawing down areservoir can vary widely based on the purpose of thedam. Dams are built for a variety of purposes: todevelop irrigation supply for agriculture, municipalwater supply for populated communities, powergeneration through use of hydroelectric turbines; tostore and attenuate water during times of high
precipitation or snow melt runoff, to develop/ restorevarious types of ecosystems, or combinations of all ofthese services. Dams also provide recreationalopportunities as well as attractive residential propertyaround their reservoirs, although these are generallyancillary benefits and not primary reasons forconstructing a dam.
The purposes, schedules, rates, and magnitudes ofreservoir drawdowns are generally described in adam’s Operation and Maintenance Manual (O&M)and/or Emergency Action Plan (EAP). Drawdowns canoccur for recreation, environmental considerations,water supply agreements, or dam safety concerns.Drawdowns mandated by Dam Safety regulatoryagencies can be driven by poor operating conditions ordamage of the dam, stability concerns, design issues,maintenance, or repairs. Reasons for reservoirdrawdowns are discussed further below.
Supply – The stored water behind dams may bereleased downstream to supply irrigation canals, pumpstations, and/or water treatment plants locateddownstream. Water releases are also sometimes usedto maintain specific waterway stages so they may beserviceable to recreational and commercial boating. Inthe case of routine systematic drawdowns, releaseschedules are often based on water distributionagreements negotiated between dam owners andwater use stakeholders.
Seasonal Operation – Reservoir operation is oftencyclical based on seasonal weather patterns. Damoperators often drawdown their reservoirs to providestorage space prior to seasons of high precipitationand/or snow melt runoff. The high inflows then refillthe reservoir. This is typically followed by a season oflow precipitation, which usually coincides with theabove-described demands for supplementingdownstream water supply and the reservoir isgradually drawn down. And the cycle repeats.
Flooding – Normal operating levels for reservoirs areestablished to provide additional freeboard andstorage for infrequent but significant precipitationevents. During these events, the increased inflow canbe stored, reducing the peak flood dischargedownstream. After the flood, the reservoir is loweredat a controlled rate to the normal operating level.

14
Sediment Flushing – A side effect of a dam locatedalong a stream or river (as opposed to an off-channelimpoundment in which water is piped to the reservoir)is the accumulation of sediment that would otherwisetravel downstream. In addition, the presence of a damwill also significantly lower the natural flow rate andenergy through a waterway, allowing sediment tosettle to the lake bottom and accumulate adjacent tothe dam, rather than stay suspended and betransported downstream. In some cases, dams havescheduled releases designed to flush sediment trappedbehind the dam and/or to flush sediment built up inthe downstream channel. However, the presence ofthe sediment can also result in undesirable orunintended release of sediment during drawdownsinitiated for other reasons; these can impact thedownstream waterway, if not properly controlled.Managing unintended sediment release may includeusing higher level intakes, controlling the dischargerate, and limiting the drawdown level.
Environmental/ Biological – Because dams significantlyalter the natural flow and water quality conditions of ariver/stream, it is often required as part of a damowner’s operation to release water for downstreamenvironmental considerations. These drawdowns areusually governed by regulatory agreements. Thereleases are designed to benefit the downstreamecology and habitat by maintaining temperature andflow conditions beneficial to the aquatic species,supporting wildlife spawning, eradicating invasivespecies, and building beaches.
Inspections, Repairs, & Modifications –To inspect,repair, or construct modifications to a dam, it may benecessary to lower the reservoir significantly toprovide safe access for these activities. If the outletsystem is the item in need of repair, a temporarymeans of drawdown may be required, such as a siphonsee Methods of Drawdown, below).
Damage/ Distress – A dam or its appurtenantstructures can be damaged due to natural events suchas an earthquake or extreme flood, a human-inducedevent such as vandalism or sabotage, or long-termwear and erosion. This damage may be severe enoughthat the dam is at risk of failure. Under these cases it iscritical to be able to lower the reservoir as fast as
safely possible to reduce the loading on the dam andrisk of failure.
Methods for DrawdownAll dams are, or should be, equipped with outletstructures or systems for releasing water. Dams can beoutfitted with different combinations of dischargestructures with varying degrees of redundancy. For thepurposes of this article, overflow spillways will not bediscussed, as they are designed to pass flood flows inan uncontrolled manner (i.e., without human ormechanical operation) rather than to lower reservoirsby significant levels in a controlled sequence ofoperation.
This article focuses on the need and use of mechanicaloutlet works systems designed to discharge water forthe reasons described above. Often these outlet worksconsist of, from upstream to downstream, an intakestructure, control valve/gate system, conveyanceconduit, and discharge structure/basin. Differentagencies/ regulators, both federal and state haveguidelines for minimum drawdown capacities of outletworks systems. These regulations often differ betweenjurisdictions and between hazard classifications. Forexample, for high hazard dams, the Colorado StateEngineer’s Office requires that the outlet works systembe capable of releasing the top five feet of reservoircapacity within five days.
Photo 2. Outlet Commissioning Test. Photo from the Dam Safety Branchof the Colorado State Engineer’s Office.
It is not uncommon to have multiple sets of outletworks systems, where one is set up for routinedischarges and another designed to significantly lower

15
the reservoir. The latter is generally termed a low-leveloutlet. Low-level outlets are operated when thereservoir needs to be drawn down below the invert ofother discharge structures. With a reservoir at normalpool, a low-level outlet system is typically under amuch larger magnitude of static and dynamic hydraulicpressures than the other outlet structures on the dam.Ideally, a reservoir would be drawn down using otheravailable outlet structures until the reservoir hasreached the lowest achievable elevation beforeoperating the low-level outlet. This will help reducestress on the system. A low-level outlet system istypically only used to dewater a reservoir forinspection or construction activities or in the case ofemergencies. When designing a low-level outlet,predicted sediment accumulation should beconsidered. If the low-level outlet is buried beneathenough sediment that it cannot release watereffectively, dredging will be required to maintainserviceability. A low-level outlet should be equippedwith an adjustable control valve or gate, such thatwater release can be throttled. Since most reservoirsare bowl- shaped, the rate of drawdown will increaseat lower levels if the discharge rate remains the same.Having adjustable valves or gates will allow the damoperator to control the reservoir drawdown atconstant rates by slowing the release flow as the pooldraws down.
For cases where there is no low-level outlet system, orthe outlet system is unsafe for use, a siphon can beinstalled, providing the ability to lower the reservoir. Asiphon is generally installed over the dam or spillway,providing a safe and easily constructible, but usuallytemporary, outlet option for dam owners. A detaileddiscussion about siphons was presented in Volume 1:Issue 1 of Western Dam Engineering: Technical Notes.
Impacts of DrawdownDams and the reservoirs they impound have significantimpacts on the communities and environments aroundthem. The drawdown of a dam’s reservoir is one of themore impactful aspects of dam operation. Reservoirdrawdown can have far reaching effects on theenvironment downstream, upstream, and even thedam itself. The magnitude of these impacts or whetherthey exist is dependent on the size of the dam, volumeof the reservoir, discharge capacity of the dam, and
sensitivity and capacity of the downstream channels.Below is an overview discussion of the differentimpacts that may occur when drawing down areservoir.
Downstream – The most obvious impacts of drawingdown the reservoir are the impacts it has downstream.The downstream channel will experience higher flowsand will introduce more energy to the system. This alsoimpacts any basins that the immediate downstreamsystem ties to. Significant reservoir drawdown willimpact the performance of downstream drainage andirrigation systems, introducing a much larger volume ofwater that may exceed their capacity, overwhelmthose systems, and result in unintended flooding.
Environmental – Downstream flood plain habitats andspecies can be significantly impacted by large reservoirdischarges. Raising the level of the downstreamchannel can have negative impacts upon vegetation,significantly increasing the flow and velocity within thechannel can wash away certain species of wildlife anddisrupt migration patterns. In some cases, largereservoir drawdowns can alter the chemicalcomposition of the aquatic environment by changingthe PH levels, salinity, or temperatures, rendering theenvironment unlivable for certain species.
Sedimentation – Releasing water from the reservoirwill often release sediment accumulated behind thedam. Sediment may be deposited in the downstreamchannel, reducing the channel capacity andexacerbating downstream flooding. The release oftrapped sediment can also significantly increaseturbidity in downstream habitats, and can often havedetrimental effects on aquatic wildlife. The US ArmyCorps of Engineers regulates releases from reservoirthrough their Regulatory Guidance letter 05-04USACE, 2005).
Upstream/ Reservoir Rim – Reducing the reservoirlevel significantly can also change the upstreamhabitat, affecting bird nesting and accessibility of waterfor wildlife.
Some reservoirs used for recreational activity such asboating may become unnavigable, inaccessible, orunsafe. If there are structures such as residentialproperties, immediately surrounding the reservoir, a
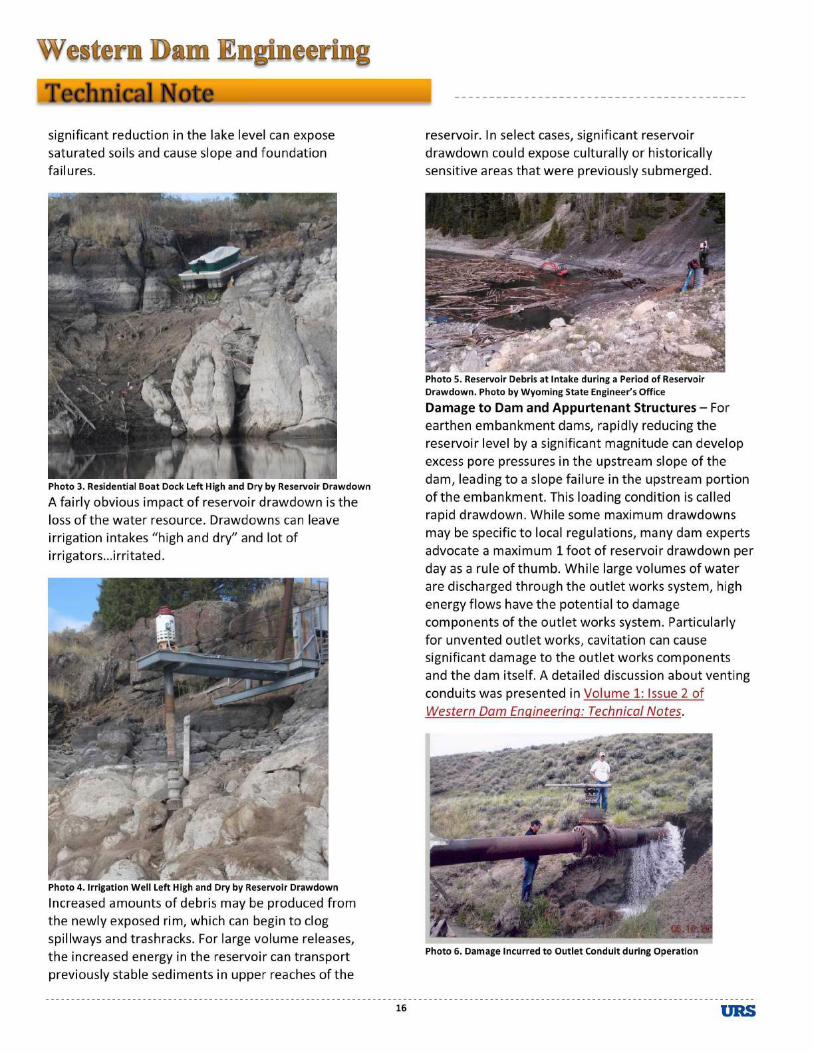
16
significant reduction in the lake level can exposesaturated soils and cause slope and foundationfailures.
Photo 3. Residential Boat Dock Left High and Dry by Reservoir Drawdown
A fairly obvious impact of reservoir drawdown is theloss of the water resource. Drawdowns can leaveirrigation intakes “high and dry” and lot ofirrigators…irritated.
Photo 4. Irrigation Well Left High and Dry by Reservoir Drawdown
Increased amounts of debris may be produced fromthe newly exposed rim, which can begin to clogspillways and trashracks. For large volume releases,the increased energy in the reservoir can transportpreviously stable sediments in upper reaches of the
reservoir. In select cases, significant reservoirdrawdown could expose culturally or historicallysensitive areas that were previously submerged.
Photo 5. Reservoir Debris at Intake during a Period of ReservoirDrawdown. Photo by Wyoming State Engineer’s Office
Damage to Dam and Appurtenant Structures – Forearthen embankment dams, rapidly reducing thereservoir level by a significant magnitude can developexcess pore pressures in the upstream slope of thedam, leading to a slope failure in the upstream portionof the embankment. This loading condition is calledrapid drawdown. While some maximum drawdownsmay be specific to local regulations, many dam expertsadvocate a maximum 1 foot of reservoir drawdown perday as a rule of thumb. While large volumes of waterare discharged through the outlet works system, highenergy flows have the potential to damagecomponents of the outlet works system. Particularlyfor unvented outlet works, cavitation can causesignificant damage to the outlet works componentsand the dam itself. A detailed discussion about ventingconduits was presented in Volume 1: Issue 2 ofWestern Dam Engineering: Technical Notes.
Photo 6. Damage Incurred to Outlet Conduit during Operation

17
ConsiderationsEvery dam should have an up-to-date Operations andMaintenance (O&M) manual. The O&M manual shouldcover all facets of the dam and have detailedguidelines and schedules for releases, if applicable.When developing or updating an O&M, a detailedassessment should be made with respect to all thefactors listed in the previous section of this article. Thismust include a clear understanding of flooding impactsdownstream as assessed by the local engineeringauthority with respect to the varied volumes of waterreleased. The methods for discharging water throughthe outlet works detailed in the O&M manual shouldtake into account the structural capacity of the outletstructures as well as the capacity of the downstreamchannels, such that they do not overwhelm thesystem.
The O&M manual and EAP should have acomprehensive list of stakeholders who are to benotified prior to routine releases as well as unexpectedreleases. This not only includes parties downstream,but parties located upstream who may be impacted aswell. The notifications may have a tiered arrangementdependent on the magnitude of reservoir drawdownexpected. For example, small routine releases mayhave minimal impacts, there may only be a handful ofparties to notify. Conversely, if your dam isexperiencing an emergency and requires an immediatedewatering of the reservoir, your notifications mayinclude numerous communities upstream anddownstream, local jurisdiction officials (Dam SafetyOffice, Department of Water Resource Management,Department of Environmental Protection, federaland/or local wildlife management officials, etc.)utilities, and emergency services.
Depending on the jurisdiction and the scale of yourdam, you may be required to have an EnvironmentalImpact Assessment, which details the effects a majordrawdown has on the local wildlife and habitats. Somedams have established protocols to mitigate some ofthe impacts made by large volume releases.
Inspection of the structural integrity of the dam and itsoutlet works structures should be a routine occurrencefor dam operators. However, if a significant release isanticipated with sufficient lead time, an assessment of
the condition of the outlet works system should bemade. It is common and highly recommended that allof the outlet systems be operated fully, or “exercised”on an annual basis. This can provide notice of damageor operating deficiencies that can be remedied beforea real emergency occurs. Repairs should be made ifpossible before the drawdown; however, if this cannotbe achieved prior to the release, there should be amodification to the discharge methodology to accountfor the deficiencies and monitoring of the system’sperformance during operation. For high head dams, amajor drawdown puts tremendous stress on the damsystem, especially for improperly designed outletsystems or systems with inadequate ventilation (SeeVolume 1: Issue 2). Following a major reservoirdrawdown, the dam structure itself and itsappurtenant structures should be inspected fordamage that may have occurred during the event priorto refilling the reservoir.
Common Pitfalls in Drawdown Designand OperationListed below are possible outcomes of lack of planning,coordination, or infrastructure that can take placewhen drawing down a reservoir.
Releasing water at too high of a rate, causingupstream slope instability and/ or damaging outletworks.
Inadequate notifications leading to flooding ofdownstream areas, disruption of water deliveryservices, or regulatory enforcement actions and/orpenalties.
Unintended habitat destruction or wildlifecasualties.
Major alterations of downstream channelconditions, such as scouring or shoaling.
Property damage both upstream and downstream.
Inability to drawdown reservoir due to lack of low-level outlet or siphon, sedimentation or debrisbuildup, or improper design of outlet worksinverts.
Unvented outlet works during high head releasesthat lead to cavitation in pipes and outlet worksstructures.
18
Uncontrollable flow during release due to inabilityto adjust or throttle valves and/ or gates because oflack of design or maintenance.
It is a fact of life that dams pose hazards of varyingdegrees to the populations and environmentssurrounding them. But with proactive understanding ofthe capabilities and limitations of our dam systems,identification of the potential impacts around them,and proper coordination, these effects can bemitigated by planning and if necessary, modification.Having an operable system to allow controlledreservoir releases is imperative to the safe operationof dams, both small and large.
Useful References1] French, Richard. (1984). Salinity in Watercourses and Reservoirs.
Massachusetts: Butterworth Publishers2] State of Colorado: Department of Natural Resources. (2007). Rules
and Regulations for Dam Safety and Dam Construction3] United States Department of the Army: US Army Corps of Engineers.
1975). ER-1110-2-50: Low-Level Discharge Facilities for Drawdown ofImpoundments
4] United States Department of the Army: US Army Corps of Engineers.2003).EM 1110-2-1902: Slope Stability
5] United States Department of the Interior: US Bureau of Reclamation.1987).Design of Small Dams
6] United States Department of the Interior: Bureau of Reclamation.1990). Criteria and Guidelines for Evacuating Storage Reservoirs and
Sizing Low-Level Outlet Works7] United States Department of the Interior: Bureau of Reclamation.
2011).Appurtenant Structures for Dams (Spillway and Outlet Works)Design Standards
8] US Army Corps of Engineers, Regulatory Guidance Letter 05-04,August 19, 2005, Guidance on the Discharge of Sediments From orThrough a Dam and the Breaching of Dams, for Purposes of Section404 of the Clean Water Act and Section 10 of the Rivers and HarborsAct of 1899

19
Dam Overtopping Failures – Lessons Learned from theSeptember 2013 Colorado FloodEvent
IntroductionDuring the September 2013 flooding in Colorado, ninelow hazard dam failures were documented. Forensicinvestigations for several of these dams identifiedpossible causes of failure. This article shares thosepossible causes of failure and the lessons learned. It isthe intent of this article for engineers and dam ownersalike to apply the lessons learned to low hazard damsin an attempt to preserve these vulnerable butvaluable structures from failure during events largerthan those for which they were designed.
The potential for an earthen embankment dam tosurvive an overtopping event depends on the conditionof the dam at the time of the event, the materials usedto construct the embankment, the duration and depthof overtopping, and the duration and intensity of thestorm event. Small, low hazard embankment dams aretypically designed for rain events with return periodsbetween 25 and 100 years. Unlike high and significanthazard dams, most low hazard dams are not designedto safely pass large, infrequent storms and aretherefore susceptible to damage and failure duringinflow events greater than a 100-year type of event.Higher hazard dams have more stringent spillwaydesign standards due to the consequences associatedwith their failures. Although consequences to thedownstream public due to failure of low hazard damsare less severe, the value of these structures to theirowners can be considerable.
In this article, case histories of dam overtoppingfailures that occurred during the September 2013storm event are presented. Each dam’s condition andperformance during the event are reviewed andlessons learned following these dam failures arediscussed.
The dam failures presented in this article include:
x The Upper and Lower Emerald Valley Dams locatedin the Pikes Peak Region of El Paso County
x A series of five dams on the Little Thompson Riverin the Big Elk Meadows Subdivision within Larimerand Boulder Counties
x Carriage Hills No. 2 Dam near Estes Park
The lessons learned presented in this article may beold hat for some readers, but it is beneficial for the lessexperienced dam engineer and owner to understandthe sensitivity of dam performance to some of thesemore common-knowledge issues.
September 2013 Storm Event inColoradoThe historic rainfall event that occurred betweenSeptember 8th and 18th, 2013 was responsible forextensive flooding along the Colorado Front Range,extending from El Paso County in the south to LarimerCounty in the north over an area of approximately11,000 square miles. During this event, severalindividual storms contributed to the overallprecipitation totals; however, a large storm event thatoccurred on September 12 and ended September 13,2013 was the most significant contributor to the damfailures, setting a one-day rainfall record for ColoradoDoesken 2014). The September 2013 event was one
of the top three extreme storms documented inColorado (Doesken 2014). The maximum measuredrainfall for the September 2013 storm was recordednear the town of Boulder and resulted in 20 inches ofprecipitation over a 10-day period.
Emerald Valley DamsThe Upper and Lower Emerald Valley Dams (UEV andLEV) are located on Little Fountain Creek on U.S. ForestService property in the Emerald Valley Ranch Resort,about 6.5 miles southeast of the Pikes Peak summit.An aerial image of the dams is shown in Photo 1. Bothdams are classified as low hazard.
Due to their small sizes and remote locations, thedams were not previously regulated and noinformation about the dams was available. The existingcondition of the dams was inferred based onconditions observed post-failure and from informationobtained as part of the design and reconstruction ofthese two dams.

20
Photo 1: Aerial image of UEV and LEV Dams.
Based on post-failure survey data, the UEV Dam wasestimated to have a maximum height of 12 feet andstorage capacity of approximately 6.4 acre-feet. TheLEV Dam was a larger structure, with an estimatedmaximum height of 14 feet and storage capacity ofapproximately 11.4 acre-feet.
Post-failure inspections of the UEV Dam identified atleast eight pipelines penetrating through theembankment and ranging in diameter from 8 to 30inches (see Photo 2). The pipe penetrations were theonly means for releasing inflows from the reservoir,since the UEV Dam did not have an emergencyoverflow spillway. Additionally, a septic tank wasobserved embedded within the left abutment of theembankment with pipelines extending parallel to thedam crest to a leach field on the right abutment. It wasalso observed that the dam crest elevation was notuniform along the length of the dam and containedseveral low areas.
Photo 2: UEV Dam post-failure looking upstream.
Similar to the UEV Dam, post-failure inspections of theLEV Dam revealed the dam crest elevation was notuniform along the length of the dam and containedseveral low areas. Post-failure inspections alsoindicated the dam was constructed on a timberfoundation to support the embankment over organicfoundation materials with a timber cutoff wallconstructed below the core of the dam. The principalspillway for the LEV Dam was a 3-foot-diametercorrugated metal pipe (CMP) drop inlet located nearthe left abutment. It is unknown if a trashrack wasinstalled at the inlet to the pipe. An emergencyspillway also consisting of a 3-foot-diameter CMP wasfound near the right abutment. The elevations of theprincipal and emergency spillways are unknown, but itis likely the emergency spillway was higher in elevationthan the principal spillway and would only be active inlarge floods, such as the September 2013 storm. An 18-inch diameter steel low-level outlet was observed nearthe central portion of the dam, but it is unknown if theoutlet was operational or had a trashrack.
In 1997, the LEV Dam had reportedly failed. Thedownstream slope in the area of the breach wasreconstructed with a relatively steep slope comparedto other areas of the downstream slope that werefairly gentle. Aerial photos indicate the 2013 failureoccurred at the same location as the 1997 failure. TheLEV Dam repairs completed in 1997 may havecontributed to the 2013 failure of the dam, consideringthe relatively steep reconstructed downstream slope inthe area of the failure. It is also likely the timberfoundation was also not repaired. Photo 3 belowshows the LEV Dam post-failure.
Photo 3: LEV Dam post-failure looking upstream.
According to an eyewitness account, the LEV Damovertopped and failed first, followed by overtoppingand failure of the UEV Dam. Hydrologic modeling
UEV Dam
LEV Dam

21
completed as part of the failure investigation supportsthe eyewitness account that the dams overtoppedduring the storm event. Failure of the dams wasprimarily attributed to backward headcutting erosionduring the overtopping process. Variations in elevationalong the crests of both dams concentrated theovertopping flows in low spots, thereby acceleratingthe headcutting process. The duration and depth ofovertopping sustained prior to failure is unknown.During the flood, several attempts were made toremove debris from the spillways at the LEV Dam.
Emerald Valley Dams – Lessons Learned andMitigation Measuresx Non-uniform dam crest elevations promote
concentrated flow in low spots during overtopping,and thus increase erosion due to headcutting. Tominimize overtopping erosion and mitigate damfailure, areas where the dam crest is uneven orfalls below the design freeboard should be filledand repaired.
x Irregularities (depressions, oversteepened areas,animal burrows, etc.) and obstructions (pipes,debris, and large vegetation) along the upstreamand/or downstream slopes generate concentratedand turbulent flows that increase erosion potentialand headcutting. To minimize erosion and mitigatefailure, it is ideal to have a uniform downstreamslope. Locally steepened sections of embankmentsshould be graded uniformly to provide a consistentdam cross section along the entire length of theembankment.
x Multiple pipeline penetrations through theembankment with no filter zones result inbackward erosion piping or failure due to pipedeterioration and defects. Debris within thesepipes also prevents flood water from discharging,leading to overtopping of the dam. To mitigatefailure, outlet works should be maintained so thatthey operate as intended. If trashracks areassociated with these structures, they should bekept free of debris and possibly cleaned as floodevents are approaching and/or occurring.
x Vegetation and debris in the spillway prevent floodwater from discharging fast enough to preventovertopping of the dam. To limit dam overtoppingand mitigate failure, the spillway should bemaintained and kept free of vegetation and debris
so that it can operate as designed. An openchannel overflow spillway has less potential forclogging when compared to the “piped” spillwaysused at the LEV Dam.
x Modifications and repairs that are not performedsatisfactorily may contribute to dam failure.Modifications and repairs to existing small damsshould be designed by engineers familiar with thestate-of-practice for dam engineering andreviewed by appropriate regulatory agencies.
Dams near Big Elk MeadowsThe Big Elk Meadows complex consists of five dams inseries, including (listed from upstream todownstream): Sunset Lake Dam, Rainbow Lake Dam,Willow Lake Dam, Mirror Lake Dam, and Meadow LakeDam. The dams are situated on the West Fork of theLittle Thompson River within the Big Elk MeadowsSubdivision, located approximately 5 miles upstream ofUS 36 along Larimer County Road 47. Sunset Lake Damis located in northwestern Boulder County, whereasthe other four dams are located in southwesternLarimer County. An aerial image of the five dams isshown in Photo 4.
Photo 4: Aerial image of Big Elk Meadows dams.
Meadow Lake Dam is classified as jurisdictional, lowhazard. All other dams are classified as non-jurisdictional, low hazard. Since Meadow Lake Damwas classified as jurisdictional, it received regularinspections with the most recent inspection completedin 2008. Limited information was available for theother dams.
Sunset Lake Dam
Rainbow Lake Dam
Willow Lake Dam
Meadow Lake Dam
MirrorLake Dam

22
Based on available data, Sunset Lake Dam had amaximum height of 6 feet with a maximum storagecapacity of 19.3 acre-feet. Rainbow Lake Dam, WillowLake Dam, and Mirror Lake Dam each had a maximumheight of 10 feet with maximum storage capacities of49.0, 59.6, and 29.9 acre-feet, respectively. MeadowLake Dam had a maximum height of 10.1 feet with amaximum storage capacity of 90.4 acre-feet. In 2012,the Meadow Lake Dam outlet works was replaced.
A hydrologic study completed for Meadow Lake Damindicated the spillway was adequate to pass the InflowDesign Flood (IDF) for a minor0F1, low hazard dam (50-year event). A spillway adequacy study was notcompleted for the other Big Elk Meadows dams;however, documents pertaining to the dams indicatethey all had spillway structures that were likely sized topass the 25-year storm event. The general condition ofthe dams was thought to be good, Photos 5 and 6show Sunset Lake Dam after the failure.
Photo 5: Sunset Lake Dam post-failure looking acrossand downstream from left abutment.
Hydrologic modeling was performed as part of thefailure investigation to estimate peak runoff producedby the rainfall. The analyses showed Sunset Lake Damfailed before its rainfall-induced peak discharge.Willow Lake Dam and Rainbow Lake Dam failedapproximately 2.5 to 3 hours after their rainfall-induced peak discharges, followed by Meadow LakeDam, which failed about 4 hours after its peakdischarge. Mirror Lake Dam failed about 16 hours after
1 Jurisdictional size dam that does not exceed 20 feet injurisdictional height and/ or 100 acre-feet in capacity (CO2007)
its peak discharge. The significant volume of inflow inconjunction with the small volume of Sunset Lake likelycontributed to the failure of Sunset Lake Dam prior tooccurrence of the peak discharge
Photo 6: Downstream slope of Sunset Lake Dam afterovertopping looking from left abutment.
The cause of failure for these dams was overtopping,erosion, and formation of a breach. Both Willow LakeDam and Meadow Lake Dam failed as a result ofconcentrated flows at low areas in the dam crests nearthe left abutments. Photos 5 through 10 show eachdam after failure.
Photo 7: Rainbow Lake Dam post-failure lookingacross from left abutment.

23
Photo 8: Willow Lake Dam post-failure lookingdownstream near left abutment.
Photo 9: Mirror Lake Dam post-failure lookingdownstream from left abutment.
Photo 10: Meadow Lake Dam post-failure lookingdownstream from within reservoir.
At the time of failure of Willow Lake Dam, RainbowLake Dam, Mirror Lake Dam, and Meadow Lake Dam,flood flows were receding, but the dams were stillbeing overtopped. Overtopping durations generallyranged from 7 to 13 hours, with estimated depths upto about 3 feet. The table below summarizes theapproximate overtopping durations and depths foreach of the dams. The increases in flows due to the
dam failure discharges never approached the peakdischarges that had already occurred.
Table 1: Summary of Overtopping Duration and Depth
DamOvertopping
Duration
hours)
Surveyed
Overtopping Depth1ft)
Sunset Lake Dam 7 1.11
Rainbow Lake Dam 12 2.65 (3)
Willow Lake Dam 12 0.24
Mirror Lake Dam Unknown 3.42 (2)
Meadow Lake Dam 13 1.90
Note: (1) Value in parenthesis is maximum depth reported by eyewitnesses.
The September 2013 storm was not the first extremeflood event on the Little Thompson River watershed.The “Big Elk Meadows Storm” occurred in May of1969, establishing the highest recorded peak dischargeon the Little Thompson River. There were no reports ofdam failures during the 1969 storm. While both the1969 and 2013 storms had similar magnitudes ofrainfall, the damaging flows of the 2013 storm areattributed to the duration of the rainfall. In the 1969storm, rain fell steadily over a 3-day period, whereas inthe 2013 storm the majority of rain fell during a 12- to18-hour period. The Little Thompson River could notsustain the rapid rate of rainfall runoff due to the moreintense, shorter duration 2013 storm, thus resulting ina higher rainfall-induced peak discharge and moredamaging flows.
Big Elk Meadows Dams – Lessons Learned andMitigation Measuresx Concentrated flows develop at low spots along a
dam crest during overtopping, which increaseserosion. Both Willow Lake Dam and Meadow Lakedam failed near the left abutment, where theircrest elevations were lower. To minimizeovertopping erosion and mitigate dam failure,areas where the dam crest is uneven or falls belowthe design freeboard should be filled and repaired.
x Well maintained, low hazard embankment damswith uniform crest elevations and good vegetationcover (Photo 6) can survive overtopping durationsin excess of 7 hours with depths up to 3 feet. Dambreach (i.e., dam failure) does not always occurimmediately following dam overtopping. It iscommonly assumed that dam overtopping is

24
equivalent to dam failure; however, this is notnecessarily true. Dams may overtop in the eventof a flood, but failure occurs only whenovertopping forms a dam breach.
x The duration of rainfall during a storm eventimpacts the severity of damaging flows. Longerduration, lower intensity storms have a slower rateof rainfall runoff within the watershed, allowing formore infiltration and lower peak discharges.Shorter duration, more intense storms have amore rapid rate of rainfall runoff, leading to higherpeak discharges and more damaging flows.
Carriage Hills No. 2 DamCarriage Hills No. 1 and No. 2 Dams (CH1 and CH2) arelocated in a residential development about 2.25 milessoutheast of downtown Estes Park. CH1 Dam islocated just upstream of CH2 Dam. An aerial image ofthe two dams is shown in Photo 11. Both dams areclassified as low hazard.
Photo 11: Aerial image of CH1 and CH2 Dams.
Both dams were overtopped during the September2013 event. CH1 Dam survived the overtopping eventwith some erosion damage, while CH2 Dam failed.
There is little information available for CH1 Dam. CH2Dam was designed as a zoned earthen embankmentdam with 2H:1V (horizontal to vertical) upstream anddownstream slopes, a height of approximately 20 feet,and crest width of 10 feet. Both dams have/ had a low-level CMP outlet conduit and uncontrolled overflowspillway. There is no information available pertainingto the size and capacity of the outlet works andspillway at CH1 Dam. At CH2 Dam, the outlet worksconsisted of a 24-inch-diameter, 12 gauge CMP with anupstream slide gate and reported capacity of 35 cubicfeet per second (cfs). The spillway at CH2 Dam wasdesigned to have a 10-foot bottom width, 5 feet of
freeboard below the dam crest, and capacity of 377cfs.
Inspection reports for CH2 Dam dated 1983, 1985,1986, 1991, 2002, and 2008 describe conditions withtrees and brush growing on the dam and obstructingspillway flow. In 2008, the spillway was reportedlyrehabilitated; however, it was not restored to thedesign size and capacity.
Results from a post-failure survey indicated the CH2dam and spillway were actually smaller in size thandesigned. The dam had a height of approximately 10feet and crest width of 6.5 feet. The spillway had a 4-foot bottom width, 3.4 feet of freeboard, and acapacity of 213 cfs during the time of the September2013 flood. The maximum storage capacity was notreported, but was estimated for CH2 Dam to be 12.7acre-feet at the dam crest based on post-failureanalyses.
Prior to failure of CH2 Dam, the dam crest wasovergrown with trees and shrubs, which can be seen inPhoto 12. The spillway was also overgrown withshrubs and small willow trees, as shown in Photo 13.Previous inspection reports noted low areas along thedam crest, specifically in the area of the outlet worksconduit.
Photo 12: CH2 Dam post-failure looking downstreamfrom reservoir. Note heavy vegetation on dam crest.
Carriage Hills No. 2 Dam
Carriage Hills No. 1 Dam
Dam Breach

25
Photo 13: CH2 Dam spillway looking downstream.Note heavy vegetation in spillway.
The overtopping of CH2 resulted in a breach of theembankment, whereas CH1 survived the overtoppingevent with some scour erosion on the downstreamslope, primarily around trees. Overtopping durationsand depths are not known. However, significantovertopping of CH1 Dam and at least minorovertopping of CH2 Dam was observed, as shown inPhotos 14 and 15. The larger overtopping depth of CH1Dam was attributed to the smaller spillway capacity atCH1 Dam compared to CH2 Dam, based on visualinspection and an overgrowth of small willows in thespillway. During the flood, the willows mattedtogether, forming a 2-foot-wide notch through whichflow was concentrated (see Photo 16).
Photo 14: CH1 Dam overtopping.
Photo 15: CH2 Dam overtopping.
Photo 16: 2-foot-wide notch formed in CH1 Damspillway.
A post-flood survey indicated the dam crest at CH1 wasrelatively level and the embankment was observed tohave a well-maintained vegetation cover. This allowedfor overtopping flows to be distributed relativelyevenly along the embankment, thus contributing tothe dam’s survival.
Conversely, based on the post-flood survey it appearedthat CH2 Dam failed due to concentrated flow over alow area on the dam crest. Headcutting damage wasobserved at the downstream slope of the rightabutment and to the left of the dam breach. Existingvegetation and debris that had collected in the spillwaymay have partially restricted flood flow and resulted ingreater overtopping flows over the embankment. Theinadequate capacity of the spillway at CH2 Dam likelyalso resulted in greater overtopping flows. Thereservoir inflow was estimated to be between 237 and508 cfs compared to the spillway capacity, which wasestimated to be 212 cfs at the time of flooding. It ispossible that had the spillway been cleared ofvegetation with a backhoe before or during the flood,the spillway may have passed enough flow to allow the
CH2 Dam Crest

26
dam to not overtop or to overtop with sufficiently lessflow depth and duration to avoid the breach.
Carriage Hills No. 2 Dam - Lessons Learned andMitigation Measuresx Non-uniform dam crest elevations promote
concentrated flow in low spots during overtopping,and thus increase erosion due to headcutting. Tominimize overtopping erosion and mitigate damfailure, areas where the dam crest is uneven orfalls below the design freeboard should be filledand repaired.
x Large or wooded vegetation, such as trees, bushes,or shrubs do little to protect the dam duringovertopping events, but rather developconcentrated flow areas and accelerateheadcutting. To minimize headcutting and mitigatefailure, vegetation on the downstream slopeshould be restricted to well-maintained grasses.
x Vegetation and debris in the spillway prevent floodwater from discharging fast enough to preventovertopping of the dam. To limit dam overtoppingand mitigate failure, the spillway should bemaintained and kept free of vegetation and debrisso that it can operate as designed. EmergencyAction Plans that include procedures for clearingthe spillway and/or sandbagging the dam crest inthe event of a large storm could help save the damin some overtopping situations.
x Spillways that are not constructed as designed canbe inadequate in passing flows during larger stormevents and result in dam overtopping. To mitigatefailure, the spillway should be maintainedaccording to the original design.
Parting Thoughts
Although it may seem like a no-brainer that theseadverse conditions may cause adverse performance ofyour dam, these conditions are frequently observedduring dam inspections. This indicates either a lack ofunderstanding of their importance, or a lack ofunderstanding of the proactive stewardship thatcomes with being the responsible owner or designer ofa dam.
References1] State of Colorado (CO), Rules and Regulations for Dam Safety and
Dam Construction, January 1, 2007.2] Hydrometeorological Design Studies Center National Weather Service,
National Oceanic and Atmospheric Administration, ExceedanceProbability Analysis for the Colorado Flood Event, 9 -16 September2013, 1325 East-West Highway, Silver Spring, MD 20910, 17September 2013.
3] Doesken, Nolan,2014, Risk and Response, Presentation at 2013Colorado Flood Forum, February 27, 2014, CASFM Conference,Broomfield, CO.
4] FEMA 473, 2005, Technical Manual for Dam Owners: Impacts ofAnimals on Earthen Dams, Federal Emergency Management Agency,September.
5] FEMA 534, 2005 Technical Manual for Dam Owners: Impacts of Plantson Earthen Dams, Federal Emergency Management Agency,September.
6] FEMA P-1015, 2014, Technical Manual: Overtopping Protection forDams, Federal Emergency Management Agency, May.