
A PARTIAL EQUILIBRIUM ANALYSIS A Thesis Presented to In ...
118
A PARTIAL EQUILIBRIUM ANALYSIS OF GLOBAL FERTILIZER SUPPLY AND DEMAND A Thesis Presented to The Faculty of the Graduate School University of Missouri In Partial Fulfillment Of the Requirements for the Degree Master of Science in Agricultural and Applied Economics by MATTHEW P. STEINER Dr. Patrick Westhoff, Thesis Supervisor MAY 2014
Transcript of A PARTIAL EQUILIBRIUM ANALYSIS A Thesis Presented to In ...

A PARTIAL EQUILIBRIUM ANALYSIS
OF GLOBAL FERTILIZER SUPPLY AND DEMAND
A Thesis
Presented to
The Faculty of the Graduate School
University of Missouri
In Partial Fulfillment
Of the Requirements for the Degree
Master of Science in Agricultural and Applied Economics
by
MATTHEW P. STEINER
Dr. Patrick Westhoff, Thesis Supervisor
MAY 2014

APPROVAL FORM
The undersigned, appointed by the Dean of the Graduate School, have examined the
thesis entitled
A PARTIAL EQUILIBRIUM ANALYSIS
OF GLOBAL FERTILIZER SUPPLY AND DEMAND
Presented by Matthew P. Steiner
A candidate for the degree Master of Science in Agricultural and Applied Economics
And hereby certify that in their opinion it is worthy of acceptance
Professor – Dr. Patrick Westhoff
Adjunct Professor – Dr. John Kruse
Extension/Research Professor – Dr. Bill Wiebold

ii
ACKNOWLEDGEMENTS
This thesis would not have been possible without the support of my family, friends, co-
workers, and mentors. I would like to give a special thank you to Dr. Patrick Westhoff,
Dr. John Kruse, and Dr. Bill Wiebold for serving on my thesis committee and providing
valuable insight that has helped me finish this thesis.
I would also like to give a huge thank you to my fiancé, Jillian. Without your editing
expertise and your kind and understanding heart, I would be lost. The home-cooked
meals that you have provided for me when I was stuck at the office and the support you
have given me have been a blessing.

iii
TABLE OF CONTENTS
ACKNOWLEDGEMENTS ................................................................................................................................... ii
TABLE OF CONTENTS ...................................................................................................................................... iii
LIST OF ILLUSTRATIONS ................................................................................................................................... v
ABSTRACT ....................................................................................................................................................... vi
INTRODUCTION ........................................................................................................................................... 1
INDUSTRY OVERVIEW ................................................................................................................................. 5
General Fertilizer Industry Overview ...................................................................................................... 5
Nitrogen Fertilizer Overview ................................................................................................................ 12
Phosphorus Fertilizer Overview ............................................................................................................ 16
Potassium Fertilizer Overview .............................................................................................................. 18
LITERATURE REVIEW ................................................................................................................................. 21
Demand Literature ............................................................................................................................... 21
Supply Literature .................................................................................................................................. 27
THEORETICAL ASPECTS OF SUPPLY AND DEMAND ................................................................................... 30
Profit Maximization – Derived Demand ............................................................................................... 30
Profit Maximization – Supply ................................................................................................................ 33
DATA DISCUSSION ..................................................................................................................................... 37
Demand Data ........................................................................................................................................ 37
Supply Data ........................................................................................................................................... 39
Exogenous Variables ............................................................................................................................. 40

iv
Prices .................................................................................................................................................... 40
Data Adjustments ................................................................................................................................. 49
MODEL SPECIFICATION ............................................................................................................................. 50
Supply Specifications ............................................................................................................................ 50
Demand Specifications ......................................................................................................................... 54
Solving the Model ................................................................................................................................. 56
BASELINE RESULTS .................................................................................................................................... 58
Supply ................................................................................................................................................... 58
Demand ................................................................................................................................................ 60
Fertilizer Prices ..................................................................................................................................... 64
FERTILIZER MARKET SCENARIOS ............................................................................................................... 72
Scenario 1 – Natural Gas Price Shock ................................................................................................... 72
Scenario 2 – U.S. Ammonia Farm Price Tax .......................................................................................... 74
Scenario 3 – Decrease in U.S. Corn Area .............................................................................................. 77
SUMMARY AND CONCLUSIONS ................................................................................................................ 81
Future Research .................................................................................................................................... 82
Conclusion ............................................................................................................................................ 84
REFERENCES .................................................................................................................................................. 85
APPENDIX A ................................................................................................................................................... 91
APPENDIX B ................................................................................................................................................. 107

v
LIST OF ILLUSTRATIONS
Figure 1.1 - 2011 World Nitrogen Fertilizer Use .............................................................................................. 9
Figure 1.2 – 2011 World Nitrogen Fertilizer Production ................................................................................. 9
Figure 1.3 – 2011 World Phosphorus Fertilizer Use ...................................................................................... 10
Figure 1.4 – 2011 World Phosphorus Production ......................................................................................... 10
Figure 1.5 – 2011 World Potassium Fertilizer Use ........................................................................................ 11
Figure 1.6 – 2011 World Potassium Production ............................................................................................ 11
Figure 1.7 – Global Natural Gas Prices .......................................................................................................... 16
Figure 1.8 – Potash Fertilizer Production Flow-Diagram ............................................................................... 19
Figure 3.1 – Own-Price Elasticities of Demand for Nitrogen, Phosphorus, and Potassium .......................... 28
Figure 3.2 – Output Price Elasticities of Demand for Nitrogen, Phosphorus, and Potassium ....................... 29
Figure 5.1 – U.S. and Canada Industrial Natural Gas Prices .......................................................................... 43
Figure 5.2 Global Port Ammonia Prices ......................................................................................................... 48
Figure 5.3 Global Port DAP/MAP Prices ........................................................................................................ 48
Figure 5.4 Global Port Potash Prices ............................................................................................................. 49
Figure 7.1 – U.S. Ammonia Profit Margin ...................................................................................................... 65
Figure 7.2 – U.S. DAP Profit Margin ............................................................................................................... 67
Figure 7.3 – U.S. Potassium Chloride Price .................................................................................................... 68
Figure 7.4 – U.S. Nitrogen Fertilizer Supply and Demand ............................................................................. 69
Figure 7.5 – U.S. Phosphorus Fertilizer Supply and Demand ........................................................................ 70
Figure 7.6 – U.S. Potassium Fertilizer Supply and Demand ........................................................................... 71
Figure 8.1 – 10% Increase of North American Natural Gas Prices................................................................. 73
Figure 8.2 – 10% Tax on U.S. Farm-Level Ammonia Prices ............................................................................ 75
Figure 8.3 – Sustained 10% Decrease of U.S. Corn Acreage from WAEES Baseline Levels ........................... 77

vi
ABSTRACT
Prices of nitrogen and phosphorous fertilizer spiked between 2008 and 2012. A partial
equilibrium model of global nitrogen, phosphorus, and potassium fertilizer markets is
constructed that is capable of producing a baseline of economic variables against which
the impacts of various alternative scenarios can be evaluated. A 10% tax on farm-level
nitrogen fertilizer in the United States would decrease domestic use in 2013 by 2.2%,
suggesting that a very high tax might be required to obtain large reductions in nitrogen
fertilizer use. A 10% increase to North American natural gas prices resulted in a long-run
decrease in U.S. nitrogen fertilizer production of 2.4%, and long-run decreases in
production in foreign markets of 0.1%. A 10% decrease in U.S. corn acreage was
projected to reduce U.S. nitrogen, phosphorus, and potassium fertilizer use by 4.1%, 3%,
and 2.5% in 2013, respectively, leading to moderate decreases in fertilizer prices and
smaller reductions in domestic production.

1
CHAPTER ONE
INTRODUCTION
The purpose of this research is to develop an economic model of nitrogen, phosphorus,
and potassium (NPK) supply and use in the U.S. and other selected countries for market
and policy analysis. This model will produce a baseline of economic variables that can be
used in combination with scenario analysis to better understand the implications of
potential changes in government policies and market conditions.
Countries of interest for this study are Canada, China, India, Russia, and the United
States. A “Rest of World” (ROW) region completes a global model. Each of these
countries was identified as being a top five producer or consumer of at least one
fertilizer nutrient. Future research could expand upon this model by adding additional
countries to increase the level of detail.
Objectives:
1. Provide baseline estimates of nitrogen, phosphorus, and potassium supply and
demand variables
3. Estimate fertilizer prices in modeled countries
4. Analyze impacts of policy changes and modifications to model assumptions
A. Sustained 10% increase in North American natural gas prices from 2013 to
2030

2
B. Sustained 10% tax on U.S. farm-level ammonia prices from 2013 to 2030
C. Sustained 10% decrease of U.S. corn acreage from 2013 to 2030
A large unknown is the responsiveness of farmers to fertilizer and commodity prices. If
unresponsive, as recent literature would suggest, then a lower price for fertilizer may
not cause application rates to react strongly. Employing a partial equilibrium model
using up to date market information and elasticities from fertilizer market studies will
produce a snapshot of the future that can provide useful insight for analyzing policy
options and changes in market factors.
One such policy issue revolves around the contention that farmers over-apply fertilizers
used in the production of agricultural commodities. The farmer’s nutrient application
decision is subject to uncertainty in weather (Babcock 1992). When rainfall,
temperature and other conditions are optimal, plants have higher yield potential than
under average or poor growing conditions. Plants are able to utilize higher levels of
nutrients under such conditions. Given the weather related uncertainty, it is
economically optimal for producers to apply more nutrients than would be necessary
under normal conditions in order to avoid applying suboptimal levels if conditions
become more favorable for crop growth. When fertilizer is relatively cheap, producers
will rationally choose to apply more fertilizer than plants can use under normal or poor
weather conditions and nutrient run-off and leaching can become increasingly
prevalent. Therefore, a policy targeted at reducing this behavior may be considered by
policy makers.

3
A commonly researched remedy to this problem is a tax aimed at adjusting the farmer’s
application rate decision. When nutrients are over-applied relative to yield potential or
applied prior to rain, there is an increased risk of nutrient running off into streams or
leaching into groundwater. Fertilizer run-off can damage the ecosystem of rivers and
bodies of water further downstream from the source of pollution. The Environmental
Protection Agency (EPA) believes that fertilizer use in the United States has contributed
to hypoxia in the Gulf of Mexico and that improved fertilizer management can help to
reverse this damage (EPA 2007). Dead zones, such as the one found in the Gulf of
Mexico, are caused by increased levels of nitrogen and phosphorus in the water, two
major nutrients used as inputs in farming. The United States Geological Survey (USGS)
estimates that more than 70% of this pollution comes from agricultural sources (EPA
2014). Heightened levels of nitrogen and phosphorus can allow the formation of algal
blooms that reduce the level of oxygen in the water making the habitat unsuitable for
many forms of marine life. A policy aimed at reducing nutrient over-application would
help reduce unintentional pollution.
Output from the model created for this thesis will be used to produce estimates of
supply and demand variables and prices for nitrogen, phosphorus, and potassium
fertilizers from 2013 to 2030. Performing scenario analysis and comparing resulting
model output to this baseline yields important information to decision makers and can
help individuals better understand the effects of both policy decisions and other factors
that can affect fertilizer supply and demand. While not performed as part of this thesis
research, linking this model of fertilizer markets to a larger system of partial equilibrium

4
models would show the effects of changes in the fertilizer sector on other commodity
markets. Additional information about how these changes in fertilizer markets can
affect a broader range of commodity markets can help individuals make more informed
decisions.
When used in combination with other agricultural crop models, output from this
fertilizer model can be used to enhance the accuracy of crop cost of production
estimates. For instance, two outputs from this fertilizer model are the nitrogen
application rate per acre of corn and the price of ammonia. With some manipulation of
the units of both variables, the two can be multiplied to get the portion of the cost of
production that can be attributed to nitrogen fertilizer use. This process can be
replicated for the remaining nutrient varieties and utilized in estimating the expected
net returns that drive crop supply decisions in crop market models. This is one example
of how a fertilizer model can be used in combination with other agricultural models.
Constructing the model for this thesis requires an understanding of the fertilizer
industry, a review of relevant previous literature, a theoretical background, and
available sources of data. The model for this thesis was assembled in order to test the
effects of relevant policy options and examine the effects of other factors on supply and
demand in fertilizer markets. Each of these issues has implications on how a model is
structured and directly affects the way the model responds to changes in the market.
Subsequent chapters will describe these issues in fine detail, as well as results of the
baseline projections and analysis of alternative scenarios.

5
CHAPTER TWO
INDUSTRY OVERVIEW
The goal of this chapter is to give an overview of the global fertilizer industry with a
specific focus on the United States. The first section will explore the fertilizer industry as
a whole and subsequent sections will look more closely at individual nutrient industries.
General Fertilizer Industry Overview
Global fertilizer producers provide key inputs for agricultural crop production. Fertilizer
use has allowed for increased yields of agricultural commodities adding to the farmer’s
ability to feed the planet. While fertilizers are generally categorized by major nutrient
type, many combinations of NPK nutrients are achievable and can be purchased by the
farmer to fit specific soil requirements. As technology has advanced over time, farmers
have become more efficient in their use of fertilizers. The most efficient users can
distribute nutrients to the soil based on specific requirements for each acre rather than
applying fertilizer at a flat rate across an entire field.
For farmers in the United States and abroad, nitrogen fertilizers are applied in the
largest quantities accounting for about 61% of global fertilizer use and 59% of fertilizer
use in the United States in 2011. The remainder of fertilizer use in the United States is
split between phosphorus and potassium at 20% and 21%, respectively. Global
consumption is similarly distributed with phosphorus accounting for 22% of global use
and potassium 17%. While each nutrient is very important for production of agricultural

6
commodities, the majority of the focus on policy analysis and industry discussion for this
thesis will be on nitrogen fertilizer markets (FAO 2014).
New production facilities are costly to build and take a significant amount of time to
complete. Greenfield projects are those that are built in a location where there was not
a fertilizer facility previously. Brownfield projects are built where preexisting
infrastructure such as railways can be reutilized. Since certain infrastructure can be
reused, these two types of building projects may have different total costs of
production.
A greenfield ammonia facility with a capacity of one million metric nutrient tons costs
between 1.8 billion and 2 billion dollars to construct (PotashCorp 2013a). To put this
into perspective, in 2011, global production of nitrogen fertilizers, by nutrient weight,
was 110.5 million metric tons (FAO 2014). This means that to expand global production
potential of nitrogen fertilizers by less than 1% would require an investment of around 2
billion dollars. Similarly, a phosphate facility of the same capacity requires estimated
costs of 2.1 billion to 2.3 billion dollars, and a potash facility with a capacity of 2 million
metric nutrient tons is estimated to cost 4.7 billion to 6.3 billion dollars (PotashCorp
2013a). A discussion of why these costs differ will be included in further detail in the
following overview sections.
Considering the presence of high industry concentration and the significant investment
required to build a new production facility, it is reasonable to assume that there are
high barriers to entry in both the fertilizer industry itself and in the individual nutrient

7
markets. These barriers to entry may allow firms to maintain positive economic profits
as potential entrants into the market may be unable to afford the costs of building a
facility large enough to compete with the lower average fixed costs associated with
larger production facilities.
Fertilizer application rates per hectare in the United States and most high-income
countries are high and relatively stable. If this pattern continues, any significant future
demand growth in countries like the U.S. would have to come from increases in crop
acreage rather than increases in application rates. Alternatively, shifts from crops that
have lower nutrient requirements (soybeans) to crops that are more nutrient
dependent (corn) will also result in increased fertilizer demand. In Russia and the ROW,
where application rates are much lower, there may be room for demand growth from
increases in application rates (Rosas 2012). Additional demand growth may come from
industrial uses other than fertilizer use. According to FAO (2014) data, non-fertilizer
nutrient use accounted for 31% of nitrogen, 67% of phosphorus, and 40% of potassium
nutrients consumed in the United States in 2011. While these uses are relatively large
for the U.S., non-fertilizer use for the majority of countries is missing from the Food and
Agricultural Organization (FAO) dataset. Non-fertilizer uses of nutrients include
applications in housing construction and explosives for nitrogen, detergents and
cleaners for phosphorus, and water softeners and food products for potassium
(PotashCorp 2014d).

8
Corn requires the largest amount of each of the three nutrients, accounting for the use
of 47% of nitrogen fertilizers, 44% of phosphorus fertilizer, and 45% of potassium
fertilizers in the U.S. (FAO 2014). Globally, 64% of nitrogen, 60% of phosphorus, and 51%
of potassium fertilizers were consumed by Canada, China, India, Russia, and the United
States with the remaining portions accounted for by the Rest of World (FAO 2014).
Similarly, 63% of nitrogen, 68% of phosphorus, and 61% of potassium nutrients were
produced by the same set of included countries (FAO 2014). Additional countries of
importance that are not included in this model are Indonesia, Pakistan, Brazil, Belarus,
Germany and other countries of the European Union, and Australia. The five modeled
countries were identified as being either in the top five producers or consumers of at
least one nutrient in 2011. Pie graphs summarizing fertilizer consumption and
production can be seen below.

9
Figure 1.1 - 2011 World Nitrogen Fertilizer Use
Source: FAO 2014
Figure 1.2 – 2011 World Nitrogen Production
Source: FAO 2014
Russia1%
Canada2% United States
11%
India16%
China34%
Rest of World36%
2011 World Nitrogen Fertilizer Use
Canada3% Russia
7%United States
8%
India13%
Rest of World32%
China37%
2011 World Nitrogen Production

10
Figure 1.3 – 2011 World Phosphorus Fertilizer Use
Source: FAO 2014
Figure 1.4 – 2011 World Phosphorus Production
Source: FAO 2014
Russia1%
Canada2% United States
10%
India20%
China27%
Rest of World40%
2011 World Phosphorus Fertilizer Use
Canada1%
Russia5%
India10%
Rest of World22%
United States30%
China32%
2011 World Phosphorus Production

11
Figure 1.5 – 2011 World Potassium Fertilizer Use
Source: FAO 2014
Figure1.6 – 2011 World Potassium Production
Source: FAO 2014
Russia1%
Canada1%
India9% United States
14%
China26%
Rest of World49%
2011 World Potassium Fertilizer Use
India0%
United States2%
China11%
Russia20%
Canada28%
Rest of World39%
2011 World Potassium Production

12
Nitrogen Fertilizer Overview
Nitrogen is the main fertilizer nutrient consumed globally, accounting for 61% of total
fertilizers consumed in 2011, measured by nutrient tons (FAO 2014). Ammonia can be
directly used as a nitrogen fertilizer itself in the form of anhydrous ammonia or further
developed into urea, ammonium nitrate, or Urea-Ammonium Nitrate. It is synthesized
from natural gas and elemental nitrogen from the atmosphere. Natural gas is the main
input for nitrogen fertilizer production and makes up approximately 70 to 85 percent of
the cost of producing ammonia (PotashCorp 2013b). A strong physical relationship in
production means that one might expect to find a correlation between the price of
natural gas in the United States and the domestic price of ammonia.
When ammonia prices are high relative to natural gas prices, the high profitability of
ammonia production should encourage increased use of existing capacity and could
induce new investment in plant capacity. In a perfectly competitive market new
competitors would enter the market until economic profits (which consider all relevant
costs, not just short-run variable costs) are reduced to a level close to zero. However,
the high profitability of ammonia production in recent years is consistent with
arguments that U.S. fertilizer markets have high barriers to entry, perhaps caused by the
high capital cost and long time frames associated with building new plant capacity in an
industry with some characteristics of a non-competitive market structure. Despite high
industry concentration, many smaller firms are able to operate in the industry, implying
that barriers to entry are not so high as to preclude all competition. Additionally, U.S.

13
fertilizer producers must compete with many producers in other parts of the world
(IFDC 2013). Therefore, it is unlikely that high levels of long-term profits can be
sustained in the nitrogen fertilizer industry. In the long run, one would expect margins
between ammonia prices and natural gas costs to be narrower than they were between
2008 and 2012. If recent high profits were maintained, they would incentivize the full
use of existing capacity, the expansion of capacity by existing firms and perhaps new
entrants into the market.
Building a new ammonia production facility takes a minimum of three years from initial
planning to production (PotashCorp 2014a). For new capacity to be built and ready to
come online in 2012, planning would have had to start before 2009 when the profit
margin was much lower. Given the time it takes to plan and construct a new plant, an
increase in expected profits will only translate into increased plant capacity after a
several year lag.
There is evidence that additional investment has taken place during this period of high
profitability. The International Fertilizer Development Center (IFDC) provides a data
series of current and planned capacity for ammonia, phosphoric acid, and potash that
highlights new production facilities that will become operational over the next several
years (IFDC 2013). This information is used in constructing capacity projections in the
model developed for this thesis.
Using the IFDC database, it was found that the top five North American (Canada and
U.S.) ammonia producers accounted for 70% of nameplate capacity in 2013 (IFDC 2013).

14
These companies were CF Industries (US) with 28%, Agrium (CA) with 13.8%, Koch
Industries Company (US) with 10.7%, PCS Nitrogen Fertilizer L.P. (US) with 10.5%, and
Canadian Fertilizers Ltd. (CA) with 7% of total North American ammonia capacity (IFDC
2013).
A significant shift in the U.S. natural gas market occurred in 2009 due to a decline in
consumption of 1.8% as a result of the economic recession and increased production of
natural gas domestically (EIA 2011). This prompted natural gas prices to drop from the
high of $9.65 per million BTU seen in 2008 (EIA 2014). Natural gas prices dropped by
56% in 2009 but recovered 10% by 2012 (EIA 2014). The 2012 price for natural gas in the
United States was $4.50 per million BTU (EIA 2014). The Russian natural gas export
price, taken from International Monetary Fund, was nearly three times higher than the
U.S. price at $11.98 per million BTU in 2012 (IMF 2014a). Similarly to prices in the United
States, Canadian natural gas prices have also declined. Canadian natural gas prices were
$8.88 per million BTU in 2008 and had declined 55% to $4.03 by 2010 (EIA 2010). While
natural gas prices in the U.S. and Canada saw a sharp decline in 2009, prices in other
parts of the world have seen differing trends in prices. In contrast to U.S. gas prices,
Russian natural gas prices dropped by a much smaller amount of 15% in 2009, with a
27% recovery in 2010 (EIA 2010). Domestic natural gas prices in Russia were the
cheapest of included countries with a price of only $2.74 per million BTU in 2010 (EIA
2010).

15
The natural gas price for use in nitrogen fertilizer production in India is highly regulated.
Natural gas prices for use in fertilizer production fall under the Advanced Pricing
Mechanism (APM) of India (Infraline Energy n.d.). While APM prices were historically
low, recent prices have been revised to a point where they are closer to spot market
prices (Infraline Energy n.d.). An increase in APM natural gas prices for fertilizer use was
scheduled to occur in April 2014. Indian APM prices in 2013 were $4.2 per million BTU
and will be increased to $8.4 per million BTU in 2014, an increase of 100% (Infraline
Energy n.d.).
While natural gas is the main feedstock for producing nitrogen fertilizers in the other
modeled countries, approximately 75% of nitrogen fertilizer was produced from coal in
China, in 2010 (IETD 2013). However, because a coal price for China was not found, the
Australian coal price has been used as a proxy. Approximately 1.5 metric tons of coal is
required to produce one metric ton of ammonia (China Coal Research Institute 2011).
Australian coal prices saw a significant increase of 93% in 2008, followed by a 46%
decrease in 2009 (The World Bank 2014). A smaller spike in prices occurred in 2011
when Australian coal prices increase by 23%, but prices returned close to the 2010 level,
decreasing 21% in 2012 (The World Bank 2014).
Retail ammonia markets in the U.S. showed a decreasing price trend with a drop of 20%
in 2009 and a subsequent drop of around 21% in 2010, compared to the 56% decrease
in natural gas prices in 2009 (USGS 2014a). However, retail ammonia prices returned to
2009 levels by 2012. Rising commodity prices may account for the rebound in ammonia

16
prices in spite of continued low prices for natural gas (WAEES 2012b). The 2012 U.S.
wholesale ammonia price was $634 per metric ton (USGS 2014a).
Figure 1.7 – Global Natural Gas Prices
Sources: Natural Gas Prices for the U.S., Canada, and Russia (EIA 2010), Compiled sources for India
Phosphorus Fertilizer Overview
Globally, phosphorus fertilizers are the second most common type of fertilizer. China is
the world’s largest producer of phosphorus fertilizer accounting for 32% of production
in 2011, followed closely by the United States at 30%. Russia, India, and Canada make
up an additional 16% of global production (FAO 2014). Phosphorus fertilizers come in
two major varieties, diammonium Phosphate (DAP) and monoammonium phosphate
(MAP). DAP and MAP fertilizers are produced from sulfuric acid, phosphate rock, and
ammonia. These two types of fertilizer differ in their ratios of the three inputs. DAP has
a higher nitrogen content but less phosphorus than MAP. Other phosphorus fertilizers
(such as superphosphate) are produced using different production techniques, not all of
0
2
4
6
8
10
12
14
19
90
19
92
19
94
19
96
19
98
20
00
20
02
20
04
20
06
20
08
20
10
20
12
20
14
20
16
20
18
20
20
20
22
20
24
20
26
20
28
20
30
$/M
MB
TU
Global Natural Gas Prices
Canada India Russia US

17
which involve the use of ammonia. Phosphate rock is mined in the form of ore and is
reacted with sulfuric acid to produce phosphoric acid (PotashCorp 2011). Similar to
ammonia for nitrogen fertilizers, phosphoric acid is the main building block for
producing many phosphorus based fertilizers.
The U.S. phosphorus fertilizer industry is highly concentrated with the top four firms
controlling approximately 90% of nameplate capacity in 2013 (IFDC 2013). These four
firms are Mosaic Company with 46.6%, PCS Phosphate Company Inc. at 24%, and CF
Industries Inc. at 10.6%, and J.R. Simplot Company at 8.6% of nameplate capacity (IFDC
2013). Capacity expansion takes three to four years to construct a new 1 million metric
ton P2O5 plant (PotashCorp 2013a). Costs of increasing capacity are estimated to be
higher for phosphorus than for ammonia, possibly because the costs of constructing a
phosphate rock mine, a sulfuric acid plant, and a phosphoric acid plant are included in
this estimate. Phosphoric acid is 60% P2O5. Therefore 1 million metric tons of P2O5 is
equivalent to 1.7 million metric tons of phosphoric acid. With global phosphoric acid
capacity for 2011 of approximately 52 million metric tons, an additional 1.7 million
metric tons would increase global capacity by a little over 3%. As in the ammonia
market, high levels of profitability would be expected to lead to investment in capacity
that would eventually translate into increased production and more normal rates of
profit.
U.S. DAP prices saw major volatility in 2007 when the yearly average price increased
from $320 per metric ton to nearly $750 per metric ton, an increase of over 130% (NFDC

18
n.d.). By 2009 prices had plunged back to $384 per metric ton, perhaps due in part to a
10% increase in global phosphorus production (NFDC n.d.; FAO 2014). Lower demand in
2008 may have also pushed prices lower in 2009. The U.S. accounts for 10% of
phosphorus fertilizer use behind China with 27%, and India with 20% of global
consumption (FAO 2014). Russia and Canada account for only 1% and 2% of phosphorus
fertilizer consumption, respectively (FAO 2014).
Potassium Fertilizer Overview
In 2011, the United States controlled approximately 2% of global potassium fertilizer
production (FAO 2014). Canada is the world’s largest producer accounting for 28% of
global production in 2011 (FAO 2014). The North American potassium fertilizer industry
is highly concentrated with the top four firms controlling approximately 98.4% of
nameplate capacity in 2013 (IFDC 2013). These four firms are Mosaic (CA/US) with
45.9%, PotashCorp (CA) with 41.9%, Agrium (CA) with 7.3%, and Intrepid Mining LLC
(US) with 3.3% of North American nameplate capacity in 2013 (IFDC 2013). Although the
U.S. produces a small portion of total potassium fertilizers, the United States is the
second largest consumer accounting for 14% of global fertilizer consumption in 2011
(FAO 2014). Potassium fertilizer is consumed in the form of potassium chloride, also
known as potash. Potash is mined directly from ore deposits making the production
process significantly different than that of nitrogen and phosphorus fertilizers.
After potash is extracted from a mine it must go through processing as summarized in
the Figure 1.8.

19
Figure 1.8 – Potash Fertilizer Production Flow-Diagram
Source: PotashCorp 2014c
Contrary to production costs of phosphorus and nitrogen fertilizers, production of
potassium fertilizer does not require a single major input like natural gas or phosphoric
acid. Instead, variable production costs for potash come mainly from mining costs (e.g.
fuel costs) and electricity and labor inputs required to power refinement facilities
throughout the production process.
Construction of a two million metric ton potash mine takes a minimum of seven years to
complete at a cost of 4.7 to 6.3 billion dollars (PotashCorp 2013a). Global potash
production capacity in 2011 was 47 million metric tons (IFDC 2013). Construction of a 2
million metric ton mine would be equivalent to a 4.2% increase in global capacity in
2011 (IFDC 2013). As with both nitrogen and phosphorus, it is likely that there are
significant barriers to entry into the potash market.

20
Russia accounts for an additional 20% of total potassium fertilizer production (FAO
2014). Two groups of producers dominate the global potassium fertilizer industry. The
first is Belarusian Potash Co., a partnership between Belaruskali of Belarus and Uralkali
of Russia. The second group is Canpotex Ltd., an exporting entity that sells potash for
PotashCorp and Agrium in Canada, and Mosaic in the United States. These two groups
controlled approximately 70% of global production in 2013 (Marotte 2013). In July of
2013, Uralkali announced they would end an agreement that formerly limited supply of
potassium fertilizers out of Russia (Fedorinova 2013). Following the announcement,
stock prices for companies producing potassium fertilizer dropped due to the expected
increase in supply. Uralkali has announced intent to increase output by 24% for 2014
which equates to around two million metric tons of potash. This expansion in
production is equal to 6% of 2011 global potassium fertilizer production. If this
additional supply were to come online, it would put downward pressure on potash
prices, and farmers would respond by consuming more of the nutrient in 2014 (Clark
2013). Uralkali has also made it clear that they expect to see world potash prices 25%
lower in 2014 than in 2013 (Marotte 2013).

21
CHAPTER THREE
LITERATURE REVIEW
Because of time and data constraints no attempt will be made to use econometric
methods to estimate the parameters of the model developed in this thesis. Instead,
parameters for this model will rely heavily on the results of previous estimation.
Particular parameters of interest are fertilizer demand elasticities with respect to both
fertilizer input prices and commodity output prices. Parameters used to drive model
equations are synthetically derived from these elasticities. While some adjustments are
made to estimates from previous literature to better match observed data and ensure
plausible model behavior, the values from previous literature serve as strong priors for
this study.1 This chapter summarizes relevant previous works that have contributed to
the estimation of fertilizer market relationships.
Demand Literature
In the United States, much effort has been made to estimate the effects of changes in
fertilizer prices on crop demand for fertilizer. Studies vary in many ways including the
crops studied, level of nutrient aggregation, covered nutrient types, estimation period,
equation functional form, and regression technique. These factors lead to widely varying
estimates of elasticities and other important differences across the studies. In addition
to research focusing on the U.S., an attempt has been made to assemble elasticity
studies for China, Canada, India, Russia, and other countries. As is evident in the 1 Elasticity values used in the model can be found in Appendix B.

22
literature review below, there is an absence of research for Russia and Canada. Only a
single study was identified for Indian fertilizer markets, and only one study that covers
South and Southeast Asia.
Heady and Yeh (1959) estimated demand functions of fertilizer for an aggregated crop
group for each of the individual nutrient types in the United States. Two demand
functions were used to estimate the responsiveness of fertilizer use to nutrient prices.
Key differences between these two equations were the variables included in estimation.
In the first equation, two groups of cash receipts were utilized, and in the second a
lagged average crop price index was included. The first approach was applied to each of
the three endogenous fertilizer categories to produce nutrient-specific elasticity
estimates.
The authors found that farmers had an inelastic response in their nutrient application
rate decisions with respect to a fertilizer price index. While they did not estimate the
response for different crops, they did find estimates for each of the three nutrients.
Nitrogen and phosphorus fertilizers were estimated to have the most responsiveness
with elasticities close to -0.45 followed by potassium at -0.4. Elasticities were also
calculated with respect to crop cash receipts. These measures were 0.8, 0.58, and 0.88
for nitrogen, phosphorus, and potassium, respectively. Thus, the results suggested that
fertilizer use might be more sensitive to output prices than input prices.
Gunjal et al. (1980) estimated demand functions of fertilizer for five crops in the United
States. The study used a dataset spanning from 1952 to 1976, a period over which

23
fertilizer consumption expanded significantly. Differing from the earlier work of Heady
and Yeh, Gunjal et al. estimated fertilizer demand by crop but did not split fertilizer by
nutrient type due to differences in data availability. Crops included in estimation were
wheat, soybeans, cotton, feed grains, and tobacco.
The authors discovered elasticities with respect to fertilizer prices for feed grains and
wheat of -0.9 and -0.99, but found slightly more inelastic responses for soybeans and
cotton at -0.62 and -0.31, respectively. The elasticity estimate for feed grains with
respect to fertilizer prices was calculated using a ratio of output prices to fertilizer prices
so the inverse of this estimate, or 0.9, is the output price elasticity. Output price
elasticity was also calculated for wheat and was found to be inelastic at 0.42.
Roberts and Heady (1982) estimated nine equations of fertilizer demand in the United
States using data from 1952 to 1976. Attempts to include all cross-price effects in a
single equation were unsuccessful, perhaps due to high multicollinearity among the
fertilizer prices. The authors assembled application rates for nitrogen, phosphorus, and
potassium for three crops and for each state. These values were then aggregated to the
national level. The three crops covered in this study were corn, wheat, and soybeans. To
estimate these equations the authors used seemingly unrelated regressions. Roberts
and Heady suggested that while price elasticities were important, other factors such as
technology and farming practices may affect application rate more than the price of
nutrients.

24
Roberts and Heady estimate larger elasticities for corn than for wheat and soybeans.
The fertilizer own-price elasticity values for corn for nitrogen, phosphorus, and
potassium were -1.15, -1.13, and -1.3, respectively. These results are similar to those
found by Gunjal et al. but are quite a bit larger than estimates found earlier by Heady
and Yeh. Additional elasticities were estimated at -0.23 (N), -0.74 (P), and -0.24 (K) for
wheat and -0.29 (N), -0.82 (P), and -0.96 (K) for soybeans. Note that the studies cited so
far all estimated parameters using data for the period when fertilizer use was expanding
rapidly.
For the United States, Zelaya (1991) estimated a model of fertilizer supply and demand
using data from 1964 to 1988. This study had broader coverage than previous research.
Crops covered in Zelaya’s model were corn, soybeans, wheat, and cotton. An “other
crops” category was also included. Estimating fertilizer demand relationships for these
crops produced useful elasticities for both input and output prices. In equations where
either input prices or output prices did not perform well, a ratio of the two prices was
used. Zelaya found that fertilizer demand for the observed crops in the United States
was relatively unresponsive to changes in fertilizer prices. The author also compiled a
list of other relevant studies that estimated fertilizer demand elasticities. However,
Zelaya provides a much more extensive group of estimates in his 1991 thesis than
previous authors (Figures 3.1 & 3.2).
Denbaly and Vroomen (1992) used dynamic error-correction models to estimate
demand elasticities of nitrogen, phosphorus, and potassium for corn in the United

25
States. Consistent with the majority of the other studies examined here, Denbaly and
Vroomen estimated inelastic responses in fertilizer demand with respect to nutrient
prices for corn, both in the short-run and the long-run. The study used data from 1964
to 1989 to estimate responsiveness. The authors argue that a dynamic model is more
appropriate for estimating corn fertilizer demand than a static one and suggest that this
sort of estimation leads to higher statistical significance of regression estimates. Short-
run elasticities for corn with respect to the price of nitrogen, phosphorus, and
potassium fertilizers were -0.21, -0.25, and -0.19, respectively. Long-run elasticities were
more responsive at -0.41 (N), -0.37 (P), and -0.31 (K).
Garcia and Randall (1994) estimated cost-functions to compute input demand
elasticities in order to analyze the consequences of fertilizer policy on corn and wheat in
the U.S., France, and England. U.S. data for this estimation spanned from 1975 to 1989.
The authors found that combined NPK fertilizer demand for wheat and corn was
inelastic with wheat being more elastic than corn in the United States. Hicksian
elasticities, which hold crop output constant, for wheat and corn were -0.34 and -0.06.
The authors also found inelastic responses for France and England. As this is an
aggregated nutrient category, these elasticity estimates are less useful for utilization in
this synthetic model, but the inelastic results stay consistent with most of the other
studies.
Williamson (2011) estimated the elasticity of the application rate of nitrogen for corn in
the United States using the Agricultural Resource Management Surveys from 2001 and

26
2005. The author used cross-sectional methods and instrumental variables to estimate
the effects of nitrogen prices on demand. Williamson found elasticity values between
-1.67 to -1.87 for corn which are quite high compared to other studies examined.
Williamson includes some unique measures of distance in his estimation of nutrient
demand. Additionally, the estimated fertilizer demand equations included factors such
as whether farmers used soil testing, whether farmers irrigated, farmer education, and
many other relevant variables. Williamson also addressed the issue of over application
of nitrogenous fertilizers in the U.S. and discussed the policy implications of a tax
scenario on nitrogen fertilizers. It is not unusual for cross-sectional analysis to generate
different estimates than time-series approaches, and there are questions about the
appropriateness of applying parameters from cross-sectional analysis in projection work
such as that conducted in this thesis.
Dholakia and Majumdar (1995) estimated the total NPK fertilizer demand elasticity in
India using a data set from 1966 to 1992. The authors estimated an inelastic response,
with respect to a weighted combined NPK fertilizer price, of -0.28 for an aggregate “all
crops” category. These results support a claim that fertilizer demand in India is inelastic
to prices, similar to observations of fertilizer demand in the United States from other
studies.
Li et al. (2011) calculated partial factor productivity (PFP) of nitrogen fertilizer for corn,
wheat, and rice for the South and Southeast Asia region. This region is of interest as it
includes both India and China, two of the five countries included in the global NPK

27
model for this thesis. The authors then used these PFP measures to estimate nitrogen
fertilizer application rates and attempt to find optimum nitrogen use. In doing this, the
authors ultimately calculated nitrogen fertilizer demand elasticities with respect to input
prices for the region. Resulting elasticity estimates for each of the three commodity
groups were negative and inelastic, with wheat (-0.17) being the most responsive and
corn (-0.11) being the least responsive to the price of nitrogen.
Supply Literature
In addition to elasticities for demand side equations, attempts were made to identify
previous research discussing the specification of supply side equations in fertilizer and
similar markets.
Kruse et al. (2007) discussed the implications of a biofuel policy extension in the United
States. Rather than directly estimating production of biofuels in this study, they elected
to break production into two pieces -- capacity and capacity utilization. Due to the long
lifespan of production facilities and the time needed to construct a facility, multiple lags
of a net return variable were used in estimating plant capacity. A term was also included
in capacity specification to account for retiring plants in the industry. The utilization rate
equation is a function of only the current period net returns. Additionally, the utilization
rate equation is specified in logistic form to guarantee that estimated capacity use
remains between zero and 100% of capacity. The product of these two variables was
used to obtain forecasted values of production.

28
There are some holes remaining in this literature review. Fertilizer market studies for
Russia and Canada are missing as no relevant studies have been found for these two
countries. In order to produce a forecast for these countries, studies for other modeled
countries are used as a guide. Different estimation periods, observed country, and
commodity and nutrient aggregation lead to differences in elasticity magnitudes.
Table 3.1 – Own-Price Elasticities of Demand for Nitrogen, Phosphorus, and Potassium Inputs
Own-Price Elasticities of Demand for Nitrogen, Phosphorous, and Potassium Nutrient Inputs
Variable Notes
N P K
Heady and Yeh (1959) U.S. 1910 - 1956 All Crops -0.449 -0.448 -0.403 Fertilizer Price Index
Gunjal et al. (1980) U.S. 1952 - 1976 Feed Grains ALL NPK: -0.9 Fertilizer Index / Feed Grains Price
U.S. Wheat ALL NPK: -0.99 Fertilizer Price Index
U.S. Soybeans ALL NPK: -0.62 Fertilizer Price Index
U.S. Cotton ALL NPK: -0.31 Fertilizer Price Index
Roberts and Heady (1982) U.S. 1952 - 1976 Corn -1.148 -1.131 -1.298 Nutrient Prices
U.S. Wheat -0.232 -0.737 -0.236 Nutrient Prices
U.S. Soybeans -0.293 -0.824 -0.956 Nutrient Prices
Zelaya (1991) U.S. 1964 - 1988 Corn -0.1297 -0.1045 -0.0755 Nutrient Prices
U.S. Wheat -0.4554 -0.0747 -0.1033 Nutrient Prices
U.S. Soybeans -0.0968 -0.1150 -0.0485 Nutrient Prices
U.S. Cotton -0.0783 -0.2440 -0.2729 Nutrient Prices
U.S. Other Crops -0.3049 -0.3167 -0.3201 Nutrient Prices
Denbaly and Vroomen (1992) U.S. 1964 - 1989 Corn - S.R. -0.21 -0.25 -0.19 Nutrient Prices
Corn - L.R. -0.41 -0.37 -0.31 Nutrient Prices
Hicksian Marshallian
Garcia and Randall (1994) U.S. 1975 - 1989 Wheat ALL NPK: -0.3383 -0.8758 Weighted Fertilizer Price
U.S. Corn ALL NPK: -0.0602 -0.954 Weighted Fertilizer Price
France Wheat ALL NPK: -0.0771 -1.0511 Weighted Fertilizer Price
France Corn ALL NPK: -0.0798 -1.1516 Weighted Fertilizer Price
England Wheat ALL NPK: -0.5227 -1.0901 Weighted Fertilizer Price
Williamson (2011) U.S. 2001 & 2005 Corn -1.67 to -1.87 Nitrogen Prices
Dholakia and Majumdar (1995)India 1967 -1992 All Crops ALL NPK: -0.28 Ratio of Fertilizer to Output Prices
Li et al. (2011) S. and E. Asia 1980 - 2008 Corn -0.11 Corn Price
S. and E. Asia Rice -0.16 Rice Price
S. and E. Asia Wheat -0.17 Wheat Price
Own-Price ElasticitiesStudy Region Data Period Commodity

29
Figure 3.2 – Output Price Elasticities of Demand for Nitrogen, Phosphorus, and Potassium Inputs
Output Price Elasticities of Demand for Nitrogen, Phosphorous and Potassium Nutrient InputsVariable Notes
N P K
Heady and Yeh (1959) U.S. 1926 - 1959 All Crops 0.804 0.579 0.881 Cash Receipts
Gunjal et al. (1980) U.S. 1952 - 1976 Feed Grains ALL NPK: 0.9 Feed Grains Price / Fertilizer Index
U.S. Wheat ALL NPK: 0.42 Lagged Wheat Price
Roberts and Heady (1982) U.S. 1952 - 1976 Corn 1.053 0.592 0.633 Lagged Corn Price
U.S. Wheat 0.312 0.432 0.417 Lagged Wheat Price
U.S. Soybeans 0.065 0.504 0.015 Lagged Soybean Price
Zelaya (1991) U.S. 1964 - 1988 Corn 0.1752 0.0647 0.0755 Composite Price
U.S. Wheat 0.0617 0.0681 N/A Composite Price
U.S. Soybeans 0.0968 0.1399 0.0485 Lagged Market Price
U.S. Cotton 0.2307 0.1216 0.2729 Target Price
U.S. Other Crops 0.3049 0.3167 0.3201 Lagged Corn Price
Output Price ElasticitiesStudy Region Data Period Commodity

30
CHAPTER FOUR
THEORETICAL ASPECTS OF SUPPLY AND DEMAND
The purpose of this chapter is to summarize key features of economic theory that form
the foundation for the global fertilizer model. The theory discussed in this chapter will
represent the derivation of supply and demand under the assumption of a perfectly
competitive market. There is some evidence to suggest that the fertilizer industry has
elements of an oligopoly market structure, but there are also features that suggest a
competitive market structure. Even though the industry may not fit the competitive
model in every respect, it has been assumed that the consequences of deviating from a
perfectly competitive model would be small. The validity of this assumption could be
evaluated by future research in order to determine the extent to which noncompetitive
behavior in fertilizer markets might lead to results that differ from the predictions of a
competitive model.
Profit Maximization – Derived Demand
In a perfectly competitive market, farmers are assumed to be price takers when it
comes to both the prices they pay for inputs and the price they receive for their output.
The individual producer is seen as a price taker because no single participant can affect
output prices in a perfectly competitive market by changing their production decision.
Producers maximize profits by choosing an optimum level of production. In order to
achieve this optimum level of production, an optimum set of inputs must be employed.

31
By solving the producer’s profit maximization problem, one can acquire input demand
equations. In general, the input demand equation for a specific input should be a
function of the output price, the own input price, and the prices of other inputs.
The theory represented here will demonstrate an “n” input, one output case of profit
maximization. In the case of this thesis, farmers’ input demand equations for a single
commodity output include such inputs as fuel, land costs, prices of other nutrients, and
chemical costs. The theory discussed here has been adapted from Henderson and
Quandt’s (1980), Microeconomic Theory: A Mathematical Approach.
The individual’s profit function is the difference between revenues gained by selling
output, and the cost of producing that output.
(4-1)
Substituting in TR(x) = p*f(x1, …, xn), and TC(x) = (r1x1 + … + rnxn ) yields
π = pf(x1, …, xn) -∑
(4-2)
Where:
p = Output price
xi = Quantity of input i
wi = Price of input i
In this form it can be seen that profit is a function of the output price, inputs, and input
prices. As input quantities are the only choice variable, profits are maximized with

32
respect to input variables. Differentiating equation (4-2) with respect to inputs yields
the following First-Order Conditions of profit maximization.
= pf1 – w1 = 0 (4-3)
.
.
.
= pfn – wn = 0 (4-4)
The first term in each equation represents the value of the marginal product of the
respective input. The second term in each equation represents the marginal cost of each
input, or the additional cost of employing one additional unit of the respective input.
These equations can be re-written as follows to reveal an important maximization
requirement.
pf1 = w1 (4-5)
.
.
.
pfn = wn (4-6)
These equations show that in order for a producer to maximize profits, additional units
of input will be employed until the marginal increase in total revenue added by the next
unit of input is equal to the cost of employing that additional unit of input. From this
point one can solve for input demand equations.

33
x1* = f(w1,…,wn, p) (4-7)
.
.
.
Xn* = f(w1,…, wn, p) (4-8)
Here, theory demonstrates that in the most general form, prices of complement and
substitute inputs should be included in input demand equations. Due to a lack of
estimates of the cross-price effects, input demand equations specified in this thesis
contain only the own input price and output price. The prices of other nutrients and of
other inputs such as fuel, chemicals, and labor costs could have small effects on
application rates. Most previous research suggests that any cross-price effects are likely
to be small, and they are not considered in this analysis.
In application, one property of input demand equations that must hold is homogeneity
of degree zero. One way to ensure that this property will hold, is to deflate all prices in
the model. In the model, this is done by deflating input and output prices by the gross
domestic product (GDP) deflator.
Profit Maximization – Supply
The derivation of a firm’s supply curve starts from the same initial point and under the
same profit maximization assumptions that were used to derive input demand as shown
below.

34
(4-9)
where TR(y) is total revenue and TC(y) is the total cost of producing the level of output
y. To maximize profits given the optimum output level (y*), equation (4-9) is
differentiated with respect to y.
(4-10)
Equation (4-10) can be rewritten as
(4-11)
Equations (4-10) and (4-11) imply that a profit maximizing firm will always produce at an
output level where marginal revenue equals marginal costs. Producers in a perfectly
competitive industry take output prices as given. Therefore total revenue can also be
written as follows.
y (4-12)
where P is the output price and y is the level of output. Differentiating with respect to y
results in
(4-13)
Equation (4-13) shows that the revenue gained from selling a unit of output is always
equal to the price of that output, given the assumptions of a competitive market.
Substituting equation (4-13) into (4-11) shows that the marginal cost of producing the
last unit of output should also be equal to the given output price.

35
(4-14)
A profit maximizing firm will produce at an output level where marginal cost is equal to
the price received for selling an additional unit of output. Therefore, a firm treats its
marginal cost curve as its supply curve because at any given output price the output
level can be found by equating marginal cost to output price. The supply curve follows
the portion of the marginal cost curve for levels of output where marginal cost is above
average variable costs. At levels of output below average variable costs a firm would
choose to produce nothing. For this reason, at all levels of output below the point where
marginal cost is equal to the output price the supply curve will be equal to zero. The
optimal quantity supplied (qs*) is a function of the optimal input choices.
qs* = f(x1*, …, xn*) (4-15)
By substituting in for input demand equations, equation (4-15) can be rewritten as a
function of input prices and the output price.
qs* = f(w1, …, wn, p) (4-16)
While the theoretical derivation for capacity and capacity utilization will not be
demonstrated here, it is important to note that these results can be derived from the
basic profit maximization problem presented above. The theoretical construction of
these variables can be attributed to Houck, Ryan, and Subotnik (1972). Application of
this theory is also found in a paper by Kruse et al. (2007) which examines the economic
impacts of biofuels subsidies. Capacity was modeled with a significant lagged structure
to reflect the idea that investment in production takes time. The number of lagged

36
variables included in the capacity equation is a direct result of the average number of
years required to complete the construction of a fertilizer production facility.

37
CHAPTER FIVE
DATA DISCUSSION
This fertilizer model is a global partial equilibrium model that focuses on the countries
of Canada, China, India, Russia, and the United States. To make the model solution a
global one, a Rest of World region has been aggregated to account for all other
countries. Partial equilibrium models employ both exogenous and endogenous data to
produce a forecast. The process of acquiring data is very important as collected data
directly impact model results. The following section discusses exogenous and
endogenous variables and data adjustments that were made in the development of this
global fertilizer model.
Demand Data
The primary source of data for this model is the Food and Agricultural Organization
Statistics Division (FAOSTAT) (FAO 2014). Demand variables used from this source
include domestic consumption2, non-fertilizer use, and exports. The FAOSTAT fertilizer
dataset covers a ten year period from 2002 to 2011. Fertilizer use, non-fertilizer use,
domestic consumption, and imports are in units of thousand nutrient metric tons.3
Application rates for nitrogen, phosphorus, and potassium for various countries were
taken from the Center for Agricultural and Rural Development (CARD) at Iowa State
2 FAO’s “domestic consumption” is re-termed as “fertilizer use” in this thesis because FAO treats non-
fertilizer use separately. In other words, the summation of fertilizer and non-fertilizer uses will be referred to as domestic consumption for this thesis from here on. 3 Nutrient tons of nitrogen measure the nutrient value of nitrogen in nitrogen-containing fertilizers.

38
University (ISU) (Rosas 2012). The CARD dataset includes corn, soybeans, rapeseed, and
cotton. To calculate application rates for the observed period, the researchers started
with some known initial application rate level for each variable. Application rate values
for the remainder of the period were calculated by adjusting the application rate in the
previous year by a growth factor. Nutrient use per hectare for wheat and rice were
taken from the Food and Agricultural Policy Research Institute (FAPRI) at ISU (FAPRI
2011). The U.S. Department of Agriculture Economic Research Service (USDA ERS)
provides U.S. application rates for corn, cotton, soybeans, and wheat but has missing
data for various years (ERS 2013). As the CARD dataset is more complete only wheat
application rates are utilized from the ERS source. The use of multiple data sources
creates the potential for inconsistencies in the data, but there appears to be no other
practical alternative. When years of data are missing, values are interpolated or
additional sources are found to fill in these missing data. Application rate data are in
terms of nutrient kilograms per hectare.
Application rate data are available for the period of 1990 to 2010 from CARD, and from
2000 to 2012 from FAPRI ISU. ERS application rate data span the period of1964 to 2012
with various years missing depending on the commodity.
The portion of fertilizer use that can be attributed to corn, soybeans, rapeseed, cotton,
wheat, and rice can be obtained by multiplying area harvested for each commodity,
taken from Production, Supply and Distribution Online (PSD), by respective nutrient

39
application rates and summing these values. “Other crop” demand in the model is
calculated by subtracting this value from total fertilizer use.
Supply Data
FAOSTAT is the primary data source for the supply side of this model. Supply variables
used from FAOSTAT include production and imports. FAOSTAT fertilizer data cover a ten
year period from 2002 to 2011. Both production and imports are in thousand nutrient
metric tons.
In addition to FAO data, nutrient production capacity data were taken from the
International Fertilizer Development Center (IFDC) (IFDC 2013). This variable is available
at the plant, country, and region levels. Country level capacity represents the maximum
amount of nutrient production that a country is able to achieve in a year. Nameplate
capacity is not always fully utilized, so the capacity utilization rate is defined as the ratio
of production to nameplate capacity for each year. Capacity data from IFDC are
available from 1998 to 2012 for nitrogen and phosphorus fertilizers and 1996 to 2012
for potassium fertilizer. IFDC also provides a forecast of capacity expansion out to 2016
that serves as a guideline for calibrating capacity projections in this model. IFDC also
estimates an “indefinite” level of capacity that is an estimate of eventual capacity in the
future. Units of capacity variables are thousand nutrient tons, and capacity utilization
rates are simple percentages between zero and 100.

40
Exogenous Variables
This section summarizes exogenous variables, other than input prices, that are used as
explanatory variables in model equations. The majority of exogenous data, excluding
prices, were taken from baseline models that were developed at the World Agricultural
Economic and Environmental Services (WAEES).
Commodity prices used in input demand equations come from the WAEES baseline and
cover the period of 1980 to 2030 (WAEES 2012b). Farm level commodity prices were
used for corn, wheat, soybeans, cotton, rapeseed, and rice for each modeled country.
All farm level prices are in local currency per metric ton of a given commodity. Producer
Price Indices for electricity and wages were taken from WAEES cost of production
models for use in potassium capacity equations for Canada, China, India, and the United
States (WAEES 2012a). Macroeconomic variables including consumer price indices and
the GDP deflator were also taken from the WAEES macro model (WAEES 2013).
Macroeconomic variables originate from the International Monetary Fund (IMF) for
years 1980 to 2018 with WAEES forecasts to 2030 (IMF 2014b).
Prices
The input prices examined here are the key drivers behind cost of production for
nitrogen and phosphorus fertilizers. Cost of production measures are used in
combination with fertilizer output prices to calculate net returns. This measure of
profitability is used to simulate capacity expansion paths and the capacity utilization
rate that are ultimately used to determine future production of fertilizer. Fertilizer

41
output prices are also important drivers of individual crop nutrient demand equations.
These facts make price data among the most important to get right. However, prices are
often some of the hardest variables to acquire. When entire price series or specific years
of data are missing, assumptions must be made in order to allow for model simulation.
These assumptions may include using a price from a different country as a proxy,
interpolating for missing values, combining price data from multiple sources, and
extending a series based on available information. Additional sources of prices can be
obtained from proprietary sources, but at a substantial monetary cost.
Below are discussions of data sources for input and output prices as well as assumptions
that were made for each modeled country.
Input Prices
United States
Price information for the United States is the most complete of modeled countries.
Natural gas prices for industrial use in the U.S. are taken from the Energy Information
Administration (EIA) (EIA 2014). This price series is available from 1990 to 2013 with a
forecast provided by EIA out to 2032. Phosphate rock prices come from the U.S.
Geological Survey over the period of 1991 to 2012 (USGS 2014b). Values of this variable
for the forecasted period have been estimated as a function of the U.S. crude oil price
(The World Bank 2014) and the DAP output price in U.S. markets. This specification
reflects the notion that phosphate rock has value primarily as an input for phosphorus
fertilizer production, so its price is likely to be related to the price of phosphorus

42
fertilizer. U.S. FOB Tampa sulfur prices were compiled from Nexant and Sulfur
Information Services (Nexant 2009; Sulfur Information Services 2012). The FOB Tampa
sulfur price is available from these sources from 1996 to 2012 with a forecast from
Sulfur Information Services through 2017. Nexant estimates are applied to extend sulfur
price projections to 2030. Due to data availability constraints, the Tampa FOB sulfur
price was used as a proxy for sulfur prices in other modeled countries.
Canada
Natural gas prices for Canada are taken from EIA and are available from 2001 to 2010.
However this series, unlike the U.S. price series from the same source, does not come
with estimated values for the forecasted period (EIA 2010). North American natural gas
markets are tightly linked with the two price series having a correlation value of 0.9
(Figure 5.1). Given the historical similarities it is a reasonable assumption that the price
series will take similar paths into the future. For this reason the Canadian natural gas
price is linked to the U.S. natural gas price using a price linkage equation to provide a
forecast for the series out to 2030. The series is also backcast to 1997 using the same
procedure. In the absence of a Canadian phosphate rock price, the U.S. phosphate rock
price is used for Canada.

43
Figure 5.1 – U.S. and Canada Industrial Natural Gas Prices
Source: EIA 2014
China
As mentioned in the overview chapter, approximately 75% of China’s ammonia is
produced from coal rather than using natural gas. Due to data availability issues no
China coal price was available, and the Australian coal price was used in its place (The
World Bank 2014). While it would be ideal to have the Chinese coal price, it is better to
use some other coal price as a proxy than to use a natural gas price that might not
accurately represent the variable costs of producing nitrogen fertilizers in China. The
Australian coal price series is available from 1980 to 2013 and is extended to 2030 by
fitting a trend. The world phosphate rock price from The World Bank is used for China
(The World Bank 2014). This price series is available from 1980 to 2012. For model
0
2
4
6
8
10
12
2001 2002 2003 2004 2005 2006 2007 2008 2009 2010
Do
llars
pe
r M
illio
n B
TUU.S. and Canada Industrial Natural Gas
Prices
U.S. Nat. Gas Price Canada Nat. Gas

44
simulation purposes, the world phosphate rock price was estimated as a function of the
Brandt crude oil price from The World Bank and the DAP price in China to provide a
forecast to 2030 (The World Bank 2014; NDRC 2014).
India
Natural gas prices for India are compiled from Infraline, the International Energy Agency
(IEA), and a paper published by Harsh Kanani (Infraline Energy n.d.; Corbeau 2010;
Kanani 2011). This series covers the period from 1991 to 2013. Natural gas pricing for
fertilizer use in India falls under the Administrated Pricing Mechanism (APM). APM
prices were historically much lower than natural gas prices in other modeled countries
except for Russia, but recent policy changes have pushed Indian to levels closer to these
other countries. Expected APM policy changes will double the APM price of natural gas
in 2014, and is expected to increase further to $10 per million BTU in 2015 (FAI 2014;
The Times of India 2013). For the forecasted period, prices are held flat at the 2015 level
out to 2019 as Indian APM policy seems to follow a pattern of being revised
approximately once every five years. For 2020 forward a trend based on historical data
was used to forecast the remaining years of data. The same phosphate rock price used
for China was also used for India.
Russia
Natural gas prices for Russia are also taken from EIA and are available from 2001 to
2010 (EIA 2010). A trend was fit to extend this series to 2030. The same World
phosphate rock price used for China and India is used for Russia.

45
Rest of World
The ROW natural gas price used for this model is the Russian natural gas border price in
Germany which was obtained from British Petroleum (BP 2013). This price series is
available from 1985 to 2013 and is extended to 2030 through a price linkage to the
domestic natural gas price in Russia. The two Russian natural gas prices have a
correlation of approximately 0.88. The Russian export price was selected as Russia is the
largest exporter of natural gas, accounting for approximately 26% of pipeline exports in
2012(BP 2013). This price was selected as it should accurately reflect Russian export
policies that adjust the price paid by importing countries. The phosphate rock price used
for the ROW is the same as the price that was used for China, India, and Russia.
Output Price Data
United States
Farm level prices for ammonia, DAP, and potash in the United States were obtained
from the ERS (ERS 2013). Each prices series is available from 1980 to 2013. The March
price was used as it represents fertilizer costs closest to the time of application (April
prices were used between 1986 and 2008). Port ammonia and potash prices come from
the United States Geological Survey (USGS) for 1991 to 2012 (USGS 2014a; USGS 2014c).
The U.S. DAP port price was taken from the National Fertilizer Development Centre
(NFDC) of Pakistan and PotashCorp to form a combined series spanning from 1995 to
2011 (NFDC n.d.; PotashCorp 2014c).

46
Canada
The Canadian farm level ammonia price comes from the Statistics and Data
Development Branch, Alberta Agriculture and Rural Development (Alberta Agriculture
and Rural Development 2012). A port price for ammonia has not been obtained for
Canada, so the farm level price is used in place of a port price. The farm level ammonia
price is available from 1983 to 2012. The Canadian MAP farm price is from the same
source with data available from 1980 to 2012. The Vancouver FOB spot price for Canada
was taken from The World Bank for years 1980 to 2012 (The World Bank 2014).
China
All nutrient prices for China were gathered from the Price Department of the China’s
National Development and Reform Commission, National Cost of Production Data
(NDRC 2014). From this source implied prices were derived for urea, DAP, and potash
from 1998 to 2012. The urea price from this source was used in place of an ammonia
price for China.
India
For each nutrient group, fertilizer prices in China were used in the absence of Indian
fertilizer prices. While this is not an ideal solution, an assumption was required to
produce projections.

47
Russia
Russian ammonia prices were compiled from Yara International Historical Data and ICIS
monthly reports for years 1997 to 2012 (Yara 2012; ICIS 2014). Potash and DAP prices
for Russia were not available so China fertilizer prices were used in the absence of
better options.
Rest of World
Chinese prices were selected to represent ROW prices for this global fertilizer model.
These prices were chosen as they should represent the closest approximation of output
prices in ROW countries of the available sources. Fertilizers in the United States and
Canada have significantly lower costs of production than other countries around the
world. For this reason, prices in these countries were not selected to represent ROW
price levels.

48
Figure 5.2 Global Port Ammonia Prices
Sources: Listed in country sections above (CA prices are farm-level)
Figure 5.3 – Global Port DAP/MAP Prices
Sources: Listed in country sections above (CA prices are MAP farm-level prices)
0
200
400
600
800
1000
1200
1400
19
90
19
91
19
92
19
93
19
94
19
95
19
96
19
97
19
98
19
99
20
00
20
01
20
02
20
03
20
04
20
05
20
06
20
07
20
08
20
09
20
10
20
11
20
12
$/M
TGlobal Port Ammonia Prices
United States Canada China Russia
0
200
400
600
800
1000
1200
1400
19
90
19
91
19
92
19
93
19
94
19
95
19
96
19
97
19
98
19
99
20
00
20
01
20
02
20
03
20
04
20
05
20
06
20
07
20
08
20
09
20
10
20
11
20
12
$/M
T
Global Port DAP/MAP Prices
United States Canada China

49
Figure 5.4 – Global Port Potash Prices
Sources: Listed in country sections above (CA prices are farm-level)
Data Adjustments
To begin the model building process, data were gathered from the sources listed above.
Different sources come with varying degrees of reliability and must be checked for
errors and inconsistencies. For prices compiled from multiple sources, attempts were
made to collect sources with overlapping time periods to ensure consistency of the
prices series. Supply and demand variables from FAOSTAT were tested by checking the
supply and demand balance of the dataset. A residual demand category was calculated
to account for statistical discrepancies. IFDC capacity numbers were also adjusted to
always be at least 101% of reported FAOSTAT production figures so that capacity
utilization rates in the data set are always less than 100%. In addition to problems of
inconsistency of data sources, there may be cases where actual production capability
exceeds nameplate capacity.
0
200
400
600
800
1000
1200
19
90
19
91
19
92
19
93
19
94
19
95
19
96
19
97
19
98
19
99
20
00
20
01
20
02
20
03
20
04
20
05
20
06
20
07
20
08
20
09
20
10
20
11
20
12
$/M
TGlobal Port Potash Prices
United States Canada China

50
CHAPTER SIX
MODEL SPECIFICATION
In order to assess the impacts of various fertilizer scenarios that would be relevant to
policy makers and industry participants, baseline estimates for supply and demand
variables must be developed. This effort uses partial equilibrium modeling techniques to
develop a baseline model that is capable of such an endeavor. The sections below will
discuss supply and demand equation specifications for nitrogen in the United States.
Important differences in specification for phosphorus and potassium will be explained
after each nitrogen equation is discussed. Due to the high level of similarity between
nutrients, not all equations will be discussed for each nutrient.
Supply Specifications
On the supply side of the model there are three behavioral equations and one identity
equation. Capacity, capacity utilization, and imports are behavioral equations while the
production equation is an identity. Due to unique relationships between imports,
exports, and the net trade position equation, imports will be discussed along with the
other two trade variables in a later section of this chapter.
Ammonia Capacity = f [(ENRN-US / GDP DeflatorUS) t, t -1, t- 2, t-3, t- 4, t-5, t-6, Capacityt-1, Trendt]
Important in supply side equations are expected net returns (ENR) of nitrogen,
phosphorus, and potassium fertilizers. ENRN-US is the expected net returns for ammonia
in the United States. ENR for ammonia is calculated by taking the wholesale price of one

51
metric ton of ammonia in a given year and subtracting the variable costs of producing
that quantity of ammonia in the same year. As discussed, natural gas accounts for the
majority of the variable costs of producing ammonia. Cost of production for ammonia in
the United States was calculated by multiplying the price of natural gas per million BTU
in the United States by the quantity of natural gas needed to produce one metric ton of
ammonia (32.7 million BTU, according to Huang 2007).
The ammonia capacity equation was specified using a significant lagged structure due to
the long investment period required to construct ammonia production facilities. Model
parameters suggest that net returns from three years ago have the largest impact on
capacity, reflecting the approximate time required to take a plant from the planning
stage to operation. ENR for the current period and for the first and second lagged
periods are also relevant as projects can either be cancelled or delayed if higher costs of
production or lower output prices reduce potential profitability of new construction.
Longer lags are also included, as some plants take more than three years to complete.
Initial calibration efforts suggested that the short-run elasticity of capacity with respect
to ENR must be fairly small to be consistent with observed data and to generate
plausible simulation results. The lifespan of an ammonia production facility is stated as
being around 20 to 25 years, with plants often staying in production beyond this stated
lifespan (Dekker 2001). Available information suggests that production facilities are not
retired with any meaningful frequency, so the equation does include a variable to

52
represent plant retirement.4 To reflect the long lifespan of fertilizer plants and the fact
that nameplate capacity does not decrease for a given plant over time, future capacity
will largely be a function of capacity available today. For this reason lagged capacity was
also included as an important driver of future capacity. By placing a high coefficient on
this variable, close to 0.9, the modeled expansion path matches observed behavior and
implies that long-run capacity is far more price responsive than capacity is in the short
run, consistent with typical investment behavior.
Phosphoric Acid Capacity = f [(ENRP-US / GDP DeflatorUS) t, t -1, t- 2, t-3, t- 4, Capacityt-1]
This equation is relatively similar to the ammonia capacity equation with fewer lagged
terms as a reflection of the three to four year period required to build a phosphate
plant. ENR for all countries except for Canada are calculated using DAP fertilizer prices
as the indicator output prices. For Canada, the MAP price is used in the absence of a
DAP price. Phosphorus fertilizer in the form of DAP was chosen for ENR calculations as
the majority of phosphorus fertilizers consumed globally are in the DAP form (IPNI n.d.).
ENR for DAP are calculated by taking the price of one metric ton of DAP and subtracting
costs of production. Costs of production of DAP and MAP were calculated in the same
way ammonia costs of production were calculated. Inputs needed to produce one
metric ton of DAP (MAP) include approximately 1.81 (1.88) short tons of phosphate
rock, 0.485 (0.585) short tons of sulfur, and 0.25 (0.16) short tons of ammonia
(PotashCorp 2014b).
4 Meaningful, in this case, is defined as being relevant given the time frame of the model.

53
Potassium Chloride Capacity = f [(Port PriceK-US / GDP Deflator) t, t-1 , Average(Port PriceK-
US, t-6,7,8 / GDP Deflatort-6,7,8), PPI ElectricityK-US, t-7 / GDP DeflatorUS, t-7, PPI WagesK-US, t-7 /
GDP DeflatorUS, t-7, Capacityt-1, Trendt]
The capacity equation for potassium chloride was specified differently than capacity for
the other two nutrients due to differences in nutrient production processes. Instead of
using expected net returns for potassium, selected potassium fertilizer production costs
and revenues enter into the equation separately. Producer Price Indices (PPI) for wages
and electricity serve as cost drivers in the capacity equation. Revenues in the form of
the potassium chloride port price are used in place of ENR variables found in capacity
equations for nitrogen and phosphorus.
Ammonia Capacity Utilization = f [ENRN-US, t / GDP DeflatorUS, t] (Logistic Form)
Unlike capacity equations, capacity utilization equations only contain ENR in the current
period. Capacity utilization is specified using a logistic functional form to keep the
simulated values between zero and 100%. Fertilizer industries may operate below 100%
of nameplate capacity for a number of reasons. Unfavorable fertilizer prices, high
domestic input cost, and maintenance requirements may force less efficient facilities to
operate below maximum capacity, or even temporarily halt production altogether.
The capacity utilization equation for potassium fertilizers contains the deflated
potassium chloride port price and the same PPI variables as used in the capacity
equation. Phosphorus capacity utilization is specified in the same manner as the
ammonia capacity utilization equation.

54
Ammonia Production = Ammonia Capacity * Ammonia Capacity Utilization
Rather than estimating production directly, the model developed here calculates
production as the product of capacity and the capacity utilization rate.
Demand Specifications
Demand side equations include application rates for corn, soybeans, wheat, cotton,
rapeseed, and rice. Additionally, an “other crops” fertilizer use category, fertilizer use
identity, non-fertilizer use equation, domestic consumption identity, and residual
balance category are used to provide a forecast for the demand side of nutrient
markets.
Application rate equations are very similar across crop varieties and nutrient categories.
For this reason, only the corn application rate equation is discussed.
Corn Nitrogen Fertilizer Use per Acre = f [(Farm PriceCorn-US / GDP Deflator US) t-1, Farm
PriceN-US, t / GDP DeflatorUS, t]
The nitrogen application rate for corn is specified as being a function of the lagged corn
farm price, and the current period retail level ammonia price. Higher ammonia prices
should reduce nitrogen fertilizer consumption, given the expected downward sloping
factor demand curves. When planting decisions are made, farmers do not yet know
what the price of corn will be at harvest time. However, the price of corn in the previous
year is known, and is used in this model as a proxy for the price expected by corn

55
producers. The relationship between commodity output prices and nutrient use is
positive as a higher output price should encourage higher levels of fertilizer use.
Other Crops Nitrogen Fertilizer Use = f [Trend, Farm PriceN-US, t / GDP DeflatorUS,t]
Use of nitrogen fertilizers by crops not modeled separately is specified as a function of a
simple trend and the real farm level ammonia price in the current period. Prices for all
commodities that would make up the other crops category were not available. A
positive trend term is consistent with the observed data, and could reflect changes in
both area for non-modeled crops and changes in per-hectare application rates. The
other crops category includes vegetables, other grains and oilseeds, sugar beets, and
other crops not explicitly broken out in the model. Rice use is modeled for China and
India, but not for other countries. Initial regression estimation was performed on this
equation with elasticity values adjusted in the case of poor model performance or
incorrect signs on coefficients.
Nitrogen Fertilizer Use = Corn Nitrogen Use Per Acre * Corn Harvested Area + Soybean
Nitrogen Use Per Acre * Soybean Harvested Area + … + Other Crops Nitrogen Use
Nitrogen fertilizer use is the summation of the individual demands from each crop.
Nitrogen demand from each crop is calculated by taking individual crop application rates
and multiplying those values by area harvested for the same crop. Summing across
individual crop demands and other crops demand yields total nitrogen fertilizer use.

56
Nitrogen Non-Fertilizer Use = f [Trend, Farm PriceN-US, t / GDP DeflatorUS,t]
As discussed previously, nutrient use can come from industrial sources outside of the
agricultural industry. This equation is specified using the same variables as the other
crops nitrogen use equation but with different elasticities. As with the other crops use
equation, initial regression estimation was performed for this variable and elasticity
values were adjusted in the case of poor model performance or to ensure signs on
coefficients that matched theoretical expectations.
Nitrogen Domestic Consumption = Nitrogen Fertilizer Use + Nitrogen Non-Fertilizer Use
The domestic consumption identity is simply the summation of the two major demand
categories.
Nitrogen Net Imports = Domestic Consumption – Production – Residual
In the case of ammonia, the U.S. is a net importer. The net trade equation reflects a
simple accounting identity; if there are no stocks, net trade should simply be the
difference between domestic production and consumption. To ensure this accounting
identity holds, a residual term must be added to account for any statistical
discrepancies. This residual term is held constant in the projection period.
Solving the Model
In order for the model to produce a forecast, a few additional steps must be completed.
Acquiring a model solution requires the use of an equilibrator. An equilibrator is a
mechanism that solves for chosen world market clearing prices. U.S. port prices for each

57
nutrient group were the equilibrating prices for this model. Prices in other modeled
countries and prices at different marketing levels are connected through price linkage
equations. International port prices are linked to the U.S. equilibrating port price. U.S.
farm level prices are linked to U.S. port prices.
The world net trade position is calculated as the sum of the trade positions from the five
modeled countries and the ROW region. As the World net trade position changes, the
equilibrating price in the model adjusts by a percentage of the change in this position.
Prices are increased if world imports exceed world exports, and prices are reduced if
world exports exceed world imports. As equilibrating prices adjust, price linkage
equations allow prices in other countries to adjust accordingly, and as these prices shift,
modeled equations adjust to new prices levels. The process iterates until the world net
trade position is equal to zero, corrected for a fixed assumed difference between world
exports and imports, based on observed historical data discrepancies. When this
process is complete, the model has achieved equilibrium.
The equilibrium solution is unique, and is dependent on the current and historical values
of exogenous variables and model parameters. A model solution is called a baseline and
can be used to test shocks and scenarios on the model. By comparing the model before
and after a shock has been performed one can assess model performance and test the
effects of changes in policy and other market factors.

58
CHAPTER SEVEN
BASELINE RESULTS
A baseline level of modeled variables was constructed in order to determine the effects
of relevant shocks and scenarios. A global partial equilibrium model was synthetically
constructed using elasticity estimates from various other studies in order to produce the
baseline model forecast. Forecasted results are available to 2030. Important model
simulation results will be discussed below, accompanied by summary figures of U.S.
data at the end of this chapter. Discussion here will focus on fertilizer markets in the
United States while data for all modeled countries can be viewed in Appendix A.
Supply
IFDC estimates of capacity expansion to 2017 were used to calibrate capacity estimates
for the baseline forecast (IFDC 2013). IFDC also provides a long-run estimate of future
capacity that the model utilizes as a guideline for capacity in 2030. IFDC estimates
suggest that capacity will increase or stay relatively flat for each of the three nutrient
groups within each of the modeled countries and the aggregated ROW region. Larger
declines in prices would be expected in the forecast if long-run IFDC estimates were
more aggressively pursued in place of current more restrained assumptions (IFDC 2014).
Nitrogen Fertilizer Supply
The model estimates that U.S. nitrogen fertilizer capacity will increase approximately
53% by 2030 at an average rate of around 2.3% per year. This translates into an increase
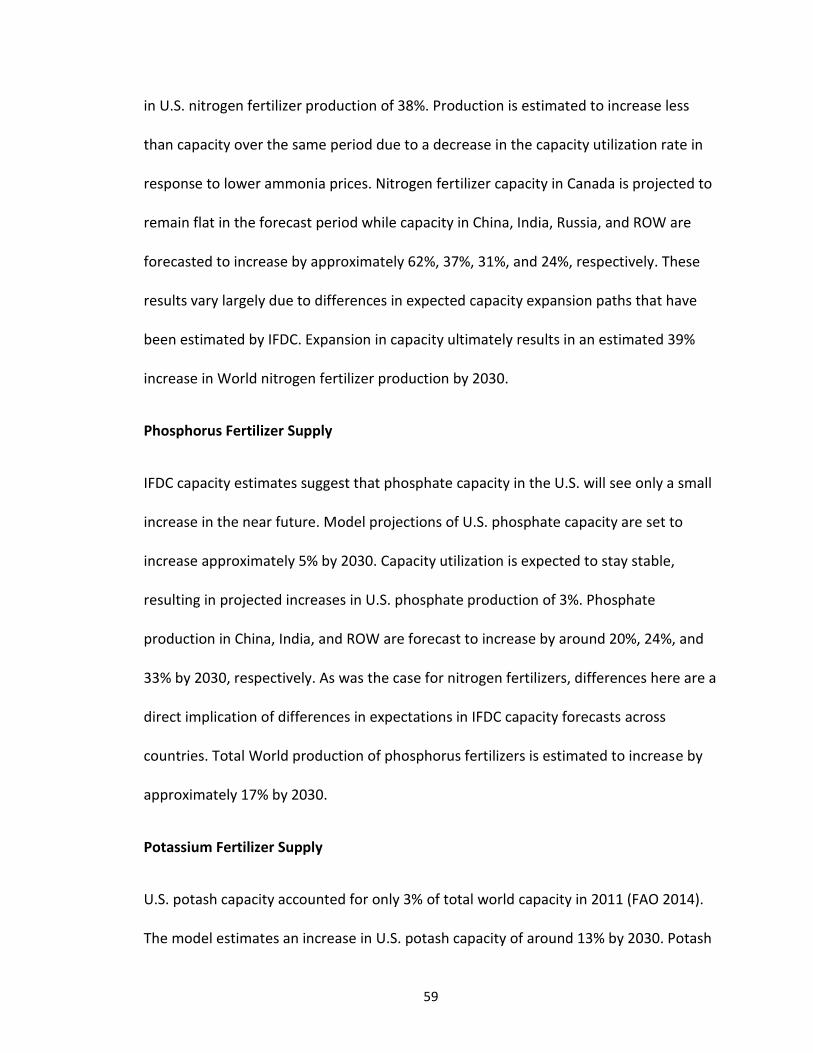
59
in U.S. nitrogen fertilizer production of 38%. Production is estimated to increase less
than capacity over the same period due to a decrease in the capacity utilization rate in
response to lower ammonia prices. Nitrogen fertilizer capacity in Canada is projected to
remain flat in the forecast period while capacity in China, India, Russia, and ROW are
forecasted to increase by approximately 62%, 37%, 31%, and 24%, respectively. These
results vary largely due to differences in expected capacity expansion paths that have
been estimated by IFDC. Expansion in capacity ultimately results in an estimated 39%
increase in World nitrogen fertilizer production by 2030.
Phosphorus Fertilizer Supply
IFDC capacity estimates suggest that phosphate capacity in the U.S. will see only a small
increase in the near future. Model projections of U.S. phosphate capacity are set to
increase approximately 5% by 2030. Capacity utilization is expected to stay stable,
resulting in projected increases in U.S. phosphate production of 3%. Phosphate
production in China, India, and ROW are forecast to increase by around 20%, 24%, and
33% by 2030, respectively. As was the case for nitrogen fertilizers, differences here are a
direct implication of differences in expectations in IFDC capacity forecasts across
countries. Total World production of phosphorus fertilizers is estimated to increase by
approximately 17% by 2030.
Potassium Fertilizer Supply
U.S. potash capacity accounted for only 3% of total world capacity in 2011 (FAO 2014).
The model estimates an increase in U.S. potash capacity of around 13% by 2030. Potash

60
capacity expansion in other countries and ROW are estimated to increase more
significantly, excluding India where potassium fertilizers are not produced. Aligning
model forecasts with IFDC estimates of potash capacity expansion for Canada, China,
Russia, and ROW resulted in increases of 72%, 49%, 47%, and 18%, respectively. The
model forecasts an increase in world potassium fertilizer production of approximately
34%.
Demand
Unlike supply side projections, which are strongly influenced by capacity expansion path
estimates from IFDC, demand projections cannot rely on a similar benchmark, so must
be based on model equations and judgments about likely future trends.
Nitrogen Fertilizer Demand
In the U.S., nitrogen fertilizer use increased by approximately 8% from 2002 to 2011. In
response to lower forecasted ammonia prices, the model estimates an increase in
fertilizer use of approximately 15% between 2011 and 2030. Exogenous commodity
prices during the same period see a small downward trend which puts downward
pressure on fertilizer application rates. Similarly, total crop area in the U.S. for included
crop varieties is projected to decrease slightly from the high levels seen in 2012 but is
projected to remain higher than 2011 levels. If recent trends continue, then non-
fertilizer and other crop use will be the source of future increases in consumption.

61
Breaking down U.S. nitrogen fertilizer use by the individual crops reveals that the largest
increases in projected use during the forecast period come from the other crops
category. Historically, the majority of the increase in fertilizer use came from corn
production. However, in the forecast period, fertilizer demand from corn is projected to
be almost flat, decreasing around 4% by 2030. Application rates of nitrogen on corn stay
relatively flat in the forecast period, so most of the decrease in nitrogen fertilizer
demand comes from small decreases in corn area. Nitrogen fertilizer use from wheat
and soybeans are projected to increase by 8% and 6% respectively. Demand for cotton is
projected to decrease by 10% while demand from rapeseed is projected to more than
double by 2030, but start from a very small initial level.
Non-fertilizer use of nitrogen in the U.S. increased 27% between 2002 and 2011 (FAO
2014). Non-fertilizer use continues to increase in the forecasted period ending 25%
higher by the end of the period than it was in 2011. World total nitrogen fertilizer
demand, including both fertilizer and non-fertilizer uses, is projected to increase 36% by
2030 with the majority of demand growth to come from China, India, and the ROW.
Nitrogen domestic consumption in China is projected to increase more rapidly than
projected growth in production of the separately modeled crops. The historical data
used for this analysis suggests a rapid increase has occurred in use by non-modeled
crops, and the projections show this rate of growth increasing. Increases in ammonia
capacity, and production in China have generally matched increases in the amount of
fertilizer consumed domestically. Historically, production and domestic consumption

62
had a correlation of 0.98.5 While correlation does not imply causality, it is likely that
some causal relationship exists between production and the amount of fertilizer
consumed domestically in the short-run, as the country has been reluctant to trade
fertilizer. For this reason, large estimated increases in China ammonia capacity and
production were modeled to reflect this relationship and in turn, caused proportionate
increases in ammonia consumption domestically. As Chinese fertilizer markets evolve
and domestic consumers are no longer able to increase consumption as quickly, it is
possible that China will become more likely to export a higher percentage of nitrogen
production. Total fertilizer demand in China increases 71% during the forecast period.
Phosphorus Fertilizer Demand
Projections for U.S. phosphorus fertilizer markets suggest fertilizer use increases of 5%
in the forecast period. Expected changes in fertilizer demand for phosphorus are much
smaller than for nitrogen fertilizer demand. From 2002 to 2008 phosphate fertilizer use
in the U.S. decreased by approximately 16%, but from 2008 to 2011 demand recovered
by 22%. Non-fertilizer use in the U.S. accounts for the majority of domestic
consumption. Reported non-fertilizer use nearly quadrupled from 2002 to 2008, but in
the following year dropped 21% and by 2011, had not fully recovered to 2008 levels,
raising some questions about the reliability of the reported data. For this reason, a more
5 The correlation between ammonia production and other crops demand had a value of 0.97 for the same
period. This category accounted for the majority of the increases in demand in the historical period. Non-fertilizer use is not reported for China. Therefore, some of the increase in the other crops demand category could have come from unreported non-fertilizer sources.

63
modest increase of around 9% was projected for this variable in the forecast period. The
combined effect on domestic consumption was a projected increase of 8%.
Of the remaining countries, China, India, and the ROW make up the majority of
remaining Global demand for phosphorus fertilizers. Projections for China, India, and
ROW show increases in fertilizer use of 19%, 7%, and 26% by 2030, respectively. Non-
fertilizer use of phosphorus fertilizers is not reported for these countries. Total world
phosphorus demand is projected to increase 16% in the forecast period.
Potassium Fertilizer Demand
Of the major fertilizer nutrients, potassium is the least consumed in the United States.
Historically, potassium fertilizer consumption was relatively stable until 2008 and 2009
when use dipped temporarily before returning roughly to 2007 levels by 2010. By 2011,
potassium fertilizer use had increased 28% above the trough of 2009. For the forecasted
period the model projects growth in potassium fertilizer use of 9%. Data on non-
fertilizer use in the U.S. suggest growth from 2002 to 2008 of 250%. However, FAO data
for non-fertilizer use of potassium are a cause for concern; in 2009 the category had a
value of zero, which seems implausible. For the forecast period, non-fertilizer use was
projected to grow 29%. The combined effect on total domestic consumption of
potassium was an increase of 17% by the end of the forecast period.
Reported potassium fertilizer use in China saw more significant changes, historically,
than U.S. As in the U.S., the reported annual changes have been erratic; in 2011 alone,
reported potassium fertilizer use in China increased 42% over the level in 2010 after

64
back-to-back decreases in 2008 and 2009. For the forecast period, potassium fertilizer
use in China is estimated to increase approximately 26%. ROW and India fertilizer use
are projected to increase 42% and 40% respectively. Total world domestic consumption
of potassium fertilizers was projected to increase 32% by 2030.
Fertilizer Prices
For each nutrient group an output price was chosen to represent revenues gained from
the sale of fertilizer output and the costs paid by farmers to employ units of fertilizer
inputs. Ammonia was selected for nitrogen, diammonium phosphate for phosphorus,
and potassium chloride (potash) for potassium fertilizers. The following discussion is of
U.S. prices only, with other prices in tables available at the end of chapter five.
Nitrogen Fertilizer Prices
The period from 2008 to 2012 experienced the highest average annual prices of
ammonia in the United States. This was despite natural gas prices dropping by more
than 50% in 2009 and remaining approximately 50% lower than 2008 levels until 2012.
Ammonia prices also experienced a drop in 2009 of 58%. Prices recovered, and by 2012
ammonia prices were within 3% of the highs of 2008 while natural gas prices were still
far below 2008 levels. Due to high output prices, and low variable costs of production,
calculated average profit margins during the period of 2008 to 2012 were more than six
times larger than the average for the preceding 17 years.

65
Some justification of high ammonia prices may come from a capacity shortage issue.
However, as capacity responds to the high level of profitability in the industry, these
margins should tend toward the historical average. How quickly this happens depends
on how quickly capacity is able to react. Given barriers to entry in fertilizer markets,
expected paths of exogenous natural gas prices, and trends in endogenous variables
discussed above, Figure 7.1 indicates why margins are likely to decline from recent
levels.
Figure 7.1 – U.S. Ammonia Profit Margin
Source: Natural Gas Prices (EIA 2010), Ammonia Price History (USGS 2014a), Ammonia Price Forecast
(Model Results)
Ammonia profit margins are expected to come down from the high levels seen in 2012.
Initially, this occurs rapidly as planned capacity comes on line, especially in China, where
IFDC reports significant planned increases in capacity for 2014 and 2015.
-100
0
100
200
300
400
500
19
91
19
93
19
95
19
97
19
99
20
01
20
03
20
05
20
07
20
09
20
11
20
13
20
15
20
17
20
19
20
21
20
23
20
25
20
27
20
29
$/M
T
U.S. Ammonia Profit Margin
History Forecast

66
Phosphorus Fertilizer Prices
Ammonia markets were not the only fertilizer market to see high profit margins in
recent years. Phosphorus markets also saw large spikes in 2007 and 2010. In 2007, DAP
profit margins were seven times larger than the average from 2000 to 2006 and nearly
fourteen times larger than the average from 1991 to 2006. However, a combination of
high ammonia and sulfur prices in 2008 forced DAP profit margins back toward the
historical average. In 2009, higher phosphate rock prices put downward pressure on
profit margins but significantly lower sulfur and ammonia prices outweighed this effect,
resulting in higher profit margins in 2009. In 2010, phosphate rock prices came down
significantly while ammonia prices had not yet reached their second peak. This allowed
profit margins for DAP to increase further in 2010. Ammonia prices in the following year
increased to a point where profit margins returned to a level that was closer to historical
averages. Figure 7.2 is one depiction of what could happen to DAP margins in the
coming years.

67
Figure 7.2 – U.S. DAP Profit Margin
Source: Sulfur Price (Nexant 2009; Sulfur Information Services 2012), Ammonia Price (USGS 2014a;
Steiner Model), Phosphate Rock (USGS 2014b), DAP Price Historical (NFDC n.d.; PotashCorp 2014), DAP
price forecast (Model Results)
Phosphorus profit margins are likely to tend towards historical averages in the forecast
period. As with ammonia, many different assumptions were tested for phosphorus
fertilizer markets including how quickly to allow capacity to expand.
Potassium Fertilizer Prices
Much like the other two nutrient groups, potassium fertilizers experienced a run-up in
prices from 2008 to 2012 with the average price for the period being almost four times
greater than the 1991-2007 period average. Figure 7.3 shows projected potassium
chloride prices through 2030.
-200
-100
0
100
200
300
400
500
600
19
91
19
93
19
95
19
97
19
99
20
01
20
03
20
05
20
07
20
09
20
11
20
13
20
15
20
17
20
19
20
21
20
23
20
25
20
27
20
29
$/M
TU.S. DAP Profit Margin
History Forecast

68
Figure 7.3 – U.S. Potassium Chloride Price
Source: KCl price history (USGS 2014c), KCl Price Forecast (Model Results)
As with both of the other nutrient categories, prices in potassium chloride markets are
projected to return closer to historically observed levels. The decline assumes that
market structure in the industry is sufficiently competitive that recent high prices and
profitability cannot persist.
0
100
200
300
400
500
600
19
91
19
93
19
95
19
97
19
99
20
01
20
03
20
05
20
07
20
09
20
11
20
13
20
15
20
17
20
19
20
21
20
23
20
25
20
27
20
29
$/M
TU.S. Potassium Chloride Price
History Forecast

69
Figure 7.4 – U.S. Nitrogen Fertilizer Supply and Demand
Sources: 2005/2012 S&D data (FAO 2014), 2005/2012 Farm Ammonia Price (ERS 2013), 2005/2012 Ammonia Port Price (USGS 2014a), 2005/2012 Urea Farm Price (ERS 2013), Forecasted values (Model Results)
United States Nitrogen Fertilizer Supply and DemandUnits 2005 2012 2015 2030
1000 Nutrient Tonnes
Supply
Capacity 9570 9712 11550 14419
Capacity Utilization (Implied) 86.9% 95.3% 90.7% 84.5%
Production 8317 9258 10476 12181
Imports 10414 9840 9509 9088
Total Supply 18731 19098 19985 21269
Demand
Total Nitrogen Fertilizer Use 11014 12369 12514 12866
Corn Nitrogen Fertilizer Use 4441 5925 5631 5213
Wheat Nitrogen Fertilizer Use 1588 1525 1534 1545
Soybean Nitrogen Fertilizer Use 136 116 118 120
Rapeseed Nitrogen Fertilizer Use 51 107 135 128
Cotton Nitrogen Fertilizer Use 317 344 278 277
Other Crops Nitrogen Fertilizer Use 4480 4352 4818 5582
Non Fertilizer Use 5444 5277 5990 6823
Domestic Consumption 16458 17646 18503 19689
Exports 2273 1452 1482 1580
Total Demand 18731 19098 19985 21269
Residual 0 0 0 0
$US per Metric Tonne
Fertilizer Prices
Anhydrous Ammonia Port Price 335 634 482 447
Anhydrous Ammonia Farm Price 459 863 659 612
Urea Farm Price 332 554 427 397

70
Figure 7.5 – U.S. Phosphorus Fertilizer Supply and Demand
Sources: 2005/2012 S&D data (FAO 2014), 2005/2012 Farm DAP Price (ERS 2013), 2005/2012 DAP Port Price (NFDC n.d.; PotashCorp 2011), Forecasted values (Model Results)
United States Phosphorus Fertilizer Supply and DemandUnits 2005 2012 2015 2030
1000 Nutrient Tonnes
Supply
Capacity 11554 14327 14361 15127
Capacity Utilization (Implied) 99.0% 92.0% 91.6% 91.2%
Production 11439 13186 13151 13800
Imports 627 1151 1218 1294
Total Supply 12067 14337 14369 15093
Demand
Total Phosphorus Fertilizer Use 4121 4157 4184 4167
Corn Phosphorus Fertilizer Use 1575 1855 1830 1734
Wheat Phosphorus Fertilizer Use 875 660 665 672
Soybean Phosphorus Fertilizer Use 437 384 393 396
Rapeseed Phosphorus Fertilizer Use 12 21 26 25
Cotton Phosphorus Fertilizer Use 137 118 98 99
Other Crops Phosphorus Fertilizer Use 1085 1120 1172 1241
Non Fertilizer Use 3586 7578 8090 8689
Domestic Consumption 7707 11735 12275 12857
Exports 4360 2602 2094 2237
Total Demand 12067 14337 14369 15093
Residual 0 0 0 0
$US per Metric Tonne
Fertilizer Prices
DAP Port Price 263 565 436 433
DAP Farm Price 334 800 598 595

71
Figure 7.6 – U.S. Potassium Fertilizer Supply and Demand
Sources: 2005/2012 S&D data (FAO 2014), 2005/2012 Farm KCl Price (ERS 2013), 2005/2012 KCl Port Price (USGS 2014c), Forecasted values (Model Results)
United States Potassium Fertilizer Supply and DemandUnits 2005 2012 2015 2030
1000 Nutrient Tonnes
Supply
Capacity 1566 1485 1541 1670
Capacity Utilization (Implied) 76.7% 53.3% 52.5% 50.7%
Production 1200 791 809 846
Imports 6116 6574 6767 7753
Total Supply 7316 7365 7576 8599
Demand
Total Potassium Fertilizer Use 4448 4397 4382 4629
Corn Potassium Fertilizer Use 1830 2023 1954 1886
Wheat Potassium Fertilizer Use 670 509 506 539
Soybean Potassium Fertilizer Use 656 747 758 793
Rapeseed Potassium Fertilizer Use 13 24 31 31
Cotton Potassium Fertilizer Use 195 161 132 139
Other Crops Potassium Fertilizer Use 1084 932 1002 1241
Non Fertilizer Use 2785 2822 3041 3786
Domestic Consumption 7233 7219 7423 8415
Exports 83 146 152 184
Total Demand 7316 7365 7576 8599
Residual 0 0 0 0
$US per Metric Tonne
Fertilizer Prices
Potassium Chloride Port Price 171 467 383 197
Potassium Chloride Farm Price 270 713 583 316

72
CHAPTER EIGHT
FERTILIZER MARKET SCENARIOS
In order to test the reliability and responsiveness of the model to exogenous changes in
policy and market conditions, the following shocks were imposed.
D. Sustained 10% increase of North American natural gas prices from 2013 to 2030
E. Sustained 10% tax on U.S. ammonia farm price from 2013 to 2030
F. Sustained 10% decrease of U.S. corn acreage from WAEES baseline from 2013 to
2030
Results will be assessed by comparing the equilibrium levels of model output after each
shock to baseline levels. The analysis discussed here will focus on U.S. fertilizer markets.
Scenario 1 – Natural Gas Price Shock
The first shock imposed on the model is an increase in natural gas prices for North
American markets. Natural gas prices in Canada and the United States are increased by
10% from 2013 to 2030. This shock could be viewed as a tax on natural gas or some
other exogenous cause for an increase in natural gas prices.

73
Figure 8.1 – 10% Increase of North American Natural Gas Prices
Source: Model Results
As a direct implication of an increase in natural gas prices one would expect a decrease
in production of nitrogen fertilizer in both the United States and Canada due to higher
costs of production. In fact, immediate model impacts are decreases in capacity and the
capacity utilization rate in North America, leading to decreases in production. The short-
term combined production response is a decrease of about 0.4% in the two North
American markets. In the long-run, after firms have enough time to fully adjust to lower
net returns, North American production sees a 2.4% decrease from baseline levels.
Decreases in production immediately result in suppressed levels of exports. Imports are
expected to increase in an attempt to satisfy domestic demand for nitrogen fertilizer.
Upward pressure is applied to domestic prices of ammonia due to lower domestic
availability of nitrogen fertilizers. U.S. ammonia prices are slated to increase by roughly
0.1% in 2013 and end approximately 1.4% higher than baseline projections in the long-
run. Domestic consumption is significantly less responsive due to the inelastic nature of
nitrogen fertilizer use, decreasing from baseline levels by less than 0.1% in the short-run
and 0.3% in 2030 for North American markets.
Sustained 10% Increase of North American Natural Gas Prices from 2013 to 20302013 2020 2030 2013 2020 2030
NA Nitrogen Fertilizer Production - Mil. MT 13.0 15.3 15.3 -0.4% -1.4% -2.4%
Non-NA Nitrogen Fertilizer Production - Mil. MT 107.2 129.6 140.6 0.0% 0.1% 0.1%
NA Nitrogen Domestic Consumption - Mil. MT 21.0 21.9 22.3 0.0% -0.2% -0.3%Non-NA Nitrogen Domestic Consumption - Mil. MT 102.0 125.7 136.3 0.0% -0.1% -0.1%
U.S. Port Ammonia Price - $/MT 598 428 447 0.1% 0.9% 1.4%
Baseline Levels Changes from Baseline

74
Exports of nitrogen fertilizer elsewhere in the world are expected to increase in
response to higher levels of imports desired by U.S. and Canadian nitrogen fertilizer
markets as transmitted through higher ammonia prices. As a consequence of a higher
level of exports, ammonia prices in the rest of the world increase, causing reductions in
domestic consumption of 0.1% in 2030 for countries outside of the U.S. and Canada.6 At
the new levels of ammonia prices, production is expected to rise by 0.1% in 2030 for
these countries. These are small proportional changes, but given the relative sizes of
North American and other markets, the absolute changes in the rest of world
necessarily balance the estimated changes in North American markets.
In addition to consequences for nitrogen, phosphorus markets also experience changes,
as increases in the price of ammonia increases the cost of producing DAP fertilizer. This
reduces net returns for phosphorus fertilizers, leading to lower levels of production than
in baseline projections. Lower levels of production put upward pressure on DAP prices,
which in turn result in decreased domestic consumption of phosphorus fertilizers for all
countries in the model. However, these results are small as the effect on production
costs derived from ammonia price increases is not large enough to change phosphorus
production by a meaningful magnitude.
Scenario 2 – U.S. Ammonia Farm Price Tax
The second shock imposed on the model is an increase in the farm-level ammonia price
in the United States. This price series is increased by 10% from 2013 to 2030. A nitrogen
6 It should be noted that “rest of the world” here is not meant to signify the ROW region as defined
previously, but rather all countries other than the U.S. and Canada.

75
fertilizer tax is a commonly discussed policy option and has appeared many times in
recent literature including the work of Rosas (2012) who examined a tax on N2O
emissions at CO2 equivalence, and Berntsen et al. (2002) who looked at various nitrogen
tax scenarios, among others (Rosas 2012; Berntsen 2002).
Figure 8.2 – 10% Tax on U.S. Farm-Level Ammonia Prices
Source: Model Results
The direct expected effects of an increase in farm ammonia prices in the United States
are a decrease in the application rate of nitrogen for each crop and lower demand from
the other crops category. Non-fertilizer use is also expected to decrease, resulting in an
overall decrease in domestic consumption. In fact, the model captures a reduction in
2013 of 2.2%, and a 1.3% reduction from baseline levels in 2030. Of the individually
modeled commodities, the largest changes in fertilizer demand come from corn and
wheat. These commodities see respective decreases of 1.2% and 1.7% in 2013. Long-run
effects are smaller with only a 0.8% reduction in corn nitrogen fertilizer use and a
decrease of 1% in wheat nitrogen fertilizer use. Of the modeled crop varieties, these
two crops account for the largest portion of nitrogen fertilizer consumed. For this
Sustained 10% Tax on U.S. Farm-Level Ammonia Prices from 2013 to 20302013 2020 2030 2013 2020 2030
U.S. Nitrogen Fertilizer Production - Mil. MT 9.6 12.2 12.2 -0.2% -0.5% -0.6%
Non-U.S. Nitrogen Fertilizer Production - Mil. MT 110.6 132.7 143.8 -0.1% -0.1% -0.1%
U.S. Nitrogen Fertilizer Use - Mil. MT 13.0 12.9 12.9 -1.6% -1.1% -1.0%
U.S. Non-Fertilizer Use - Mil. MT 5.5 6.4 6.8 -3.4% -2.0% -1.7%
U.S. Nitrogen Domestic Consumption - Mil. MT 18.5 19.3 19.7 -2.2% -1.4% -1.3%
Non-U.S. Nitrogen Domestic Consumption - Mil. MT 104.5 128.3 139.0 0.3% 0.1% 0.0%
U.S. Farm Ammonia Price - $/MT 815 586 612 -1.3% -0.6% -0.6%
Net Effect of Tax on Farm-Level Costs - - - 8.7% 9.4% 9.4%
U.S. Port Ammonia Price - $/MT 598 428 447 -1.3% -0.6% -0.6%
Baseline Levels Changes from Baseline

76
reason, the largest absolute changes in fertilizer use should be expected to come from
these commodities. The magnitudes of these projections seem reasonable given the
inelasticity of fertilizer demand with respect to fertilizer prices. Non-fertilizer use in the
U.S. is projected to see 3.4% reductions below baseline levels in 2013, but end only 1.7%
below baseline projections in 2030.
In response to lower levels of domestic consumption, port and farm level ammonia
prices of nitrogen fertilizers are expected to decrease from baseline levels by 1.3% in the
short-run, resulting in a net tax effect of an 8.7% increase in farm-level fertilizer costs to
producers. The long-run effect is a decrease of 0.6% from baseline levels. Basic
economic theory would insist that a reduction in producer ammonia prices should result
in a decrease in production of nitrogen fertilizer in the U.S. due to lower net returns.
The model is consistent with this notion, projecting reductions in U.S. nitrogen fertilizer
production of 0.2% in 2013 and by 2030, projecting values 0.6% below baseline levels.
U.S. exports are expected to increase slightly. Cheaper domestic prices for fertilizer
inputs in other countries around the world encourage additional consumption of
nitrogen fertilizers in those countries. Also, a decrease in net returns causes production
in countries outside of the U.S. to fall. Lower levels of production negatively impact
exports. However, a combination of increases in foreign nutrient requirements and
lower levels of foreign availability of nitrogen fertilizers results in increases in the level
of fertilizer imports in these countries compared to the baseline case.

77
Scenario 3 – Decrease in U.S. Corn Area
The final shock imposed on the model is a 10% reduction in U.S. corn area from baseline
levels in each year. In order to avoid imposing large swings in total crop area, soybean
area is assumed to replace 80% of the reduction in corn area, with the remaining 20% of
reduced area added to U.S. wheat. The majority of the weight was given to soybeans
because crop rotation is common between corn and soybean acres as a part of standard
soil conservation management practices (Roth 1996). No changes are assumed in land
use in other countries. As with the first two shocks, the duration of the impact is from
2013 to 2030.
Figure 8.3 – Sustained 10% Decrease of U.S. Corn Acreage from WAEES Baseline Levels
Source: Model Results
Given the relative levels of demand for nitrogen, phosphorus, and potassium derived
from the examined crops, a reduction in total nitrogen fertilizer use is expected to
occur. While it is widely understood that the highest application rates of each fertilizer
type are used on acres of corn, this fact can be more readily observed by looking at
historical application rates data (Rosas 2012; ERS 2013). Nitrogen application rates per
Sustained 10% Decrease of U.S. Corn Acreage from WAEES Baseline from 2013 to 20302013 2020 2030 2013 2020 2030
U.S. Nitrogen Fertilizer Production - Mil. MT 9.6 12.2 12.2 -0.2% -0.7% -1.0%U.S. Phosphorus Fertilizer Production - Mil. MT 13.2 13.2 13.8 0.0% -0.1% 0.0%U.S. Potassium Fertilizer Production - Mil. MT 0.8 0.8 0.8 -0.1% -0.1% -0.1%
U.S. Nitrogen Fertilizer Use - Mil. MT 13.0 12.9 12.9 -4.1% -3.6% -3.4%
U.S. Phosphorus Fertilizer Use - Mil. MT 4.3 4.2 4.2 -3.0% -2.8% -2.7%
U.S. Potassium Fertilizer Use - Mil. MT 4.5 4.6 4.6 -2.5% -2.2% -2.2%
U.S. Port Ammonia Price - $/MT 598 428 447 -1.6% -1.2% -1.1%
U.S. Port DAP Price - $/MT 551 387 433 -1.3% -0.8% -0.8%U.S. Port Potash Price - $/MT 480 232 197 -1.4% -2.1% -0.4%
Baseline Levels Changes from Baseline

78
acre of soybeans were applied at an average of approximately 3% of the rate applied to
corn over the observed period.7 Using the same comparison for wheat, it was found that
nitrogen fertilizer is applied at approximately 50% of the rate applied to corn.
Phosphorus is applied to soybeans at an average of 25% of the rate applied to corn.
Phosphorus fertilizers were applied to wheat at an average of approximately 73% of the
rate applied to corn acres during the historical period. Potassium fertilizers were applied
at approximately 40% and 64% of the rate applied to corn, on soybean and wheat
acreage respectively. Lower levels of impact should be expected for phosphorus and
potassium markets as application rates are much more similar between corn, wheat,
and soybeans. These relationships result in smaller reductions in demand, given the
proposed substitution.
Applying this knowledge would suggest an expected initial impact of reduced total
fertilizer use of each nutrient, or a shift to the left by demand curves for nitrogen,
phosphorous, and potassium fertilizers. Increases in soybean and wheat area should
offset some portion of fertilizer use that was lost due to decreases in corn area, but use
is expected to stay well below baseline levels. Model results are consistent with this
intuition, with projected decreases from baseline levels of nitrogen fertilizer
consumption in the U.S. of 4.1% in 2013 and smaller decreases of 3.4% in 2013.
Phosphorus and potassium fertilizer use see decreases of 3% and 2.5% in the short-run,
and end 2.7% and 2.2% below baseline levels in the long-run. Decreases in demand for
7 Farmers do not apply nitrogen to soybeans because they think that soybeans need nitrogen, but because
there is nitrogen in DAP fertilizer.

79
nitrogen leads to lower prices in U.S. fertilizer markets and lower import quantities due
to less fertilizer desired domestically. However, lower price levels encourage some
additional non-fertilizer use with levels 0.6% above baseline projections in 2013 and
long-run increases of only 0.2%.
Lower net returns cause domestic nitrogen production in the U.S. to decrease. Also, the
decrease in prices domestically should make prices elsewhere in the world more
attractive to U.S. producers and should result in increases in U.S. exports of nitrogen,
phosphorus, and potassium fertilizer. The model projects decreases in U.S. port
ammonia prices of 1.6% in 2013, and decreases of 1.1% in 2030 from baseline levels.
Port prices for phosphorus and potassium fertilizers see similar decreases in the short-
run of 1.3% and 1.4% respectively. Long-run impacts are smaller at a 0.8% reduction in
phosphorus prices and 0.4% reductions in potassium port prices in the United States.
Production of nitrogen fertilizer is expected to decrease from baseline levels of 0.2% in
2013 and 1% in 2030. Production of phosphorus and potassium fertilizers is expected to
fall below baseline levels by less than 0.1% in 2030. As expected, the model projects
decreases in imports into the U.S. and higher levels of exports.
The impacts on nitrogen, potassium, and phosphorous fertilizers markets for countries
outside of the U.S. are small, but directional changes for these countries are as follows.
In each of these markets it is expected that prices should decrease in response to a
combination of lower prices in the U.S. and fewer net imports of fertilizers from U.S.
markets. Lower prices in these countries are expected to encourage additional

80
consumption of fertilizer inputs and lower levels of production due to the reduction in
net returns. Because decreases in production leave domestic availability stifled, exports
of fertilizers decrease from baseline levels, while imports increase to meet the
requirements of additional quantities of fertilizer demanded domestically.

81
CHAPTER NINE
SUMMARY AND CONCLUSIONS
The purpose of this thesis was to construct a synthetic partial equilibrium model of
global nitrogen, phosphorus, and potassium fertilizer markets that is capable of
producing a baseline of economic variables against which the impacts of various
alternative scenarios can be evaluated. The model is designed to be able to answer a
diverse set of questions about the fertilizer industry that would be of interest to both
policy makers and industry participants.
One of the main motivations for this study was the series of large spikes in ammonia
prices that occurred in 2008, and again from 2010 to 2012. This run-up in prices led to
highly abnormal profit margins for the industry when compared to historical averages.8
Profit margins of DAP fertilizers also saw high levels during the period of 2007 to 2010.
The model forecasts significant drops in price for each fertilizer type from the recent
high levels. Most of this response is due to projected increases in fertilizer capacity,
consistent with industry expectations, which ultimately results in increased production
of fertilizers globally.
Changing selected model assumptions and re-solving the model yields estimates of
market responses to changes in policies or market conditions, and is a good way to test
the behavior of the model. The results of these shocks were found to be directionally
8 Profit margins for ammonia in the U.S. were calculated by subtracting the variable costs of producing
ammonia derived from natural gas costs and subtracting this value from the port price in the U.S. DAP margins were calculated in similar fashion.

82
consistent with basic economic principles. Perhaps the most interesting of these shocks
was a 10% tax on the farm price of ammonia in the U.S. which resulted in small
reductions in nitrogen fertilizer use. Decreases in domestic use in 2013 of 2.2% were
projected by the model in response to this shock, suggesting it might take a very high
tax to obtain a large reduction in nitrogen fertilizer use. Additionally, a shock decreasing
U.S. corn area and a positive shock to North American natural gas prices were
examined.
This model attempts to expand upon the efforts of previous literature by including both
capacity and capacity utilization equations to estimate fertilizer supply. Capacity is
modeled with a significant lag structure to reflect the idea that investment takes time.
The time frame to build a fertilizer production facility is quite long, with an ammonia
plant taking the least time to construct at a minimum of 3 years. By specifying supply in
this way, the model is able to distinguish the once potentially ambiguous changes in
production as changes in the individual components. Reactions to a single period
decrease in profit margins would put downward pressure on rates of capacity utilization
but have only small effects on capacity itself.
Future Research
While the model constructed for this thesis was built to be a simple approximation of
real world markets there are certain factors that could be added in order to improve the
model’s representation of fertilizer markets while maintaining model simplicity. This

83
section looks at a few of the missing aspects of the model that could be considered
when researchers examine this problem in the future.
This model assumes most key parameters, but if time and data permitted, it would
beneficial to use econometric approaches to estimate supply and demand elasticities
and other key parameters. Elasticity estimates for U.S. fertilizer demand were borrowed
extensively from Harvey Zelaya’s 1991 thesis and need to be re-estimated based on
more current information. Additionally, the literature provides only limited information
about fertilizer supply and demand behavior for other countries. Acquiring such
estimates for other countries, or estimating them directly, would also be a valuable
improvement.
The timespan and quality of the datasets used for this thesis are likely insufficient for
proper estimation. Proprietary sources for fertilizer prices are available at a significant
cost, making these sources unavailable for this research. FAOSTAT reports that supply
and demand variables in their database are collected directly from government sources.
However, it is possible that proprietary sources of this data are available. Given the
many concerns with the data used for this analysis, finding better and more consistent
data should be a high priority for any future research.
The thesis model estimates supply and demand variables for the largest producers and
consumers of fertilizers, but does not incorporate all countries that would be interesting
to project separately. Future research could expand upon the model by breaking
additional countries out of the Rest of World (ROW) category.

84
Conclusion
The real power of a partial equilibrium model is the ability to provide a quantitative
analysis to answer various questions about the effects of changes in relevant economic
variables, while requiring only minor modifications to the model. It is extremely
important to assess the implications of policy options before they are implemented in
order to understand both the positive and negative consequences of a proposed policy.
Fertilizer industry participants would be interested in the expected effects of policy
options and the implications of changes in other market factors that would impact
fertilizer markets and could affect the profitability of their businesses. The global
fertilizer model is capable of providing a portion of this analysis. Future research should
attempt to expand upon the model in order to increase the analytical power of the
model and provide more accurate estimates of market responses.
While the model developed here provides only one piece of the analysis of the fertilizer
industry, connecting this model to a larger system of agricultural commodity models
would allow researchers to assess the impacts that policy decisions and changes in
market factors in the fertilizer industry would have on other agricultural commodity
markets. It would also make it possible to evaluate a broader set of questions, such as
how a change in farm policies or crop market conditions might affect everything from
the price of corn to the production and use of nitrogen fertilizer.

85
REFERENCES
Alberta Agriculture and Rural Development. 2012. “Statistics and Data Development Branch.” Last updated October 12. http://www1.agric.gov.ab.ca/$department/deptdocs.nsf/all/econ7059.
Babcock, B. A. 1992. "The Effects of Uncertainty on Optimal Nitrogen
Applications." Review of Agricultural Economics 14.2: 271-80. Berntsen, J., Petersen, B.M., Jacobsen, B.H., Olesen, J.E., and Hutchings, N.J. 2002.
“Evaluating Nitrogen Taxation Scenarios Using the Dynamic Whole Farm Simulation Model FASSET.” Agricultural Systems 76 (2002): 817-839.
BP. 2013. Statistical Review of World Energy. http://www.bp.com/statisticalreview. China Coal Research Institute. 2011. “Coal Conversion and CO2 Utilization.”
International Energy Agency. http://www.iea.org/media/workshops/2011/wpffbeijing/15_Shihua.pdf.
Clark, E. 2013. "Wait for Fertilizer News Dust to Settle Before Pricing." AgWeb.
http://www.agweb.com/article/wait_for_fertilizer_news_dust_to_settle_before_pricing/.
Corbeau, A.S. 2010. “Natural Gas in India.” Working Paper. International Energy
Agency, Paris, France. http://www.iea.org/publications/freepublications/publication/natural_gas_india_2010.pdf.
Dekker, C.J. 2001. “Lifetime Assessment of NH3 - Plants, A Practical Approach for
Lifetime Extension.” Paper presented at the 46th Annual Safety in Ammonia Plants and Related Facilities Symposium, Montreal, Quebec, Canada. http://www.continentalengineers.nl/Paper4.pdf.
Denbaly, M., Vroomen, H. 1993. "Dynamic Fertilizer Nutrient Demands for Corn: A
Cointegrated and Error-Correcting System." American Journal of Agricultural Economics 75: 203-09. JSTOR.
Dholakia, R. H., Majumdar J. 1995. "Economics of Nitrogen Use in Cereal Systems in
South and East Asia." Indian Journal of Agricultural Economics 50.1.

86
EIA (U.S. Energy Information Administration). 2010. “Natural Gas Prices for Industry for Selected Countries.” Last updated June 10. http://www.eia.gov/countries/prices/natgasprice_industry.cfm.
EIA (U.S. Energy Information Administration). 2011. “Performance Profiles of Major
Energy Producers 2009.” Markets & Finance. U.S. Energy Information Administration. http://www.eia.gov/finance/performanceprofiles/overview.cfm.
EIA (U.S. Energy Information Administration). 2014. “Natural Gas Prices.” Natural
Gas Data. http://www.eia.gov/dnav/ng/ng_pri_sum_dcu_nus_a.htm. EPA. 2007. Hypoxia in the Northern Gulf of Mexico: An Update by the EPA Science
Advisory Board. Washington, D.C. http://yosemite.epa.gov/sab%5Csabproduct.nsf/C3D2F27094E03F90852573B800601D93/$File/EPA-SAB-08-003complete.unsigned.pdf.
EPA. 2014. “Gulf of Mexico.” Nutrient Policy Data. http://www2.epa.gov/nutrient-
policy-data/gulf-mexico. ERS. 2013. “Fertilizer Use and Price.” United States Department of Agriculture.
http://www.ers.usda.gov/data-products/fertilizer-use-and-price.aspx#.UcBoMfllmbE.
FAI (The Fertilizer Association of India). 2014. “Current News.”
http://www.faidelhi.org/general/Jan%2014/14-01-2014.pdf. FAO (Food and Agriculture Organization of the United Nations). 2014. “FAOSTAT
database.” FAPRI (Food and Agricultural Policy Research Institute). 2011. “FAPRI-ISU 2011
World Agricultural Outlook Database.” Fedorinova, Y. 2013. "Uralkali Breaks Potash Accord to Grab Market
Share." Bloomberg. http://www.bloomberg.com/news/2013-07-30/uralkali-sees-potash-price-slump-after-exiting-bpc-trade-venture.html.
Garcia, R. J., Randall, A. 1994. "A Cost Function Analysis to Estimate the Effects of
Fertilizer Policy on the Supply of Wheat and Corn." Review of Agricultural Economics 16: 215-30. JSTOR.
Gunjal, K. R., Roberts, R. K., Heady, E. O. 1980. "Fertilizer Demand Functions for Five
Crops in The United States." Southern Journal of Agricultural Economics.

87
Heady, E. O., Yeh, M. H. 1959. "National and Regional Demand Functions for Fertilizer."Journal of Farm Economics 41.2: 332-48. JSTOR.
Henderson, J., Quandt, R. 1980. Microeconomic Theory: A Mathematical Approach.
3rd ed. New York: McGraw Hill Book Co. Houck, J., Ryan, M., Subotnik, A. 1972. Soybeans and Their Products. Archived
Edition. Minneapolis: University of Minnesota Press. Huang, W. 2007. Impact of Rising Natural Gas Prices on U.S. Ammonia Supply.
United States Department of Agriculture, Economic Research Service. ICIS. 2014. Various Weekly Chemical Price Reports. IETD. 2013. “Ammonia Key Data.” Sectors. Industrial Efficiency Technology Database.
http://ietd.iipnetwork.org/content/ammonia#key-data. IFDC (International Fertilizer Development Center). 2013. FSR: Worldwide Fertilizer
Capacity Listing by Plant Sept. 2013. Muscle Shoals, Alabama: International Fertilizer Development Center.
IMF (International Monetary Fund). 2014a. “IMF Primary Commodity Prices.”
http://www.imf.org/external/np/res/commod/index.aspx. IMF (International Monetary Fund). 2014b. “World Economic Outlook Database.”
http://www.imf.org/external/pubs/ft/weo/2013/02/weodata/index.aspx. Infraline Energy. n.d. “History of Gas Pricing in India.”
http://www.infraline.com/ong/NaturalGas/Pricing/History-GasPricing.aspx. IPNI (International Plant Nutrition Institute). n.d. Nutrient Source Specifics:
Diammonium Phosphate. Norcross, Georgia: International Plant Nutrition Institute. http://www.ipni.net/publication/nss.nsf/0/66D92CC07C016FA7852579AF00766CBD/$FILE/NSS-17%20Diammonium%20Phosphate.pdf.
Kanani, H. 2011. “Pricing of Natural Gas in India.”
http://www.greatlakes.edu.in/gurgaon/sites/default/files/Pricing_of_Natural_Gas_in_India.pdf.
Kruse, J., Westhoff, P., Meyer, S., and Thompson, W. 2007. “Economic Impacts of
Not Extending Biofuels Subsidies.” FAPRI-UMC Report #17-07.

88
Li, X. Y., J. Timsina, Dixon, J. 2011. "Economics of Nitrogen Use in Cereal Systems in South and East Asia." Journal of Agricultural Science and Technology 5.1.
Marotte, B. 2013. "Russia Pulls out of Cartel, Potash Prices Expected to Plunge.” The
Globe and Mail. http://www.theglobeandmail.com/report-on-business/industry-news/energy-and-resources/russia-pulls-out-of-cartel-potash-prices-expected-to-plunge/article13494656/.
NDRC (People’s Republic of China National Development and Reform Commission).
2014. http://en.ndrc.gov.cn/. Nexant. 2009. Final Report: U.S. Sulfur/Sulfuric Acid Market Analysis Supply/Demand
and Pricing. White Plains, New York: Nexant. http://yosemite.epa.gov/oa/eab_web_docket.nsf/Filings%20By%20Appeal%20Number/EFAE40E5FFEFBBF785257A2A0047AC45/$File/Exhibit%2052m%20to%20Revised%20Petition%20for%20Review%20...12.52m.pdf.
NFDC (National Fertilizer Development Centre). n.d. “Average International Fertilizer
Market Prices.” http://www.nfdc.gov.pk/web-page%20updating/int_prices.htm. PotashCorp. 2011. “Nutrients: Phosphate.” 2011 Online Overview.
http://www.potashcorp.com/industry_overview/2011/nutrients/22/. PotashCorp. 2013a. “Greenfield Development Timeline.” Potash – Overview.
http://www.potashcorp.com/overview/nutrients/potash/overview/greenfield-timeline.
PotashCorp. 2013b. "Nitrogen Overview."
http://www.potashcorp.com/overview/nutrients/nitrogen/overview/average-cost-of-producing-a-ton-of-ammonia-in-the-us.
PotashCorp. 2013c. Potash – Overview.
http://www.potashcorp.com/overview/nutrients/potash/overview/process-flow-diagram.
PotashCorp. 2014a. “FAQs.” http://www.potashcorp.com/faqs/. PotashCorp. 2014b. “Glossary.” http://www.potashcorp.com/glossary/. PotashCorp. 2014c. “Market Data: Selected Fertilizer Prices.” Last updated April 14.
http://www.potashcorp.com/customers/markets/market_data/prices/. PotashCorp. 2014d. “Markets & Industries.”
http://www.potashcorp.com/investors/markets_industries/industrial/.

89
Roberts, R. K., Heady, E. O. 1982. "Fertilizer Demand Functions for Specific Nutrients Applied to Three Major U.S. Crops." Western Journal of Agricultural Economics.
Rosas, F. 2012. “Fertilizer Use by Crop at the Country Level (1990-2010).” Working
Paper 12-WP 535, Iowa State University, Center for Agricultural and Rural Development, Ames, Iowa. http://www.card.iastate.edu/publications/synopsis.aspx?id=1178.
Roth, G.W. 1996. “Crop Rotations and Conservation Tillage.” Penn State College of
Agricultural Sciences Cooperative Extension. http://pubs.cas.psu.edu/freepubs/pdfs/uc124.pdf.
Sulfur Information Services. 2012. “Sulfur Price.”
http://sulfur.nigc.ir/en/sulfurtrade/sulfurmarket/sulfurprice. The Times of India. 2013. “Govt. approves near doubling of natural gas price to
$8.4.” June 27. http://timesofindia.indiatimes.com/business/india-business/Govt-approves-near-doubling-of-natural-gas-price-to-8-4/articleshow/20801122.cms.
The World Bank. 2014. “Global Economic Monitor (GEM) Commodities.” World
DataBank. http://databank.worldbank.org/data/views/variableselection/selectvariables.aspx?source=global-economic-monitor-(gem)-commodities#.
USGS (U.S. Geological Survey). 2014a. “Nitrogen (Fixed) Ammonia Mineral
Commodity Summaries.” Last updated March 10. http://minerals.usgs.gov/minerals/pubs/commodity/nitrogen/.
USGS (U.S. Geological Survey). 2014b. “Phosphate Rock Mineral Commodity
Summaries.” Last updated April 15. http://minerals.usgs.gov/minerals/pubs/commodity/phosphate_rock/index.html#mcs.
USGS (U.S. Geological Survey). 2014c. “Potash Mineral Commodity Summaries.” Last
updated March 10. http://minerals.usgs.gov/minerals/pubs/commodity/nitrogen/.
WAAES (World Agricultural Economic and Environmental Services). 2012a. “WAEES
Cost of Production Data.” Unpublished. WAEES (World Agricultural Economic and Environmental Services). 2012b. “WAEES
Fall 2012 Baseline.” Unpublished.

90
WAAES (World Agricultural Economic and Environmental Services). 2013. “WAEES Macroeconomic Model.” Unpublished.
Williamson, J. 2011. "The Role of Information and Prices in the Nitrogen Fertilizer
Management Decision: New Evidence from the Agricultural Resource Management Survey." Journal of Agricultural and Resource Economics 36: 552-72.
Yara. 2012. “Yara Financial Performance Report.”
Zelaya, H. 1991. U.S. Fertilizers: An Econometric Analysis of Supply and Demand. The
University of Missouri.

91
APPENDIX A
Supply and Utilization Tables
For each table, 2005 is a historical year while 2012 forward are model projections.
Citations for individual components can be found in the data section of this thesis.

92
Canada Nitrogen Fertilizer Supply and DemandUnits 2005 2012 2015 2030
1000 Nutrient Tonnes
Supply
Capacity 4387 4480 4465 4422
Capacity Utilization (Implied) 70.9% 77.4% 72.5% 71.3%
Production 3109 3468 3237 3151
Imports 373 554 578 627
Total Supply 3483 4022 3815 3778
Demand
Total Nitrogen Fertilizer Use 1777 2451 2523 2638
Corn Nitrogen Fertilizer Use 137 234 220 220
Wheat Nitrogen Fertilizer Use 599 624 637 621
Soybean Nitrogen Fertilizer Use 8 18 18 24
Rapeseed Nitrogen Fertilizer Use 296 678 710 735
Other Crops Nitrogen Fertilizer Use 736 897 938 1038
Non Fertilizer Use 0 0 0 0
Domestic Consumption 1777 2451 2523 2638
Exports 1706 1571 1292 1140
Total Demand 3483 4022 3815 3778
Residual 0 0 0 0
$US per Metric Tonne
Fertilizer Prices
Anhydrous Ammonia Farm Price 715 1105 830 772

93
China Nitrogen Fertilizer Supply and DemandUnits 2005 2012 2015 2030
1000 Nutrient Tonnes
Supply
Capacity 29152 48886 65391 77293
Capacity Utilization (Implied) 96.1% 92.8% 91.7% 90.5%
Production 28015 45356 59945 69976
Imports 1015 334 351 441
Total Supply 29030 45690 60296 70418
Demand
Total Nitrogen Fertilizer Use 28044 41471 55862 65607
Corn Nitrogen Fertilizer Use 4102 4952 5154 5030
Wheat Nitrogen Fertilizer Use 4131 4221 4455 4474
Soybean Nitrogen Fertilizer Use 491 367 402 361
Rapeseed Nitrogen Fertilizer Use 1050 1062 1104 1015
Cotton Nitrogen Fertilizer Use 1036 968 1145 1021
Rice Nitrogen Fertilizer Use 5590 5657 5887 5976
Other Crops Nitrogen Fertilizer Use 11644 24244 37715 47730
Non Fertilizer Use 0 0 0 0
Domestic Consumption 28044 41471 55862 65607
Exports 1037 4235 4451 4827
Total Demand 29081 45706 60313 70434
Residual -51 -16 -16 -16
$US per Metric Tonne
Fertilizer Prices
Urea Port Price 510 818 624 581

94
India Nitrogen Fertilizer Supply and DemandUnits 2005 2012 2015 2030
1000 Nutrient Tonnes
Supply
Capacity 11330 16030 18843 20019
Capacity Utilization (Implied) 99.0% 99.4% 97.2% 95.5%
Production 11218 15929 18324 19109
Imports 1390 3007 1388 2602
Total Supply 12608 18936 19712 21712
Demand
Total Nitrogen Fertilizer Use 12724 17173 17941 19913
Corn Nitrogen Fertilizer Use 311 344 336 325
Wheat Nitrogen Fertilizer Use 2906 3663 3931 4005
Soybean Nitrogen Fertilizer Use 141 192 206 249
Rapeseed Nitrogen Fertilizer Use 473 586 624 581
Cotton Nitrogen Fertilizer Use 834 844 959 1247
Rice Nitrogen Fertilizer Use 4146 4483 4925 5144
Other Crops Nitrogen Fertilizer Use 3913 7061 6959 8361
Non Fertilizer Use 0 0 0 0
Domestic Consumption 12724 17173 17941 19913
Exports 10 28 36 64
Total Demand 12734 17201 17977 19977
Residual -126 1735 1735 1735

95
Russia Nitrogen Fertilizer Supply and DemandUnits 2005 2012 2015 2030
1000 Nutrient Tonnes
Supply
Capacity 11056 11996 12647 15363
Capacity Utilization (Implied) 60.8% 65.3% 64.5% 60.9%
Production 6725 7828 8152 9362
Imports 42 16 16 16
Total Supply 6767 7844 8168 9378
Demand
Total Nitrogen Fertilizer Use 863 1268 1352 1535
Corn Nitrogen Fertilizer Use 52 174 175 168
Wheat Nitrogen Fertilizer Use 458 453 503 532
Other Crops Nitrogen Fertilizer Use 354 641 674 836
Non Fertilizer Use 0 0 0 0
Domestic Consumption 863 1268 1352 1535
Exports 4892 5612 5852 6879
Total Demand 5755 6880 7204 8414
Residual 1011 964 964 964
$US per Metric Tonne
Fertilizer Prices
Anhydrous Ammonia Port Price 240 407 429 403

96
Rest of World Nitrogen Fertilizer Supply and DemandUnits 2005 2012 2015 2030
1000 Nutrient Tonnes
Supply
Capacity 56377 66820 69407 82704
Capacity Utilization (Implied) 64.7% 53.8% 52.1% 51.0%
Production 36482 35977 36167 42164
Imports 18800 23450 25871 27901
Total Supply 55282 59427 62038 70065
Demand
Total Nitrogen Fertilizer Use 34162 38932 42057 48400
Corn Nitrogen Fertilizer Use 5414 6141 6280 6239
Soybean Nitrogen Fertilizer Use 164 228 232 263
Rapeseed Nitrogen Fertilizer Use 75 166 188 218
Cotton Nitrogen Fertilizer Use 379 501 388 364
Other Crops Nitrogen Fertilizer Use 28129 31896 34969 41316
Non Fertilizer Use 1214 672 761 860
Domestic Consumption 35376 39604 42818 49260
Exports 16025 17695 17092 18677
Demand 51401 57299 59910 67937
Residual 3881 2128 2128 2128

97
Canada Phosphorus Fertilizer Supply and DemandUnits 2005 2012 2015 2030
1000 Nutrient Tonnes
Supply
Capacity 345 345 343 336
Capacity Utilization (Implied) 80.6% 71.7% 68.5% 68.0%
Production 278 247 235 228
Imports 478 549 582 626
Total Supply 756 796 817 855
Demand
Total Phosphorus Fertilizer Use 693 757 779 815
Corn Phosphorus Fertilizer Use 37 62 58 58
Wheat Phosphorus Fertilizer Use 172 184 186 180
Soybean Phosphorus Fertilizer Use 28 49 51 66
Rapeseed Phosphorus Fertilizer Use 66 148 152 158
Other Crops Phosphorus Fertilizer Use 389 315 331 353
Non Fertilizer Use 0 0 0 0
Domestic Consumption 693 757 779 815
Exports 63 38 39 40
Total Demand 756 796 817 855
Residual 0 0 0 0
$US per Metric Tonne
Fertilizer Prices
MAP Port Price 436 768 571 568

98
China Phosphorus Fertilizer Supply and DemandUnits 2005 2012 2015 2030
1000 Nutrient Tonnes
Supply
Capacity 12360 17845 19291 21747
Capacity Utilization (Implied) 99.0% 93.2% 87.9% 81.4%
Production 12238 16636 16957 17698
Imports 1255 310 297 230
Total Supply 13493 16946 17253 17928
Demand
Total Phosphorus Fertilizer Use 13140 12036 12431 12768
Corn Phosphorus Fertilizer Use 649 845 876 857
Wheat Phosphorus Fertilizer Use 1846 1965 2058 2040
Soybean Phosphorus Fertilizer Use 417 302 338 312
Rapeseed Phosphorus Fertilizer Use 351 351 359 332
Cotton Phosphorus Fertilizer Use 379 359 410 351
Rice Phosphorus Fertilizer Use 1855 2018 2052 2061
Other Crops Phosphorus Fertilizer Use 7643 6195 6338 6815
Non Fertilizer Use 0 0 0 0
Domestic Consumption 13140 12036 12431 12768
Exports 435 4935 4848 5186
Total Demand 13574 16971 17279 17953
Residual -82 -25 -25 -25
$US per Metric Tonne
Fertilizer Prices
DAP Port Price 522 911 714 711

99
India Phosphorus Fertilizer Supply and DemandUnits 2005 2012 2015 2030
1000 Nutrient Tonnes
Supply
Capacity 4133 4986 6041 6362
Capacity Utilization (Implied) 99.0% 98.2% 94.6% 89.2%
Production 4093 4895 5716 5677
Imports 1145 2797 2523 2986
Total Supply 5237 7692 8239 8662
Demand
Total Phosphorus Fertilizer Use 5210 7523 8068 8485
Corn Phosphorus Fertilizer Use 76 103 101 97
Wheat Phosphorus Fertilizer Use 1098 1757 1837 1804
Soybean Phosphorus Fertilizer Use 143 246 254 301
Rapeseed Phosphorus Fertilizer Use 164 223 243 236
Cotton Phosphorus Fertilizer Use 414 534 585 739
Rice Phosphorus Fertilizer Use 1271 1516 1775 1817
Other Crops Phosphorus Fertilizer Use 2045 3144 3273 3491
Non Fertilizer Use 0 0 0 0
Domestic Consumption 5210 7523 8068 8485
Exports 11 17 19 25
Total Demand 5221 7540 8087 8510
Residual 16 152 152 152

100
Russia Phosphorus Fertilizer Supply and DemandUnits 2005 2012 2015 2030
1000 Nutrient Tonnes
Supply
Capacity 2802 3168 3178 3121
Capacity Utilization (Implied) 98.7% 87.0% 83.7% 80.7%
Production 2766 2757 2659 2520
Imports 2 19 21 30
Total Supply 2768 2776 2680 2550
Demand
Total Phosphorus Fertilizer Use 347 433 471 506
Corn Phosphorus Fertilizer Use 17 48 49 46
Wheat Phosphorus Fertilizer Use 183 222 252 274
Other Crops Phosphorus Fertilizer Use 147 163 170 186
Non Fertilizer Use 0 0 0 0
Domestic Consumption 347 433 471 506
Exports 2242 2857 2723 2558
Total Demand 2589 3290 3194 3064
Residual 179 -514 -514 -514

101
Rest of World Phosphorus Fertilizer Supply and DemandUnits 2005 2012 2015 2030
1000 Nutrient Tonnes
Supply
Capacity 15044 16272 18994 22067
Capacity Utilization (Implied) 66.3% 65.4% 62.6% 61.0%
Production 9979 10642 11899 13467
Imports 10010 11798 11744 13190
Total Supply 19989 22440 23643 26657
Demand
Total Phosphorus Fertilizer Use 16016 17684 18518 19885
Corn Phosphorus Fertilizer Use 1857 1946 2025 2028
Soybean Phosphorus Fertilizer Use 1226 1621 1773 2103
Rapeseed Phosphorus Fertilizer Use 23 40 45 54
Cotton Phosphorus Fertilizer Use 127 168 126 115
Other Crops Phosphorus Fertilizer Use 12783 13909 14549 15585
Non Fertilizer Use 0 0 0 0
Domestic Consumption 16016 17684 18518 19885
Exports 3340 3667 4035 5682
Total Demand 19357 21350 22553 25567
Residual 632 1090 1090 1090

102
Canada Potassium Fertilizer Supply and DemandUnits 2005 2012 2015 2030
1000 Nutrient Tonnes
Supply
Capacity 13340 14547 16540 24045
Capacity Utilization (Implied) 60.5% 69.7% 68.6% 66.9%
Production 8073 10139 11345 16086
Imports 16 22 22 21
Total Supply 8089 10161 11366 16107
Demand
Total Potassium Fertilizer Use 329 368 380 446
Corn Potassium Fertilizer Use 48 79 75 82
Wheat Potassium Fertilizer Use 32 32 31 32
Soybean Potassium Fertilizer Use 19 36 38 52
Rapeseed Potassium Fertilizer Use 42 97 102 114
Other Crops Potassium Fertilizer Use 187 124 133 166
Non Fertilizer Use 0 0 0 0
Domestic consumption 329 368 380 446
Exports 7760 9704 10898 15572
Total Demand 8089 10072 11277 16018
Residual 0 89 89 89
$US per Metric Tonne
Fertilizer Prices
Potassium Chloride Port Price 158 459 369 185

103
China Potassium Fertilizer Supply and DemandUnits 2005 2012 2015 2030
1000 Nutrient Tonnes
Supply
Capacity 1464 4337 4961 6068
Capacity Utilization (Implied) 84.4% 92.8% 90.2% 84.2%
Production 1236 4025 4476 5111
Imports 5893 3487 3722 5033
Total Supply 7129 7512 8197 10144
Demand
Total Potassium Fertilizer Use 7161 7283 7973 9946
Corn Potassium Fertilizer Use 113 95 104 117
Wheat Potassium Fertilizer Use 242 214 219 217
Soybean Potassium Fertilizer Use 66 37 42 40
Rapeseed Potassium Fertilizer Use 90 65 69 69
Cotton Potassium Fertilizer Use 63 43 49 42
Rice Potassium Fertilizer Use 1741 1598 1598 1616
Other Crops Potassium Fertilizer Use 4846 5231 5892 7844
Non Fertilizer Use 0 0 0 0
Domestic Consumption 7161 7283 7973 9946
Exports 45 204 199 173
Total Demand 7206 7487 8172 10119
Residual -77 25 25 25
$US per Metric Tonne
Fertilizer Prices
Potassium Chloride Port Price 466 1017 834 509

104
India Potassium Fertilizer Supply and DemandUnits 2005 2012 2015 2030
1000 Nutrient Tonnes
Supply
Capacity 0 0 0 0
Capacity Utilization (Implied) 0.0% 0.0% 0.0% 0.0%
Production 0 0 0 0
Imports 2764 2844 3225 3939
Total Supply 2764 2844 3225 3939
Demand
Total Potassium Fertilizer Use 2414 2512 2892 3598
Corn Potassium Fertilizer Use 24 28 30 33
Wheat Potassium Fertilizer Use 194 329 338 335
Soybean Potassium Fertilizer Use 27 42 44 54
Rapeseed Potassium Fertilizer Use 27 31 35 37
Cotton Potassium Fertilizer Use 137 151 168 219
Rice Potassium Fertilizer Use 769 936 1072 1091
Other Crops Potassium Fertilizer Use 1235 996 1207 1831
Non Fertilizer Use 0 0 0 0
Domestic Consumption 2414 2512 2892 3598
Exports 0 29 30 39
Demand 2414 2542 2923 3637
Residual 350 302 302 302

105
Russia Potassium Fertilizer Supply and DemandUnits 2005 2012 2015 2030
1000 Nutrient Tonnes
Supply
Capacity 7202 7865 8770 10846
Capacity Utilization (Implied) 99.0% 96.3% 94.1% 87.7%
Production 7131 7572 8249 9514
Imports 21 9 10 15
Total Supply 7152 7581 8259 9529
Demand
Total Potassium Fertilizer Use 226 279 296 317
Corn Potassium Fertilizer Use 11 33 36 38
Wheat Potassium Fertilizer Use 75 76 86 92
Other Crops Potassium Fertilizer Use 140 169 174 187
Non Fertilizer Use 0 0 0 0
Domestic Consumption 226 279 296 317
Exports 5719 5717 6378 7627
Total Demand 5945 5995 6674 7944
Residual 1207 1585 1585 1585

106
Rest of World Potassium Fertilizer Supply and DemandUnits 2005 2012 2015 2030
1000 Nutrient Tonnes
Supply
Capacity 18403 20581 21436 24266
Capacity Utilization (Implied) 75.4% 64.4% 64.1% 63.4%
Production 13884 13264 13735 15377
Imports 13358 15980 16972 19654
Total Supply 27242 29244 30707 35031
Demand
Total Potassium Fertilizer Use 12686 15487 16918 21320
Corn Potassium Fertilizer Use 1444 1448 1508 1566
Soybean Potassium Fertilizer Use 1114 1285 1296 1498
Rapeseed Potassium Fertilizer Use 26 43 48 58
Cotton Potassium Fertilizer Use 53 70 53 51
Other Crops Potassium Fertilizer Use 10050 12641 14012 18148
Non Fertilizer Use 683 297 357 516
Domestic Consumption 13369 15784 17275 21836
Exports 12489 12402 12374 12137
Demand 25858 28186 29649 33973
Residual 1384 1058 1058 1058

107
APPENDIX B
Model Elasticities

108
Own-Prices Elasticities Used in the ModelCountry Category N P K
United States Corn -0.13 -0.10 -0.08
Soybeans -0.11 -0.14 -0.12
Rapeseed -0.13 -0.14 -0.27
Cotton -0.10 -0.12 -0.15
Wheat -0.20 -0.14 -0.14
Other Crops -0.30 -0.15 -0.20
Non-Fertilizer Use -0.40 -0.20 -0.20
Canada Corn -0.12 -0.12 -0.25
Soybeans -0.10 -0.18 -0.20
Rapeseed -0.15 -0.10 -0.20
Wheat -0.20 -0.15 -0.15
Other Crops -0.10 -0.15 -0.20
China Corn -0.11 -0.12 -0.25
Soybeans -0.10 -0.18 -0.20Rapeseed -0.15 -0.10 -0.20
Cotton -0.11 -0.05 -0.05
Wheat -0.17 -0.15 -0.15
Rice -0.16 -0.15 -0.15
Other Crops -0.40 -0.03 -0.30
India Corn -0.12 -0.12 -0.25
Soybeans -0.25 -0.18 -0.20
Rapeseed -0.05 -0.10 -0.20
Cotton -0.15 -0.05 -0.10
Wheat -0.20 -0.15 -0.15
Rice -0.20 -0.15 -0.15
Other Crops -0.10 -0.10 -0.20
Russia Corn -0.12 -0.12 -0.25
Wheat -0.12 -0.15 -0.15
Other Crops -0.20 -0.10 -0.05
ROW Corn -0.12 -0.20 -0.08
Soybeans -0.10 -0.35 -0.05
Rapeseed -0.15 -0.20 -0.10
Cotton -0.15 -0.05 -0.10
Other Crops -0.20 -0.20 -0.30
Non-Fertilizer Use -0.30 -0.35

109
Output Price Elasticities Used in the ModelCountry Category N P K
United States Corn 0.17 0.06 0.08
Soybeans 0.05 0.08 0.05
Rapeseed 0.15 0.10 0.27
Cotton 0.15 0.10 0.14
Wheat 0.15 0.05 0.08
Canada Corn 0.17 0.17 0.10
Soybeans 0.10 0.08 0.10
Rapeseed 0.15 0.10 0.10
Wheat 0.06 0.06 0.15
China Corn 0.17 0.17 0.10
Soybeans 0.10 0.08 0.10
Rapeseed 0.15 0.10 0.10
Cotton 0.16 0.23 0.23
Wheat 0.06 0.06 0.15Rice 0.06 0.06 0.15
India Corn 0.17 0.17 0.10
Soybeans 0.10 0.08 0.10
Rapeseed 0.14 0.10 0.10
Cotton 0.23 0.23 0.23
Wheat 0.06 0.10 0.15
Rice 0.06 0.06 0.15
Russia Corn 0.17 0.17 0.10
Wheat 0.13 0.06 0.15
ROW Corn 0.17 0.17 0.08
Soybeans 0.10 0.08 0.05
Rapeseed 0.15 0.10 0.10
Cotton 0.23 0.23 0.23

110
Nitrogen Net Return Supply Equation Elasticities Used in the ModelCountry Category ENR t ENR t-1 ENR t-2 ENR t-3 ENR t-4 ENR t-5 ENR t-6
United States Capacity 0.002 0.0015 0.003 0.015 0.003 0.0025 0.002
Capacity Utilization 0.42
Canada Capacity 0.002 0.0015 0.001 0.01 0.009 0.007 0.0055
Capacity Utilization 0.7
China Capacity 0.002 0.0015 0.003 0.015 0.004 0.0035 0.0025
Capacity Utilization 0.1
India Capacity 0.0015 0.001 0.002 0.025 0.01 0.0035 0.0025
Capacity Utilization 0.5
Russia Capacity 0.002 0.0015 0.001 0.001 0.0035 0.007 0.0055
Capacity Utilization 0.5
ROW Capacity 0.001 0.001 0.001 0.004 0.002 0.002 0.001Capacity Utilization 0.5
Potassium Supply Elasticities Used in the ModelCountry Category KCl Price KCl Price t-1 Average ENR t-6 to t-8 PPI Electricity t-7 PPI Wages t-7
United States Capacity 0.0012 0.001 0.005 -0.01 -0.01
Capacity Utilization 0.5 -0.1* -0.05*
Canada Capacity 0.0025 0.0015 0.03 -0.1
Capacity Utilization 0.5 -0.15*
China Capacity 0.006 0.005 0.01 -0.05 -0.05
Capacity Utilization 0.5 -0.1* -0.1*
Russia Capacity 0.0025 0.0015 0.01
Capacity Utilization 0.5
ROW Capacity 0.002 0.001 0.005
Capacity Utilization 0.1
* Denotes elasticities for year t in PPI columns

111
Phosphorus Net Return Supply Elasticities Used in the ModelCountry Category ENR t ENR t-1 ENR t-2 ENR t-3 ENR t-4
United States Capacity 0.001 0.001 0.0015 0.003 0.003
Capacity Utilization 0.1
Canada Capacity 0.005 0.001 0.001 0.002 0.0015
Capacity Utilization 0.6
China Capacity 0.003 0.002 0.003 0.006 0.006
Capacity Utilization 0.5
India Capacity 0.01 0.03 0.02 0.07 0.06
Capacity Utilization 0.5
Russia Capacity 0.001 0.0015 0.002 0.01 0.01
Capacity Utilization 0.2
ROW Capacity 0.001 0.001 0.001 0.004 0.03Capacity Utilization 0.5
Long-run capacity elasticitesCountry N P K
United States 0.41 0.14 -0.26
Canada 0.05 -2.20
China 0.13 0.25 -0.53
India 0.27 2.11
Russia 0.43 0.04 0.20
ROW 0.15 0.37 0.27


