A modified method for measurement of radiotracer permeation across the rat blood-brain barrier: the...
11
Journal of Neuroscience Methods, 9 (1983) 45-55 45 Elsevier A modified method for measurement of radiotracer permeation across the rat blood-brain barrier: the problem of correcting brain uptake for intravascular tracer * Edward Preston, Murray Allen and Nicholas Haas Division of Biological Sciences, National Research Council of Canada, Ottawa KIA OR6 (Canada) (Received December 24th, 1982) (Revised June 6th, 1983) (Accepted June 13th, 1983) Key words: blood-brain barrier -- permeability-area product -- cerebral vasculature -- regional blood volume -- sucrose -- mannitol A modified technique to assess integrity of the rat blood-brain barrier is described in which a poorly permeating radiotracer is injected intravenously and its net permeation across the cerebral vasculature in 30 min is related to its time-averaged level in the circulation. At the termination of experiments, direct carotid arterial perfusion clears blood from brain in 30 s and permits measurememt of the tracer level in brain parenchyma without correction for intravascular tracer. Constant-rate withdrawal of a single arterial blood sample throughout the period of tracer circulation replaces the need for repeated blood sampling and graph plotting to determine the time-integrated plasma tracer level. During the first 2-3 rain following intravenous injection of [3H]mannitol or [14C]sucrose, permeation across the barrier occurred at a rate substantially greater than that measured for a 30 rain circulation time. The relatively rapid uptake of these tracers into brain during the first few minutes after injection would explain in part why estimates of regional blood volume, calculated from ratios of brain vs blood tracer concentration after short circulation times, were much higher than values determined using [51Cr]erythrocytes. Introduction To quantitatively assess integrity of the blood-brain barrier, it is a common approach to inject a slowly permeating tracer substance into the bloodstream, and to relate the amount of tracer which passes the barrier and accumulates in brain to the amount present in the circulation. This principle is utilized with refinement in a radiotracer method described by Rapoport et al. (1978). Radiolabeled sucrose is injected intravenously and the permeability-area product (PA) for its permeation * Issued as National Research Council of Canada Paper No. 22439. 0165-0270/83/$03.00 © 1983 Elsevier Science Publishers B.V.
-
Upload
edward-preston -
Category
Documents
-
view
213 -
download
0
Transcript of A modified method for measurement of radiotracer permeation across the rat blood-brain barrier: the...

Journal of Neuroscience Methods, 9 (1983) 45-55 45 Elsevier
A modified method for measurement of radiotracer permeation across the rat blood-brain barrier: the
problem of correcting brain uptake for intravascular tracer *
Edward Preston, Murray Allen and Nicholas Haas Division of Biological Sciences, National Research Council of Canada, Ottawa KIA OR6 (Canada)
(Received December 24th, 1982) (Revised June 6th, 1983)
(Accepted June 13th, 1983)
Key words: blood-brain barrier - - permeability-area product - - cerebral vasculature - - regional blood volume - - sucrose - - mannitol
A modified technique to assess integrity of the rat blood-brain barrier is described in which a poorly permeating radiotracer is injected intravenously and its net permeation across the cerebral vasculature in 30 min is related to its time-averaged level in the circulation. At the termination of experiments, direct carotid arterial perfusion clears blood from brain in 30 s and permits measurememt of the tracer level in brain parenchyma without correction for intravascular tracer. Constant-rate withdrawal of a single arterial blood sample throughout the period of tracer circulation replaces the need for repeated blood sampling and graph plotting to determine the time-integrated plasma tracer level. During the first 2-3 rain following intravenous injection of [3H]mannitol or [14C]sucrose, permeation across the barrier occurred at a rate substantially greater than that measured for a 30 rain circulation time. The relatively rapid uptake of these tracers into brain during the first few minutes after injection would explain in part why estimates of regional blood volume, calculated from ratios of brain vs blood tracer concentration after short circulation times, were much higher than values determined using [51Cr]erythrocytes.
Introduction
T o q u a n t i t a t i v e l y assess i n t e g r i t y o f t he b l o o d - b r a i n b a r r i e r , i t is a c o m m o n
a p p r o a c h to i n j e c t a s lowly p e r m e a t i n g t r a c e r s u b s t a n c e i n t o t he b l o o d s t r e a m , a n d to
r e l a t e the a m o u n t o f t r a c e r w h i c h p a s s e s t he b a r r i e r a n d a c c u m u l a t e s in b r a i n to t he
a m o u n t p r e s e n t in t he c i r c u l a t i o n . T h i s p r i n c i p l e is u t i l i z ed w i t h r e f i n e m e n t in a
r a d i o t r a c e r m e t h o d d e s c r i b e d b y R a p o p o r t e t al. (1978) . R a d i o l a b e l e d s u c r o s e is
i n j e c t e d i n t r a v e n o u s l y a n d t he p e r m e a b i l i t y - a r e a p r o d u c t ( P A ) fo r i t s p e r m e a t i o n
* Issued as National Research Council of Canada Paper No. 22439.
0165-0270/83/$03.00 © 1983 Elsevier Science Publishers B.V.

46
across the cerebral vasculature during 30 min is calculated as the ratio of tracer concentration accumulated in brain parenchyma relative to the time integral of its level in arterial plasma. Because brain radioactivity counts must be corrected for presence of intravascular tracer, errors on quantitating the latter are magnified in the calculated PA product when the blood tracer level is high relative to that in brain parenchyma. Furthermore, we have noted a variability in the estimates of regional blood volume used to make such corrections which appears related to choice of method. In this paper we describe modifications to the PA measurement technique which permit parenchymal tracer uptake to be quantitated without correction for intravascular contaminant, and which simplify the estimation of time-integrated plasma level. These techniques were used to determine possible reasons for observed discrepancies in regional blood volume estimates.
M e t h o d s
Modified method for determining permeability-area product Male Sprague-Dawley rats weighing 375-425 g were anesthetized with in-
traperitoneal sodium pentobarbital, 50 mg/kg, and polyethylene cannulas were inserted into a femoral vein for injections and a femoral artery for blood sampling. Both common carotid arteries were also exposed for later ligation or cannulation. Following surgery, sodium heparin solution (280 units) was injected intravenously. Rectal temperature was monitored and maintained at 37-38°C by controlled output from an infrared lamp.
PA measurements were carried out to assess barrier permeation of [14C]sucrose (New England Nuclear, NECI00, 3.6 mCi/mmol) and [3H]mannitol (NET101, 17.1 Ci/mmol) . Rats received a single intravenous injection of 2 or 4/~Ci [14 C]sucrose or 12 /~Ci [3H]mannitol per 100 g body weight, and a 30-rnin circulation time was allowed before decapitation. The time-integral of plasma tracer concentration during 30 min was determined in a manner employed by Gjedde et al. (1975). A Harvard syringe pump was switched on immediately following the radiotracer injection and blood from a femoral artery was drawn via a PE20 polyethylene tube into a 2-ml syringe at a constant rate for 30 min. The amount of blood withdrawn ( - 1.3 ml) was determined by weight, and the sample was then centrifuged and processed for liquid scintillation counting to determine tracer concentration in plasma (dpm/ml) . This figure was corrected for dilution by the known weight of non-radioactive blood which h a d b e e n used to prime the syringe/tubing dead space before sampling, and multiplied by 1800 s to o b t a i n the time-integrated plasma level (fo3°Cplasmadt, e x p r e s s e d in units of dpm s ml - 1 ) . ,
* This method replaces the task of drawing repeated arterial samples throughout the experiment, graphing, and estimating area under a curve of plasma level vs time (Rapoport et al., 1978; Ohno et al., 1978). In 4 rats given an intravenous injection of [14C]sucrose, integrals established by simultaneous use of both techniques did not differ by more than 6% within the same animal, the mean group difference being < 1%.

47
The quantity of radiotracer that had entered brain parenchyma at the end of 30 30 min, Cp . . . . (dpm/g), was determined as follows. Five min before termination of the
experiment, a cannula was inserted in a distal direction into the left common carotid artery. At the end of the experiment, the brain vasculature was perfused for 30 s to remove vascular tracer as described in Fig. 1, and the rat was immediately decapi- tated. The brain was removed, bisected down the sagittal midline, and each half dissected into 3 regions: medulla plus pons, cerebellum, and cerebrum (a whole hemisphere homogenized by spatula, a portion of which was taken). Surface mem- branes and blood vessels, and choroid plexus were stripped away during dissection, and following weighing of each sample, it was solubilized overnight in Soluene 100 and 10 ml Dimilume 30 then added (Packard Instr. Co.) for liquid scintillation counting.
Permeation of radiotracer across the barrier in 30 min was indicated by magni- tude of the product of cerebrovascular permeability (P, in units of cm/s) times area (A, cm2/g), obtained as the ratio of parenchymal uptake to time-integrated plasma concentration from the relationship:
C30 paren 30 PA .f~ Cp lasmadt (1)
" u
In 30 min experiments in which perfusion was not carried out to clear vascular tracer from brain, PA was calculated from the following relationship:
30 RBV) C30brain -- (Cblood)< PA fo3OCplasmad t (2)
In such cases parenchymal uptake was determined by correcting brain counts 30 (Cbrai n, dpm/g) for presence of intravascular tracer, estimated as the product of
regional blood volume space in brain (RBV, ml/g) and arterial blood concentration at the time of decapitation (C3°ooa, dpm/ml).
Measurement of regional blood volume (RB V) in dissected brain To obtain 5~Cr-labeled erythrocytes to use in RBV estimation, 10 ml of freshly
drawn rat blood was incubated for 1.5 h at room temperature with 250/tCi of 5~Cr in the form of sodium chromate (New England Nuclear, NEZ030) dissolved in 2 ml of 0.9% NaC1 solution. The blood was centrifuged, the plasma and buffy coat removed and discarded, and the red cells resuspended to 10 ml volume with isotonic saline. By centrifugation and resuspension in fresh saline each time, the labeled cells were washed a total of 5 times before final resuspension to a volume of 7 ml. Approximately 3 ml of this red-ceU suspension was injected intravenously into an anesthetized rat, and allowed to circulate for 10 min whereupon a final arterial blood sample was taken and the rat decapitated. Samples of dissected brain and blood were digested in NCS solubilizer (Amersham/Searle) and counted to a 1% error under constant geometry in a Beckman 310 gamma spectrometer. Blood volume space was calculated from the ratio of cpm/g brain: cpm/ml blood.

48
RBV was also ob ta ined using [J4C]sucrose or [3HJmanni tol as a vascular marke r by a me thod adap ted from R a p o p o r t et al. (1978). Anes the t ized rats received an in t ravenous inject ion of [14C]sucrose which was permi t ted to circulate for ei ther 3 or
30 min whereupon the ra t was decap i ta ted wi thout conduc t of vascular perfusion. The rat io of rad io t racer concent ra t ion in bra in ( d p m / g ) vs that in b lood ( d p m / m l ) sampled at the t ime of decapi ta t ion , C 3 / C 3 brain/ blood, was used as a first es t imate of RBV in Eqn. 2 to calculate regional PA from mean values for "~brain,(~30 '~bloodt~30 and f3°Cpl . . . . dt f rom 30-min exper iments . These regional PA values were used to improve first RBV est imates by correct ing for the fact that a cer tain amoun t of t racer would enter p a r e n c h y m a in 3 min (C3aren), ca lcula ted f rom the p roduc t
P A x f03C_l . . . . dt. Each correc ted RBV value, ob ta ined from: (C~rai n -- Cr~ . . . . )/Cb~lood, pe rmi t t ed an improved es t imate of PA and so forth through rei terat ive calcula t ions until succeeding RBV est imates differed by less than 2%. Simi lar exper iments were carr ied out with [3H]manni tol in which the tracer was pe rmi t t ed to c i rculate for 2 or 30 min.
R e s u l t s
Regional blood volume space estimates and test of the vascular clearance technique Table I shows values for regional b lood volume de te rmined in 3 groups of
exper iments . RBV values es tabl ished f rom mann i to l exper iments are s ignif icant ly higher ( P < 0.05, two- ta i led t-test) than cor respond ing values based on sucrose exper iments . In contrast , the RBV values es tabl ished f rom exper iments with [51Cr]- e ry throcytes are much lower ( P < 0.05) than the values based on use of ei ther
sucrose or mann i to l as vascular markers. To test the vascular c learance technique (Fig. 1) 10 min exper iments with
TABLE I
REGIONAL BLOOD VOLUME SPACE (RBV) IN BRAIN
RBV was calculated as the ratio of radiotracer concentration in brain (dpm/g) vs blood (dpm/ml) 3 rain after a single intravenous (i.v.) injection of [14C]sucrose (n ~ 4), 2 min after i.v. mannitol (n = 4), or 10 min after an i.v. injection of 51Cr-labeled erythrocytes (n = 6). Ratios were corrected, by subtraction, for parenchymal uptake of sucrose or mannitol during the 2 or 3 min period, estimated from the product of time-integrated plasma level and PA determined from separate 30-rnin experiments.
Tracer RBV (ml/g- J ) x 100 ~ + S.E.
Cerebrum Cerebellum Pons/Medulla
[ t 4 C]sucrose * - 2.16 5: 0. ! 2 (L) 2.12 5:0.24 [ 3 H]mannitol 2.29 5:0.12 (L) 3.15 5:0.16 (L) 3.30 5:0.29 [ 51Cr]erythrocytes 0.50 5:0.02 (L) ** 0.78 5:0,04 0.50 5:0.02
• For this group only, RBV for dorsal cortex was estimated and found to be 1.365:0.09 (ml/g× 100). • * Left and right-sided brain regions were analyzed together except where indicated in brackets (L-left
side only). The value for right cerebrum, also determined using [51Cr]erythrocytes, was identical to left-side value.

49
Pig MANOMETER mrEnNAt/ [ II ~ I / / C ~ R o r I O /[l~ \/ / ~PERmTALTICRuMP
ARTERY ~ POLYETHYLENE [ CA NNUL A FI
INJECT CANNULATE 14C-SUCROSE LEFT
CAROTID DECAPITATE
L 1 1 BLO00 ~AMPLING A JO }EC.
30 MIN. PERFUSION TO ISOTONIC SUCROSE OR CLEAR BRAIN K R E B S - RINGER VASCULATURE SOLUTION
Fig. 1. Modified technique for determining permeability-area product (PA) for diffusion of poorly permeating substances across blood-brain barrier of the anesthetized rat. []4C]sucrose is injected intravenously and 5 min before the end of the 30-min blood-sampling period, the left common carotid artery is ligated and a cannula inserted in a distal direction. The sampling period is terminated by the following events in rapid sequence requiring < 1 rain: right common carotid artery ligated; heart beat stopped with an i.v. injection of pentobarbital (50 mg); both jugular veins severed; head vasculature perfused by peristaltic pump for 30 s at > 90 mm Hg; decapitation while pump is still running. [IAC]sucrose uptake in brain parenchyma can then be determined and related to time-integrated plasma concentration without the need to correct brain counts for intravascular tracer.
[5~Cr]erythrocytes were carr ied out in a manner ident ica l to those for RBV es t ima- t ion except that the left c o m m o n caro t id ar tery was cannu la t ed pr ior to the e ry throcy te in ject ion and the cerebra l vascula ture was per fused for 30 s at the t e rmina t ion of the 10 min exper iment jus t p r io r to decap i t a t ion of the rat. In 4 rats a 0.308 M non- rad ioac t ive sucrose solut ion was per fused at a pressure of 150-170 m m H g for 30 s; per fusa te volumes ranged f rom 17 to 22 ml. Mean rat ios of res idual [5~Cr]erythrocyte concen t ra t ion in b ra in vs b lood expressed as a percentage of the m e a n rat ios es tabl i shed in control , non-per fused rats were as follows: left cerebrum, 0.4 + 0.1 (S.E.)%; r ight cerebrum, 1.4 5- 0.4; cerebel lum, 1.4 5- 0.1; p o n s / m e d u l l a , 1.8 + 0.1. This ind ica ted that more than 98% of the b lood had been c leared out of b r a i n vascula ture in 30 s. In ano ther 4 exper imenta l ra ts the b ra in was per fused for 30 s with K r e b s - R i n g e r solut ion at a pressure of 90 -110 m m Hg. This so lu t ion was less viscous and per fusa te volumes ranged f rom 22 to 29 ml desp i te the lower per fus ion pressure. Mean rat ios of rad io t racer level in b ra in vs b lood , percen t of

50
con t ro l values, were as follows: left ce rebrum, 2.2 ___ 0.6; right ce rebrum, 4.0 + 0.6; cerebe l lum, 3.9 _+ 0.5; p o n s / m e d u l l a , 6.0 _+ 1.0.
Measurements of permeabili(v-area products Tab le II shows m e a n regional PA values f rom 11 rats in which an i n t r a v e n o u s
i n j ec t i on of [ InC]sucrose was p e rmi t t e d to c i rcula te for 30 min . In 4 rats (group I)
PA was ca lcu la ted us ing Eqn. 2 a n d 5~Cr-establ ished R B V values to correct for vascu la r tracer. In a second g roup of 4 rats (group II) vascu la r t racer was c leared f rom b ra in by a 30 s pe r fu s ion with K r e b s - R i n g e r so lu t ion p r io r to d e c a p i t a t i o n (Fig. 1). M e a n PA values averaged 14.9 + 1.5 (S.E.)% lower t han g roup I values, poss ib ly i n d i c a t i n g the loss of [~aC]sucrose by back -d i f fu s ion d u r i n g 30 s f rom p a r e n c h y m a to the per fusa te- f i l led vascula ture . In 3 rats the K r e b s - R i n g e r pe r fus ion t ime was ex tended to 5 min. M e a n PA values (g roup I I I ) are on the average 22.5 + 2.3% lower than c o r r e s p o n d i n g values in g roup I. S imi lar f ind ings were o b t a i n e d in o ther 30 -min expe r imen t s in which i so tonic sucrose so lu t ion (un labe led )
was per fused at 150-170 m m H g pressure to clear the vascula ture . M e a n PA values
TABLE II
MEASUREMENTS OF PERMEABILITY-AREA PRODUCT (PA) FOR [!4C]SUCROSE PERMEA- TION OF THE BLOOD-BRAIN BARRIER
An intravenous injection of [14C]sucrose was permitted to circulate for 30 rain. In group I, brain counts were corrected for intravascular tracer utilizing RBV values from Table I. In groups II and III, experiments were terminated by perfusion of Krebs-Ringer solution (Fig. 1) for 30 s or 5 min to clear vascular tracer from brain prior to decapitation.
Group and PA * Method s- ! >( 106 (.x± S.E.)
Cerebrum Cerebellum Pons/ Medulla
R L R L
I [SICr]RBV corrected (n = 4 rats) 9.10±0.31 9.50±0.32 9.99±0.28 10.15±0.31 9.26±0.27
II 30 s perfusion (n = 4) 7.99±0.27 8.04±0.35 8.29-t-0.29 8.22±0.2,1 8.26+0.62
III 5 rain perfusion (n = 3) 7,67±0.11 7.32±0.20 7.52±0.23 7.67±0.36 6.61 +0.22
I (recalculated) [ 14C]sucrose RBV - 7.49±0.21 7.65±0.17 6.30+0.35
I (recalculated) [ 3H]mannitol RBV 5.78+0.13 6.16±0.32 5.56±0.24 5.73±0.13 3.83±0.25
* The product (P, cm/s) times area (A, cm2/g) is obtained, Eqn. 1, from the ratio of parenchymal tracer concentration at 30 min (dpm/g) relative to the time-integrated plasma level (dpm s ml - 1 ). Units for PA simplify to s - l on the assumption that brain specific gravity approximates that for plasma. R and L refer to right or left side of brain.
51
f r o m rats wh ich u n d e r w e n t a p e r f u s i o n c l e a r a n c e p r o c e d u r e of 30 s, 3 m i n and 5 m i n
averaged , respec t ive ly , 18.2 + 0.6, 25.3 + 1.6, and 25.4 + 1.0% lower t h a n [51Cr]RBV
c o r r e c t e d c o n t r o l va lues f r o m rats in wh ich vascu la r p e r f u s i o n was n o t ca r r i ed ou t
( m e a n P A for con t ro l s , s - 1 × 10 6, r a n g e d f r o m 8.44 ___ 0.47 to 9.56 + 0.56 for 5 b r a i n
regions) .
T a b l e I I a lso shows P A va lues for g roup I wh ich were r eca l cu l a t ed us ing R B V
va lues f r o m 3-min [14C]sucrose and 2 -min [ 3 H ] m a n n i t o l e x p e r i m e n t s ( T a b l e I) to
co r r ec t for va scu l a r t racer . T h e resu l t ing P A va lues are subs tan t i a l ly lower t h a n
t hose d e t e r m i n e d f r o m the e x p e r i m e n t s t e r m i n a t e d by K r e b s - R i n g e r pe r fus ion . T h e
p r e s e n c e o f res idua l i n t r avascu l a r t r ace r still r e m a i n i n g in b r a i n a f te r p e r f u s i o n
w o u l d spur ious ly e l eva te P A in the l a t t e r e x p e r i m e n t s ; however , i t was f o u n d by
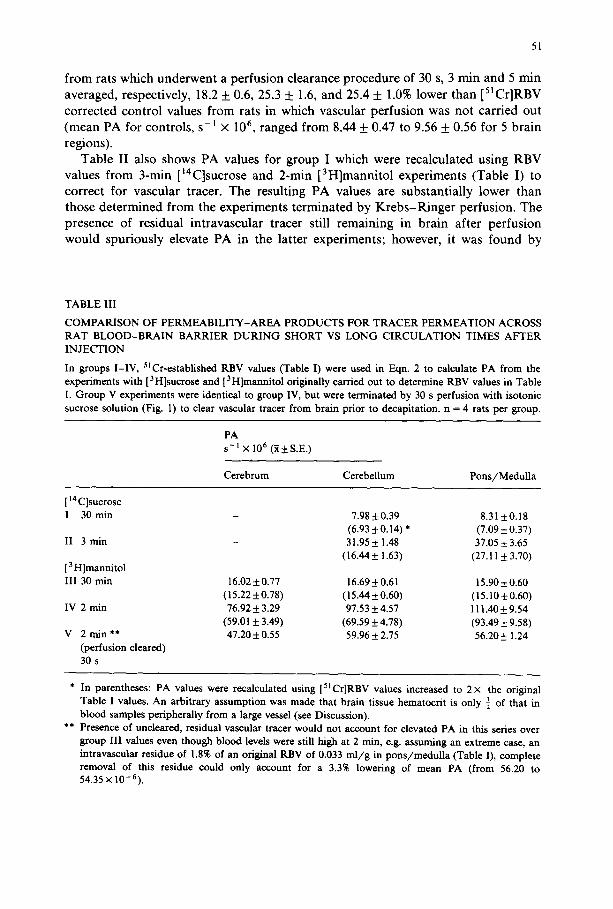
TABLE III
COMPARISON OF PERMEABILITY-AREA PRODUCTS FOR TRACER PERMEATION ACROSS RAT BLOOD-BRAIN BARRIER DURING SHORT VS LONG CIRCULATION TIMES AFTER INJECTION
In groups I-IV, 51Cr-established RBV values (Table I) were used in Eqn. 2 to calculate PA from the experiments with [3H]sucrose and [3H]mannitol originally carried out to determine RBV values in Table I. Group V experiments were identical to group IV, but were terminated by 30 s perfusion with isotonic sucrose solution (Fig. 1) to clear vascular tracer from brain prior to decapitation, n = 4 rats per group.
PA s -~ × 10 6 (~± S.E.)
Cerebrum Cerebellum Pons/Medulla
[ 14 C]sucrose I 30 min
II 3 min
[ 3 H]mannitol III 30 min
IV 2 rain
V 2 rain ** (perfusion cleared) 30 s
7.98+0.39 8.315:0.18 (6.93 5:0.14) * (7.09 5: 0.37) 31.95 5:1.48 37.05 + 3.65
(16.445: 1.63) (27.11 5: 3.70)
16.02 + 0.77 16.69 + 0.61 15.90 + 0.60 (15.22+0.78) (15.44+0.60) (15.10+0.60) 76.92 + 3.29 97.53 + 4.57 111.40 + 9.54
(59.01 5: 3.49) (69.59 + 4.78) (93.49 + 9.58) 47.20 + 0.55 59.96 + 2.75 56.20 + 1.24
* In parentheses: PA values were recalculated using [51Cr]RBV values increased to 2 x the original Table I values. An arbitrary assumption was made that brain tissue hematocrit is only ½ of that in blood samples peripherally from a large vessel (see Discussion).
** Presence of uncleared, residual vascular tracer would not account for elevated PA in this series over group III values even though blood levels were still high at 2 min, e.g. assuming an extreme case, an intravascular residue of 1.8% of an original RBV of 0.033 ml/g in pons/medulla (Table I), complete removal of this residue could only account for a 3.3% lowering of mean PA (from 56.20 to 54.35 × 10⁻⁶).

52
calculation that this error would be too small to account for the differences in Table II, i.e. Group II vs Group I (recalculated) PA products. *
Evidence for a fast-uptake space (high PA) for sucrose and mannitol Table III shows PA values calculated from the 3 and 30 rain experiments with
[14C]sucrose which had been carried out to determine the regional blood volumes reported in Table I. RBV values from [51Cr]erythrocyte experiments were used to correct brain counts for intravascular tracer in the PA calculations. The magnitude of PA for [14C]sucrose permeation during the first 3 min following injection (group II) is 4 times the magnitude of PA measured for a full 30-min circulation time (group I). PA values were similarly calculated from the 2 and 30 min experiments originally conducted to determine RBV with [3H]mannitol, and show that PA for permeation of this tracer during the first 2 rain after injection (group IV) is 5-7 times the magnitude of PA based on a 30-min experiment (group III). A further group of experiments was carried out in which [3H]mannitol was permitted to circulate 2 min, at the end of which an arterial blood sample was removed, and a 30 s perfusion was carried out with isotonic sucrose solution at 150-170 mm Hg pressure to clear vascular tracer before decapitation. This experiment confirmed that PA for a 2-min circulation time is several times larger than that based on a 30-rain experiment (group V vs group III). These 2-min PA values are well below the 2-min values for non-perfused animals (group V vs IV), indicating a substantial loss of parenchymal tracer by back diffusion. The table also shows (PA values in brackets) that an arbitrary doubling of [SICr]RBV values to recalculate PA for all non-perfused animals did not nullify the large differences in PA based on short vs long circulation times.
Discussion
The development of the vascular clearance technique was prompted by our concern over the problem of accurately determining the amount of intravascular tracer present in samples of dissected brain tissue so that parenchymal uptake could be quantified. This intravascular tracer is commonly estimated as the product of regional blood volume space (RBV, ml /g) established from separate experiments and tracer concentration in arterial blood sampled at the time of decapitation. When experimental circumstances determine that the final blood tracer level is high relative to that in brain parenchyma, inaccuracies in RBV estimates are augmented in the
* Experiments with [~lCrlerythrocytes had indicated the fraction (FR) of intravascular contents still remaining in brain after 30 s Krebs-Ringer perfusion (FR = 0.039 for cerebellum, 0.06 pons/medul la) .
x 30 The product of FR Cbioo d × RBV provided an estimate of residual intravascular tracer (dpm/g) remaining after perfusion which would elevate group II PA values. Such elevations for cerebellum would average 0.05, 0.13 or 0.19 s - 1 × 10- ~ (based on [ 51Cr]erythrocyte, [ 14 C]sucrose, and [ 3 H]manni- tol RBV values respectively). Corresponding figures for pons /medu l l a are 0.05, 0.20 and 0.31 S-I >(10 -6 '

53
calculation of PA. The discrepancies noted between RBV values established with [14 C]sucrose, [3 H]mannitol or [51Cr]erythrocytes (Table I), indicated the need for an alternative approach to estimation of PA products which would circumvent the use of RBV estimates.
Perfusion via the heart to clear intravascular tracer from brain is commonly used when proteins or protein-bound substances are employed as tracers of blood-brain barrier permeability. With much smaller tracer molecules such as [14C]sucrose, it is common practice to estimate and correct for intravascular tracer in brain, possibly because the attempt to perfuse vascular contents from brain raises uncertainty concerning the quantity of parenchymal tracer lost by back diffusion. To minimize such losses, we chose to perfuse directly via the common carotid artery at controlled pressure to promote vascular clearance in the shortest possible time. An average 15 % loss of parenchymal tracer by back diffusion in 30 s was indicated by comparison of 30-rain PA values for [14C]sucrose experiments terminated by vascular perfusion vs experiments involving estimation and correction for intravascular tracer (Table II). This loss may be overestimated, however, as it depends on the accuracy of [SICr]RBV values, which may represent underestimates of true RBV. Pertinent here is the report by Bodsch et al. (1982) who observed a cerebral tissue hematocrit (%) of only 26.4 vs. 40.6 in peripherally sampled blood. If in fact dissected brain tissue typically contains a larger proportion of plasma vs erythrocytes than exists in large systemic blood vessels, RBV calculated as the ratio of brain vs blood tracer concentration would be spuriously low in the case of an erythrocyte marker (51Cr), and high using a plasma marker ([14C]sucrose, [3 H]mannitol). To illustrate, an arbitrary correction factor may be calculated using the hematocrit values of Bodsch et al. (1982) *. Mean Table I RBV values (ml /g × 100) based on [51Cr]erythrocytes would be increased by a factor of × 1.54 to 0.77 (cerebrum and medulla) and 1.20 (cerebellum). These are still below the recalculated values (correction factor, × 0.807) based on [14 C]sucrose and [3H]mannitol, which ranged from 1.71 to 2.66. Considering again the problem of back-diffusion evaluated in Table II experiments, use of the hematocrit-corrected [5~Cr]RBV values to calculate PA indicated an average tracer loss of 8.6 + 1.6 and 17.7 + 1.9% after 30 s and 5 min Krebs-Ringer perfusion, respectively.
Our findings suggest a further reason for the discrepancies between RBV values, namely a relatively rapid permeation of sucrose or mannitol into brain during the first few min after injection. The RBV values determined using these substances fall within the broad range, between 1 and 3.5%, of values previously reported by a number of laboratories which have employed this technique (Rapoport et al., 1978, Ohno et al., 1978; Preston, 1982; Gross et al., 1982). The method assumes that most of the tracer measured in brain after short circulation time is within the vasculature,
* Assume a difference exists in fractional hematocrit in cerebral tissue blood (Chct) vs blood sampled peripherally from a large vessel (Phct)- The concentration of [SICr]erythrocytes in cerebral tissue blood (cpm/ml) would equal the value determined from a systemic sample times the ratio C h c t / / P h c t . For a plasma marker, e.g. [14C]sucrose, the appropriate ratio would be (1 - Chct)/1 -- Phct). Thus the calculation of regional blood volume space as Cbrain/Cbloo d (see Methods) should incorporate either ratio as appropriate into the denominator.

54
and furthermore that the correction for parenchymal uptake in 2.--5 min can be estimated from knowledge of the corresponding time-integrated plasma level (the driving force for diffusion across the barrier) and PA estimated from longer experiments, e.g. 30-50 rain. However, as Table III data suggests, the PA for sucrose or mannitol permeation of the barrier during the first few rain following injection is much higher than that averaged over a 30-min circulation period, even when an arbitrary allowance was made for hematocrit errors in the calculated PA. It may thus be invalid to use 30 rain PA values to estimate and correct RBV values for parenchymal uptake in short experiments. To do so would result in underestimates of parenchymal uptake, and a corresponding overestimate of RBV, This explanation for the discrepancies in RBV estimates is supported by the finding of Sisson and Oldendorf (1971) that mannitol penetrates the barrier to first enter a rapidly filling space, and then a more slowly filling space in brain parenchyma. That these spaces would empty by back diffusion at different rates may account for the indication in our sucrose data of a disproportionate loss of parenchymal tracer during the first 30 s of vascular perfusion as compared to 3 or 5 min. Such losses were noteworthy in the 2-rain mannitol experiments terminated by vascular perfusion (Table III, group V vs IV), possibly indicating that much of the tracer was located in a more labile space from which it might back diffuse more quickly. We have observed that this apparent back diffusion of mannitol is not nearly so substantive when a 30 s perfusion procedure is carried out following a 30-min tracer circulation (unpublished data) being comparable to that estimated for sucrose in the present study.
It is concluded that further assessment should be made of methods whereby small, poorly permeating molecules are used to estimate regional blood volume in brain. If major differences do exist in average hematocrit for dissected tissue vs that for peripherally sampled blood, the common practice of estimating RBV as a ratio of brain vs systemic blood tracer concentration would be in error, and it would be more appropriate to estimate the plasma compartment directly. Our own findings raise the additional possibility that such measurements involving sucrose or mannitol may be further compromised by a relatively rapid uptake of such substances into a high PA parenchymal space within the first few min after injection. The technique of vascular perfusion circumvents these problems; however, the back diffusion of vascular tracer during perfusion must be recognized as a source of error, particularly in experiments involving short tracer circulation times.
References
Bodsch, W., Hiirter, T. and Hossman, K.A. (1982) Immunochemical method for quantitative evaluation of vasogenic brain edema following cold injury of rat brain, Brain Res., 249: l 11-121.
Gjedde, A., Caronna, J.J., Hindfelt, B. and Plum, F. (1975) Whole-brain blood flow and oxygen metabolism in the rat during nitrous oxide anesthesia, Amer. J. Physiol., 229( 1): 113-118.
Gross, P.M., Teasdale, G.M., Graham, D.I., Angerson, W.J. and Harper, A.M. (1982) Intra-arterial histamine increases blood-brain transport in rats, Anaer. J. Physiol., 243:H307-H317.
Ohno, K., Pettigrew, K.D. and Rapoport, S.I. (1978) Lower limits of cerebrovascular permeability to nonelectrolytes in the conscious rat, Amer. J. Physiol., 235: H299-H307.

55
Preston, E. (1982) Failure of hyperthermia to open rat blood-brain barrier: reduced permeation of sucrose, Acta neuropathol., 57: 255-262.
Rapoport, S.I., Ohno, K., Fredericks, W.R. and Pettigrew, K.D. (1978) Regional cerebrovascular permeability to [14C]sucrose after osmotic opening of the blood-brain barrier, Brain Res., 150: 653-657.
Sisson, W.B. and Oldendorf, W.H. (1971) Brain distribution spaces of mannitol-3H, inulin)4C, and dextran-14C in the rat, Amer. J. Physiol., 221; 214-217.