A mixed linear modelling characterisation of gender and ...
26
A mixed linear modelling characterisation of gender and speed related changes in spatiotemporal and kinematic characteristics of gait across a wide speed range in healthy adults Stansfield, Ben; Hawkins, Katy; Adams, Sarah; Bhatt, Haseel Published in: Medical Engineering and Physics DOI: 10.1016/j.medengphy.2018.07.015 Publication date: 2018 Document Version Author accepted manuscript Link to publication in ResearchOnline Citation for published version (Harvard): Stansfield, B, Hawkins, K, Adams, S & Bhatt, H 2018, 'A mixed linear modelling characterisation of gender and speed related changes in spatiotemporal and kinematic characteristics of gait across a wide speed range in healthy adults', Medical Engineering and Physics, vol. 60, pp. 94-102. https://doi.org/10.1016/j.medengphy.2018.07.015 General rights Copyright and moral rights for the publications made accessible in the public portal are retained by the authors and/or other copyright owners and it is a condition of accessing publications that users recognise and abide by the legal requirements associated with these rights. Take down policy If you believe that this document breaches copyright please view our takedown policy at https://edshare.gcu.ac.uk/id/eprint/5179 for details of how to contact us. Download date: 19. Feb. 2022
Transcript of A mixed linear modelling characterisation of gender and ...
A mixed linear modelling characterisation of gender and speed related changes inspatiotemporal and kinematic characteristics of gait across a wide speed range inhealthy adultsStansfield, Ben; Hawkins, Katy; Adams, Sarah; Bhatt, Haseel
Published in:Medical Engineering and Physics
DOI:10.1016/j.medengphy.2018.07.015
Publication date:2018
Document VersionAuthor accepted manuscript
Link to publication in ResearchOnline
Citation for published version (Harvard):Stansfield, B, Hawkins, K, Adams, S & Bhatt, H 2018, 'A mixed linear modelling characterisation of gender andspeed related changes in spatiotemporal and kinematic characteristics of gait across a wide speed range inhealthy adults', Medical Engineering and Physics, vol. 60, pp. 94-102.https://doi.org/10.1016/j.medengphy.2018.07.015
General rightsCopyright and moral rights for the publications made accessible in the public portal are retained by the authors and/or other copyright ownersand it is a condition of accessing publications that users recognise and abide by the legal requirements associated with these rights.
Take down policyIf you believe that this document breaches copyright please view our takedown policy at https://edshare.gcu.ac.uk/id/eprint/5179 for detailsof how to contact us.
Download date: 19. Feb. 2022
Title: A mixed linear modelling characterisation of gender and speed related changes in
spatiotemporal and kinematic characteristics of gait across a wide speed range in healthy adults
Authors names and affiliations
Ben Stansfield ([email protected]), Katrina Hawkins ([email protected]), Sarah
Adams ([email protected]), Haseel Bhatt ([email protected])
All authors are affiliated to: School of Health and Life Sciences, Glasgow Caledonian University,
Cowcaddens Road, Glasgow, G4 0BA, UK.
Corresponding author: Ben Stansfield
Glasgow Caledonian University, Cowcaddens Road, Glasgow, G4 0BA, UK.
Email: [email protected]
Conflicts of Interest
The authors have no conflicts of interest.
Keywords
Gait speed; kinematics; spatiotemporal characteristics; normalisation; healthy adults; mixed linear
modelling
Highlights
Mixed linear modelling is used to explore changes in gait with gender and speed.
Fully normalised analysis is performed across 775 trials of walking data.
Normalised speed range of 0.10-0.55 - slowest to fastest possible walking speeds.
Gender dependent speed related changes are identified in kinematic outcomes.
Non-linear relationships of speed with spatiotemporal and kinematic characteristics.
Conflicts of Interest
The authors have no conflicts of interest.
Abstract
In exploring the relationship between the kinematics of gait and speed of progression individual
variation in patterns and gender differences have not always been adequately taken into account.
In the current study mixed linear modelling was used to isolate changes with speed from those
associated with individual variation and gender. Three-dimensional motion analysis of 20
participants (10M/10F, 25.7±5.1 years) walking at a wide range of speeds (normalised speeds 0.10-
0.55 ~0.41-2.26m/s) was recorded (775 walks). Spatiotemporal (speed, cadence, step length,
percentage of single and double support) and kinematic characteristics (pelvis through ankle) were
determined.
Significant between participant differences were highlighted in both intercept and slope of
relationships. In addition females exhibiting different peak pelvic tilt and obliquity, hip flexion and
internal rotation and ankle dorsiflexion compared to males. Spatiotemporal parameters exhibited
non-linear relationships with normalised speed (R2>0.5). Kinematic features exhibited significant
relationships with normalised speed, varying from linear to cubic, from very weak to strong in fit
(0.010>R2>0.672).
Mixed linear modelling highlighted gender dependent, speed related changes in addition to inter-
individual variation. Gender and speed are both important determinants of gait patterns, however,
individual variations remain.
Introduction
It is well known that changes in walking speed change spatiotemporal characteristics and the joint
angles used [1-6]. The exploration of the relationship between characteristics of gait and speed has
been accomplished using various methods. For example asking people to walk at ‘slow’, ‘normal’ and
‘fast’ speeds has been used to derive parameters related to a normal speed and a speed lower and
higher than this normal speed [2-4,7-9]. This allows the comparison of the outcomes between these
groups, providing evidence that there are changes with speed. Alternatively participants in a study
have been allowed to walk at their own self-selected speeds and then the speed range covered by
the sample has been subdivided into bands of speed and the average results of these bands used to
demonstrate speed related changes [10,11]. In other studies the range of speeds has been extended
by asking people to walk for multiple walks at a range of speeds both overground [1,5,12-15] and on
a treadmill [16-21]. In some of these analyses outcomes have been grouped by speed/speed band
and differences used to characterise speed related changes [12,14,15,20,21]. Overcoming the need
to use sub-groupings by speed, regression analysis has been presented examining the relationship
between speed of walking and gait characteristics [1,5,10,11,16]. Using regression analysis the
continuous relationship between an outcome and speed can be assessed. Whilst these methods
have provided additional insight into speed related changes these have not necessarily taken gender
based differences and individual variation into account. Techniques such as the use of mixed linear
modelling can be used to explore the relationship between outcomes and speed whilst factoring in
gender differences and allowing for variation between individuals within the analysis [22,23].
Within the current study mixed linear modelling was used to further define the relationship between
speed of walking and spatiotemporal and kinematic characteristics for healthy adults while taking
into account both gender and individual differences in movement patterns. The hypothesis was that
there would be significant speed related changes in gait characteristics and that gender and
individual variation would also be important.
Methods
Participants
Eighteen to sixty year olds (equal numbers of males and females) without lower limb impairment or
neurological condition were recruited from staff and students at a UK higher education institution.
All participants gave written informed consent based on institutional ethical approval.
Motion tracking
Three-dimensional motion of participants was tracked using 20 individual markers and 4 clusters
(thighs and shanks) of markers attached to the lower limbs (16 camera, 120Hz) (Qualisys AB,
Goteborg, Sweden). This model has been described in detail elsewhere [23]. Segment locations
were defined using the markers: Pelvis – bilateral posterior and anterior superior iliac spine markers,
thigh – hip joint centre and medial and lateral knee markers, shank – knee joint centre and medial
and lateral ankle markers, foot – heel and heads of metatarsals 1 and 5 markers. An ordered
sequence of rotations (flexion/extension, adduction/abduction, internal/external rotation) was used
to calculate joint rotations from the proximal to the distal segment coordinate system.
A static trial was used to define the relationship between the clusters of markers and markers
located on anatomical features, allowing the clusters to be used to track dynamic movements.
Calculation of all joint angles was accomplished in Visual 3D Professional (C-Motion Inc., MD, USA).
Data collection protocol
Participants walked along a 6m carpeted walk way, wearing shorts and bare foot, from a standing
start to a designated stopping area. Participants were allowed several walks to become familiar with
the set up before data was recorded. For each walk one complete right and left gait cycle were
identified over the middle section of the walk way. This maximised the chance of characterising
steady state walking by avoiding any speeding up or slowing down at the beginning or end of the
walk way.
Participants were required to follow a set protocol in terms of walking speed. First participants
walked for three walks at a self-selected normal walking pace. Then participants were asked to walk
incrementally slower for a further 7 walks. These started from slightly slower than their self-
selected normal walking pace and ended with a walk as slow as they were comfortable walking.
Following this participants again walked at their self-selected pace for three walks and then
incrementally faster until reaching their fastest walking pace after 7 additional trials. A total of 20
walking trials were therefore undertaken: 6 at self-selected normal walking speed, 7 slower than this
and 7 faster than this. The speed of walking adopted covered the entire range of speeds that the
participants felt was possible whilst still walking.
Data analysis
Consecutive left and right strides were identified within the mid-section of the walk way and time
points of heel strikes and foot offs determined. Step length was defined as the distance between the
heel markers (HEE) at the points of heel strike. Step time was determined as the time between the
relevant heel strike time points. Cadence of stepping was defined as 1/step time. Gait speed was
defined as the stepping speed, i.e. (step length)/(step time). 100% of the gait cycle was defined as
from first to second heel strike on the ipsilateral side. The percentages of the gait cycle in single
support, double support and swing were calculated using the relevant heel strike and foot off
timings in relation to the gait cycle. Both left and right side outcomes were used within the analysis
with appropriate adaptation of outcomes to allow combination of results.
Following methods previously advocated to take into account differences in size of participants,
normalisation of data was implemented [24,25]. To achieve this, variables were multiplied by
appropriate quantities relating to the size of the participants (Equations 1-4):
Normalised length = length x (1/Height); Equation 1
Normalised cadence = cadence x (√(Height/g); Equation 2
Normalised speed = speed x (1/(√(Height x g))); Equation 3
Normalised time = time x (1/(√(Height/g))) Equation 4
Where g=acceleration due to gravity = 9.81m/s2.
The speed of gait was characterised by the normalised speed of walking.
Changes in outcomes with normalised gait speed were explored using mixed linear modelling.
Sequential introduction of terms within the models was used to establish the significance of the
contribution of the term to the model. The maximum likelihood was used to estimate coefficients to
allow unbiased estimates of -2*logLikelihood (-2LnL). Changes in -2LnL were examined to establish
improvements in the model at the level of p<0.05. This required a reduction of 3.84 in -2LnL.
Random effects were used at the participant level, allowing differences between participants in
intercepts and slopes within the models to be assessed. This allowed unique curves to be generated
for each participant, splitting variation between participants at the higher level and speed of
progression at the lower level. Gender was introduced as a fixed effect. An unstructured covariance
structure was used. Speed, the square of speed and the cube of speed were introduced sequentially
and maintained in the model if their introduction improved the model. Random slope by participant
was introduced for the highest power of speed as long as a significant improvement in the model
was achieved. Once the model had been optimised the restricted maximum likelihood method was
used to allow the calculation of unbiased estimates of the model coefficients. To quantify the final
model fit R2 was calculated using the fixed parameters.
The relationships between normalised gait speed and spatiotemporal characteristics of gait including
cadence, step length, first double support, single support, second double support and swing
percentages of gait were characterised.
Joint kinematics were first examined by graphical presentation of the changes in outcomes across
the gait cycle. This was achieved by dividing all results from all participants into 0.05 normalised
speed bands from 0.10 to 0.55. From the graphical patterns of the joint angles minima and maxima
that followed clear trends with normalised speed were identified. The range of percentage of the
gait cycle within which these occurred was defined visually. Each range was selected to allow the
identification of the value of the outcome within a particular phase of the gait cycle. Where
appropriate both the value and timing of these points was extracted and characterised using the
mixed linear modelling method detailed previously.
All analysis was conducted in SPSS v23 (SPSS Inc, Chicago, IL) and used a level of significance of
p<0.05. To characterise the level of fit of the final model for each parameter the value of R2 was
evaluated against a pragmatic set of criteria: <0.1 very weak, 0.1-0.3 weak, 0.3-0.5 moderate, 0.5-0.7
strong, >0.7 very strong.
Results
Twenty participants (10M/10F, age 25.7±5.1 range 22-44 years, height 1.72±0.11m, weight
69.4±14.6kg) were successfully recruited. This study reports results using normalised quantities to
take into account the size of participants within the analysis. To allow comparison with other studies
that do not do this the data may be converted to non-normalised quantities using the following
values for a person of height 1.72m (average height of the current study participants):
length = normalised length x Height = normalised length x 1.72 (length, m)
cadence = normalised cadence x (1/√(Height/g) = normalised cadence x 2.39 (cadence, steps/s)
speed = normalised speed x (√(Height x g))) = normalised speed x 4.11 (speed, m/s)
A total of 800 (400 right and 400 left side) trials were recorded. Fourteen trials were discarded due
to unresolvable marker tracking difficulties. No trials were successfully recorded below a normalised
gait speed of 0.05, 6 from 0.05-0.10, 18 from 0.10-0.15, 49 from 0.15-0.20, 106 from 0.20-0.25, 150
from 0.25-0.30, 171 from 0.30-0.35, 152 from 0.35-0.40, 73 from 0.40-0.45, 40 from 0.45-0.50, 16
from 0.50-0.55, 4 from 0.55-0.60 and 1 from 0.60-0.65. As there were so few trials outside the
normalised gait speed of 0.10-0.55 further analysis was restricted to this range with 775 trials. The
normalised gait speed range of 0.10-0.55 is equivalent to 0.41 to 2.26m/s for a person of height
1.72m.
For all outcomes introducing random intercepts into the model gave a significant improvement in
the fit, indicating that there was variation between individuals. Additionally several variables
(including all spatiotemporal outcomes) were significantly explained by variation in the slope of the
relationship with the highest power of speed (Table 1). Therefore, both an offset in the best fit lines
and a variation in the slope of the lines between individuals helped to explain the variation in
outcomes.
Gender did not contribute significantly to any of the models for the spatiotemporal outcomes
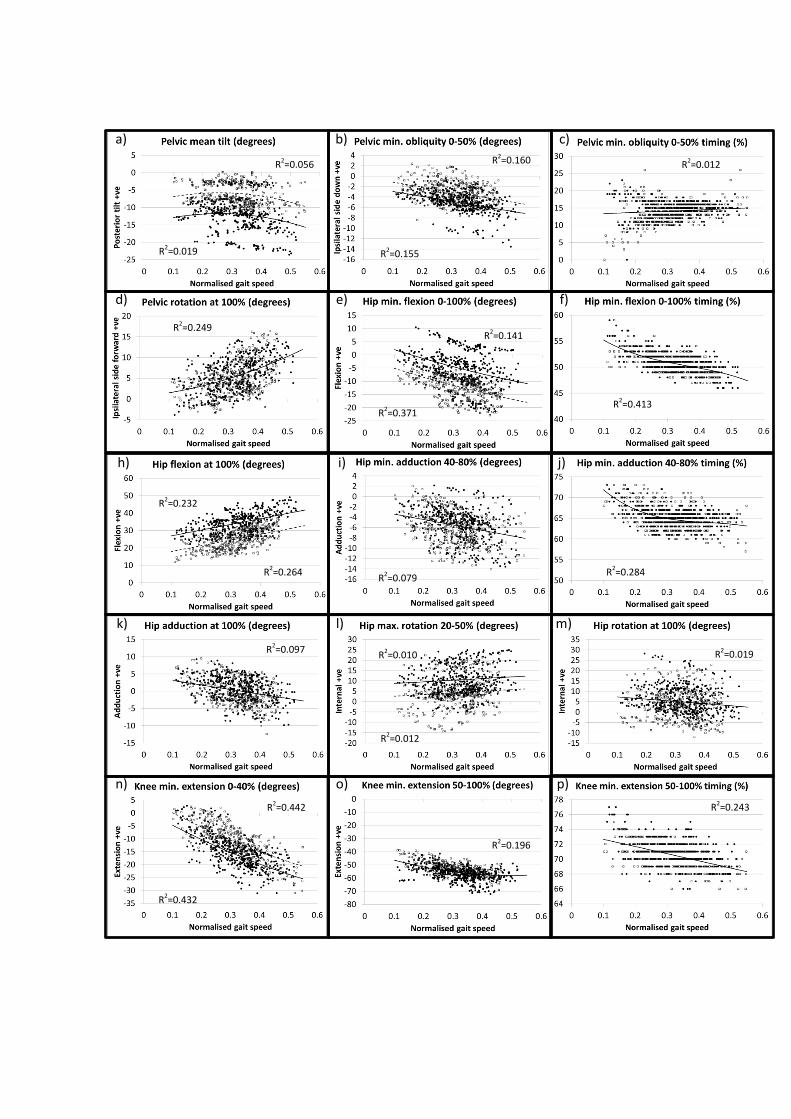
(Figure 1, Table 1). However, there were significant effects of gender in the kinematic outcomes
(Figure 3) with females having 6 degrees higher pelvic anterior tilt, 2 degrees higher side up pelvic
obliquity 0-50% (stance), 7 degrees less hip extension (pre-swing), 9 degrees greater hip flexion at
100% (heel strike), 6 degrees higher hip internal rotation 20-50% (stance), 5 degrees higher knee
flexion 0-40% (early stance) and 2 degrees higher ankle dorsiflexion 0-70% (mid-late stance) (Figure
3, Table 1).
All spatiotemporal parameters demonstrated significant strong to very strong (R2>0.5) squared or
cubic relationships with normalised gait speed. Changes across the normalised speed range
suggested more rapid changes in cadence at lower and higher speeds and more rapid changes in
step length at lower speeds. In general periods of support (both double and single) changed more
rapidly at the lower speeds with increasing speed than at the higher speeds. Observation of the
kinematic graphs (Figure 2) highlighted minima and maxima that changed with normalised gait
speed. These are characterised and presented in Figure 3. The scatter plots highlighted differences
between individuals with some clustering of outcomes at the more extreme ranges of the data,
which were associated with individual participants. These differences are confirmed by the
significance of the random parameter of intercept in the model (Table 1). For kinematic outcomes
there were a variety of linear, squared and cubic models for changes with normalised gait speed
(Table 1). All kinematic parameters demonstrated some significant relationship with speed of
progression, although these ranged in strength from very weak (e.g. maximum hip internal rotation
20-50% R2= 0.010 females and 0.012 males, hip internal rotation at 100% R2=0.019) to moderate
(minimum hip flexion 0-100% timing R2=0.413, minimum knee extension 0-40% R2=0.442 males and
0.432 females, maximum ankle dorsiflexion 0-70% timing R2=0.520) and strong (minimum ankle
dorsiflexion 40-80% timing R2=0.672). In general kinematic outcomes exhibited a greater range of
motion at higher speeds and timings changed to be earlier in the gait cycle. One exception to the
timing change was the timing of the minimum pelvic obliquity 0-50%, which at lower cadences
appeared to exhibit two distinct patterns with representation in each from male and female
participants. Non-linear (normalised speed squared and cubed terms) parts of the models did not
appear to follow consistent patterns between kinematic parameters. For some the non-linearity
exhibited was for larger changes with speed at lower speeds (e.g. minimum ankle dorsiflexion 40-
80%), but for others there were larger changes with speed at higher speeds (e.g. minimum ankle
dorsiflexion 0-20%).
Discussion
Using mixed linear modelling it was possible to explore gender dependent speed related changes in
gait. A wide range of gait speeds (0.10-0.55) is presented covering the full range that is possible
within participants’ slowest to fastest walking speed range. Inter-individual variation was identified
in the mixed linear model across all outcome variables indicating that three-dimensional motion
analysis results of walking differ between individuals independent of speed and gender. Gender
based differences were not seen in spatiotemporal outcomes suggesting that males and females use
the same combinations of cadence and step length to achieve speed and maintain the same
proportions of double, single and swing phases in the gait cycle across the range of speeds studied.
There were, however, distinct differences between males and females in joint kinematics and
significant non-linear trends with changing speed. These findings emphasise the need for speed to
be taken into account in describing normal walking patterns and that these relationships are non-
linear.
There have been previous reports of changes with speed of both the spatiotemporal and kinematic
characteristics of gait (e.g. [1-6]). However, these reports have not used a mixed linear modelling
approach to develop model parameters, have often used a limited range of speeds, used data that
has not been normalised or grouped results across genders. There are, therefore no reports to
directly compare with the outcomes of the current study. However, the outcomes presented in
other studies can be used to examine similarities in trends presented and the proportion of changes
in variables that might be explained by speed.
Very similar patterns of changes in spatiotemporal parameters have been reported [5,18] giving
regression equations for relationships with speed with similar high levels of correlation or R2. For
example Kirtley et al [1] report correlation coefficients for speed with stride length and phase
durations from 0.64-0.95, Hirokawa [7] reported a correlation coefficient of over 0.99 between
speed and cadence, Stansfield et al [16] report R2 for cadence and step length of greater than 0.99
for grouped results for treadmill walking. However, several of these previous studies [1,5] have not
fully normalised their outcomes possibly leading to trends being affected by the relative height of
participants travelling fast and slow in their studies. Patterns of kinematic changes with speed have
also been previously reported graphically with very similar trends to the current study being
highlighted between speed band grouped data [14,15,17,18]. Graphical representation of scatter of
data about the best fit lines [3,10] and descriptors of fit (e.g. R2) have also been previously reported
and are generally in agreement with the current study. These indicate that there are trends for
increasing joint ranges of motion with higher speeds, that there are some joint angles that are best
described with non-linear fit [13] and that the changes of kinematic variables with speed are not as
clearly related (lower R2) to speed in comparison to the spatiotemporal characteristics [10,11,13].
So, whilst previous reports are available which present trends in both spatiotemporal and kinematic
characteristics which are in agreement with the current study none has used fully normalised data
analysis, incorporated the widest possible range of speeds, ensured gender has been taken into
account and incorporated an allowance of variation between participants in the fitting of models to
the data.
A wide range of speeds was achieved by the participants in this study. However, this range was
achieved by asking participants to walk faster and slower than their self-selected normal walking
pace. An alternative method of collecting data across a wide range would be to only collect data at
self-selected normal speed, but for a very large population of healthy adults. This would have
provided examples or walking across a range of speeds without forced adjustment of speed. Whilst
this would have had the beneficial effect of representing self-selected walking speeds, it is unlikely
that such results would have covered such a wide range of walking speed as reported here.
The mixed linear modelling highlighted elements of the model that produced significant
improvement in description of the relationship between outcomes and speed. However, to gain an
overall impression of the amount of variation in the data described by the models the R2 values must
be examined. For the specific kinematic minima and maxima the R2 values illustrated that the model
fitted outcomes at the pelvis, only very weakly or weakly; at the hip weakly to moderately for
sagittal plane motion, but only weakly for motion in the other planes; at the knee weakly to
moderately in the sagittal plane and at the ankle only weakly to very weakly. These levels of fit were
similar to previous reports [1,10,11,13]. So whilst the models were developed identifying
statistically significant improvements in the model fit to the data, the proportion of overall variation
in the data described by the models was low in many cases. This suggests that there remains a high
level of variation within individuals for a number of kinematic characteristics that is not explained by
changes with speed. This was confirmed by the significance of random intercept and slope within
the models for many outcomes.
Gender differences may be related to differences in proportions of the body between men and
women (e.g. women have relatively higher inter-hip joint dimensions). Also differences in muscular
strength, or muscular configuration related to anatomical differences may have been important in
determining outcomes between genders across the speed range. Non-linear relationships between
speed and joint angles may be related to the optimisation of energy consumption through the use of
the most efficient muscle activation strategy. These hypotheses would have to be further tested.
Between gender differences in joint kinematics were not reflected in differences in spatiotemporal
outcomes. This indicates that the differences in joint kinematics effectively combined to result in no
significant differences in spatiotemporal parameters.
Conclusion
Mixed linear modelling was used, within a fully normalised analysis, to explore the relationship
between speed of walking and spatiotemporal and kinematic characteristics of gait, while taking into
account gender and individual variation. Non-linear relationships between speed and
spatiotemporal and kinematic characteristics were identified with individual variation being
significant across all characteristics and gender in a number of kinematic characteristics. Speed was
a significant predictor of all gait characteristics analysed, however, the proportion of variation
described by the models was not always high. The non-linear relationships highlighted suggest that
changing strategies are used to accomplish speeds at different points across the range of self-
selected speeds possible.
Acknowledgements
The authors would like to thank all participants in the study. This research did not receive any
specific grant from funding agencies in the public, commercial, or not-for-profit sectors. Ethical
approval for this study was granted by the Glasgow Caledonian University, School of Health and Life
Sciences Ethics Committee, reference number: HLS id: B11/08.
Conflict of Interest
The authors have no conflict of interest in regards to this work.
References
[1] Kirtley C, Whittle MW, Jefferson RJ. Influences of walking speed on gait parameters. J Biomed Eng
1985;7:282-288.
[2] Oberg T, Karsznia A, Oberg K. Basic gait parameters: reference data for normal subjects 10-79
years of age. J Rehabil Res and Dev 1993;30:210-223.
[3] Oberg T, Karsznia A, Oberg K. Joint angle parameters in gait: reference data for normal subjects,
10-79 years of age. J Rehabil Res & Dev 1994;31:199-213.
[4] Andriacchi TP, Ogle JA, Galante JO. Walking speed as a basis for normal and abnormal gait
measurements. J Biomech 1977;10:261-268.
[5] Grieve DW and Gear RJ. The relationship between length of stride, step frequency, time of swing
and speed of walking for children and adults. Ergonomics 1966;9:379-399.
[6] Murray MP, Kory RC, Clarkson BH, Sepic SB. Comparison of free and fast speed walking patterns
of normal men. Am J Phys Med 1966;45:8-24.
[7] Hirokawa S. Normal gait characteristics under temporal and distance constraints. J Biomed Eng
1989;11:449-456.
[8] Hanlon M, Anderson R. Prediction methods to account for the effect of gait speed on lower limb
angular kinematics. Gait & Posture 2006;24:280-287.
[9] Chehab EF, Andriacchi TP, Favre J. Speed, age, sex and body mass index provide a rigourous basis
for comparing the kinematic and kinetic profiles of the lower extremity during walking. J Biomech
2017;58:11-20.
[10] Stansfield BW, Hillman SJ, Hazlewood ME, Robb JE. Regression analysis of gait parameters with
speed in normal children walking at self-selected speeds. Gait & Posture 2006;23:288-294.
[11] Van Hamme A, El Habachi A, Samson W, Dumas R, Cheze L, Dohin B. Gait parameters database
for young children: the influence of age and walking speed. Clinical Biomech 2015;30:572-577.
[12] Holden JP, Chou G, Stanhope SJ. Changers in knee joint function over a wide range of walking
speeds. Clinical Biomech 1997;12:375-382.
[13] Lelas JL, Merriman GJ, Riley PO, Kerrigan DC. Predicting peak kinematic and kinetic parameters
from gait speed. Gait & Posture 2003;17:106-112.
[14] Van der Linden ML, Kerr AM, Hazlewood ME, Hillman SJ, Robb JE. Kinematic and kinetic gait
characteristics of normal children walking at a range of clinically relevant speeds. J Pediatric Orthop
2002;22:800-806.
[15] Schwartz MH, Rozumalski A, Trost JP. The effect of walking speed on the gait of typically
developing children. J Biomech 2008;41:1639-1650.
[16] Stansfield B, Hajarnis M, Sudarshan R. Characteristics of very slow stepping in healthy adults and
validity of the activPAL3 activity monitor in detecting these steps. Med Eng & Phys 2015;27:42-47.
[17] Stoquart G, Dedtrembleur C, Lejeune T. Effect of speed on kinematic, kinetic, electromyographic
and energetic reference values during treadmill walking. Clinical Neurophysiol 2008;38:105-116.
[18] Van Hedel HJA, Tomatis L, Muller R. Modulation of leg muscle activity and gait kinematics by
walking speed and bodyweight unloading. Gait & Posture 2006;24:35-45.
[19] Koopman B, van Asseldonk EHF, van der Koij H. Speed-dependent reference joint trajectory
generation for robotic gait support. J Biomech 2014;47:1447-1458.
[20] Browning RC, Kram R. Effects of obesity on the biomechanics of walking at different speeds.
Med & Sci in Sports & Exercise 2007;39:1632-41.
[21] Chiu M-C, Wang M-J. The effect of gait speed and gender on perceived exertion, muscle activity,
joint motion of lower extremity, ground reaction force and heart rate during normal walking. Gait &
Posture 2007;25:385-392.
[22] Keene DJ, Moe-Nilssen R, Lamb SE. The application of multilevel modelling to account for the
influences of walking speed in gait analysis. Gait & Posture 2016;43:216-219.
[23] Stansfield B, Hawkins K, Adams S, Church D, Spatiotemporal and kinematic characteristics of gait
initiation across a wide speed range, Gait & Posture 2018;61:331-338. DOI
https://doi.org/10.1016/j.gaitpost.2018.02.003
[24] Stansfield BW, Hazlewood ME, Hillman SJ. Lawson AM, Loudon IR, Mann AM, Robb JE,
Normalisation of gait data in children. Gait & Posture 2003; 17:81-87.
[25] Hof AL. Scaling gait data to body size. Gait & Posture 1996; 4:222-3.
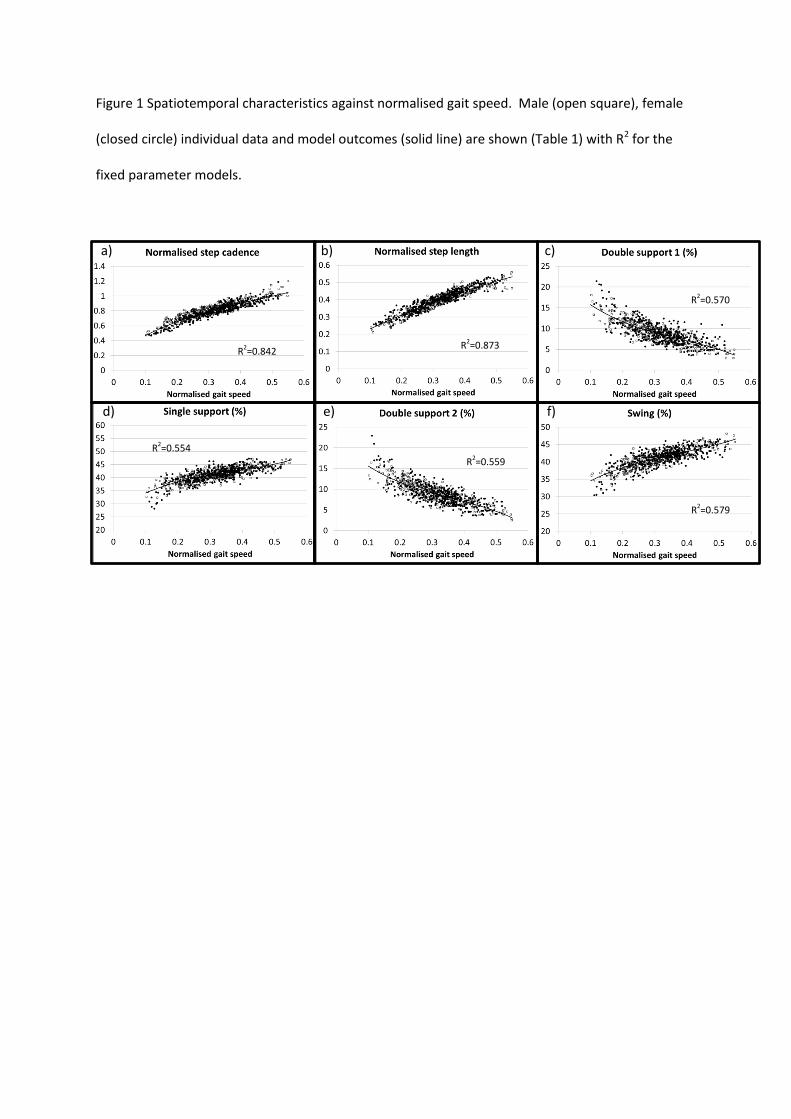
Figure 1 Spatiotemporal characteristics against normalised gait speed. Male (open square), female
(closed circle) individual data and model outcomes (solid line) are shown (Table 1) with R2 for the
fixed parameter models.
a) b) c)
d) e) f)
R2=0.842
R2=0.554
R2=0.570
R2=0.579
R2=0.559
R2=0.873
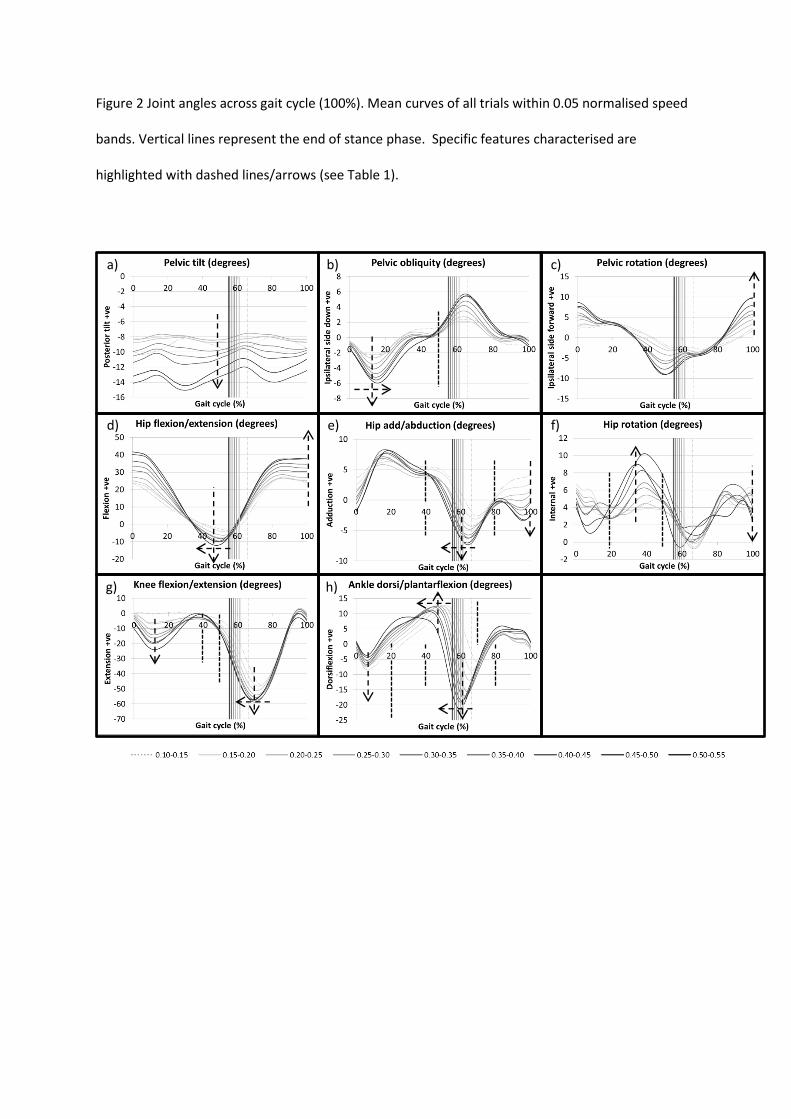
Figure 2 Joint angles across gait cycle (100%). Mean curves of all trials within 0.05 normalised speed
bands. Vertical lines represent the end of stance phase. Specific features characterised are
highlighted with dashed lines/arrows (see Table 1).
a) b) c)
d) e) f)
g) h)
Figure 3 Specific features of joint kinematics against normalised gait speed. Male (open square,
dashed line), female (closed circle, solid line) individual data and model outcomes are shown (Table
1) with R2 for the fixed parameter models. Where there was no difference between model
outcomes for males and females a solid line is used. All participants’ data for all trials are shown.
min = minimum, max = maximum, percentages refer to gait cycle.
a) b) c)
d) e) f)
h) i) j)
k) l) m)
n) o) p)
R2=0.019
R2=0.141
R2=0.012 R2=0.056
R2=0.155
R2=0.160
R2=0.249
R2=0.371 R2=0.413
R2=0.232
R2=0.264 R2=0.284 R2=0.079
R2=0.019 R2=0.010
R2=0.012
R2=0.097
R2=0.432
R2=0.196
R2=0.243 R2=0.442
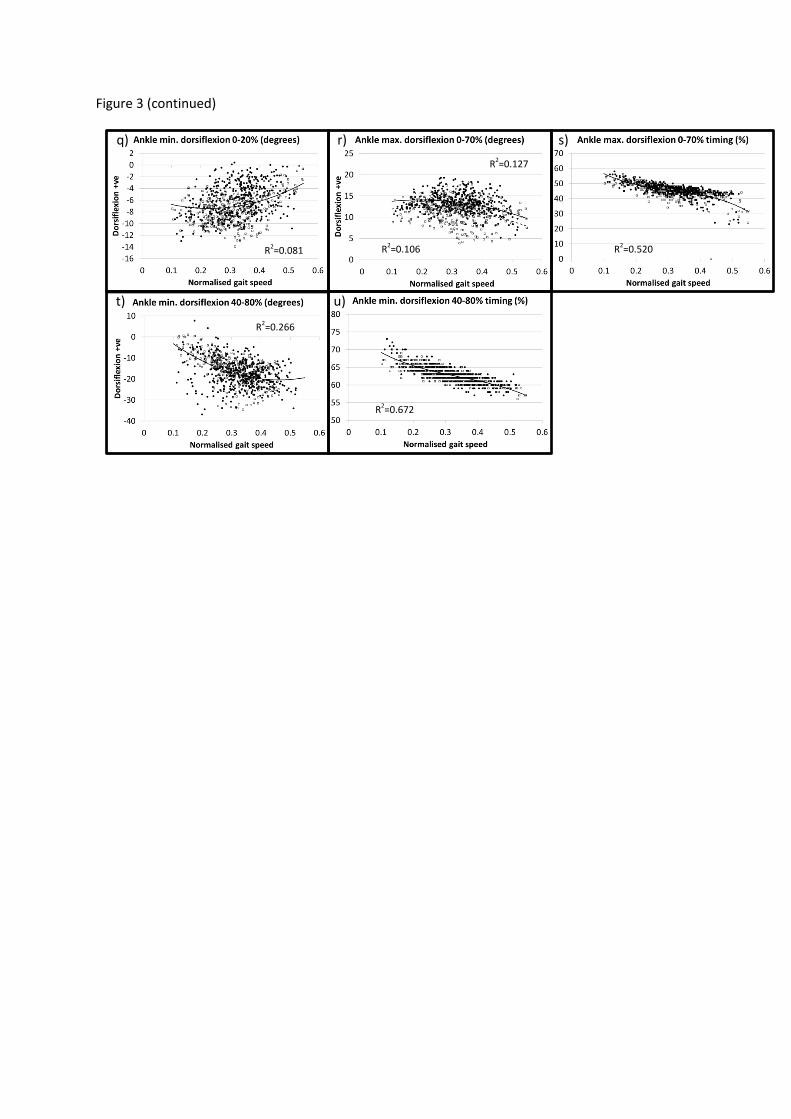
Figure 3 (continued)
q) r) s)
t) u)
R2=0.672
R2=0.081
R2=0.127
R2=0.106
R2=0.266
R2=0.520

Table 1 Model parameters for normalised spatiotemporal outcomes and kinematic features. Coefficients which were not statistically significant are highlighted in bold, but
are included as their sequential inclusion improved the level of model fit. P values are given in square brackets and 95% confidence intervals are given below coefficients.
For the kinematic outcomes the relevant phase of the gait cycle is indicated.
Outcome Fixed parameters Random Parameters R2
Intercept Slope of highest power
of speed
Gender (F) Intercept NormS NormS2 NormS3 Covariance Covariance Male Female
Spatiotemporal outcomes Step cadence (normalised) 0.211 [<0.001] 2.966 [<0.001] -4.396 [<0.001] 3.218 [0.001] 0.0020 [0.003] 0.4677 [0.005] 0.842 [<0.001]
0.153,0.269 2.409,3.522 -6.202,-2.590 1.322,5.115 0.0010,0.0039 0.2320,0.9431 Step length (normalised) 0.141 [<0.001] 0.939 [<0.001] -0.413 [<0.001] 0.0006 [0.003] 0.0258 [0.004] 0.873 [<0.001]
0.126,0.156 0.876,1.001 -0.535,-0.292 0.0003,0.0012 0.0131,0.0507 First double support (%) 22.0 [<0.001] -76.2 [<0.001] 149.4 [<0.001] -130.2 [0.003] 1.494 [0.004] 128.0 [0.041] 0.570 [<0.001]
19.4,24.6 -102.1,-50.3 65.6,233.2 -216.8,-43.6 0.759,2.940 49.1,333.8 Single support (%) 27.4 [<0.001] 82.9 [<0.001] -172.4 [<0.001] 155.4 [0.001] 1.460 [0.004] 129.7 [0.051] 0.554 [<0.001]
24.5,30.2 54.5,111.3 -264.2,-80.5 60.7,250.2 0.737,2.892 47.6,353.5 Second double support (%) 1.460 [0.004] 129.7 [0.051] 1.460 [0.004] 129.7 [0.051] 1.546 [0.004] 144.5 [0.028] 0.559 [<0.001]
0.737,2.892 47.6,353.5 0.737,2.892 47.6,353.5 0.789,3.029 59.1,353.1 Swing phase (%) 28.9 [<0.001] 67.8 [<0.001] -125.6 [0.003] 110.0 [0.012] 1.538 [0.004] 164.2 [0.027] 0.579 [<0.001]
26.3,31.4 42.3,93.3 -208.1,-43.1 24.6,195.4 0.781,3.030 67.7,398.5
Kinematic outcomes Pelvic posterior tilt mean -5.96 [0.006] -8.82 [<0.001] 23.55 [<0.001] -45.83 [<0.001] 18.44 [0.003] 158.1 [0.003] 0.056 0.019
-10.00,-1.92 -11.73,-5.91 19.62,27.48 -54.20,-37.46 9.56,35.56 81.7,305.8 [<0.001] [<0.001] Min. pelvic obliquity 0-50% (stance)
-1.78 [<0.001] -0.23 [0.518] -9.38 [<0.001] 0.62 [0.008] 0.160 0.155
-2.56,-0.99 -0.94,0.48 -10.89,-7.88 0.30,1.29 [<0.001] [<0.001] Min. pelvic obliquity 0-50% timing (%)
13.002 [<0.001] 3.606 [0.281] 30.09 [0.003] 194.6 [0.004] 0.012 [0.002]
10.361,15.643 -3.190,10.403 15.39,58.82 98.2,385.4 Pelvic rotation at 100% (heel strike)
0.571 [0.635] 6.752 [0.345] 25.234 [0.031] 3.801 [0.012] 244.2 [0.017] 0.249 [<0.001]
-1.791,2.933 -7.280,20.784 2.313,48.155 1.750,8.260 107.1,556.7 Min. hip flexion 0-100% (pre-swing)
7.078 [0.011] -1.410 [0.451] -38.390 [<0.001] 14.993 [0.015] 30.75 [0.003] 171.1 [0.005] 0.371 0.141
1.848,12.308 -5.222,2.403 -45.141,-31.639 2.941,27.044 15.90,59.46 84.5,346.5 [<0.001] [<0.001] Min. hip flexion 0-100% timing (%)
59.7 [<0.001] -56.4 [<0.001] 125.4 [0.003] -115.7 [0.009] 0.957 [0.005] 184.0 [0.033] 0.413 [<0.001]
57.1,62.2 -82.1,-30.6 42.0,208.9 -202.1,-29.4 0.474,1.934 73.5,460.4 Hip flexion at 100% (heel strike)
8.99 [0.001] 14.61 [<0.001] 33.03 [<0.001] 26.45 [0.005] 121.8 [0.007] 0.264 0.232
4.02,13.96 11.09,18.12 27.54,38.51 13.25,52.81 59.2,250.5 [<0.001] [<0.001] Min. hip adduction 40-80% (early-swing)
-2.35 [<0.001] -10.44 [<0.001] 3.14 [0.003] 0.079 [<0.001]
-3.43,-1.27 -12.64,-8.23 1.61,6.13 Min. hip adduction 40-80% timing (%)
80.1 [<0.001] -103.5 [<0.001] 229.7 [<0.001] -177.5 [0.003] 4.483 [0.003] 550.4 [0.011] 0.284 [<0.001]
76.5,83.7 -138.7,-68.3 115.6,343.7 -295.9,-59.1 2.298,8.748 254.1,1192.6 Hip adduction at 100% (heel strike)
4.41 [<0.001] -13.17 [<0.001] 4.61 [0.003] 0.097 [<0.001]
3.16,5.66 -15.55,-10.78 2.38,8.94 Max. hip internal rotation 20-50% (stance)
6.14 [0.041] 1.82 [0.386] 7.84 [<0.001] 38.46 [0.003] 0.012 0.010
0.28,12.00 -2.45,6.08 4.28,11.39 19.85,74.51 [0.009] [0.021] Hip internal rotation at 100% (heel strike)
8.40 [<0.001] -10.94 [<0.001] 26.13 [0.003] 0.019 [<0.001]
5.62,11.17 -15.45,-6.43 13.58,50.27 Min. knee extension 0-40% (early stance)
-4.85 [0.012] 6.14 [0.001] -62.97 [<0.001] 25.99 [0.043] 14.03 [0.005] 476.2 [0.009] 0.442 0.432
-8.49,-1.21 2.79,9.49 -77.82,-48.11 0.88,51.10 6.99,28.17 224.1,1011.6 [<0.001] [<0.001] Min. knee extension 50-100% (swing)
-39.72 [<0.001] -73.98 [<0.001] 74.36 [<0.001] 21.34 [0.003] 514.8 [0.006] 0.196 [<0.001]
-42.64,-36.80 -86.96,-60.99 51.71,97.01 11.01,41.35 252.0,1051.8 Min. knee extension 50-100% timing (%)
73.63 [<0.001] -9.66 [<0.001] 3.69 [0.009] 24.5 [0.014] 0.243 [<0.001]
72.65,74.61 -12.25,-7.06 1.75,7.80 11.0,54.3 Min. ankle dorsiflexion 0- -5.26 [<0.001] -18.98 [<0.001] 41.56 [<0.001] 4.159 [0.005] 61.1 [0.037] 0.081 [<0.001]
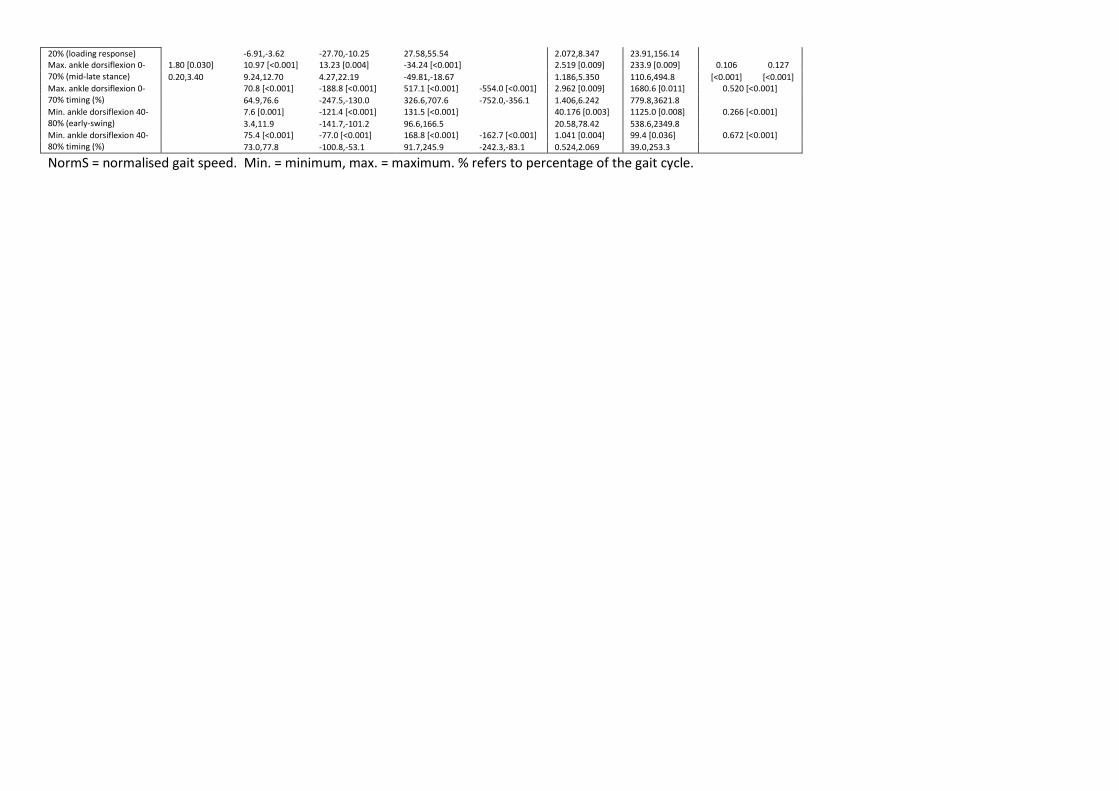
20% (loading response) -6.91,-3.62 -27.70,-10.25 27.58,55.54 2.072,8.347 23.91,156.14 Max. ankle dorsiflexion 0-70% (mid-late stance)
1.80 [0.030] 10.97 [<0.001] 13.23 [0.004] -34.24 [<0.001] 2.519 [0.009] 233.9 [0.009] 0.106 0.127
0.20,3.40 9.24,12.70 4.27,22.19 -49.81,-18.67 1.186,5.350 110.6,494.8 [<0.001] [<0.001] Max. ankle dorsiflexion 0-70% timing (%)
70.8 [<0.001] -188.8 [<0.001] 517.1 [<0.001] -554.0 [<0.001] 2.962 [0.009] 1680.6 [0.011] 0.520 [<0.001]
64.9,76.6 -247.5,-130.0 326.6,707.6 -752.0,-356.1 1.406,6.242 779.8,3621.8 Min. ankle dorsiflexion 40-80% (early-swing)
7.6 [0.001] -121.4 [<0.001] 131.5 [<0.001] 40.176 [0.003] 1125.0 [0.008] 0.266 [<0.001]
3.4,11.9 -141.7,-101.2 96.6,166.5 20.58,78.42 538.6,2349.8 Min. ankle dorsiflexion 40-80% timing (%)
75.4 [<0.001] -77.0 [<0.001] 168.8 [<0.001] -162.7 [<0.001] 1.041 [0.004] 99.4 [0.036] 0.672 [<0.001]
73.0,77.8 -100.8,-53.1 91.7,245.9 -242.3,-83.1 0.524,2.069 39.0,253.3
NormS = normalised gait speed. Min. = minimum, max. = maximum. % refers to percentage of the gait cycle.