A High-Fidelity Energy Monitoring and Feedback Architecture for Reducing Electrical Consumption
125
A High-Fidelity Energy Monitoring and Feedback Architecture for Reducing Electrical Consumption in Buildings by Xiaofan Jiang A dissertation submitted in partial satisfaction of the requirements for the degree of Doctor of Philosophy in Computer Science in the Graduate Division of the University of California, Berkeley Committee in charge: Professor David E. Culler, Chair Professor David M. Auslander Professor Randy H. Katz Professor Seth R. Sanders Fall 2010
Transcript of A High-Fidelity Energy Monitoring and Feedback Architecture for Reducing Electrical Consumption

A High-Fidelity Energy Monitoring and Feedback Architecture for ReducingElectrical Consumption in Buildings
by
Xiaofan Jiang
A dissertation submitted in partial satisfaction of the
requirements for the degree of
Doctor of Philosophy
in
Computer Science
in the
Graduate Division
of the
University of California, Berkeley
Committee in charge:
Professor David E. Culler, ChairProfessor David M. Auslander
Professor Randy H. KatzProfessor Seth R. Sanders
Fall 2010


A High-Fidelity Energy Monitoring and Feedback Architecture for ReducingElectrical Consumption in Buildings
Copyright 2010by
Xiaofan Jiang

1
Abstract
A High-Fidelity Energy Monitoring and Feedback Architecture for Reducing ElectricalConsumption in Buildings
by
Xiaofan Jiang
Doctor of Philosophy in Computer Science
University of California, Berkeley
Professor David E. Culler, Chair
Existing solutions in commercial building energy monitoring are insufficient in identifyingenergy waste or for guiding improvement. This is because they only provide usage statisticsin aggregate, both spatially and temporally. To significantly and sustainably reduce energyusage in buildings, we need an architecture and a system implementation that provide high-fidelity real-time visibility into each component of the building.
We propose a three-tiered architecture consisting of sensing, data delivery and represen-tation, and applications and services. We show that this layering allows us to cleanly abstractthe low-level details of the myriads of disparate monitoring instruments and protocols, pro-vide an uniform data representation interface, and enable innovation in portable buildingapplications. This thesis further explores each layer in detail and present design decisionsand findings.
Building on top of this architecture, we propose an application process flow for energydata analysis and visualization, substantiated by a real deployment. This process consistsof three parts: first, to understand and instrument the load tree; second, to conduct dataanalysis, modeling, and disaggregation of energy usage statistics; and third, combined withmeta-data, to re-aggregate individual load usages into actionable representations for visual-ization and feedback to the occupants.
Finally, we evaluate the proposed architecture and process flow with a diverse class ofbuilding applications, visualizations, and deployments.

i
Dedicated to my parents, Guocheng Jiang and Wei Ning,for their continuous support and encouragement throughout my life.
ii
Contents
List of Figures v
List of Tables x
Acknowledgements xi
1 Introduction 11.1 Problem Statement . . . . . . . . . . . . . . . . . . . . . . . . . . . . . . . . 21.2 Architecture Overview . . . . . . . . . . . . . . . . . . . . . . . . . . . . . . 31.3 Roadmap . . . . . . . . . . . . . . . . . . . . . . . . . . . . . . . . . . . . . 5
2 Background 72.1 Energy Flows in Buildings . . . . . . . . . . . . . . . . . . . . . . . . . . . . 7
2.1.1 Electric Flows . . . . . . . . . . . . . . . . . . . . . . . . . . . . . . . 82.1.2 Climate Plants . . . . . . . . . . . . . . . . . . . . . . . . . . . . . . 10
2.2 Current Building Energy Monitoring and Management Solutions . . . . . . . 102.2.1 Building Management Systems . . . . . . . . . . . . . . . . . . . . . 112.2.2 Plug-load Monitoring . . . . . . . . . . . . . . . . . . . . . . . . . . . 132.2.3 Power Disaggregation . . . . . . . . . . . . . . . . . . . . . . . . . . . 14
2.3 Sensor Networks . . . . . . . . . . . . . . . . . . . . . . . . . . . . . . . . . . 152.3.1 Hardware Platforms . . . . . . . . . . . . . . . . . . . . . . . . . . . 152.3.2 Networking . . . . . . . . . . . . . . . . . . . . . . . . . . . . . . . . 16
2.4 Building Energy Modeling Software . . . . . . . . . . . . . . . . . . . . . . . 172.5 Summary . . . . . . . . . . . . . . . . . . . . . . . . . . . . . . . . . . . . . 18
3 System Architecture 203.1 Building as a System . . . . . . . . . . . . . . . . . . . . . . . . . . . . . . . 203.2 System Architecture Overview . . . . . . . . . . . . . . . . . . . . . . . . . . 23
4 Sensing and Measurement 274.1 Plug-load Energy Monitoring and Control . . . . . . . . . . . . . . . . . . . 28
4.1.1 Problem Overview . . . . . . . . . . . . . . . . . . . . . . . . . . . . 28
iii
4.1.2 ACme Hardware Design . . . . . . . . . . . . . . . . . . . . . . . . . 294.1.3 Embedded Software . . . . . . . . . . . . . . . . . . . . . . . . . . . . 374.1.4 Evaluation . . . . . . . . . . . . . . . . . . . . . . . . . . . . . . . . . 384.1.5 Micro Benchmarking . . . . . . . . . . . . . . . . . . . . . . . . . . . 394.1.6 Privacy Implications . . . . . . . . . . . . . . . . . . . . . . . . . . . 424.1.7 Enabled Research . . . . . . . . . . . . . . . . . . . . . . . . . . . . . 42
4.2 Multi-modal Sensing . . . . . . . . . . . . . . . . . . . . . . . . . . . . . . . 434.3 Summary . . . . . . . . . . . . . . . . . . . . . . . . . . . . . . . . . . . . . 46
5 Data Delivery and Representation 475.1 Networking . . . . . . . . . . . . . . . . . . . . . . . . . . . . . . . . . . . . 48
5.1.1 Routing . . . . . . . . . . . . . . . . . . . . . . . . . . . . . . . . . . 485.1.2 Edge Router . . . . . . . . . . . . . . . . . . . . . . . . . . . . . . . . 495.1.3 Transport . . . . . . . . . . . . . . . . . . . . . . . . . . . . . . . . . 495.1.4 Network Performance . . . . . . . . . . . . . . . . . . . . . . . . . . . 50
5.2 Uniform Representation of Physical Data . . . . . . . . . . . . . . . . . . . . 515.2.1 Design Considerations . . . . . . . . . . . . . . . . . . . . . . . . . . 525.2.2 ACme sMAP Service . . . . . . . . . . . . . . . . . . . . . . . . . . . 53
5.3 Summary . . . . . . . . . . . . . . . . . . . . . . . . . . . . . . . . . . . . . 56
6 Applications and Services 576.1 ACme Application . . . . . . . . . . . . . . . . . . . . . . . . . . . . . . . . 576.2 Database and Metadata . . . . . . . . . . . . . . . . . . . . . . . . . . . . . 586.3 Summary . . . . . . . . . . . . . . . . . . . . . . . . . . . . . . . . . . . . . 60
7 Analysis and Modeling 617.1 Structure of Energy Flows . . . . . . . . . . . . . . . . . . . . . . . . . . . . 617.2 Modeling and Disaggregation . . . . . . . . . . . . . . . . . . . . . . . . . . 63
7.2.1 Additivity . . . . . . . . . . . . . . . . . . . . . . . . . . . . . . . . . 637.2.2 Multi-resolution . . . . . . . . . . . . . . . . . . . . . . . . . . . . . . 667.2.3 Empirical Model . . . . . . . . . . . . . . . . . . . . . . . . . . . . . 677.2.4 Appliance Signature Analysis . . . . . . . . . . . . . . . . . . . . . . 68
7.3 Summary . . . . . . . . . . . . . . . . . . . . . . . . . . . . . . . . . . . . . 70
8 Feedback 728.1 Re-aggregation . . . . . . . . . . . . . . . . . . . . . . . . . . . . . . . . . . 72
8.1.1 Functional Re-aggregation . . . . . . . . . . . . . . . . . . . . . . . . 738.1.2 Spatial Re-aggregation . . . . . . . . . . . . . . . . . . . . . . . . . . 748.1.3 Individual re-aggregation . . . . . . . . . . . . . . . . . . . . . . . . . 768.1.4 Electrical Re-aggregation . . . . . . . . . . . . . . . . . . . . . . . . . 79
8.2 Visualization . . . . . . . . . . . . . . . . . . . . . . . . . . . . . . . . . . . 81

iv
8.3 Google PowerMeter . . . . . . . . . . . . . . . . . . . . . . . . . . . . . . . . 848.4 Mobile Applications . . . . . . . . . . . . . . . . . . . . . . . . . . . . . . . . 858.5 Summary . . . . . . . . . . . . . . . . . . . . . . . . . . . . . . . . . . . . . 86
9 RadLab as a Green Building Testbed 889.1 Network . . . . . . . . . . . . . . . . . . . . . . . . . . . . . . . . . . . . . . 889.2 Usage Profiling . . . . . . . . . . . . . . . . . . . . . . . . . . . . . . . . . . 899.3 Deployment Model . . . . . . . . . . . . . . . . . . . . . . . . . . . . . . . . 909.4 Results . . . . . . . . . . . . . . . . . . . . . . . . . . . . . . . . . . . . . . . 919.5 Improvements . . . . . . . . . . . . . . . . . . . . . . . . . . . . . . . . . . . 92
10 Ongoing and Future Research 9710.1 Deployments . . . . . . . . . . . . . . . . . . . . . . . . . . . . . . . . . . . . 9710.2 Building-to-Grid . . . . . . . . . . . . . . . . . . . . . . . . . . . . . . . . . 9910.3 Online Energy-Climate Model . . . . . . . . . . . . . . . . . . . . . . . . . . 10010.4 None-Intrusive Load Monitoring . . . . . . . . . . . . . . . . . . . . . . . . . 101
11 Conclusion 102
Bibliography 105

v
List of Figures
1.1 Aggregate energy usage statistics are insufficient for identifying waste or help-ing to reduce consumption. . . . . . . . . . . . . . . . . . . . . . . . . . . . . 2
1.2 System architecture and application process flow. . . . . . . . . . . . . . . . 3
2.1 Energy end-use flow maps for the commercial buildings. Image source: [29]. . 82.2 Example of an electrical distribution diagram inside a typical commercial
building. . . . . . . . . . . . . . . . . . . . . . . . . . . . . . . . . . . . . . . 92.3 Example of climate plants inside a commercial building. . . . . . . . . . . . . 102.4 SCADA is a supervisory system where a central host controls set-points and
remote terminal units (RTUs) perform local decisions. Image source:[82]. . . 112.5 BroadwinWebAccess HMI displaying air flows parameters inside the computer
science building at Berkeley. . . . . . . . . . . . . . . . . . . . . . . . . . . . 132.6 Evolution of early mote platforms developed at UC Berkeley. Source: [68]. . 162.7 Ultrasound transceiver sensor board for measuring distancing using ultrasonic
time-of-flight (left); SPOT micro-power meter for high-fidelity instrumenta-tion of low power devices at scale (right). . . . . . . . . . . . . . . . . . . . . 17
3.1 Existing buildings are often missing the feedback loop between the electricalload tree and the occupants. . . . . . . . . . . . . . . . . . . . . . . . . . . . 21
3.2 Building as a system, is composed of three subsystems – “human behavior”,“climate HVAC”, and “electrical load tree”. . . . . . . . . . . . . . . . . . . 22
3.3 System architecture and the process flow of the ACme application. . . . . . . 24
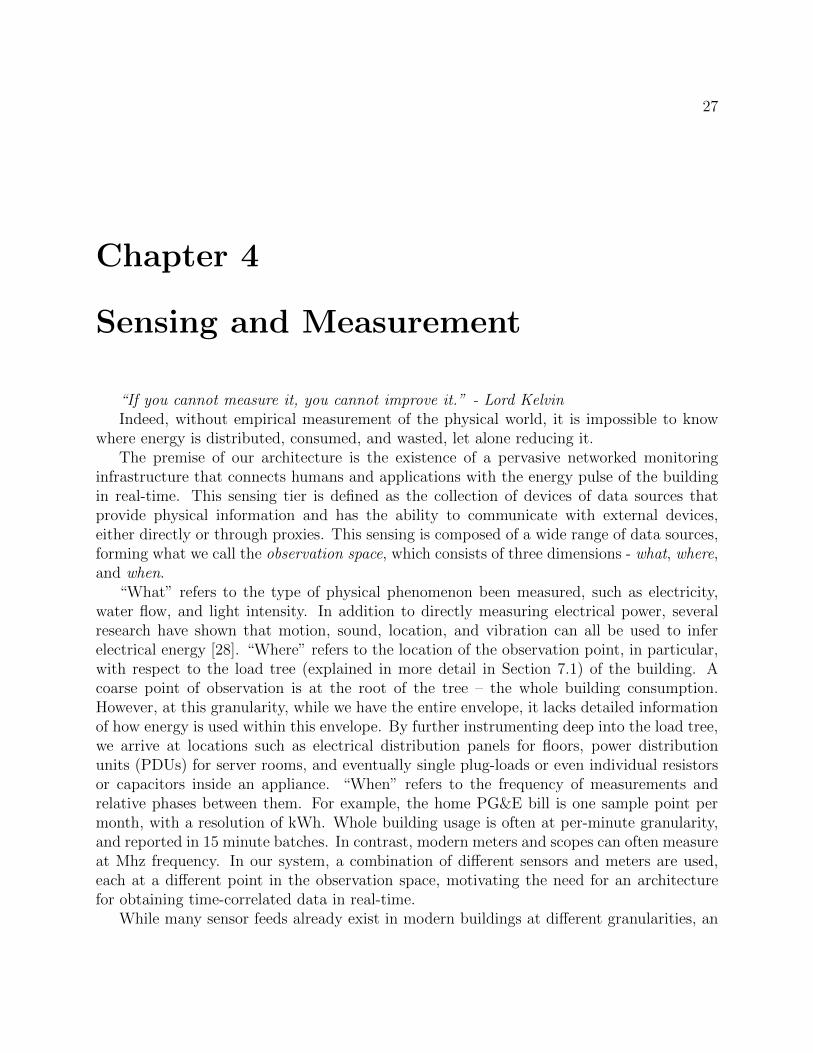
4.1 ACme consists of five primary components: current-to-voltage conversion, en-ergy metering, AC/DC power supply, microcontroller and radio, and solidstate relay. . . . . . . . . . . . . . . . . . . . . . . . . . . . . . . . . . . . . . 29
4.2 ACme-A uses shunt resistor as I-V conversion, direct rectification as AC/DCpower supply, and ADE7753 as the energy metering IC. . . . . . . . . . . . . 30
4.3 ACme-B uses an in-line Hall Effect sensor as I-V conversion, a step-downtransformer followed by a bridge rectifier as the AC/DC power supply, andperforms energy calculation in software using the microcontroller. . . . . . . 31

vi
4.4 Current carrying trace has a minimum width of 120mil and uses polygon fillsas heat sinks. . . . . . . . . . . . . . . . . . . . . . . . . . . . . . . . . . . . 37
4.5 ACmeX2 is more compact and efficient but does not include relay. . . . . . . 384.6 Power trace of a Polycomm teleophone shows that ACme-A is able to resolve
low power appliances down to 40mW. . . . . . . . . . . . . . . . . . . . . . . 404.7 Power trace of a coffee maker shows that ACme-A is able to measure appli-
ances with high power pulses. . . . . . . . . . . . . . . . . . . . . . . . . . . 404.8 ACme reveals interesting characteristics of devices such as a laptop. We can
observe the power states, charging curve, and CPU usage. . . . . . . . . . . 414.9 ACme reveals both the compressor cycles (100W at around 15 minutes inter-
vals) and defrost cycles (450W a few times a day) in a refrigerator. . . . . . 414.10 Figure (A) shows the output of one axis of an accelerometer attached to a
large motor driving air conditioning equipment over an hour. Figure (B)shows the output of a simple vibration sensor attached to the same motorover the same hour. Each sensor indicates when the motor is operating andallows for real-time estimation of HVAC energy consumption. . . . . . . . . 44
4.11 Only 4 light sensors are needed to cover 26 light bulbs since they are controlledtogether by 4 sets of switches and motion sensors. . . . . . . . . . . . . . . . 45
4.12 Light sensor readings can be easily converted to power using thresholding. . 45
5.1 Sensor nodes are connected to the Internet through IP routers. ACme nodesare the sensors and edge routers are Linux-class devices. . . . . . . . . . . . 49
5.2 This edge router integrates a Meraki Mini and Epic Mote using a customcarrier board and routes IP packets between the sensor network and LAN. . 50
5.3 A snapshot of the network topology. . . . . . . . . . . . . . . . . . . . . . . . 515.4 Various meters and sensors that measure physical data, but communicate
through different protocols and over different physical mediums. For exam-ple, the Dent panel meter uses Modbus protocol over RS485 while ACmemeters use TCP and UDP over IPv6 on wireless radios, even-though both arecommunicating the same type of information - quantity of energy. . . . . . . 52
5.5 IPv6-based sensors such as ACme’s implement sMAP directly while legacydevices such as Modbus based branch meters implement sMAP via proxies.Applications interface with any metering resource uniformly via sMAP. In thisexample, a visualization application is used to graph real-time energy readingsfrom both ACme’s and from branch meters. . . . . . . . . . . . . . . . . . . 53
5.6 A fragment of the sMAP RESTful interface implemented by ACme. . . . . . 545.7 A typical ACme sMAP resource URI. . . . . . . . . . . . . . . . . . . . . . . 545.8 Formatting and parameter resources. . . . . . . . . . . . . . . . . . . . . . . 555.9 Setting up a per-minute periodic report for the reading resource from ACme
326 to a data repository. . . . . . . . . . . . . . . . . . . . . . . . . . . . . . 55

vii
6.1 The ACme application architecture. . . . . . . . . . . . . . . . . . . . . . . . 586.2 Reading from an ACme. . . . . . . . . . . . . . . . . . . . . . . . . . . . . . 596.3 Actuating an ACme. . . . . . . . . . . . . . . . . . . . . . . . . . . . . . . . 60
7.1 Snapshot of a small portion of the load tree in a computer science building.Voltage is stepped down from the building substation into floor-level electricalpanels which in turn distribute power into either AC outlets in the low-voltagecase or lights and major equipments in the high-voltage case. . . . . . . . . . 62
7.2 The power that flows through power strip A is the sum of the power consumedby the laptop, the 24” LCD, and the sub-power-strip. We can calculate thepower at C1 by simply subtracting M2 and M3 from M1. . . . . . . . . . . . 64
7.3 The power profile of a 24” LCD can be calculated by subtracting both thelaptop metered at M2 and the sub-power-strip metered at M3 from the powerstrip A, metered at M1. At 1.5hr, the desktop and two 19” LCDs are turnedon, using an additional 200W seen by M3 and M1 for about 20 minutes. At2.5hr, the laptop was removed from the workspace, reducing M2 to 0W. The24” LCD drops into standby mode after being disconnected from the laptop,drawing around 10W via subtraction. . . . . . . . . . . . . . . . . . . . . . . 65
7.4 Sampling rate top to bottom: 4Hz, minute sampling, hourly sampling. (A)reveals the turn-on transient; (B) reveals the compressor and defrost modesof the refrigerator; and (C) reveals the human influence. . . . . . . . . . . . 66
7.5 Result of calculating an improved empirical model using proportional scalingfrom a measured aggregate. By using upstream power measurements in addi-tion to generic models of appliance behavior by type (“core power models”),models for specific appliances can be augmented to incorporate device-specificmeasurements. Here we look at a 24” LCD, a 17” LCD, and two laptops. . . 68
7.6 Laptop energy consumption disaggregation at the sub-component level. . . . 697.7 Water dispenser daily energy consumption over the same day of the week for
three weeks. Notice the general trend in power consumption in (B) as well asin (C). . . . . . . . . . . . . . . . . . . . . . . . . . . . . . . . . . . . . . . . 70
8.1 A portion of the load tree is decomposed into individual appliances, thenre-aggregated into four functional classes - laptop, desktop, LCD, and light. . 74
8.2 Stacked graph of aggregate power consumption grouped by functional classover a day. . . . . . . . . . . . . . . . . . . . . . . . . . . . . . . . . . . . . . 75
8.3 Spatial re-aggregation of the load tree. Three rooms (Room-A, Room-B, andRoom-C) contain several plug loads (laptop, desktop, LCD screens) and lightfixtures. Directly measuring the energy used by a particular space may not bepossible if power arrives via multiple load trees, like wall outlets and built-inlighting. . . . . . . . . . . . . . . . . . . . . . . . . . . . . . . . . . . . . . . 76

viii
8.4 The spatial energy consumption across several offices in an office building.The empirically measured average power draw of several loads is averagedover space using a square smoothing kernel with rounded corners. This figurehighlights that the occupants in room 487 have a higher average power demandthan those in neighboring offices. . . . . . . . . . . . . . . . . . . . . . . . . 77
8.5 Individual re-aggregation of the load tree. Three building occupants use amix of electrical loads. Some loads, e.g. laptops or desktops, are dedicatedto one user while other loads, e.g. lights or a refrigerator are shared by somesubset of the occupants. Directly measuring an occupant’s fractional usagemay not be possible so approximation techniques are needed. . . . . . . . . . 78
8.6 The distribution of per-occupant average power across a group of nearby oc-cupants. The overall average draw (across all occupants in the monitoredarea) is 132 W. Each bar includes the fractional contribution from the sharedlights and refrigerator (38.5 W), as well as the dedicated contribution fromeach user’s personal loads like laptops, desktop, and monitors. . . . . . . . . 79
8.7 Per-circuit loads in our office deployment. Loads can be migrated within eachgrouping simply by moving to a different socket on the same outlet. This datacould guide a building manager to improve load balancing among circuits. . 80
8.8 A web portal for monitoring of individual energy usages in real-time. . . . . 818.9 A web based visualization displaying the real-time power usages grouped by
appliances types. . . . . . . . . . . . . . . . . . . . . . . . . . . . . . . . . . 828.10 A live Sankey diagram showing the energy flows in the building electrical load
tree. . . . . . . . . . . . . . . . . . . . . . . . . . . . . . . . . . . . . . . . . 838.11 Google PowerMeter displaying real-time power usage of a refrigerator mea-
sured by an ACme. It provides simple historical statistics and future usagepredictions. . . . . . . . . . . . . . . . . . . . . . . . . . . . . . . . . . . . . 85
8.12 An Android application that scans a bar code associated with an appliancemonitored by an ACme and graphs its power consumption in real-time. . . . 86
9.1 Location and connectivity graph of AC meters and light sensors. There are atotal of 38 AC meters, 28 of which are spatially distinct, and 6 light sensors.The vibration sensor, not shown here, is attached to the HVAC infrastructurein the basement of the building. . . . . . . . . . . . . . . . . . . . . . . . . . 89
9.2 The type and number of plug-loads currently monitored using ACme nodes. 909.3 Power traces from various appliances under measurement. . . . . . . . . . . . 919.4 Aggregated energy usage by appliance type normalized by number of appli-
ances in an enclosed environment. . . . . . . . . . . . . . . . . . . . . . . . 939.5 Aggregate trace of measured LCDs in the laboratory over a four-week period.
The white rectangles represent the work week, shaded vertical strips highlightthe weekends, and the solid horizontal line represents the average consumptionover the entire duration. . . . . . . . . . . . . . . . . . . . . . . . . . . . . . 94
ix
9.6 This is a trace of a student’s desktop machine running Windows XP before andafter installing power management software. The machine was reconfiguredon this day to drop into full sleep mode after 15 minutes of idleness, reducingthe idle power from 119.0 Watts to 2.4 Watts. . . . . . . . . . . . . . . . . . 95
9.7 Estimated saving of the laboratory energy consumption if all of the desktopsincorporated energy management software. . . . . . . . . . . . . . . . . . . . 96
10.1 ACme deployments and related research. . . . . . . . . . . . . . . . . . . . . 9810.2 Using historical load traces and simulated supply, the LoCal simulator predicts
future load and performs trades on a virtual market consisting of two typesof goods: base power and variable power. The right side of the graph showshow the prediction (green is purchased base power and blue is variable power)matches the actual load (shown in red). . . . . . . . . . . . . . . . . . . . . . 99
10.3 An online energy-climate model that combines real-time sensor feeds witharchitectural model of the building, enabling dynamic optimizing of energyand comfort. . . . . . . . . . . . . . . . . . . . . . . . . . . . . . . . . . . . . 100

x
List of Tables
4.1 Properties of ACme-A and ACme-B. . . . . . . . . . . . . . . . . . . . . . . 344.2 ACme node interface . . . . . . . . . . . . . . . . . . . . . . . . . . . . . . . 384.3 Summary of ACme-A . . . . . . . . . . . . . . . . . . . . . . . . . . . . . . . 394.4 Summary of ACmeX2 . . . . . . . . . . . . . . . . . . . . . . . . . . . . . . 39
8.1 Survey of densely instrumented region, depicted in Figure 4.11. . . . . . . . . 738.2 Comparison of sMAP and Google PowerMeter . . . . . . . . . . . . . . . . . 84
9.1 Work-week average aggregate power for measured LCDs, along with week-by-week percentage changes. . . . . . . . . . . . . . . . . . . . . . . . . . . . . . 93

xi
Acknowledgments
With profound gratitude, I want to thank my advisor and mentor David Culler, who hasguided me each step of the way, and taught me what it means to be a researcher. I havegrown significantly since I met David, both personally and academically, and I am extremelygrateful for his guidance.
I want to thank Professor Randy Katz, Professor Scott Shenker, Professor Seth Sanders,Professor Ion Stoica, Professor Kris Pister, and Professor Shankar Sastry for their adviseand support throughout various stages of my academic career.
I want to thank Kamin Whitehouse, Alec Woo, Joseph Polastre, Sarah Bergbreiter, CorySharp, Philip Levis, and Robert Szewczyk, who mentored me during my undergraduate andearly graduate years, and introduced me to the field of research.
And I want to thank my collaborators, colleagues, and friends, who have provided count-less technical, intellectual, and personal help with various aspects of my work. These include,but are not limited to, Stephen Dawson-Haggerty, Prabal Dutta, Jay Taneja, Jorge Ortiz,Jaein Jeong, Arsalan Tavakoli, Ken Lutz, Mike He, Evan Reutzel, Jeff Hsu, Minh Van Ly,Zhangxi Tan, Albert Goto, Andrew Krioukov, Prashanth Mohan, Scott McNally, DavidZats, Gilman Tolle, Jonathan Hui, Feng Zhao, Wendy Qiu, and of course, my dissertationcommittee.
This work was funded in part by the National Science Foundation Graduate Fellowship,the NSF LoCal grant, the NSF Action Webs grant, the NSF Lawrence Berkeley NationalLaboratory MELS grant, and the NSF CRI grant.

1
Chapter 1
Introduction
Our insatiable thirst for energy is the societal problem of our age. Electricity usagein residential and commercial buildings consists of 72% of the entire US electrical powerexpenditure [78], and a third of that is wasted [77]. In addition, because electricity isgenerated from fossil fuels, it represents a significant portion of the carbon footprint ofthe occupants. As a comparison, a typical Pacific Gas & Electric (PG&E) customer usesabout 540kWh of electricity per month, while the Computer Science Division building at UCBerkeley consumes approximately 12MWh of electricity per day.
Systems researchers have a great deal to offer to solving this problem. With the rapidadvancement in power-efficient and inexpensive micro-controllers, sensors and actuators arebecoming increasingly ubiquitous and connected. Even the simplest sensor costing a fewdollars can easily be equipped with a network interface and a CPU capable of running asmall operating system. The past decade of wireless sensor network research has shownus the potential of intelligent networks of connected devices. We are now in a position toutilize these advancements in technology and the lessons learned from sensornets research,and apply them in commercial buildings.
Efforts to bring wireless monitoring to buildings have emerged in the past few years inboth academia and industry. Most of them consist of feeding metering data back to theuser, relying on the users’ ability to interpret the data and modify their behavior. However,we have yet to take a systems approach to really understand the underlying phenomenonwe want to observe and answer the basic questions of what to measure, where to measure,when to measure, and how to make sense of the data. Only then, can we begin to answerthe key questions: where does energy go in a building, and how to create more actionablesolutions for reduction? This dissertation introduces an architecture and implementation of abuilding energy monitoring system, that (1) orchestrates a network of sensors and actuatorsin real-time, (2) analyzes multi-modal sensor data, and (3) creates models and actionablevisualizations based on the fundamental structure of the building.
CHAPTER 1. INTRODUCTION 2
1.1 Problem Statement
What percent is plug-load
What percent is wasted by idle PCs at night?
What’s the effect of server load on energy?
What’s the effect of turning off a device?
What caused the spike at 7:00AM?
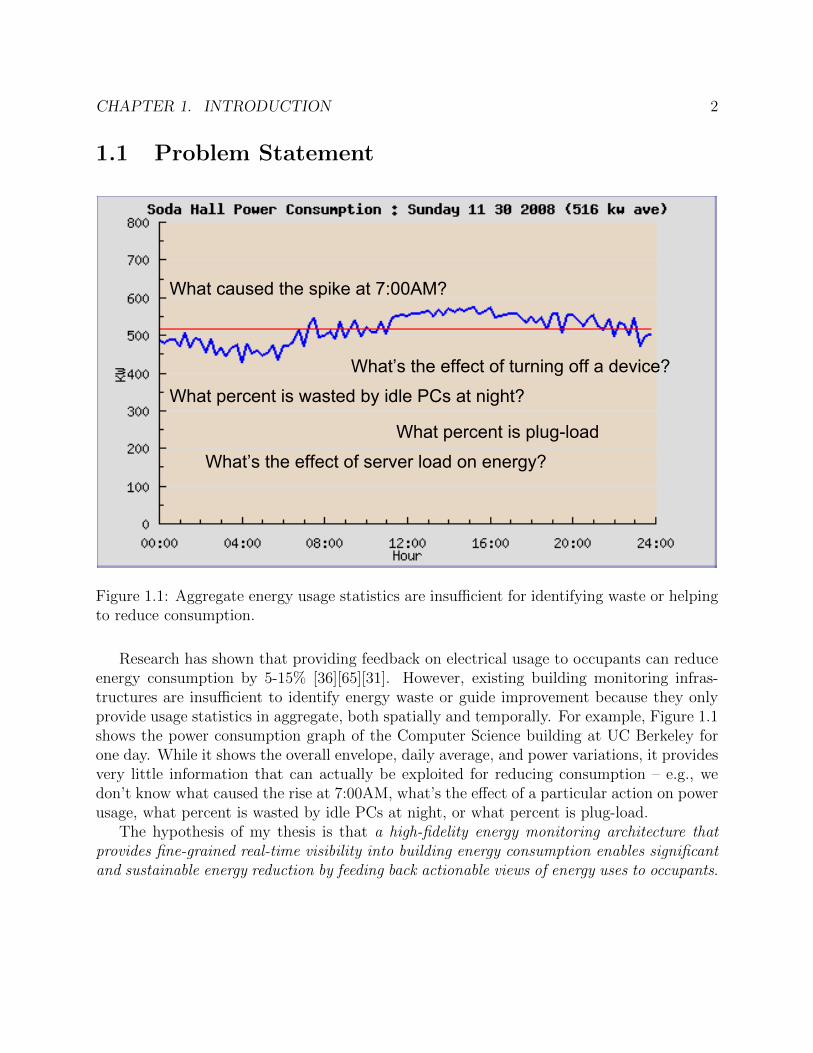
Figure 1.1: Aggregate energy usage statistics are insufficient for identifying waste or helpingto reduce consumption.
Research has shown that providing feedback on electrical usage to occupants can reduceenergy consumption by 5-15% [36][65][31]. However, existing building monitoring infras-tructures are insufficient to identify energy waste or guide improvement because they onlyprovide usage statistics in aggregate, both spatially and temporally. For example, Figure 1.1shows the power consumption graph of the Computer Science building at UC Berkeley forone day. While it shows the overall envelope, daily average, and power variations, it providesvery little information that can actually be exploited for reducing consumption – e.g., wedon’t know what caused the rise at 7:00AM, what’s the effect of a particular action on powerusage, what percent is wasted by idle PCs at night, or what percent is plug-load.
The hypothesis of my thesis is that a high-fidelity energy monitoring architecture thatprovides fine-grained real-time visibility into building energy consumption enables significantand sustainable energy reduction by feeding back actionable views of energy uses to occupants.
CHAPTER 1. INTRODUCTION 3
1.2 Architecture Overview
!"#$%&%$'()"*+%,-./0/11%2/13%+/4)(.5%
2(6
781%
"/.1(9:0%;//67:<5% 2(6/0-9=%
>(9?98(81%>(@@-11-(9-9=%
A/78==-9=%
*""
'!>*
B!C+D%
sMAP Interface
E-18:0-F:?(9%*<48:?(9%:96%
>(94.(0%".(GH%
DIJE
!>ID%
A*B*
%AI'!EIJ
K%*+A%
JI"J
IDI+
B*B!C+%
DI+D!+L%
System Architecture
MBB"&!"%
".(GH%
".(GH%
Application Process Flow
IG4/.9:0%A:4:%
".(GH%
LN!&DO
'%
D>*A*% ":9/0&>-.<8-4%
'-=34%"08=P0(:6%
E-7.:?(9% "08=P0(:6%
".(GH%
JDPQRS%
2:-91%
*9:0HF/%!%2(6/0%!%A-1:==./=:4/%
J/P:==./=:4/%!%E-18:0-F/%!%;//67:<5%
'(<:?(9% *843/9?<:?(9% A:4:7:1/%
'(:6%B.//% D/91-9=%
*>@/%*TT0-<:?(9%
MBB"&B>"%
UDC+&V2'%
12*"%
!"%
NA"%
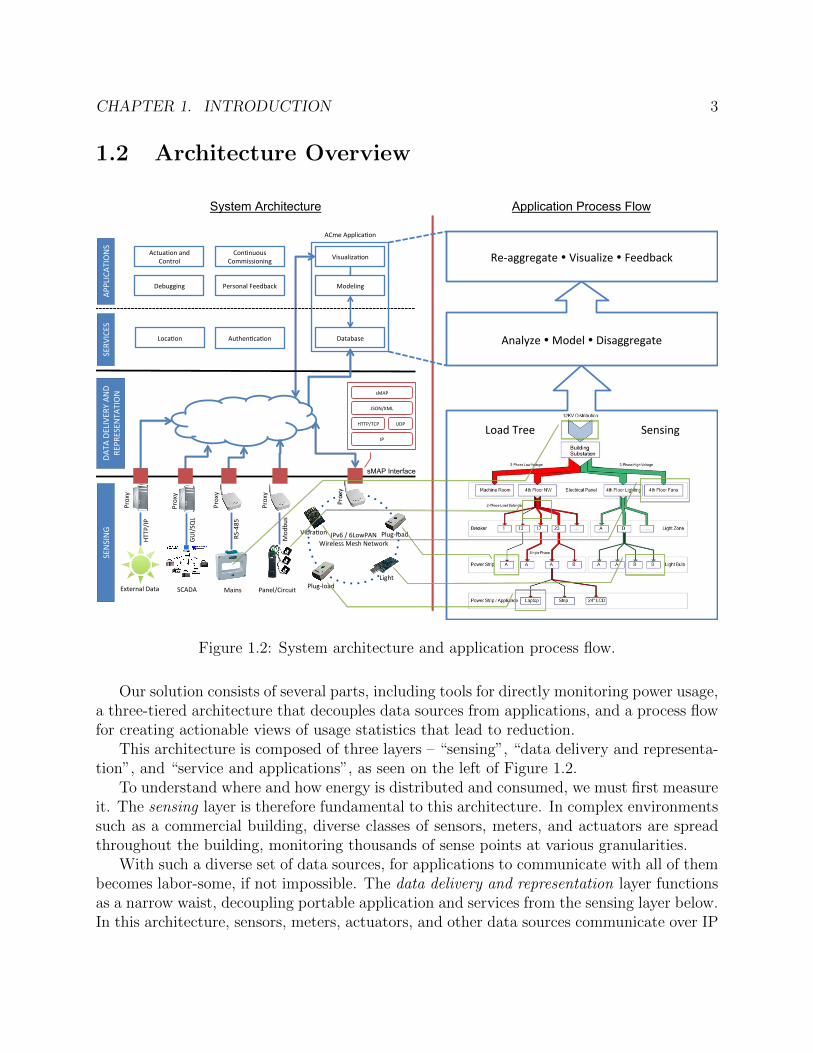
Figure 1.2: System architecture and application process flow.
Our solution consists of several parts, including tools for directly monitoring power usage,a three-tiered architecture that decouples data sources from applications, and a process flowfor creating actionable views of usage statistics that lead to reduction.
This architecture is composed of three layers – “sensing”, “data delivery and representa-tion”, and “service and applications”, as seen on the left of Figure 1.2.
To understand where and how energy is distributed and consumed, we must first measureit. The sensing layer is therefore fundamental to this architecture. In complex environmentssuch as a commercial building, diverse classes of sensors, meters, and actuators are spreadthroughout the building, monitoring thousands of sense points at various granularities.
With such a diverse set of data sources, for applications to communicate with all of thembecomes labor-some, if not impossible. The data delivery and representation layer functionsas a narrow waist, decoupling portable application and services from the sensing layer below.In this architecture, sensors, meters, actuators, and other data sources communicate over IP

CHAPTER 1. INTRODUCTION 4
and use a standard application profile for uniform access.Sitting on top of this uniform data representation layer are portable services and applica-
tions. Different applications can utilize the data layer and service layer below in innovativeways, without being hampered by the low-level details of disparate monitoring instrumentsand protocols.
Alongside this architecture, we also propose an application process flow, shown at theright side of Figure 1.2, for creating models using data obtained through this architecture, andgenerating actionable feedback that leads to energy reduction. We begin by understandingthe underlying electrical distribution graph of the building, a tree-shaped network of electricalflow (load tree). Ideally we would like to instrument every point in load tree; however, this istypically cost prohibitive. Instead, we place appropriate types of sensors at strategic pointsin the load tree and create models for the most important and/or prevalent loads. Thesemodels of loads, such as appliances, lights, and HVAC systems, allow us to infer consumptionof unmetered loads. Once we disaggregate power usage to the end-uses, we then re-aggregateaccording to different classifications, such as function, location, and ownership. Finally wefeed back this data to the occupants and building managers via various types of visualizationsfor reduction.
The ultimate validation of this work would be a significant reduction in building-wideenergy usage. Ideally we would like to conduct a user study at scale and observe the resultingimprovements. However, while our architecture is designed to support a wide range ofbuilding applications for this purpose, it is impractical to conduct a comprehensive behaviorstudy. Instead, we evaluate our solutions based on the following metrics and criteria thatare more constrained:
• How reliable and accessible is the building energy data provided by this architecture?
• How accurately does the power meter resolve power variations of appliances?
• How easy is it to instrument a large number of plug-loads and how accessible isthe energy data?
• How scalable is this architecture with respect to sensors and meters?
• To what extent can existing and legacy building instruments be incorporated inthis system?
• How much effort does it take for third party developers to develop portable buildingapplications using this architecture?
• How interoperable is this architecture with external devices and applications?
• How expressive or restrictive is the interface for physical information?
• How cross-platform are applications built on top of this architecture?
• How actionable are the visualizations in facilitating energy saving?

CHAPTER 1. INTRODUCTION 5
• How much additional coverage can we gain by analyzing and modeling raw sensingdata?
• What is the range of visualizations that can be generated following the proposedprocess flow?
1.3 Roadmap
In Chapter 2, we begin by understanding how energy is distributed inside a building inits various shapes and forms, followed by an ontology of existing building monitoring andcontrol solutions. We take a critical look at some sensor network platforms and systemsrelevant to buildings, and present a survey of existing building energy modeling techniquesand software.
In Chapter 3, we treat the building as a system to better understand the inputs andoutputs of this large complex system with multiple sub-systems. Next, we present the designconsiderations and overview of a high-fidelity energy monitoring and feedback architecturefor buildings, consisting of three layers – “sensing”, “data delivery and representation”, and“applications and services”. The subsequent chapters describe each layer of this architecturein more detail, grounded by the design, implementation, and evaluation of a system basedon this architecture.
In Chapter 4, we explore in more depth the first layer in our architecture – sensing. Wefirst describe the design, implementation, and evaluation of ACme – a wireless IPv6-basedplug-load meter we designed to measure electrical usages of appliances at the plug-loadlevel. We then explore other types of sensors, such as light sensors and vibration sensors, forinferring electrical consumption when direct measurement is inconvenient or costly.
In Chapter 5, we first describe an IPv6-based ad-hoc network that provides wireless con-nectivity to ACme nodes. We then describe a simple RESTful web-service-based approach,called sMAP, that uniformly represents physical data for a diverse class of sensors, meters,and actuators. sMAP provides a horizontal layering, decoupling the physical sensors, meters,and actuators from applications above.
In Chapter 6, we use the data acquisition portion of the ACme application as a demonstra-tion of the RESTful interactions between the sensing layer and the services and applicationslayer, similar to any N-tier application. We defer the data analysis, modeling, and feedbackof this data in Chapter 7 and Chapter 8.
In Chapter 7, we describe strategies that use multi-modal data collected throughout ournetwork and the structure of the load tree to construct appliance electricity consumptionmodels, enabling us to infer consumption of unmetered devices.
In Chapter 8, we demonstrate that by re-aggregating energy data according to differentclassifications, such as function, location, and ownership, we can reveal useful informationand provide better feedback for reduction. Next, we show various ways for visualizing energydata, including an online web portal for tracking individual loads, a Google PowerMeter

CHAPTER 1. INTRODUCTION 6
application that interfaces with our system for tracking personal energy footprint, and anAndroid application that visualizes and controls ACme loads directly on mobile phones.
In Chapter 9, we describe a deployment based on our architecture, consisting of 50ACme’s, a few light sensors and a vibration sensor. We show that using this system, we areable to visualize high-fidelity energy usage in real-time and reduce overall consumption.
In Chapter 10, we describe some of the ongoing deployments and future research extend-ing from this thesis.
In Chapter 11, we conclude with key results and contributions.

7
Chapter 2
Background
Commercial buildings have evolved in the past few decades into complicated systems withthousands of sensors and actuators that continuously monitor and control the micro-climateinside the building. Building monitoring, control, and management systems have becomea multi-billion dollar industry over the years. Electronically-controlled and computerizedbuilding management systems became popular as early as the late 1960’s and early 1970’s,with many well known companies such as Honeywell and Siemens. The focus of these com-mercial systems has been on providing comfort and safety to the occupants. As energy isbecoming more scarce and expensive, there is renewed interest in saving energy in buildings.Additionally, we are starting to see many opportunities where wirelessly networked devicescan help us better understand and management building energy consumption. In this chap-ter, we outline key results and places for improvements. We begin by understanding howenergy is distributed inside a building in its various shapes and forms in Section 2.1, followedby an ontology of existing building monitoring and control solutions in Section 2.2. We takea critical look at some sensor network platforms and systems that are relevant to buildingsin Section 2.3, followed by a survey of existing building energy modeling techniques andsoftware in Section 2.4.
2.1 Energy Flows in Buildings
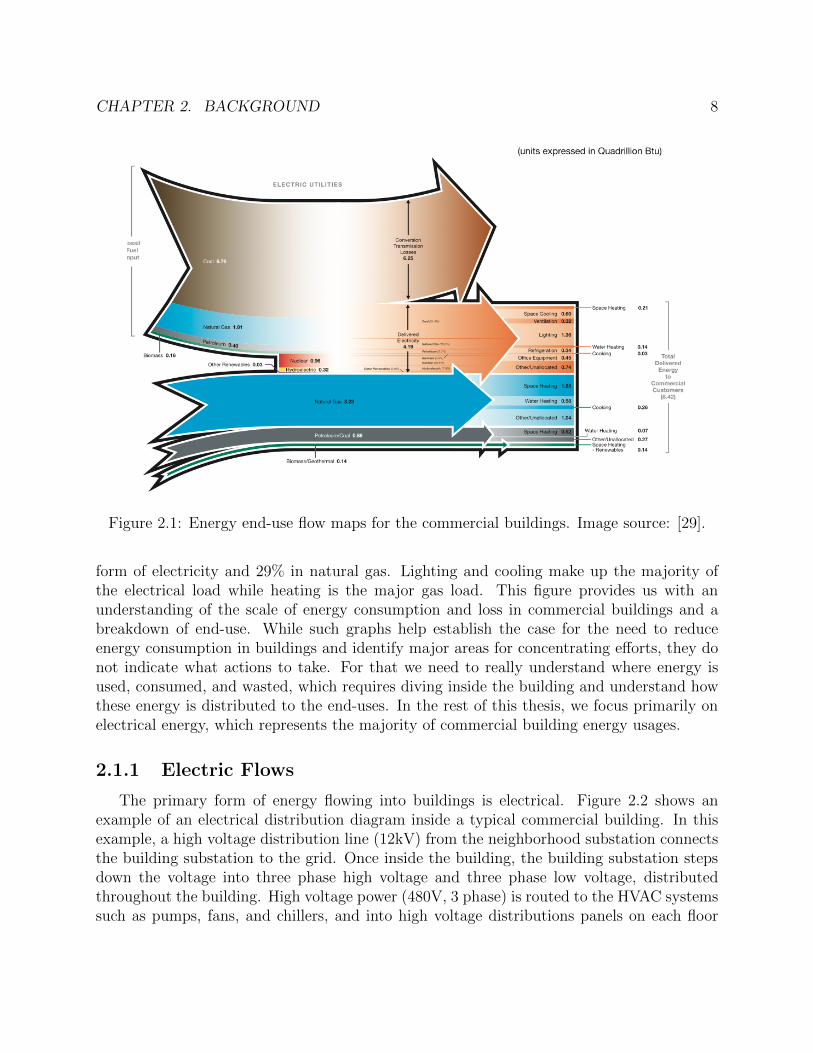
Energy flows into buildings primarily in the forms of electricity and natural gas. TheUS Environmental Protection Agency (EPA) and US Department of Energy (DOE) havecommissioned multiple studies to trace the end use of energy in building back to the originalenergy sources, as shown in Figure 2.1, taken from the 2006 PNNL study [29]. Accordingto this study, commercial buildings consume 8.42 quadrillion btu (abbreviated as quadshereafter) of energy in end-use, 14.51 quads in natural resources (including a small amountof nuclear and hydroelectric), and loses 6.25 quads during conversion and transmission ofelectricity. Of the 14.51 quads of raw natural resources consumed, roughly 62% is in the
CHAPTER 2. BACKGROUND 8
Figure 2.1: Energy end-use flow maps for the commercial buildings. Image source: [29].
form of electricity and 29% in natural gas. Lighting and cooling make up the majority ofthe electrical load while heating is the major gas load. This figure provides us with anunderstanding of the scale of energy consumption and loss in commercial buildings and abreakdown of end-use. While such graphs help establish the case for the need to reduceenergy consumption in buildings and identify major areas for concentrating efforts, they donot indicate what actions to take. For that we need to really understand where energy isused, consumed, and wasted, which requires diving inside the building and understand howthese energy is distributed to the end-uses. In the rest of this thesis, we focus primarily onelectrical energy, which represents the majority of commercial building energy usages.
2.1.1 Electric Flows
The primary form of energy flowing into buildings is electrical. Figure 2.2 shows anexample of an electrical distribution diagram inside a typical commercial building. In thisexample, a high voltage distribution line (12kV) from the neighborhood substation connectsthe building substation to the grid. Once inside the building, the building substation stepsdown the voltage into three phase high voltage and three phase low voltage, distributedthroughout the building. High voltage power (480V, 3 phase) is routed to the HVAC systemssuch as pumps, fans, and chillers, and into high voltage distributions panels on each floor

CHAPTER 2. BACKGROUND 9
LP2E 225 LP2D
225
LP2E 225
12 kV Building
Substation
1200
A 2
77/4
80 3
pha
se h
igh
volta
ge
2500
A 1
20/2
08 3
pha
se lo
w v
olta
ge
HP1 200A Max
HP2 200A Max
HP3 200A Max
HP4 400A Max
HP5 200A Max
Chillers
Fans
Pumps
LP2E 225
LP2D 225
LP2C 225
LP1A 400
LP2A 800
LP3A 400
LP4A 400
LP5A 400
LP1B 400
LP2B 225
LP2G 225
LP2F 225
LP2D 225 LP2C
225 LP3B
225
LP2E 225
LP2D 225 LP2C
225 LP4B
225
LP2C 225
LP5B 225
LP2J 225
LP2I 225
LP2H 225
LP2G 225
LP2F 225
LP2J 225
LP2I 225
LP2H 225
LP2G 225
LP2F 225
LP2J 225
LP2I 225
LP2H 225
LP2G 225
LP2F 225
High Voltage Distribution
HV
AC
Li
ghtin
g an
d H
igh-
volta
ge E
quip
men
ts
Offices, Cubicles, Low-voltage Outlets
HP = high voltage panel LP = low voltage panel 42 circuits per panel
Figure 2.2: Example of an electrical distribution diagram inside a typical commercialbuilding.
(labeled as HPx) to power lighting loads on the ceilings. Certain equipments also requirehigh voltage, such as elevators. On the right side of this diagram, low voltage power isdistributed throughout the building into low voltage panels (LPxx) on each floor. One flooroften have multiple panels, either directed off the substation transformer or from anotherpanel. Each panel usually contains 42 (single phase) circuits, which distributes power into allthe low voltage loads spread throughout the building, often in the form of electrical outlets.Because the electrical distribution diagram can usually be viewed as an acyclic graph wherea parent node is connected to multiple children nodes, as in the case of this example, it isalso referred to as the load tree.
The load tree is the starting point for monitoring energy usage with high-fidelity and inreal-time, and is central to our architecture. We can readily see that the load tree is a com-plicated structure with thousands of loads attached to its leaves. While directly measuringeach load provides us with the most detailed view, it is impractical and costly. We oftengive up this level of fidelity by measuring at some aggregation point, such as at the panelsor even at the building level, trading fidelity with coverage. We describe this trade-off andexplore ways to improve fidelity in more detail in Chapter 7.

CHAPTER 2. BACKGROUND 10
Chillers
Cooling Towers
Fans
!"#$%&
Fans
'())*&+&
'())*&,&
'())*&-&
'())*&.&
'())*&/&A
ir V
entil
atio
n an
d C
oolin
g 0'1&
0'1&
0'1&
0'1&
0'1&
Special C
ooling Loads (e.g. heavy m
achinery, data center, etc.)
variable frequency drive fans
localized reheating
0'1&
Figure 2.3: Example of climate plants inside a commercial building.
2.1.2 Climate Plants
One of the major loads on the electrical load tree is to service the climate plant, whichincludes chillers, pumps, air conditioning units, air handling units, fans, etc., as shown inFigure 2.3. In this example building, chillers cool the air using chilled water; cold air isdelivered throughout the building with fans. The amount of cooling is controlled by ventsand variable frequency drives (VFD), and is reheated locally where needed. This is nota very efficient HVAC system because the operating point of the air conditioning units isdetermined by the needs of the worst heat load. This example shows that there are manyopportunities for savings in the HVAC system, if we are able to observe and control it.
2.2 Current Building Energy Monitoring and Manage-ment Solutions
Various forms of building energy monitoring and management solutions have emergedover the years. The set of solutions and products range from whole-building management

CHAPTER 2. BACKGROUND 11
systems that cost millions of dollars to single plug-load meters that can be found in localstores for tens of dollars, and from established companies to university research projects,or even hobbyists. In this section, we survey some of the prominent works and products inthis area, and analyze their advantages and drawbacks with respect to what we need in amonitoring and feedback system for reducing energy consumption.
2.2.1 Building Management Systems
Figure 2.4: SCADA is a supervisory system where a central host controls set-points andremote terminal units (RTUs) perform local decisions. Image source:[82].
Computer-aided building management systems, such as Building Management System(BMS) [80] and Supervisory Control and Data Acquisition (SCADA) [82], are widely usedtoday in commercial buildings to control physical processes. BMS is a software-hardwaresystem often used in large buildings to controls and monitors the buildings mechanical andelectrical equipment. Similarly, SCADA is a supervisory system where a central host controlsset-points and remote terminal units (RTUs) perform local decisions, as shown in Figure 2.4.

CHAPTER 2. BACKGROUND 12
BMS and SCADA are similar in architecture, and both have their respective ecosystemsof hardware and software vendors [12][18][4][5][17], and a mixture of open protocols andproprietary protocols at various levels in the stack.
For example, BACnet [72] is an ISO standard protocol for communication widely used inBMS systems. BACnet defines a number of services used to communicate between buildingmonitoring and control devices. It defines a set of services used for device and object discov-ery, including I-am, who-has, I-have, and etc. It also defines services for data sharing suchas read-property and write-property, which operate on a set of 30 objects describing varioussensor readings and parameters. BACnet further defines and communicates over a num-ber of link layers, including ARCNET, Ethernet, BACnet/IP, Point-To-Point over RS-232,Master-Slave/Token-Passing over RS-485, and LonTalk.
Modbus [75] is a serial communication protocol often used to connect a supervisory com-puter with a RTU in SCADA systems. Amoung different Modbus versions, Modbus RTUis most common, and uses a compact binary representation of the data. Modbus defines apayload format for reading and writing virtual device “registers,” and is typically runningdirectly on a link-layer such as RS-485 serial link or Ethernet. Messages are framed and sep-arated by idle periods. Each frame consists of start/address/function/data/CRC check/end.
For the rest of this chapter, we focus on SCADA since it is used in many buildings atUC Berkeley and representative of commonly used building management systems.
The SCADA architecture reduces the complexity of RTUs local to the physical sensorsand actuators and minimizes communication overhead. It is a good solution in the age whencomputation and network bandwidth are expensive. However, it also has its drawbacks as aresult. In addition, SCADA is climate-centric and is designed to optimize for comfort, notenergy consumption. As a result, SCADA is not well suited for identifying energy savingsor inefficiencies. We identify some of the problems with SCADA below:
• The main control loop in a SCADA system, and the only part involving humans, isthrough the Human-Computer-Interface (HMI), where the operator or building man-ager sets parameters and set-points. This is a system where the occupants, the primaryload to the building, are not in the control loop except through thermostats. This sys-tem does not model the building according to the load tree, but instead focuses onlocal thermal loops. It is comfort-centric instead of energy centric.
• Sensors and actuators (RTUs) are tightly integrated inside vertical stovepipe solutions,communicating using legacy protocols such as MODBUS [75], and without an openinterface for external communication. While some newer ones use SONET [74] andSDH [73] or even open protocols such as IP, the fundamental design remains the same– distributed RTUs communicate with a supervisory host via simple set-points, anddata is not made available outside of the local SCADA system. This design approachprevents data from being consumed programmatically and impedes the proliferationof portable building applications.

CHAPTER 2. BACKGROUND 13
Figure 2.5: Broadwin WebAccess HMI displaying air flows parameters inside the computerscience building at Berkeley.
• Often the only interface exported by SCADA is the HMI, which is often GUI based.For example, Figure 2.5 is a web-based HMI by Broadwin [4] SCADA system to displaythe air flows in the computer science building at Berkeley. While GUI is the right levelof abstraction for humans, the information bandwidth is severely limited and responsetime is very slow; it is inadequate as an interface for other programs. Although datais available from a database, there is no easy way to directly communicate with theunderlying sensors and actuators in real-time.
2.2.2 Plug-load Monitoring
With the recent increase in awareness of energy conservation, several commercial productshave appeared on the market which measure single outlet energy consumption, commonly
CHAPTER 2. BACKGROUND 14
referred to as plug-load meters [13]. These are helpful for point measurements, but stillrequire manual measurement. Such an approach does not address the deployment challengesat scale. At the same time, there has been a tremendous amount of research and industrialeffort in recent years that has made significant strides toward providing greater visibility.The MIT Plug [59] power meter platform provides high-fidelity apparent power measure-ments, which is useful for profiling a load over short and long time scales. Multi-modalsensing has also been explored in the literature [28]. In addition, industries have invested asignificant amount of work towards improving building energy monitoring. Several startups,such as Tendril [21], Greenbox [8], and EnergyHub [9], have introduced ZigBee Home Profile-based wireless energy monitoring solutions. These products take a bottom-up approach byproviding detailed power measurements of selected individual loads. While this approachis useful in observing a few loads at high fidelity, it is neither practical nor cost-effectivewhen full coverage of tens or hundreds of appliances is desired. The area of wireless sensornetworks has also made substantial progress in this application space. For example, Sen-tilla [19] offers a data center energy monitoring solution that uses wireless plug-load metersand interoperates with other types of sensors. Arch Rock [3] offers a sub-monitoring solutionfor commercial buildings that uses wireless branch level meters. Kim et. al. have devel-oped methods to infer power usage using non-intrusive means such as magnetic sensors [54],and proposed a framework to profile personal resource consumption using a combination ofresource monitoring and activity monitoring [53].
2.2.3 Power Disaggregation
An alternative to extensive sub-metering is to place the sensing instrument at the root ofthe load tree, and use algorithms to increase visibility by disambiguating an aggregated loadfrom the top down. For example, many utility companies have introduced AMI programsthat provide near-real-time visibility into the aggregate energy consumption of homes. Someutilities are partnering with aggregators such as the Google PowerMeter [7] project andthe Microsoft Hohm [15] project to provide a rich visual feedback of user energy usage atthe household level. Some utilities have incorporated “bill disaggregation” web applicationsthat break down users’ monthly bills by disaggregating the different types of loads from theiraggregated energy traces. This type of approach was originally proposed by Hart in 1992 [44].He proposed disaggregating individual electrical loads based on real and reactive powermeasurements. The approach is feasible for a small number of loads that have distinguishabledifferences in power factor. Norford et al. improved this method with event detection tohelp disambiguate appliances with similar reactive and real power signatures. More complexalgorithms have been developed and have shown improvements [56], [40], [69], [27], [57], [58].However, this approach is generally less effective in an office environment in which manyloads are based on switched power supplies, such as desktops, laptops, and LCD screens.Patel has demonstrated techniques for detecting and classifying electrical loads by using asingle plug-in sensor to monitor noises on the power line [66]. This approach is promising

CHAPTER 2. BACKGROUND 15
but requires a training period and not yet feasible in large commercial environments wheresimilar loads are densely located.
2.3 Sensor Networks
Sensor network research has made great progress over the past decade in creating low-power wireless embedded devices, systems, and networking technology, and this technologyhas been applied to numerous studies of real-world environments. Many of these, includinghabitat and climate monitoring demand extremely low energy consumption, long lifetime onbatteries, low sample rates, and reliable ad-hoc networking in wide open spaces. In our work,we focus on a large scale wireless sensor network for a very different kind of application–high fidelity, building-wide, electricity monitoring.
2.3.1 Hardware Platforms
Hardware platforms for wireless sensor networks have evolved from early experimentalhardware used by a few universities to relatively mature products that can be purchasedindividually or as part of larger commercial solutions. However, the basic tradeoff betweenresources and lifetime has not changed for the better half of this decade. Increased hardwareresources such as CPU speed, radio bandwidth, and memory are desirable for various appli-cations that require such resources. Unfortunately, they come at the cost of higher energyconsumption, reduced lifetime, and bigger form factor.
Figure 2.6 shows the evolution of some of the platforms developed at Berkeley. In com-parison to modern computers, this class of devices has very limited resources, on the orderof a few kilobytes of RAM and a few megahertz of processor.
In addition to the main processing and communication unit, mote platforms are usuallyaugmented by application-specific sensing boards that perform the actual sensing function-alities required by the application. For example, on the left of Figure 2.7 is an ultrasoundranging board I developed for the Mica and Mica2 platforms that uses ultrasound transceiversto measure distance [79]. This sensor board is attached to the Mica mote via a 51-pin connec-tor; the CPU on the Mica mote communicates with the ultrasound board via GPIO pins andan I2C bus. The ultrasound transceiver triggers an interrupt when it receives a ultrasoundsignal which is used to calculate distance using time-of-flight measurements. In workingtowards using senor networks for high-fidelity power measurement of low-power devices atscale, I developed the SPOT platform [52], as shown on the right of Figure 2.7. SPOT isa sensor board for the MicaZ platform that uses a combination of analog and digital tech-niques for metering power at the micro-amp resolution and with a dynamic range of 45000:1.This work provided us with valuable experience in designing sensor network platforms formonitoring electrical energy.
However, as wireless sensor networks become more mature and applications more diverse,

CHAPTER 2. BACKGROUND 16
Figure 2.6: Evolution of early mote platforms developed at UC Berkeley. Source: [68].
the tradeoffs are no longer single-dimensional. For example, we are beginning to recognizethe importance of shorting turn-a-round time between hardware cycles, leading to a platformdesign methodology that separates “expert modules” that can be easily recomposed from“carrier boards” that are application specific [38]. In the building monitoring area, we arestarting to see many opportunities for energy scavenging, such as directly powered by ACpower lines instead of replying on batteries. At the same time, we are confronted with newissues such as safety, form factor, and cost. We address some of these new challenges inSection 4.1.
2.3.2 Networking
Because control loops require communication with individual devices, collection-only pro-tocols such as MultiHopLQI or CTP [84, 42] were not viable options. CentRoute [71] pro-vides communication with single routers in the network, but this arouses concerns that itsstatic routing decisions may not be sufficiently agile in poor RF environments. Existingopen and standardized point-to-point routing protocols for wireless networks such as AODVand DYMO are not appropriate for this class of networks due to high control overheads

CHAPTER 2. BACKGROUND 17
Figure 2.7: Ultrasound transceiver sensor board for measuring distancing using ultrasonictime-of-flight (left); SPOT micro-power meter for high-fidelity instrumentation of low powerdevices at scale (right).
or large routing state [67, 30]. While S4 appears promising, actual use of it would requirethe design and implementation of a location service [60]. Proprietary stacks such as TSMP,WirelessHART, and PhyNet [20, 23, 11] also seem worthwhile but are not widely available.
2.4 Building Energy Modeling Software
Building modeling software is widely used by architects, civil engineers, and buildingmanagers both during the construction of buildings and post-construction analysis. Modelsrange from simple architectural schematics with room layouts and building forms to detailedmodeling of glare, glass specifications, and insulation material R-values; and from HVACmodels that help simulating system responses to building loads to whole building energyanalysis on energy costs and carbon footprints.
Current building modeling tools can be divided into the following types [24], each withdifferent uses and target audiences.

CHAPTER 2. BACKGROUND 18
• Daylighting / lighting modeling
• Computational fluid dynamics (CFD)
• Building component analysis
• HVAC analysis
• Building thermal analysis
• Whole building energy simulation programs (BESP)
Among these, whole building energy simulation (BESP) is perhaps most relevant tothis work. There are a number of free and commercially available BESP software, such asDOE2 [6], EnergyPlus [76], TRNSYS [22], Ecotect [25], and Energy10 [63]. DOE2/eQuest iswell validated with research and has a good interface for detailed modeling; EnergyPlus hasmore advanced modeling capabilities with a modular programming structure but currentlylacks a good graphical interface; Ecotect has a reasonable 3D modeling interface with nicegraphical results viewer, and can be exported to powerful simulation tools such as Radianceand EnergyPlus. As energy becomes a focal point in the building CAD communities, severalcompanies have offered energy simulations based on 3D architectural renderings, such asGreen Building Studio [26] offered by Autodesk.
While building energy modeling software is moving in the right direction, it is still missingsome critical components. Current modeling software uses static models with pre-determinedparameters instead of using real-time sensing data as an input to continuously improve mod-eling parameters. They also do not model appliances or end-uses, nor occupants themselves,which have significant impact on the overall building energy. Furthermore, while the sim-ulation results are useful for architects and building managers, they provide little usefulinformation that can be easily acted upon by occupants. Through this work, we hope tocreate an architecture that can enable these types of dynamic simulation of whole buildingenergy in real-time.
2.5 Summary
Buildings are large complex systems comprised of thousands of sensors and actuators,however, it is difficult to access these data sources because existing building management sys-tems hide them behind vertical stacks with legacy and proprietary protocols. Furthermore,because current systems optimize for comfort instead of energy efficiency, little emphasis isplaced on directly instrumenting the electrical load tree. As a result, occupants do not havevisibility into the building’s energy usage, and cannot act to reduce their consumption.
In addition, direct monitoring of plug-load power provides visibility into the end-uses,and is valuable to both occupants and building managers. While there are several com-mercial plug-load meters, they either do not provide adequate measurement fidelity, or are

CHAPTER 2. BACKGROUND 19
not scalable in large deployments. Recent research efforts have shown initial results in in-direct monitoring of appliance power usages, but are not yet feasible in large commercialenvironments.
Finally, while there are a number of building modeling applications that simulate variousaspects of building’s climate and energy characteristics, the fidelity of their models is at theroom granularity. They do not model appliances or end-uses, and therefore do not providesufficient fidelity.

20
Chapter 3
System Architecture
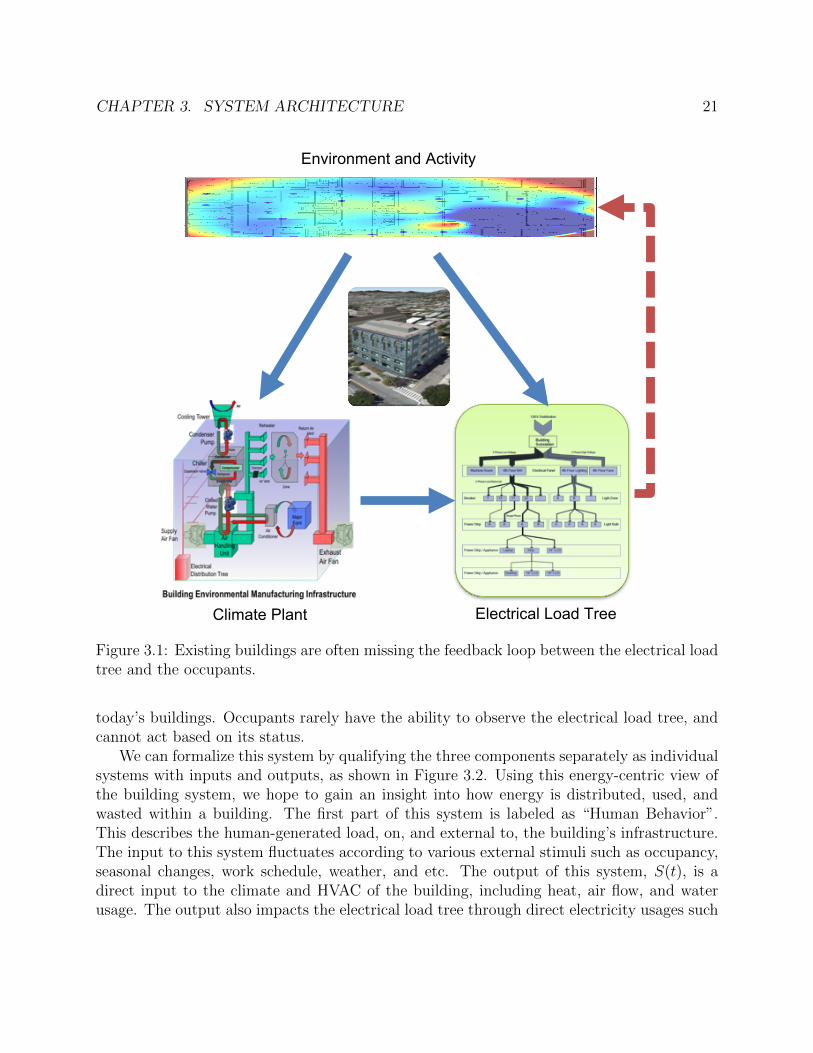
With a better understanding of energy flows in buildings and an overview of existingmonitoring and management solutions in the previous chapter, we now take a more systemsview of the building to better understand how we might approach this problem using com-puter science techniques. We decompose the building into three interconnecting sub-systems– “human-behavior”, “climate HVAC”, and “electrical load tree” – and investigate theirrelationships in Section 3.1.
In section 3.2, we present the design considerations and overview of a high-fidelity energymonitoring and feedback architecture for buildings, consisting of three layers – sensing, datadelivery and representation, and applications and services. The subsequent chapters describeeach layer of our architecture in more detail, supported by the design, implementation, andevaluation of a system based on this architecture.
3.1 Building as a System
A building is fundamentally a space that controls environment for the comfort of itsoccupants and provides the infrastructure to support their activities. To provide these twofunctions, a typical building has a physical plant, responsible for generating the internalclimate, and an electrical load tree, responsible for routing electricity. To better understandthe building as a system, we decompose it into three interlocking views: environment andactivity, climate plant, and electrical load tree, as shown in Figure 3.1. The environment andactivity view describes building occupancy and occupant activities, the fundamental load orinput to the building as a system. The climate plant view describes the physical plant insidea building, which often includes heating, cooling, ventilation, water and wastewater, and is afunction of the environment and activity view. To power the physical plant, a large amountof electricity is typically required, which must be supplied by the electrical load tree. Theoccupants also directly impact the electrical load tree through appliances and plug-loads. Inthis decomposition, the load tree is a central component, but it is often the least visible in
CHAPTER 3. SYSTEM ARCHITECTURE 21
Electrical Load Tree Climate Plant
Environment and Activity
Figure 3.1: Existing buildings are often missing the feedback loop between the electrical loadtree and the occupants.
today’s buildings. Occupants rarely have the ability to observe the electrical load tree, andcannot act based on its status.
We can formalize this system by qualifying the three components separately as individualsystems with inputs and outputs, as shown in Figure 3.2. Using this energy-centric view ofthe building system, we hope to gain an insight into how energy is distributed, used, andwasted within a building. The first part of this system is labeled as “Human Behavior”.This describes the human-generated load, on, and external to, the building’s infrastructure.The input to this system fluctuates according to various external stimuli such as occupancy,seasonal changes, work schedule, weather, and etc. The output of this system, S(t), is adirect input to the climate and HVAC of the building, including heat, air flow, and waterusage. The output also impacts the electrical load tree through direct electricity usages such

CHAPTER 3. SYSTEM ARCHITECTURE 22
!"#$%&'()$*+,-&
./+#$0(&!12.&
3/(40-+4$/&5,$6&7-((&
!
S(t)
!
"(t)
!
! " (t)
'"+/6+%8&90-"40"-(&
CA
D M
odel
:44";$%4<&
9($=,%&
>,-?&94)(6"/(&
>($0)(-&
Plug-load
Lighting
Temp
@%;"0&
9<=0(#&
304A&
Building S
cience A
rchitecture
Close the feedback loop Observe ! Analyze ! Act
Figure 3.2: Building as a system, is composed of three subsystems – “human behavior”,“climate HVAC”, and “electrical load tree”.
as elevator, lighting, and plug-loads. The system labeled “Climate HVAC” is not only afunction of the outputs of “Human Behavior” but also of the structure of the building itself.And in many cases, optimizing the building structure can have a significant impact on the“Climate HVAC” system, as seen in [49]. For the purpose of this thesis, we assume thebuilding structure is not something we can control. The output, T (t), of this system, is theload, and input to the “Electrical Load Tree”. In many buildings, T (t) is the largest energyuse.
As seen in this figure, the electrical load tree is perhaps the most important system insidea building. It is directly impacted by all electrical uses, either directly or via the “ClimateHVAC” system. Observing the electrical load tree is therefore essential in understand whereenergy is consumed and wasted, and is a necessary step in reducing consumption. However,in today’s buildings, it is often the least observable. The only feedback buildings have tooccupants is through thermostats, as signified by the feedback loop from “Climate HVAC”to “Human Behavior”, labeled “Temp”. However, there is little or no feedback from “Elec-trical Load Tree” to “Human Behavior”, resulting in an open-loop system, vulnerable toinstabilities in the input.

CHAPTER 3. SYSTEM ARCHITECTURE 23
Current efforts such as demand response [64] try to create a direct feedback, but only kicksa few times during a year. We argue that to truly reduce energy consumption, we should,in addition to peak-shaving once or twice in the summer, focus on reducing the baselinecontinuously by treating the building as a holistic system. We propose an architecture forreducing energy consumption in buildings that starts by providing the facilities for directlyobserving the load tree, followed by applying tools to analyze, model, and simulate the end-use, and ultimately leading to the realization of energy savings, either through feedback tothe occupants or automatic methods.
3.2 System Architecture Overview
Learning from the short-comings of existing building management systems (Section 2.2.1),and borrowing from traditional software tiering, we propose a three-tiered architecture formonitoring and reduction of energy in buildings with following properties:
• Abstracting heterogeneous data sources using an uniform data representation layer,and enabling open1 and programmatic access by portable applications.
• Instrumenting the whole building as a real-time distributed system centering aroundthe electrical load tree, instead of human-based control of set-points.
• Enabling occupants to reduce energy voluntarily by coupling them in the control loopand providing them with visualizations of energy usage.
This architecture is composed of three layers – sensing (Chapter 4), data delivery andrepresentation (Chapter 5), and service and applications (Sections 6.1 and 6.2), as shown onthe left side of Figure 3.3.
To reduce energy in buildings, we must first understand where and how energy is dis-tributed and consumed. Empirical measurement of energy is therefore paramount in thisarchitecture, and is the first layer in our architecture – sensing. In complex environmentssuch as a commercial building, diverse classes of sensors, meters, and actuators are spreadthroughout the building, monitoring thousands of sense points at various granularities. Weidentify several prominent classes of devices that belong to this layer in the bottom-left ofFigure 3.3.
In this figure, a busbar Rogowski coil (a flexible type of current transformer) is usedto monitor the mains power at the building base-station level, using RS-485 as the linkprotocol for communication. At the panel level, current transformer based circuit metersare used for monitoring individual breakers in panels, and communicate using Modbus overEthernet. Wireless building management systems are also becoming increasingly common,
1Open does not imply insecure. There are many encryption protocols such as SSL/TLS, that enable
secure communication on top of open standards.

CHAPTER 3. SYSTEM ARCHITECTURE 24
!"#$%&%$'()"*
+%
,-./0/11%2
/13%+/4)
(.5%
2(6781%
"/.1(9:0%;//67:<5%2(6/0-9=%
>(9?98(81%>(@
@-11-(9-9=%
A/78==-9=%
*""'!>*B!C+D%
sMA
P Interface
E-18:0-F:?(9%*<48:?(9%:96%>(94.(0%
".(GH%
DIJE!>ID%A*B*%AI'!EIJK%*+A%JI"JIDI+B*B!C+%
DI+D!+L%S
ystem A
rchitecture
MBB"&!"%
".(GH%
".(GH%
Application P
rocess Flow
IG4/.9:0%A:4:%
".(GH%
LN!&DO'%
D>*A*%
":9/0&>-.<8-4%
'-=34%"08=P0(:6%
E-7.:?(9%"08=P0(:6%
".(GH%
JDPQRS%
2:-91%
*9:0HF/%!%2
(6/0%!%A-1:==./=:4/%
J/P:==./=:4/%!%E-18:0-F/%!%;//67:<5%
'(<:?(9%*843/9?<:?(9%
A:4:7:1/%
'(:6%B.//%D/91-9=%
*>@
/%*TT0-<:?(9%
MBB"&B>"%
UDC+&V2
'%
12*"%
!"%
NA"%
Figure 3.3: System architecture and the process flow of the ACme application.

CHAPTER 3. SYSTEM ARCHITECTURE 25
based on WirelessHART, ISA 100.11a, or the Zigbee/HomePlug Smart Energy Profile 2.0(SEP2) [83, 48, 70]. With intelligent and connected devices becoming increasingly cheaperand ubiquitous, smart AC plug-load meters, light sensors, or even vibration sensors couldbe used to monitor various physical phenomenons inside the building that help in inferringenergy usage (some of these sensors and meters are described in more detail in Chapter 4).Furthermore, sensing is not limited to physical sensors. External data such as weatherpatterns, occupancy fluctuations, and etc. are all valuable information, and is treated simplyas data sources in the sensing layer. In addition, we can also abstract SCADA data simplyas another data source, and communicate with it through GUI or SQL.
Regardless of where these data come from or how they communicate internally, they canbe easily exported via the use of proxies with network interfaces to provide IP connectivity. Inthis architecture, the sensing layer includes any device or data source that provide physicalinformation and has the ability to communicate with external devices over IP, either directlyor through proxies.
However, with such a diverse set of data sources, each speaking a different language, forapplications to communicate with all of them is extremely complicated and difficult, if notimpossible. As a result, a three layered approach is not only natural, but necessary, forenabling innovation in building applications without been hampered by the low-level detailsof the myriads of disparate monitoring instruments and protocols. The data deliveryand representation layer functions as a narrow-waist, decoupling portable applicationand services from the sensing layer below. In our vision, sensors, meters, actuators, andother data sources will communicate over IP and use a standard application profile calledsMAP – Simple Measuring and Actuation Profile. sMAP provides uniform access to a largesubset of devices typically found in a building. This layer is the hardware abstraction layer;below it, code may be device-specific. For newer devices such as IP-based sensors, sMAPmay be integrated directly; for legacy devices such as Modbus based meters, sMAP can beimplemented on a proxy, as shown as red boxes in Figure 3.3. A typical sMAP proxy acts asa bridge or gateway. On one side, it implements the device-specific code for communicatingwith a particular sensor; on the other side, it implements sMAP profile using JSON/XML asthe data interchange format, and communicate using HTTP over IP. We describe this layerin more detail in Chapter 5.
Sitting on top of this uniform data representation layer are services and applications thatare portable. Services are REST-ful web services that communicate with data sources in thesensing layer via sMAP and provide added functionalities to applications; and applicationscan directly communicate with data sources via sMAP and with multiple services. Forexample, database is a commonly used service that stores historical data from data sourcebelow and provide them to multiple applications above. Different applications can utilizethese data layer and service layer in innovative ways. Building managers may wish to use anactuation and control application for maintaining the building; occupants may use a personalfeedback and energy visualization software running on their mobile phones for tracking theirpersonal energy usage; and application developers can utilize these data in a debugging

CHAPTER 3. SYSTEM ARCHITECTURE 26
environment before publishing their building application.In the next three chapters, we define the specifics for each of the three layers in this
architecture, and demonstrate its feasibility by providing an empirical basis for evaluatingits effectiveness. Based on this architecture, we implement and deploy a real building mon-itoring system and develop an energy feedback application, as shown on the right side ofFigure 3.3. This application is an instantiation of our architecture for evaluating its effec-tiveness to enable building applications. In this application, we present the process flowfrom understanding and measurement of the load tree to the data analysis, modeling, anddisaggregation of energy usage (Chapter 7), and finally re-aggregating into actionable rep-resentations for visualization and feedback to the occupants (Chapter 8).
27
Chapter 4
Sensing and Measurement
“If you cannot measure it, you cannot improve it.” - Lord KelvinIndeed, without empirical measurement of the physical world, it is impossible to know
where energy is distributed, consumed, and wasted, let alone reducing it.The premise of our architecture is the existence of a pervasive networked monitoring
infrastructure that connects humans and applications with the energy pulse of the buildingin real-time. This sensing tier is defined as the collection of devices of data sources thatprovide physical information and has the ability to communicate with external devices,either directly or through proxies. This sensing is composed of a wide range of data sources,forming what we call the observation space, which consists of three dimensions - what, where,and when.
“What” refers to the type of physical phenomenon been measured, such as electricity,water flow, and light intensity. In addition to directly measuring electrical power, severalresearch have shown that motion, sound, location, and vibration can all be used to inferelectrical energy [28]. “Where” refers to the location of the observation point, in particular,with respect to the load tree (explained in more detail in Section 7.1) of the building. Acoarse point of observation is at the root of the tree – the whole building consumption.However, at this granularity, while we have the entire envelope, it lacks detailed informationof how energy is used within this envelope. By further instrumenting deep into the load tree,we arrive at locations such as electrical distribution panels for floors, power distributionunits (PDUs) for server rooms, and eventually single plug-loads or even individual resistorsor capacitors inside an appliance. “When” refers to the frequency of measurements andrelative phases between them. For example, the home PG&E bill is one sample point permonth, with a resolution of kWh. Whole building usage is often at per-minute granularity,and reported in 15 minute batches. In contrast, modern meters and scopes can often measureat Mhz frequency. In our system, a combination of different sensors and meters are used,each at a different point in the observation space, motivating the need for an architecturefor obtaining time-correlated data in real-time.
While many sensor feeds already exist in modern buildings at different granularities, an

CHAPTER 4. SENSING AND MEASUREMENT 28
important type of meter is often missing from current buildings – plug-load meters thatdirectly monitor electrical usages of appliances at the leaves of the load tree. Existing plug-load meters are usually unconnected and do not scale, as discussed in Section 2.2.2. Toaddress this problem, we designed a wireless IPv6-based plug-load meter – called ACme. Wedescribe the design, implementation, and evaluation of ACme in Section 4.1.
As mentioned before, in some situations, it is inconvenient or costly to directly measureelectrical power. Instead, we can infer energy consumption by using sensors with differentmodes, such as vibration and light. We describe some of these sensors and methods forobtaining time-correlated data in Section 4.2.
4.1 Plug-load Energy Monitoring and Control
ACme is a wireless sensor and actuator device for monitoring AC energy usage andcontrolling AC devices in a building environment. The ACme node integrates an Epic [38]core module with a dedicated energy metering IC to provide real, reactive, and apparentpower measurements, with optional control of an attached load. ACme uses the Berkeleyblip [32] IPv6/6LoWPAN stack to provide IPv6 connectivity. ACme nodes automaticallyjoin the IPv6 subnet after being plugged in, and begin interactions with applications. Weevaluate our system in a green building deployment with 49 nodes spread over several floorsof a Computer Science Building and present energy consumption data from this deployment.
4.1.1 Problem Overview
Electricity consumption in typical commercial buildings is divided between HVAC, light-ing, and plug-loads. The Soda Hall building at Berkeley consumes approximately 12MWhof electricity per day. Preliminary data show that the plug-load usage represents approxi-mately 20%, or 2.4MWh, of the total usage and much of this is used by desktop systems. Inaddition, these loads generate heat that must be removed by the HVAC system. Desktopusage is also highly correlated with lighting loads. My goal is to build an interactive, nearreal-time monitoring capability of numerous small loads, as well as the fewer large ones, sothat occupants can understand their electricity usage patterns and adjust their behavior toreduce their energy footprint.
The AC metering application drives a different set of technical challenges and pushessensor network research in some new directions. Although ultra low power operation onbatteries is not required, since the embedded devices are mains-powered, they must consumelittle enough energy that they do not adversely affect the standby monitoring load. Moreover,since they are monitoring the very flow of electricity that they utilize, so the design of the AC-DC power supply and the power metering is inter-related and rather subtle. The design ofthe embedded device must address a family of thermal, noise isolation, and safety concernsthat few sensor networks have examined. We use this challenge to exercise the recently
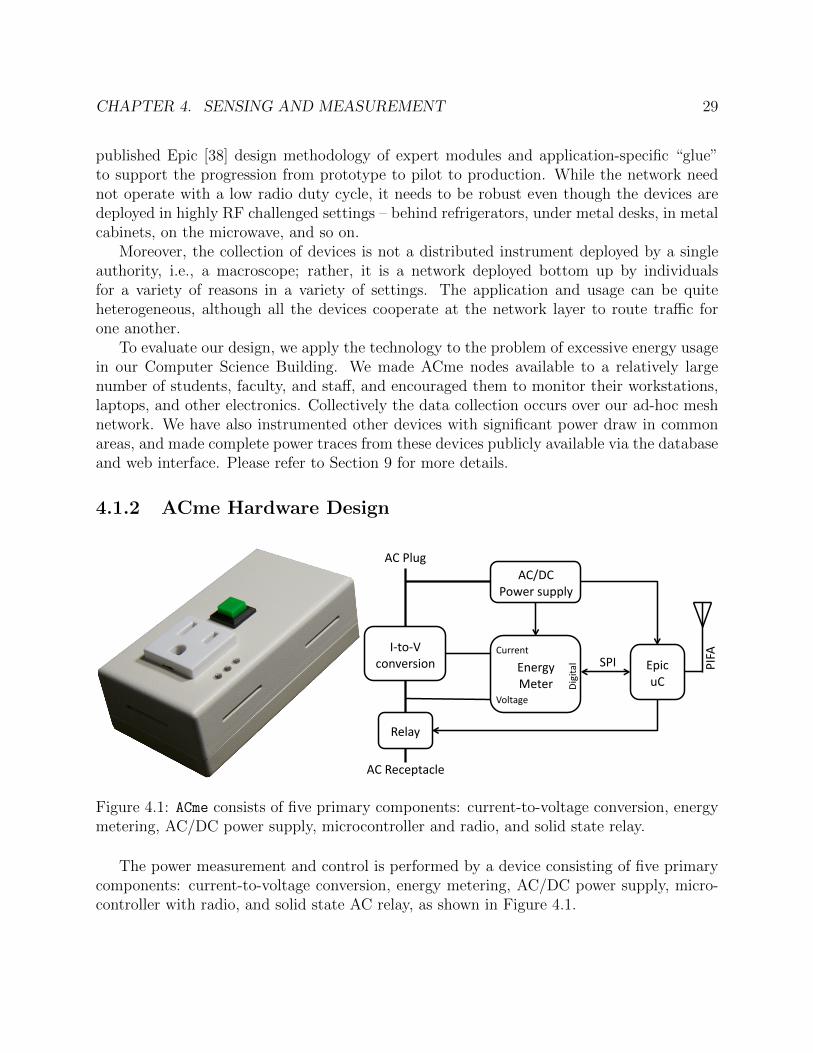
CHAPTER 4. SENSING AND MEASUREMENT 29
published Epic [38] design methodology of expert modules and application-specific “glue”to support the progression from prototype to pilot to production. While the network neednot operate with a low radio duty cycle, it needs to be robust even though the devices aredeployed in highly RF challenged settings – behind refrigerators, under metal desks, in metalcabinets, on the microwave, and so on.
Moreover, the collection of devices is not a distributed instrument deployed by a singleauthority, i.e., a macroscope; rather, it is a network deployed bottom up by individualsfor a variety of reasons in a variety of settings. The application and usage can be quiteheterogeneous, although all the devices cooperate at the network layer to route traffic forone another.
To evaluate our design, we apply the technology to the problem of excessive energy usagein our Computer Science Building. We made ACme nodes available to a relatively largenumber of students, faculty, and staff, and encouraged them to monitor their workstations,laptops, and other electronics. Collectively the data collection occurs over our ad-hoc meshnetwork. We have also instrumented other devices with significant power draw in commonareas, and made complete power traces from these devices publicly available via the databaseand web interface. Please refer to Section 9 for more details.
4.1.2 ACme Hardware Design
!"#$"%&
'$()*+,-$(&
.*/01&
23&4/56&
23&.*'*7#0'/*&
8(*+61&
9*#*+&
35++*(#&
%$/#06*&
:-6-#0/& 87-'&
53&
;4!&
23<:3&
4$=*+&,577/1&
4!>2&
Figure 4.1: ACme consists of five primary components: current-to-voltage conversion, energymetering, AC/DC power supply, microcontroller and radio, and solid state relay.
The power measurement and control is performed by a device consisting of five primarycomponents: current-to-voltage conversion, energy metering, AC/DC power supply, micro-controller with radio, and solid state AC relay, as shown in Figure 4.1.

CHAPTER 4. SENSING AND MEASUREMENT 30
Figure 4.2: ACme-A uses shunt resistor as I-V conversion, direct rectification as AC/DCpower supply, and ADE7753 as the energy metering IC.
The current-to-voltage converter converts the current used by the AC appliance to volt-age, as described in Section 4.1.2. This signal is amplified and filtered before multiplyingwith the AC voltage to obtain power. To obtain real, reactive, and apparent power measure-ments, a dedicated IC is usually used to perform the necessary analog-digital conversionsand calculations. The result is output over a digital bus to the Epic microcontroller. ACmealso takes advantage of the available AC to power its own operation; this requires an AC/DCpower supply. To give ACme the ability to control the AC device, a solid state relay is used.Finally, a microcontroller is used to communicate with the energy metering chip via SPI,and to the network via radio.
There are several design choices for each component, each with its own advantages anddisadvantages. Design decisions for the different components of ACme are not independent.For example, a particular choice of current-to-voltage conversion requires a compatible choice

CHAPTER 4. SENSING AND MEASUREMENT 31
Figure 4.3: ACme-B uses an in-line Hall Effect sensor as I-V conversion, a step-down trans-former followed by a bridge rectifier as the AC/DC power supply, and performs energycalculation in software using the microcontroller.
of power supply and energy meter. We find that there are only a few internally consistentcombinations, each appropriate for a distinct class of applications. To explore the availabledesign space, we built two meters, shown in Figure 4.2 and 4.3. We compare the two designsand evaluate their effectiveness for our application in Section 4.1.2.
Current-to-Voltage Conversion
There are multiple ways to convert current to voltage. The design choices we make inI-V conversion constrain our choice of power supply and energy meter. We evaluate theirdifferences and tradeoffs with respect to their corresponding power supply and energy meter.
A shunt resistor is the most common choice for inexpensive AC meters used in 2-

CHAPTER 4. SENSING AND MEASUREMENT 32
wire single phase systems. It is used in the ACme-A design as shown in Figure 4.2. Aprecision resistor in the range of mΩ is typically used in series with the AC load. The smallvoltage drop across the resistor is proportional to the current, and is first amplified, andthen multiplied by the voltage, to produce power measurements.
Shunt resistors are inexpensive and small in size, but they have drawbacks. The voltagedrop across the shunt may effect the AC device if the load has a high power draw. Also, theresistive heating results in thermal design concerns as well as measurement issues, since theresistance of the shunt is proportional to its temperature.
The power supply typically must establish a virtual ground at one end of the shuntresistor because most energy meter ICs are not fully differential. This implies that directrectification should be used in the power supply. The safety of this design is less thanideal because a virtual ground is established at AC mains, coupling the rest of the meteringcircuit to high voltage. This method is also inefficient because it requires “dumping” energyto ground.
Another common method of converting current to voltage is to use a current trans-former. There are two common versions of current transformers: a traditional in-line ver-sion, and non-contacting clamp-on version.
In-line current transformers are a popular choice for moderately priced AC meters usedin 3-wire distribution systems. The current transformer performs vector addition of PhaseA and Phase B via two primary turns of opposite polarity [1] and transfers the current tothe secondary via magnetic induction. The current on the secondary is converted to voltagevia a “burden” resistor.
Current transformers cleanly decouple the low voltage DC circuit from the high voltageAC input, which make them safer than a shunt resistor. Using a current transformer in theI-V conversion stage allows us to use a step-down transformer followed by low-voltage recti-fication as the power supply, which is more efficient than direct AC rectification. However,current transformers are more expensive than shunt resistors and also require phase com-pensation. They are also generally large in size and weight; the smallest current transformerreadily available is relatively large compared to the rest of the ACme board. For this reason,we decided against using current transformer as the I-V conversion element in ACme.
The second form of current transformers are clamp-on meters, in which case the entiresensor is the secondary of the inductive coupling. These sensors have the obvious benefit ofnon-intrusive measurement. However, they also have two flaws: (1) the wires in the AC lineneed to be physically separated so that the sensor can attach to the phase wire, and (2) themeter itself must be powered by a separate power supply, which means either batteries ora separate AC-DC converter is needed. The clamp-on option is attractive for branch levelmetering, but not ideal for receptacle level.
A third method of converting current to voltage is theHall Effect sensor. These devicesuse the Hall Effect [10] to measure current and can be either clamp-on (non-contacting) orin-line. The clamp-on form factor is not considered here for reasons above.
In-line Hall Effect sensors intercept the AC current and couple it with an internally

CHAPTER 4. SENSING AND MEASUREMENT 33
calibrated Hall Effect element. This approach is compact and precise. More importantly,the high voltage AC input is electrically isolated from the low voltage output inside thein-line Hall Effect sensor, providing an electric isolation of kilovolts. This makes it possibleto use an efficient step-down transformer as the power supply. The step-down transformeralso establishes a ground at a safe, low voltage. ACme-B is designed using this approach,and is shown in Figure 4.3.
Energy Metering
Energy metering is the process of calculating the power and energy from the current andvoltage. This process can be done in either software or hardware. The two methods havedifferent tradeoffs and are appropriate for different applications.
In the software solution, a single wire connects the output from the I-V conversion tothe microcontroller’s ADC. This pushes measurement into the microcontroller, which mustsample the signals, multiply, and accumulate in software. While this choice avoids the needfor a dedicated meter IC, the microcontroller is kept busy performing the sampling, and theresults are less precise due to lower sampling rates. In the case of ACme-B, we cannot connectthe AC wires to the microcontroller directly to obtain the voltage because a transformer isused as the power supply. We assume a constant RMS voltage in converting current topower. This is acceptable for applications which monitor only apparent power.
There are many commercial ICs that perform energy measurement in hardware. Forexample, Microchip’s MCP3905 supports real power measurement using two ADC channels,one for current and one for voltage. The output is a pulse whose frequency is proportionalto the power. However, it does not support energy accumulation, requiring another chipor the microprocessor for computing energy. The analog pulse output requires either con-stant sampling using ADC or triggering an interrupt on every pulse, further burdening themicrocontroller. Analog Devices’s ADE7753 provides real, reactive, and apparent powercalculations. It internally integrates power to produce energy, provides extensive filtering,and includes a temperature sensor. ADE7753 stores power and energy measurements inregisters, and communicates with the microcontroller via the SPI bus. This simplifies thedata acquisition process and allows the microcontroller to easily configure parameters in theADE7753. ACme-A (Figure 4.2) uses this chip.
AC/DC Power Supply
The two typical approaches to DC power supply design are direct rectification or step-down transformer followed by rectification. They are each suitable for a particular type of I-Vconversion; the choice is determined by how the ground reference is established, in additionto efficiency, size, and cost considerations. We built both designs to better understandthe relationship and tradeoffs between components. ACme-A uses direct rectification whileACme-B uses a transformer.

CHAPTER 4. SENSING AND MEASUREMENT 34
There are several methods for rectifying an AC signal. We chose a simple half waverectifier. Direct rectification of the high main voltage avoids the use of a transformer butrequires high voltage capacitors. Care needs to be taken when using this method becausethe ground is at high voltage. This will lead to shorts or even fire if another device that usesearth ground is connected while powered on, as might occur when using a scope to debugthe circuit or connecting to a PC.
Traditional step-down transformers followed by a bridge rectifier are more efficient thandirect rectification since inductive coupling wastes little power and a bridge rectifier at lowvoltage is efficient. By using a current transformer or an in-line Hall effect sensor for the I-Vconversion, the low-voltage part of the circuit is safely isolated from the high-voltage input,sometimes referred to as “Galvanic isolation”. Unfortunately, typical current transformersare too large for our application. Instead, we use a Hall-effect ASIC sensor in the design ofACme-B.
Comparison of ACme-A and ACme-B
ACme-A ACme-B
Measurements real, reactive, apparent apparent
Energy accum. hardware software
CPU load low high
Cost medium low
Idle power 1W 0.1W
Table 4.1: Properties of ACme-A and ACme-B.
ACme-A, shown in Figure 4.2 uses the combination of a 1mΩ precision sensing resistor,direct AC-to-DC rectification, and the ADE7753 energy meter IC. ACme-B, shown in Fig-ure 4.3 uses the combination of in-line Hall Effect sensor, transformer-based power supply,and software-based energy metering. Table 4.1 shows the basic differences between them. Aswe can see, ACme-A is a more capable energy meter at the expense of efficiency. ACme-B,on the other hand, reduces cost and complexity at the expense of lower power measurementfidelity and higher CPU load. We believe that the full range of high-fidelity energy measure-ments is important in order to support various types of energy related applications that thisplatform is intended to enable. The 1W idle power is at the high end of acceptable overhead.For the rest of the paper, we focus on ACme-A, but the observations carry over to ACme-B.
Control
The appropriate form of control for many AC devices is a simple microcontroller con-trolled switch. This allows the embedded software, and consequently remote application, tohave full control over the state of the AC device. It is useful for many applications in whichwe want to close the sensing-actuation loop. We chose a solid-state-relay over traditional

CHAPTER 4. SENSING AND MEASUREMENT 35
electro-mechanical relays due to its smaller size, higher switching speed, higher EMI immu-nity, and a near-infinite switching lifetime. Our choice, the Sharp S216SE1, provides a highisolation voltage due to opto-coupling. The S216SE1 has a rated maximum current of 15A(1800W).
First, while the solid state relay gives ACme the ability to control appliances, it pro-duces considerable heat, limiting the maximum current rating of ACme. Also, ACme shouldmaintain the state of the relay during reboot and reprogramming. Ideally this would be im-plemented in hardware using a bistable switch; this version of ACme simply ensures that theplug is turned on during reboots, maintaining the same semantic as a pass-through plug. Welearned this lesson the hard way, accidentally power-cycling all devices under measurementafter reprogramming the network over the air!
Microcontroller and Radio
ACme uses the Epic Core [38] as its microcontroller and radio because Epic exports allthe functionalities of a typical “mote” but in a small and easily-composable package. Epic isa single-side-leadless module that can be easily incorporated into a circuit board. In futureiterations of ACme production, Epic Core can be inlined into the ACme layout to furtherreduce cost and assembly time. Epic Core uses the TI MSP430F16 microcontroller and theCC2420 radio, which are both supported by TinyOS.
To enable high speed sampling of energy, we connect the SPI bus of the ADE7753 toUSART1 of MSP430, since USART0 is already shared by the radio and the flash. This con-figuration allows high speed samples to stream into flash. ADE7753’s IRQ and zero-crossingoutputs are connected to provide wake-up interrupt and dimmer functionality. Finally, aPIFA board antenna provides good radio range and minimizes cost.
Mechanical
Usability is a primary concern for ACme. We use a plug-through design which minimizesintrusiveness by acting as a small in-line power adaptor. The male plug of the appliance isinserted into the female receptacle of ACme, and the male side of ACme is plugged into theAC outlet. A small form factor is important because users will not accept large, research-grade devices. We chose a UL approved ABS plastic enclosure the size of a regular poweradaptor with a dimension of 10x5.6x4cm.
One of the applications of energy monitoring is to alert users of abnormalities or excessiveenergy use. To natively support these types of applications and for conventional systemdiagnostics, we expose the red, green, and blue LEDs to the outside via three light-pipes.Users are also able to control various aspects of ACme via the external push-button.

CHAPTER 4. SENSING AND MEASUREMENT 36
Thermal
Because the relay and AC/DC power supply produce considerable heat under heavyload, we machined the enclosures with vents on all sides in addition to putting a heat sinkon the relay. However, real users often place ACme’s under desks or behind appliances whereventilation is minimal. Due to the lack of air convection, even with a heat sink, the solid-state relay still produces significant heat build-up under prolonged high wattage loads suchas microwaves and heaters. As a result, in a later iteration of ACme’s, we have removed thesolid-state relay in favor of an electro-mechanical relay.
In addition to heat generated by relays and power supplies, at 15 amps of current,the current-carrying PCB trace itself produces significant heat, and is proportional to thetrace resistance, as characterized by its geometry. In designing the latest revision of ACme(ACmeX2), we use the following equations to calculate the minimum trace width for externalcopper layer at low frequencies:
Area[mils2] = (Current[Amps]/(k ∗ (TempRise[C])b))1/c
Width[mils] = Area[mils2]/(Thickness[oz] ∗ 1.378[mils/oz])
where k = 0.048, b = 0.44, c = 0.725
At 15A current, 2oz copper weight, and 40C rise from 25C ambient temperature, theminimum trace width is calculated to be 107mil. Using this as a guideline, we designedthe current path by constraining the minimum trace width to 120mil, shortened the routingdistance, and used large polygon fills on both sides of the board as heat sinks, as shown inFigure 4.4. This design significantly reduces heat dissipated and require no heat-sink norenclosure vents. We placed ACmeX2 under a load at 1800W and measured the internaltemperature to reach a maximum of 70C while outside remains close to room temperature.
ACmeX2
We deployed around 100 ACme-A in various environments for about a year and generateda large amount of usage data. In addition, we received valuable feedbacks from real usersfrom different scenarios. As a result, we redesigned ACme combining the advantages of bothACme-A and ACme-B to result in the following improvements:
• Reduced size significantly to fit inside floor boxes.
• Removed relay to address privacy concerns and to reduce size.
• Updated power supply module to reduce cost and size.
• Resigned current path to reduce heat dissipation.
• Use Hall-effect sensor for non-intrusive sensing similar to ACme-B

CHAPTER 4. SENSING AND MEASUREMENT 37
Figure 4.4: Current carrying trace has a minimum width of 120mil and uses polygon fills asheat sinks.
• Use ADE7753 for accurate energy measurement similar to ACme-A.
We have named it ACmeX2 and are in the process of manufacturing around 1000 units tobe used in the Lawrence Berkeley National Laboratory (LBNL) and Cory Hall deployments.
4.1.3 Embedded Software
The ACme node software provides a simple interface over the network, shown in Table4.2, and is built around an ASCII shell component running on UDP port 2000. The shellallows us to remotely adjust sample parameters, debug the network connection, and accessan over-the-air programming facility on individual meters. Data is reported to an externalhost using a separate UDP port in a binary data format.

CHAPTER 4. SENSING AND MEASUREMENT 38
7.5cm / 3
in 5cm / 2in
Figure 4.5: ACmeX2 is more compact and efficient but does not include relay.
ACme command function
read energy() read the current energy
read power() read current power
report(ip addr, rate) send reports
switch(state) set relay to state
Table 4.2: ACme node interface
The driver for the metering chip and relay is implemented in TinyOS as a standardsampling interface which provides the ability to read the energy consumed by the applianceat regular intervals via a start(period) command. The driver can turn on and off theconnected AC device using the set(state) command and query the current state via agetState() command.
In the ACme-B implementation, we sample the AC waveform from the Hall Effect sensorat 6kHz, and track the peaks. The peaks are proportional to power, assuming constantvoltage. Power is further accumulated inside the microcontroller to obtain energy.
4.1.4 Evaluation
We evaluate the design of ACme based on how well it enables energy related applicationsand on its ease of use in home and office environments. As shown in Table 4.3, ACme-A canbe used in challenging applications where high-fidelity data is needed for all three types ofpower. ACme can also provide high speed sampling or long term metering. ACmeX2 furtherimproves upon ACme-A and ACme-B to provide better performance, lower idle power, andsmaller form factor, as shown in Table 4.4.

CHAPTER 4. SENSING AND MEASUREMENT 39
Measurements W, VA, VARResolution 40mW
Sampling speed 14kHzReport speed 2.8kHz
Maximum power 1200WEnergy accumulation 6.26min
Radio range multiple floorsIdle power 1W
Size 10x5.6x4cm
Table 4.3: Summary of ACme-A
Measurements W, VA, VARResolution 25mW
Sampling speed 14kHzReport speed 2.8kHz
Maximum power 1800WEnergy accumulation 6.26min
Radio range multiple floorsIdle power < 0.5W
Size 7.5x5x4cm
Table 4.4: Summary of ACmeX2
ACme can be easily adopted into home and offices thanks to its plug-through design andsmall size, comparable to a laptop power adaptor. We evaluate ACme in a building-widedeployment, as described in Section 9.
4.1.5 Micro Benchmarking
To evaluate how ACme performs on real loads, we measure several appliances found ina typical office environment. We find that ACme is able to provide visibility into appliancepower consumptions with adequate resolution, dynamic range, and over long periods of timeat high temporal fidelity.
In Figure 4.6, an ACme-A is used to monitor a Polycomm conference telephone, whichconsumes around 2 watts on standby and around 3 watt when active. The steps in thevertical dimension indicates that the maximum resolution is around 40mW.
In Figure 4.7, an ACme is used to monitor a coffee maker, which utilizes a heating element.From this graph, we can see that ACme accurately captures the power spike exhibited bythe heating cycles of the coffee maker.
In Figure 4.8, we can observe several interesting modes of a laptop. The exponentiallydelaying curves at the beginning of each cycle shows the charging characteristic of this laptopright after it plugs into a power adapter – as batteries is being charged, the rate of chargingalso slows down. The spiky portions shows the power consumption of active elements of thelaptop, including CPU, screen, fans, and etc.
In Figure 4.9, an ACme is used to monitor a refrigerator. This graph shows two interestingmodes of this refrigerator – the smaller (around 100W) but frequent (15 minutes interval)cycles represent the power consumptions of compressor activity, while the less frequent (afew times per day) but higher power (450W) cycles are caused by the defrost cycles.

CHAPTER 4. SENSING AND MEASUREMENT 40
Figure 4.6: Power trace of a Polycomm teleophone shows that ACme-A is able to resolvelow power appliances down to 40mW.
!!"
Figure 4.7: Power trace of a coffee maker shows that ACme-A is able to measure applianceswith high power pulses.

CHAPTER 4. SENSING AND MEASUREMENT 41
!"#
Figure 4.8: ACme reveals interesting characteristics of devices such as a laptop. We canobserve the power states, charging curve, and CPU usage.
!"#
Figure 4.9: ACme reveals both the compressor cycles (100W at around 15 minutes intervals)and defrost cycles (450W a few times a day) in a refrigerator.

CHAPTER 4. SENSING AND MEASUREMENT 42
4.1.6 Privacy Implications
Privacy issues abound whenever a substantial fraction of devices around people are in-strumented and report data to an “eye in the sky.” Even in our own limited deployment,we found it easy to construct privacy-invading queries which were able to reliably determinethe lab-occupancy habits of different students in our lab. The power consumed by theirwork stations and nearby lights are a good predictor whether or not they are there. Thestudents were understandably leery of this once they realized that their advisor might bevery interested in that query!
While not addressed in this work, we believe that the use of the internet architecture willactually be a boon when considering the privacy implications of this technology. The fact thatthe application can be hosted anywhere on the internet means that consumers could choosea variety of providers to host their power algorithms. For instance, their utility might hostone, with others hosted by non-profit groups, or locally hosted on computers in the home.This requires robust authentication mechanisms to control the use of the ACme sensors. Ingeneral, security in internet-connected sensor networks has not been well addressed. Whileheavy-handed measures like firewalls, virtual LANs, and proxies can be used, it is importantto guard against resource depletion attacks since the resources in question are so meager.
4.1.7 Enabled Research
With the increasing need for energy awareness, we are considering how ACme can beused in future research goals. Many of these goals include human factors and sociologicalelements which we do not address but can be enabled by ACme.
Personal Accountability: The application we have presented takes an initial steptowards the goal of making individuals responsible for the energy they consume. However,we envision much richer data analytics, social features, and control to encourage powerreduction. It is well established that making people aware of their consumption causes themto reduce it [37]. In this scenario, we would install ACme devices on a semi-permanent basisand attempt to reduce energy consumption by fostering a culture of conservation.
Energy Auditing: Our hardware, software, and network are designed to enable deploy-ments with little or no planning or preparation. This makes the system ideal for fast energyaudits where the system is rapidly deployed across an office building and used to collect datafor a short period– from a few days to a week. The data would make occupants more awareof their power footprint and identify the largest opportunities for savings; the process wouldpotentially be conducted iteratively every few months to set goals and assess progress.
Smart Home: Another way to save power in homes and offices is to infer occupancyfrom various sensors: both the ACme meters we have developed as well as light, humidity, ordoor-position sensors. An application could use this information to adjust lighting, HVAC,entertainment systems, and any other devices amenable to remote control. Alternatively,residents might carry “smart badges” which would identify them to the home and allow

CHAPTER 4. SENSING AND MEASUREMENT 43
localization of their positions. The home would respond by developing power profiles to saveenergy without compromising the home’s comfort.
Demand Response: Utilities have a strong incentive to reduce peak demand since thatwould allow them to reduce dirty “peaking” plants used to meet the last few percent ofdemand. One proposal is dynamic pricing of power: if price of power increases as generationapproaches capacity, energy consumers would be incentivised to reduce their consumption.The combination of Internet connectivity and control make the ACme ideally suited toexperiment with “peak-shaving” and “load-shifting” algorithms to reduce the load as gen-eration approaches capacity. For instance, consumers could set up policies to reduce energyconsumption when they receive a signal that generation is about to be overloaded, or limitpower use to a certain budget. ACme nodes could communicate with each other and makedistributed decisions, like an Intelligent Power Switch [45].
4.2 Multi-modal Sensing
One challenge often encountered when trying to instrument a building is that certainconsumers of energy are either hard to measure or inaccessible. For example, HVAC electricalenergy is converted to other forms of energy in a central location, which is secured andinaccessible. Even if one is to obtain permission to enter the premises, special sensors suchas CT clamps are needed to monitor consumption. However, there are multiple ways toobtain equivalent energy measurement without directly measuring consumption.
HVAC systems such as chillers and pumps usually contain relatively high horsepowermotors. A close inspection of our building-wide HVAC control room reveals that thesesystems produce very noticeable vibrations. To demonstrate this, an Epic-based node [38]with both a three-axis accelerometer and a vibration sensor was used to measure the duty-cycling schedule of a motor that drives an air conditioning unit. Multiplying this duty cycleby the ON power produces a real-time power profile. Figure 4.10 (A) shows a trace of oneaxis of the accelerometer over an hour, and Figure 4.10 (B) shows a trace of a vibrationsensor over the same hour. For the particular vibration sensor used, the number of thresholdcrossings at each motor event varies, but the sensor identifies the beginning of motor eventswell. Either type of sensor produces a proxy measurement for calculating the electricalenergy used by a large motor that is otherwise cumbersome to measure.
Additionally, in most cases, sensors appropriate for a particular form of energy can beused to measured it in its natural unit then convert back to electrical energy using the transferfunction along the path of the conversion process. For example, temperature sensors couldbe used to detect heat flow or AC usage, and flow sensors could be used to detect ventilationusage.
Furthermore, unconventional sensors can be used to infer usage or help in improving theaccuracy of existing electrical sensors. For example, proximity sensors carried by individualscan be used to determine the human component to the power profile of refrigerators, or they
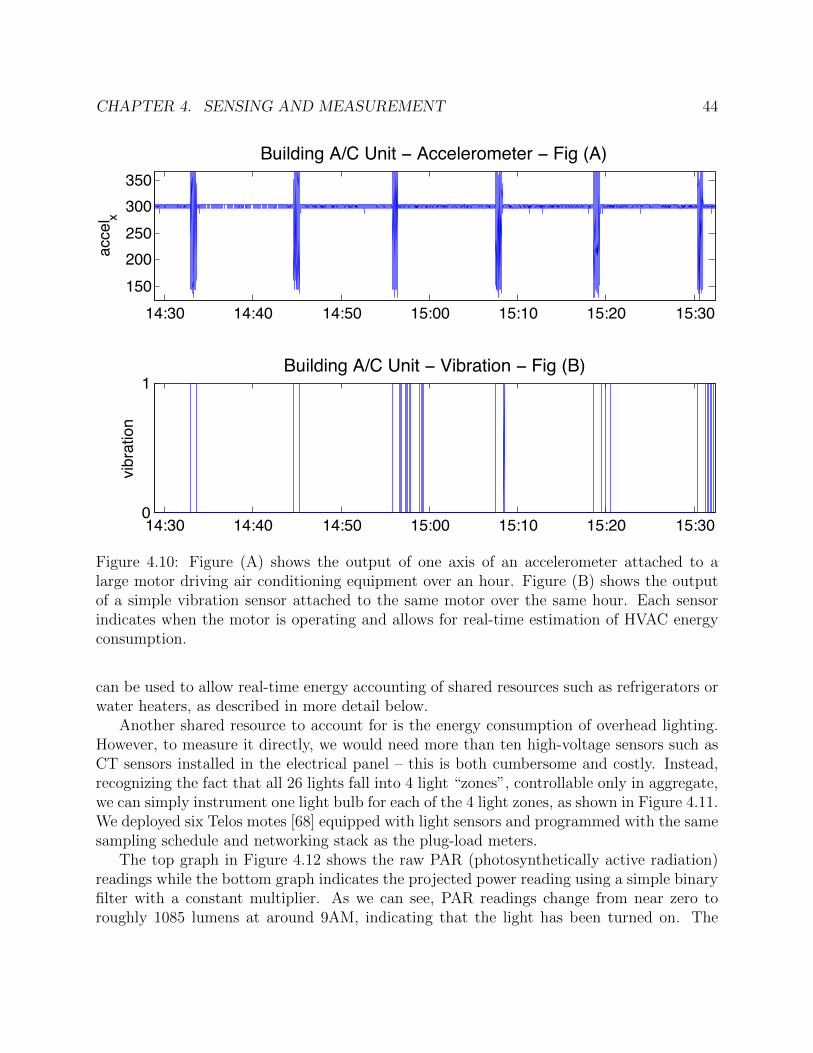
CHAPTER 4. SENSING AND MEASUREMENT 44
14:30 14:40 14:50 15:00 15:10 15:20 15:30150200250300350
acce
l x
Building A/C Unit − Accelerometer − Fig (A)
14:30 14:40 14:50 15:00 15:10 15:20 15:300
1
vibr
atio
n
Building A/C Unit − Vibration − Fig (B)
Figure 4.10: Figure (A) shows the output of one axis of an accelerometer attached to alarge motor driving air conditioning equipment over an hour. Figure (B) shows the outputof a simple vibration sensor attached to the same motor over the same hour. Each sensorindicates when the motor is operating and allows for real-time estimation of HVAC energyconsumption.
can be used to allow real-time energy accounting of shared resources such as refrigerators orwater heaters, as described in more detail below.
Another shared resource to account for is the energy consumption of overhead lighting.However, to measure it directly, we would need more than ten high-voltage sensors such asCT sensors installed in the electrical panel – this is both cumbersome and costly. Instead,recognizing the fact that all 26 lights fall into 4 light “zones”, controllable only in aggregate,we can simply instrument one light bulb for each of the 4 light zones, as shown in Figure 4.11.We deployed six Telos motes [68] equipped with light sensors and programmed with the samesampling schedule and networking stack as the plug-load meters.
The top graph in Figure 4.12 shows the raw PAR (photosynthetically active radiation)readings while the bottom graph indicates the projected power reading using a simple binaryfilter with a constant multiplier. As we can see, PAR readings change from near zero toroughly 1085 lumens at around 9AM, indicating that the light has been turned on. The

CHAPTER 4. SENSING AND MEASUREMENT 45
Figure 4.11: Only 4 light sensors are needed to cover 26 light bulbs since they are controlledtogether by 4 sets of switches and motion sensors.
09:00:00 10:00:000
500
1000
1500
Lum
ens
09:00:00 10:00:000
100
200
300
400
Time of Day
Pow
er
(W)
Figure 4.12: Light sensor readings can be easily converted to power using thresholding.

CHAPTER 4. SENSING AND MEASUREMENT 46
ON/OFF transition is obvious, and can be converted to a 1 or 0 using a threshold. To findthe ON power, we simply counted the types of light bulbs and summed their rated power.
4.3 Summary
Combining the advantages of the ACme-A design, which offers higher metering fidelity,with the advantages of ACme-B design, which is more efficient and compact, we arrive at anoptimal point in the design space. ACmeX2 is a IPv6-based wireless plug-load meter thatprovides 1) active, reactive, and apparent power measurements via hardware; 2) high fidelitymeasurements with milli-watts resolution; 3) the ability to measure appliances up to 1800Wwithout significant heat-up; 4) lower idle power consumption; and 5) compact form-factor.
These characteristics allow ACmeX2 to accurately resolve interesting power variationsin a wide range of appliances, as demonstrated in Section 4.1.5. Furthermore, because of itscompact size and built-in wireless interface, ACmeX2 enables us to easily instrument alarge number of plug-loads without needing a wired infrastructure. Using an ad-hoc wirelessnetwork, ACmes are scalable and data is readily accessible.
In addition, by using multi-modal sensing, such as using light sensors and vibrationsensors, we are able to monitor devices that are normally inaccessible, such as HVAC andhigh-voltage lighting systems.
In summary, the sensing tier, with the combination of ACme plug-load meters and multi-modal sensors, provide high-fidelity and accessible building energy data, both in end-usesand in infrastructure energy usage. In the next section, we integrate with existing buildinginstruments and panel-level meters to provide more complete coverage of the building.

47
Chapter 5
Data Delivery and Representation
The previous chapter explored various sensing, metering, and actuation options appro-priate for energy monitoring and control at different granularities within the building. Inparticular, we investigate the design and evaluation of a wireless plug-load energy meter -ACme - that provides fine-granularity energy data at the edges of the electrical load tree.
Individually these meters provide isolated data points and is much less interesting thanreal-time correlated data. A key motivation of our building monitoring architecture is toallow quick deployment of a large number of instrumentation points, such as ACme’s, andenable continuous real-time access. At this granularity, requiring connectivity over USB,serial, Ethernet, or other wired channel would not be practical.
In this chapter, we first describe an IPv6-based ad-hoc network that provides wirelessconnectivity to ACme nodes without the use of either wiring or infrastructure. Our networkof ACmes is built on top of the blip [32] 6lowpan/IPv6 stack developed by Dawson-Haggertyat Berkeley. This stack provides support for multi-hop IPv6 routing along with TCP andUDP transport protocols, as described in more detail in Section 5.1
While a network of ACme’s provides us with detailed electrical usage at the edges ofthe load tree, it does not give a complete coverage of energy usage inside the building.Fortunately, a commercial building typically contains hundreds if not thousands of sensorsand actuators providing temperature, humidity, and electrical measurements at the branch orbuilding scale. But these sense points are often locked inside proprietary protocols and/or sitbehind legacy interfaces. To enable simple and efficient communication between these typesof data sources and portable applications, including analysis, modeling, and visualizationtools, a horizontal abstraction layer is needed. We describe a simple RESTful web-service-based approach that uniformly represents physical data in Section 5.2.

CHAPTER 5. DATA DELIVERY AND REPRESENTATION 48
5.1 Networking
Many different approaches to networking a subnet of low-powered devices been presentedin the literature. MultiHopLQI or CTP [84, 42] are popular in the sensornets community.However, demand-response control loops will require communication with individual devicesand so collection-only protocols are not an option. CentRoute [71] provides communicationwith single routers in the network, but we are concerned that its static routing decisionswould not be sufficiently agile in poor RF environments. Existing open and standardizedpoint-to-point routing protocols for wireless networks such as AODV and DYMO are notappropriate either for this class of networks due to high control overheads or large routingstate [67, 30]. While S4 appeared promising, actual use of it would require the design andimplementation of a location service [60]. Proprietary stacks such as TSMP, WirelessHART,and PhyNet [20, 23, 11] also appear worthwhile but are not widely available.
Our network is based on blip [32], an open-source IPv6 implementation in TinyOS,developed at Berkeley. Key concepts necessary for bringing IPv6 to wireless embeddedsystems were explored in [47], and so we refer the reader to this reference for a generalguide to the challenges and benefits of embracing this network architecture. Importantly,it provides a standard for IPv6 header compression in the form of the 6lowpan adaptationlayer [61], and shows how IPv6 mechanisms like neighbor discovery and extension headerprocessing can be leveraged when using links with extremely small MTUs. In our case, a low-power (duty cycled) link was not necessary since the devices have abundant power available.In this section, we describe design decisions and evaluations specific to our deployment.
Unlike sensor networks with carefully controlled node placements to ensure good connec-tivity, users may install their ACme meters under their desks, behind metal filing cabinets,or in metal floor boxes, and expect that their data will be visible online. Coverage of theselocations by Wi-Fi access points is typically difficult. Instead we utilize the high densityof these nodes and multihop routing to obtain coverage even with milliwatt power radios.Their relatively low, packet-per-minute data rates can be serviced by a 802.15.4 mesh.
5.1.1 Routing
The function of the embedded routing protocol is to provide reliable, multi-hop commu-nication within the subnet of ACme nodes. This is a requirement of our design; the sensorsand server-hosted applications must be able to communicate. Our routing protocol func-tions as an intra-subnet routing protocol, responsible for routing packets between endpointswithin the same subnet, or delivering them to a gateway if the destination is external. Eachsensor node functions as an IP router, and chooses a set of default routes from its neighborsbased on router solicitations and router advertisements. Nodes with external connectivity(“edge routers”) advertise a cost of zero, and so the basic routing structure is that of a directacyclic graph rooted at one or more edge routers.

CHAPTER 5. DATA DELIVERY AND REPRESENTATION 49
Figure 5.1: Sensor nodes are connected to the Internet through IP routers. ACme nodes arethe sensors and edge routers are Linux-class devices.
5.1.2 Edge Router
To provide good network coverage and reliability, we designed and implemented edgerouters using two existing Linux-class devices: the Meraki Mini and the OpenMesh Mini-Router [14, 16]. Both of these platforms are built around Atheros system-on-chip products,and run the OpenWRT embedded Linux distribution. Internally, both export a single serialport which we use to add an 802.15.4 radio interface via a user space driver.
The edge routers also act as an Internet router for the subnet assigned to the ACmenetwork. They obtain IPv6 connectivity via a tunnel broker which provides them with aglobally routable subnet. Packets from other networks destined to an ACme node arrive atan edge router via the tunnel broker; once they do, they are injected into the network usingthe same mechanism as internal unicast communication.
5.1.3 Transport
blip on the ACme nodes provides TCP and UDP as available transport protocols. Al-though either would be a reasonable choice for reporting the data, we initially chose UDPsince the underlying IP datagram delivery functionality is sufficiently reliable for this ap-plication, and removing the end-to-end ACK packets generated by TCP sessions reducescontention. This decision resulted in a very usable system because end-to-end loss is lessthan 1% for almost all devices and suggests that overhead associated with TCP’s fully ac-knowledged byte stream may not be necessary. The good reliability results from the local

CHAPTER 5. DATA DELIVERY AND REPRESENTATION 50
Figure 5.2: This edge router integrates a Meraki Mini and Epic Mote using a custom carrierboard and routes IP packets between the sensor network and LAN.
repair methods we employ of multiple next-hops and retransmission. When developing theprotocol, we have found that most datagram drops are caused by forwarding queue drops,which are aggravated by poor links since numerous link-layer retries increases queue dwelltime. Therefore, the most sensible strategy may be a lower data rate combined with lazyend-to-end NACKs to achieve 100% delivery.
5.1.4 Network Performance
We have deployed a 49-node network across four floors of our Computer Science building.The network uses a single edge router located in our lab to provide routing between thesensors and the LAN, and has been operational for more than a year. Figure 9.3(f) showsa histogram of the data yield from 49 sensors over a three day period. Due to a poordeployment decision, the radios were set to channel 19 resulting in significant interferencewith existing 802.11 devices and so the network yield was noticeably reduced during busyworkdays. For instance, the median yield on Saturday is 99.4%, but drops to 98.4% onMonday. Compared to other reported results concerning the impact of 802.11 on 802.15.4traffic [62], we observe a relatively modest decline in yield, although our results are notnecessarily comparable in different environments.
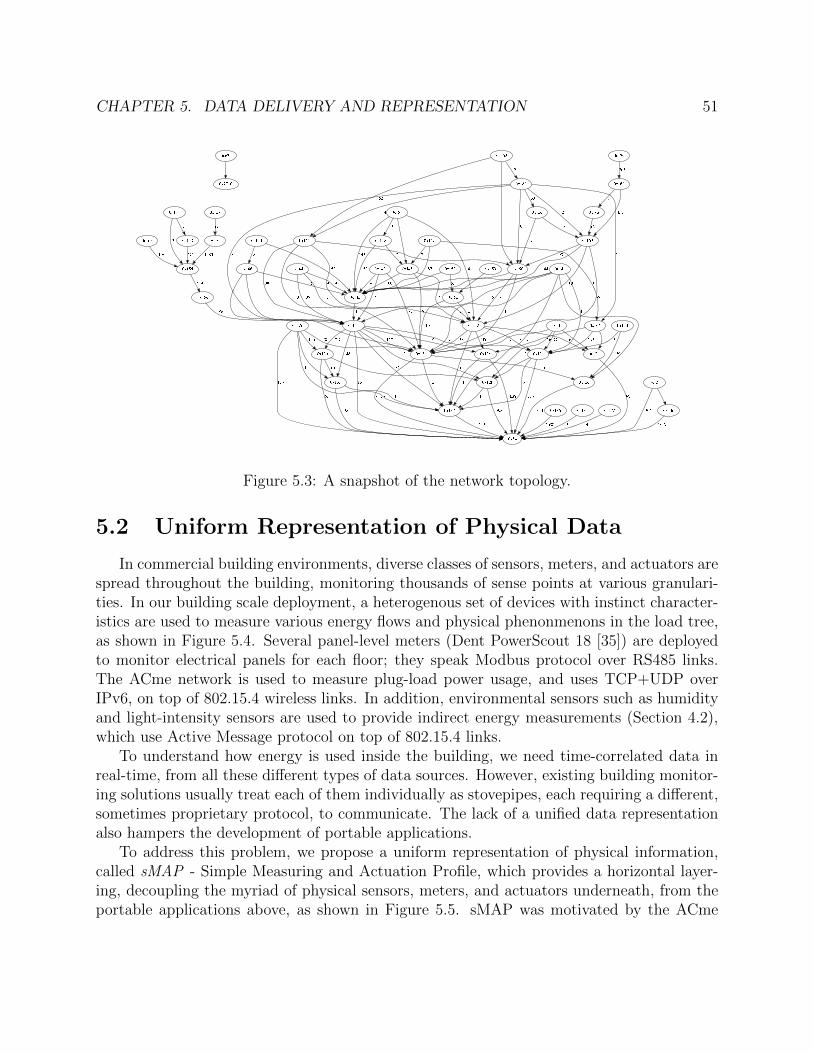
CHAPTER 5. DATA DELIVERY AND REPRESENTATION 51
Figure 5.3: A snapshot of the network topology.
5.2 Uniform Representation of Physical Data
In commercial building environments, diverse classes of sensors, meters, and actuators arespread throughout the building, monitoring thousands of sense points at various granulari-ties. In our building scale deployment, a heterogenous set of devices with instinct character-istics are used to measure various energy flows and physical phenonmenons in the load tree,as shown in Figure 5.4. Several panel-level meters (Dent PowerScout 18 [35]) are deployedto monitor electrical panels for each floor; they speak Modbus protocol over RS485 links.The ACme network is used to measure plug-load power usage, and uses TCP+UDP overIPv6, on top of 802.15.4 wireless links. In addition, environmental sensors such as humidityand light-intensity sensors are used to provide indirect energy measurements (Section 4.2),which use Active Message protocol on top of 802.15.4 links.
To understand how energy is used inside the building, we need time-correlated data inreal-time, from all these different types of data sources. However, existing building monitor-ing solutions usually treat each of them individually as stovepipes, each requiring a different,sometimes proprietary protocol, to communicate. The lack of a unified data representationalso hampers the development of portable applications.
To address this problem, we propose a uniform representation of physical information,called sMAP - Simple Measuring and Actuation Profile, which provides a horizontal layer-ing, decoupling the myriad of physical sensors, meters, and actuators underneath, from theportable applications above, as shown in Figure 5.5. sMAP was motivated by the ACme

CHAPTER 5. DATA DELIVERY AND REPRESENTATION 52
!"#$%&"'()&&*+,-.%/#%012&
$+340(()&&5.$/6778/89:;9<=>?9@&
,"37&8:A=9%B:C>D1)&*+,-.%/#%012&
EFG=)&&7F8H.,8/$8I4/1(JKD2K0&
7=L:M-)&8E#/7%#&EBNI=*MO/1(JKD2K0&
7=L:M-)&6CG<P<>@&EBNI=*MO/1(JKD2K0&
7=L:M-)&7=G;=9?>C9=&EBNI=*MO/1(JKD2K0&
$#"3")&!<Q9?N:R&*:>=&7F8/$8I4/1(JKD2K0&
"L=B>9<B?L& 8S@M<B?L&!"#$%&'((%
Figure 5.4: Various meters and sensors that measure physical data, but communicate throughdifferent protocols and over different physical mediums. For example, the Dent panel meteruses Modbus protocol over RS485 while ACme meters use TCP and UDP over IPv6 onwireless radios, even-though both are communicating the same type of information - quantityof energy.
project and developed in collaboration with Stephen Dawson-Haggerty. In the followingsection, we describe the high-level design considerations and ACme-specific implementationsbut refer readers to these papers [50][33] for the complete design, implementation, and eval-uation.
5.2.1 Design Considerations
sMAP can be integrated directly into the sensors (for newer devices such as IP-basedACme’s) or on a gateway / proxy server (for legacy devices such as Modbus based meters).Using HTTP, we expose sensors, meters, and actuators as resources at standardized URLsand follow the paradigm of Representational State Transfer (REST) [41]. We find that theREST-ful server-client model represents the relationship between physical data feeds andapplications that use them quite nicely. In sMAP, objects are represented using JSON. Wechose JSON because it already has wide tool support; creating, validating, and sending aJSON object to a RESTful service point is only a few lines of code in most languages.

CHAPTER 5. DATA DELIVERY AND REPRESENTATION 53
!"#$%&%$'()"*+%,-./0/11%2/13%+/4)(.5%
12*"%
12*"%
12*"%
12*"%
12*"%!"#
$%&'
()*+,-'
12*"%
"/.1(670%8//9:7;5%
2(9/0-6<%=(6>6?(?1%
=(@@-11-(6-6<%
A/:?<<-6<%
Portable Applications
sMAP Interface
B-1?70-C7>(6%
*;4?7>(6%769%=(64.(0%
D%
".(EF%
".(EF%
Figure 5.5: IPv6-based sensors such as ACme’s implement sMAP directly while legacy de-vices such as Modbus based branch meters implement sMAP via proxies. Applicationsinterface with any metering resource uniformly via sMAP. In this example, a visualizationapplication is used to graph real-time energy readings from both ACme’s and from branchmeters.
The goal of sMAP is to represent a single device, uniformly providing all the informationnecessary to query all sensors, meters, and actuators. A sensor is a device which instanta-neously samples a physical quantity (such as current or light), while a meter integrates sucha value over time (for instance, energy or flow volume.) An actuator is a device which mayeither convert a digital quantity to an analog one or control a set point; relays, thermostats,and valves are examples of actuators.
5.2.2 ACme sMAP Service
A fragment of the sMAP service implemented by ACme is shown in Figure 5.6; thisparticular piece represents a meter, abstracting ACme’s energy measurements. Power isrepresented as a sensor and has a similar representation (not shown). sMAP is hierarchical,and allows a single device to have multiple sense points, each of which instruments a single

CHAPTER 5. DATA DELIVERY AND REPRESENTATION 54
/ # list resource under URI root [GET] /data # list sense points under resource data [GET] / [sense_point] # select a sense points [GET] /meter # meters provide this service [GET] / [channel] # a particular channel [GET] /reading # meter reading [GET] /format # calibration and units [GET/POST] /parameter # sampling parameter [GET/POST] /profile # history of readings [GET] /report # create and query periodic reports [GET/POST] /status # device-specific status messages [GET] /context # instrument serial number or GUID [GET] /reporting # for syndication [GET] /create # create a new periodic report [POST] /reports # show current reports [GET] /xTswsD4d # a reporting instance [GET/DELETE]
Figure 5.6: A fragment of the sMAP RESTful interface implemented by ACme.
http://326.acme.berkeley.edu/data/default/meter/energy/reading\___/ \___________________/ \_____/ \___/ \____/ \_____/
| | | | | || ACme’s IP address sense_pt | channel |
transport meter/sensor object
Figure 5.7: A typical ACme sMAP resource URI.
physical process. In this configuration, every ACme is a distinct sMAP service, thereforeonly has one sense point. A sense point may also have multiple channels. This is usefulbecause a single instrumented sense point, such as a Hall-effect sensor, may derive multiplerelated measurements such as current (RMS and peak), instantaneous power, metered energy(over some time interval), and power factor. This would be represented as a single sensepoint with multiple sensor channels. Since ACme’s meter sense point only provides energymeasurement, it only exports a single channel called energy. A typical URI for reading theenergy from an ACme sMAP service is shown in Figure 5.7.
Integrated with the sensor reading itself which is stored in the reading resource are allthe ancillary facts necessary to interpret the data. formatting contains information onwhat is being measured and how to interpret raw readings, specifying engineering units andcalibration constants. parameter contains information on the sampling rate in use; thiscan be used to determine when reading will update. Figure 5.8 shows the formatting andparameter resources provided by ACme. Finally, profile is an optional resource whichallows a sMAP server to buffer a fixed number of old readings. Please see Section 6.1 for anexample.
sMAP also allows periodic reports to be sent via “pushing”; however, very small embed-ded implementations may not support this. To request a periodic report, a client sends a

CHAPTER 5. DATA DELIVERY AND REPRESENTATION 55
FORMATTING:
"$schema" : "$ref" : "http://schema.berkeley.edu/format.json"
,"UnitofTime" : "second","MeterType" : "electric","UnitofMeasure" : "kW","Divisor" : "24"
PARAMETER:
"$schema" : "$ref" : "http://schema.berkeley.edu/parameter.json"
,"UnitofTime" : "second","SamplingPeriod" : 60,"Settings" :
Figure 5.8: Formatting and parameter resources.
Client (HTTP_POST) ->http://326.acme.berkeley.edu/report
\___________________/ \____/| |
ACme’s IP address objectWith JSON object:
"ReportResource" : "/data/325/meter/*/reading","ReportDeliveryLocation" :
"http://repo.berkeley.edu/receiver.php","Period" : 60, "Minimum" : 50, "Maximum" : 100
Figure 5.9: Setting up a per-minute periodic report for the reading resource from ACme 326to a data repository.

CHAPTER 5. DATA DELIVERY AND REPRESENTATION 56
JSON object to the sMAP server specifying what resource on the server should be reported,and the URL of the destination, as shown in Figure 5.9. Periodic reporting is critical toallow sMAP to integrate into full-fledged stream processing system, since it allows a systemto create event triggers and avoid inefficient polling. Please see Section 6.1 for an example.
5.3 Summary
Using an edge router and an IPv6-based ad-hoc network, sensors, meter, and actuatorsin this architecture can communicate with each other and with any IP endpoint, makingenergy data readily accessible, both within and externally.
However, different devices speak different languages; in order for them to interoperate,we create an application profile called sMAP, which defines an uniform representation forphysical information. sMAP defines only three data types – sensors, meters, and actuators,and predefines all allowable units. This choice to be restrictive in effect enforces all devicesto behave like simple data sources, which is essentially a quantity with an unit. While sMAPis not as expressive in terms of data types, it is designed to be self-descriptive, with facilitiesfor any client to easily interpret and derive meaning from its data. From our experiences inimplementing sMAP on various sensors and meters, we find it to be sufficient for most typesof instruments found in buildings. sMAP also requires very little resource to implement,making it ideal for resource-constrained and older devices.
And with the use of proxies, this architecture supports an extensive range of existingand legacy building instruments and data sources. For example, a proxy can implementsMAP over IP on one interface while communicating with a panel meter using Modbus overRS-485 on another.
By using the RESTful server-client model to represents the relationship between physicaldata feeds and applications, this architecture enables data sources to easily interoperatewith external devices and applications. Sensors, meters, and actuators are exposed as re-sources at standardized URLs and communicate with external applications using HTTPfollowing the RESTful paradigm. Furthermore, by using JSON as the object representation,encoding and decoding sMAP object is easy since JSON is widely accepted.
In summary, sMAP abstracts heterogenous building data source into RESTful web ser-vices with an uniform data representation, and therefore shortening development time forapplications and allows them to be more portable.

57
Chapter 6
Applications and Services
In our architecture, applications and services are built atop the network of meters, sen-sors, and actuators, and are logically distinct from both the nodes and the network, as shownin Figure 3.3. This architecture allows many distinct applications to use the underlying net-work concurrently. From the application’s perspective, each sense point exposes its functionsthrough sMAP, such as configuring the node and reporting energy measurements over UDP.Applications can use these services divorced from the node-level details of TinyOS program-ming or energy metering. In this model, sensornet application development looks much morelike web application development with its familiar N-tier model with the meters playing therole of an external data feed.
This chapter describes the data acquisition portion of the ACme application, while Chap-ter 7 and Chapter 8 address the data analysis, modeling, and feedback of this data.
6.1 ACme Application
In the ACme application (Figure 6.1), nodes are typically configured to report energyreadings once per minute via UDP to a simple Python application daemon running on adatabase server. Each UDP packet includes the energy used in the previous minute as wellas the average, minimum, and maximum instantaneous power observed during the sameinterval. The daemon parses the UDP packets, extracts the relevant readings, timestampsthe data, checks for duplicate data, and inserts the readings into a MySQL database.
This application architecture marks a departure from interacting with the sensor networkin the aggregate only, to interacting with the individual nodes themselves as IP endpoints.This approach provides an opportunity to leverage standard networking tools and librarieslike ping, wireshark, and netcat to monitor the nodes, debug networking problems, andbuild applications.
As a collection of IP end-points, it is straightforward to introduce traditional proxies forproviding additional functionalities. While we have fully implemented sMAP on individual
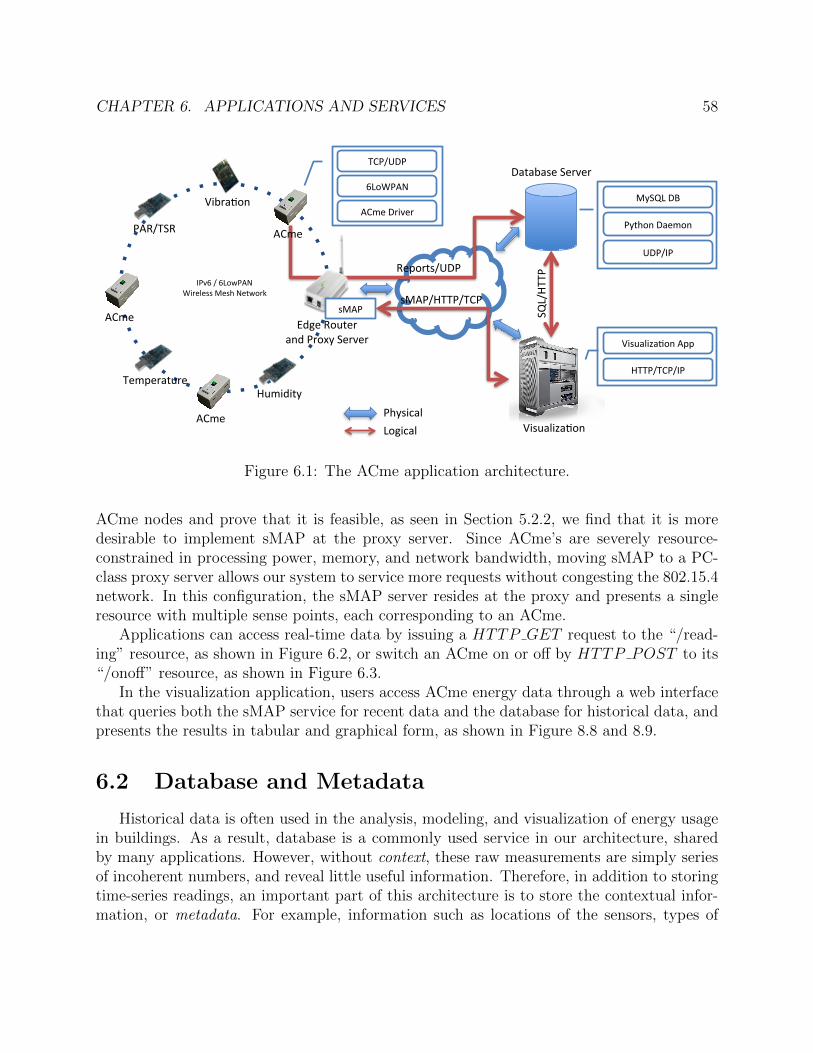
CHAPTER 6. APPLICATIONS AND SERVICES 58
!"#$%&%$'()"*+%,-./0/11%2/13%+/4)(.5%
*67/%
8-9.:;(<%
=/7>/.:4?./%
*67/%
*67/%
@?7-A-4B%
CAD/%E(?4/.%:<A%".(FB%G/.#/.%
8-1?:0-H:;(<%
"*E&=GE%
12*"%
*67/%I.-#/.%
$'(,"*+%
@=="&=6"&!"%
8-1?:0-H:;(<%*>>%
I:4:9:1/%G/.#/.%
"B43(<%I:/7(<%
2BGJ'%IK%
LI"&!"%
=6"&LI"%
E/>(.41&LI"%
12*"&@=="&=6"%
"3B1-M:0%
'(D-M:0%
GJ'&@=="%
Figure 6.1: The ACme application architecture.
ACme nodes and prove that it is feasible, as seen in Section 5.2.2, we find that it is moredesirable to implement sMAP at the proxy server. Since ACme’s are severely resource-constrained in processing power, memory, and network bandwidth, moving sMAP to a PC-class proxy server allows our system to service more requests without congesting the 802.15.4network. In this configuration, the sMAP server resides at the proxy and presents a singleresource with multiple sense points, each corresponding to an ACme.
Applications can access real-time data by issuing a HTTP GET request to the “/read-ing” resource, as shown in Figure 6.2, or switch an ACme on or off by HTTP POST to its“/onoff” resource, as shown in Figure 6.3.
In the visualization application, users access ACme energy data through a web interfacethat queries both the sMAP service for recent data and the database for historical data, andpresents the results in tabular and graphical form, as shown in Figure 8.8 and 8.9.
6.2 Database and Metadata
Historical data is often used in the analysis, modeling, and visualization of energy usagein buildings. As a result, database is a commonly used service in our architecture, sharedby many applications. However, without context, these raw measurements are simply seriesof incoherent numbers, and reveal little useful information. Therefore, in addition to storingtime-series readings, an important part of this architecture is to store the contextual infor-mation, or metadata. For example, information such as locations of the sensors, types of
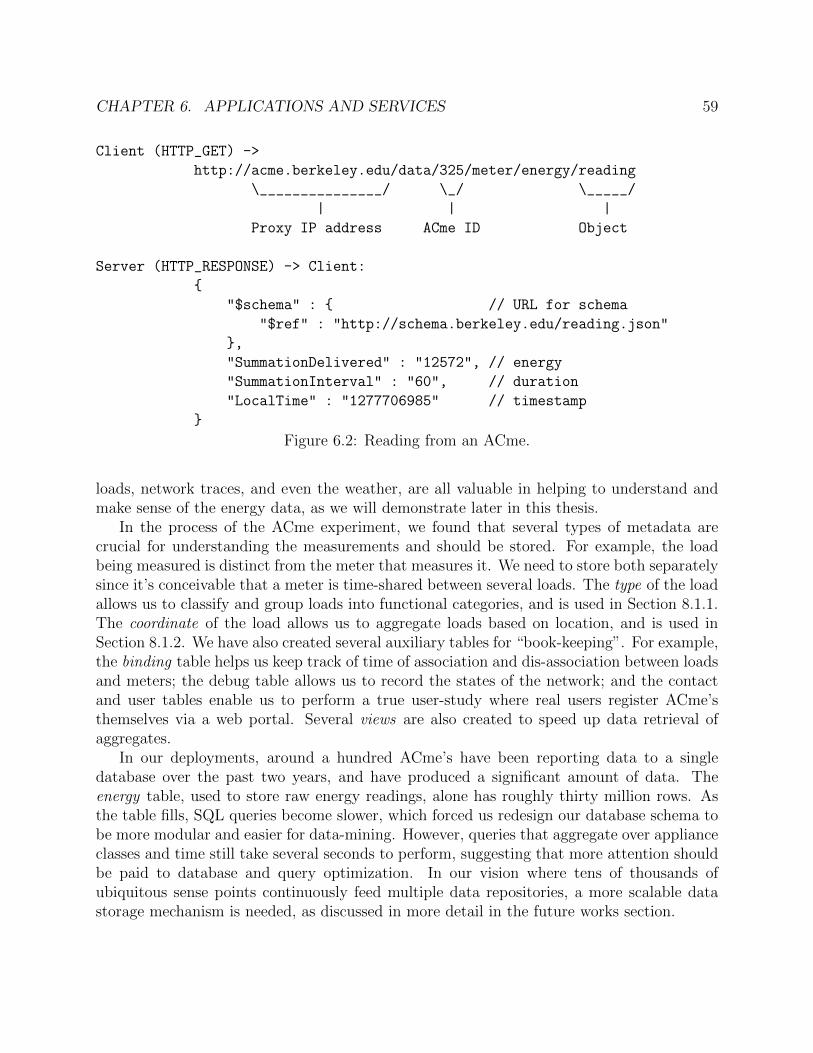
CHAPTER 6. APPLICATIONS AND SERVICES 59
Client (HTTP_GET) ->http://acme.berkeley.edu/data/325/meter/energy/reading
\_______________/ \_/ \_____/| | |
Proxy IP address ACme ID Object
Server (HTTP_RESPONSE) -> Client:
"$schema" : // URL for schema"$ref" : "http://schema.berkeley.edu/reading.json"
,"SummationDelivered" : "12572", // energy"SummationInterval" : "60", // duration"LocalTime" : "1277706985" // timestamp
Figure 6.2: Reading from an ACme.
loads, network traces, and even the weather, are all valuable in helping to understand andmake sense of the energy data, as we will demonstrate later in this thesis.
In the process of the ACme experiment, we found that several types of metadata arecrucial for understanding the measurements and should be stored. For example, the loadbeing measured is distinct from the meter that measures it. We need to store both separatelysince it’s conceivable that a meter is time-shared between several loads. The type of the loadallows us to classify and group loads into functional categories, and is used in Section 8.1.1.The coordinate of the load allows us to aggregate loads based on location, and is used inSection 8.1.2. We have also created several auxiliary tables for “book-keeping”. For example,the binding table helps us keep track of time of association and dis-association between loadsand meters; the debug table allows us to record the states of the network; and the contactand user tables enable us to perform a true user-study where real users register ACme’sthemselves via a web portal. Several views are also created to speed up data retrieval ofaggregates.
In our deployments, around a hundred ACme’s have been reporting data to a singledatabase over the past two years, and have produced a significant amount of data. Theenergy table, used to store raw energy readings, alone has roughly thirty million rows. Asthe table fills, SQL queries become slower, which forced us redesign our database schema tobe more modular and easier for data-mining. However, queries that aggregate over applianceclasses and time still take several seconds to perform, suggesting that more attention shouldbe paid to database and query optimization. In our vision where tens of thousands ofubiquitous sense points continuously feed multiple data repositories, a more scalable datastorage mechanism is needed, as discussed in more detail in the future works section.

CHAPTER 6. APPLICATIONS AND SERVICES 60
Client (HTTP_POST) ->http://acme.berkeley.edu/data/325/actuator/switch/onoff
\_______________/ \_/ \___/| | |
Proxy IP address ACme ID ObjectWith JSON object:
"$schema" : // URL for schema
"$ref" : "http://schema.berkeley.edu/onoff.json","Onoff" : "on", // turn on"LocalTime" : "1277707345" // timestamp
Figure 6.3: Actuating an ACme.
6.3 Summary
Our architecture enables developers to write cross-platform building applications muchlike web application. The ACme application uses the familiar N-tier model with metersexpressed as simple data feeds.
The ACme application and the database service are only two instances of a diverseset of applications that can be built on top of this architecture. In fact, for the rest ofthis thesis, we focus on services, tools, and applications for a particular purpose – reducingenergy consumption in buildings.
Visualizing where energy is consumed in real-time and at different granularities is valu-able for both building managers and occupants alike, and is an important step for enablingvoluntary energy reduction. We have implemented several applications on top of this archi-tecture for visualizing energy data, including web based plotting engines and adapters forexternal resources such as Google PowerMeter. We refer the reader to Chapter 8, and inparticular Sections 8.2 and 8.3, for a more detailed description.

61
Chapter 7
Analysis and Modeling
7.1 Structure of Energy Flows
Energy is distributed through a building as various subflows in a tree-like structure –the load tree – as shown in Figure 7.1. Visibility into the load tree is fundamental tounderstanding how energy is distributed and used within a building. In an ideal world,we would have full and detailed coverage of the load tree by directly monitoring not onlythe root of the tree, but also every single load at the leaves of the tree. However, this israrely possible. In reality, people are often faced with a tradeoff between full coverage anddetailed but partial coverage. A small number of instrumentation points close to the root ofthe tree provides a complete, albeit aggregated, picture of the entire building. This level ofvisibility is common for many buildings, and is an appropriate extent of coverage for mostbuilding managers. Appliance-level metering such as that provided by plug-load metersprovides detailed power profiles of individual loads. This level of visibility is appropriate forunderstanding the energy consumption at the appliance level.
To ground the discussion in the remainder of this paper, we review key aspects of theload tree used in our case study. The load tree begins at the root where a single high-voltagepower line connects the building to its parent substation. This line delivers power to theentire building. The incoming power is typically stepped-down into several high and lowvoltage lines, distributing 3-phase AC power into sets of electrical panels across multiplefloors. The low voltage panels distribute 120V/208V 3-phase power and the high voltagepanels distribute 277V/480V 3-phase power. Panels are normally divided by location andfunction. For example, in Figure 7.1, there are two low voltage panels, one for the machineroom and one for supplying all the AC outlets in the northwest region of the 4th floor. Thereare also two high voltage panels, one for all the overhead lights and one for the fans.
From the panels, 3-phase power is fanned out into multiple 2-phase or 3-phase breakers,depending on need. In our example, the northwest region panel splits into thirty 2-phasebreakers, with each breaker supplying multiple single-phase AC outlets (labeled as power
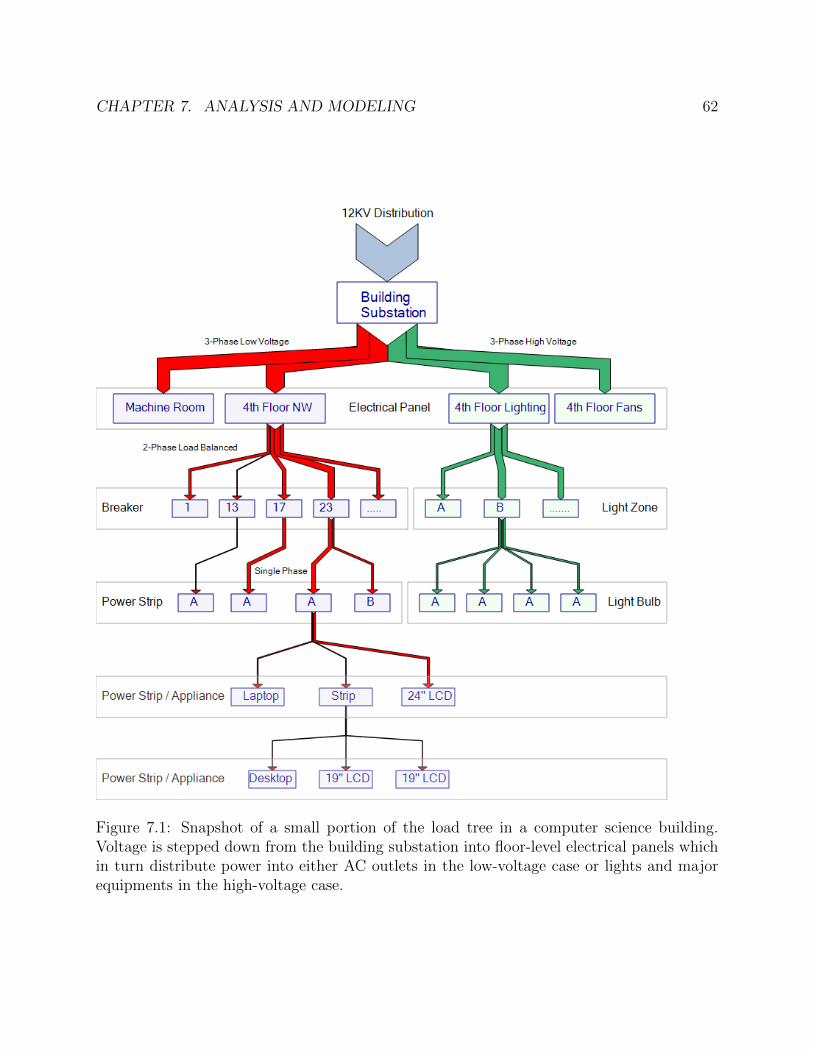
CHAPTER 7. ANALYSIS AND MODELING 62
Figure 7.1: Snapshot of a small portion of the load tree in a computer science building.Voltage is stepped down from the building substation into floor-level electrical panels whichin turn distribute power into either AC outlets in the low-voltage case or lights and majorequipments in the high-voltage case.

CHAPTER 7. ANALYSIS AND MODELING 63
strips), spread throughout the physical space in a balanced fashion. Power strips are chainedto establish more levels in the load tree. The lighting panel fans out into multiple light zonesin which all lights in the same zone are turned on and off simultaneously, using one ormore switches. Within a particular light zone, light bulbs of varying wattages are combinedtogether to provide an appropriate lighting level.
7.2 Modeling and Disaggregation
A substantial challenge in constructing a high-fidelity electricity measurement networkis that we have neither the ability nor the budget to measure every device. To address thisshortcoming, we instead create models of the behavior of each type of appliance by usingmeasured data of similar devices. In this section, we describe strategies that use multi-modal data collected throughout our network to construct accurate appliance electricityconsumption models, enabling us to infer consumption of unmetered devices.
A model of appliance behavior is only as good as the data collected to support thatmodel; however, there are often multiple ways to measure the usage of a single appliance.For example, the electrical consumption of a refrigerator can be obtained in a variety of ways– directly measured using a power meter, estimated using a log of door opening events or atime-series of internal light measurements, or inferred through a record of proximity eventswhere people in the vicinity of the refrigerator imply increased consumption, for example.In each of these cases, the sensors are capturing different phenomena that describe the sameunderlying behavior, namely the electricity consumption of a refrigerator. Thus, to beginour appliance modeling, we examine some fundamental questions concerning sampling: whatbehavior of the appliance should be measured? How often should we sample to capture thespecific phenomena we are interested in observing? In this section, we first explore howvarious sample window strategies affect the conclusions we reach.
We continue by presenting multiple strategies for constructing appliance models, includ-ing using empirical measurements to calculate average energy consumption by minute, hour,and day, accounting for the behavior of individual components at the sub-appliance level(within a machine), and substituting alternate sensors to infer the consumption of electricityof loads that are not easily measured directly. For each of these cases, we show an instanceof applying our strategy using data collected by our network, and discuss the applicability ofthese strategies to other scenarios. However, we emphasize that these strategies themselvesare not novel – we simply employ them to study the traditional systems questions of coverageand fidelity in the context of a multi-modal electricity monitoring network.
7.2.1 Additivity
Like all flow graphs, an intrinsic property of energy load trees is additivity - the sum ofthe power of children nodes equals the power of the parent. For example, Figure 7.2 shows a

CHAPTER 7. ANALYSIS AND MODELING 64
Figure 7.2: The power that flows through power strip A is the sum of the power consumedby the laptop, the 24” LCD, and the sub-power-strip. We can calculate the power at C1 bysimply subtracting M2 and M3 from M1.
branch of the load tree with breaker 23 as the root. The total power flowing out of breaker23 is the sum of the power drawn by power strips A and B; the power through power stripA is the sum of a laptop, a sub-power-strip and a 24” LCD screen.
Intuitively, this allows us to increase coverage by summing all the children, given thatmeasurements are available for all of them, or increase fidelity by calculating the differencebetween a measured parent node and measured children nodes. In Figure 7.2, if we placemeter M1, M2, and M3 at power strip A, the laptop, and the sub-power-strip respectively,we can calculate the power of the 24” LCD using simple subtraction. In practice, M1, M2,and M3 perform power measurements according to their own clock, and will produce read-ings that are not synchronized. One solution to address this issue is to perform networksynchronization and time-stamp each measurement, at the cost of additional network band-width and energy; alternatively measurements can be time-stamped at the collection point,with less accuracy. In either case, power traces from different meters are usually shifted inphase and often differ slightly in periodicity, in addition to holes in the data. As a result,before computing differences or sums, we need to first clean up the data by resampling it,which can be easily done post hoc. Figure 7.3 shows both measured and calculated power ofa student’s desk appliances for 5 hours. The load tree for this student is shown in Figure 7.2,

CHAPTER 7. ANALYSIS AND MODELING 65
0 1 2 3 4 50
50
100
150
200
250
300
350
Time (hour)
Pow
er (w
atts
)Power usage breakdown over 5 hours
M1: Power strip A (total)M2: LaptopM3: Sub strip (desktop, 19’’ LCDx2C1: Difference (24’’ LCD)
Figure 7.3: The power profile of a 24” LCD can be calculated by subtracting both the laptopmetered at M2 and the sub-power-strip metered at M3 from the power strip A, metered atM1. At 1.5hr, the desktop and two 19” LCDs are turned on, using an additional 200W seenby M3 and M1 for about 20 minutes. At 2.5hr, the laptop was removed from the workspace,reducing M2 to 0W. The 24” LCD drops into standby mode after being disconnected fromthe laptop, drawing around 10W via subtraction.
rooted at power strip A. We can observe from this figure that the 24” LCD is not connectedto the desktop but to the laptop, since its power drops from 80W to 10W when the laptopis disconnected momentarily at 2.5hr.
While applying this technique is straight-forward, it only works when all N-1 nodes aredirectly measured in a size N parent-children set. However, if the number of metered nodesis less than N-1, in the absence of any other disaggregation techniques, any configuration ofmetering is equivalent and results in the same degree of visibility.
What is perhaps a more powerful result of additivity is that one can freely combine asubset of children belonging to the same parent into a new subtree in the graph withoutchanging its flows. Physically this corresponds to inserting a power strip to a parent outletand connecting some subset of devices plugged into the outlet to the new power strip. Thisallows us to instrument the aggregate power trace of the newly formed subtree rooted at the

CHAPTER 7. ANALYSIS AND MODELING 66
new power strip. In Figure 7.2, the desktop and two 19” LCDs can be thought as originallybelonging to power strip A (measured by M1); a new power strip is inserted to create thecurrent subtree, measured by M3. This gives us more flexibility in choosing what combinationof loads to monitor in aggregate. We can separate devices with similar signatures and grouptogether devices with easily detectable signatures, for optimal disaggregation, as describedby [44], [56], and [27].
7.2.2 Multi-resolution
0 4 8 120
1000
2000Transient Response of the Refrigerator (4Hz Sampling Rate)!Fig (A)
Time (seconds))
Po
we
r
8AM 9AM 10AM 11AM 12PM 1PM 2PM0
200
400Sampled Every Minute (March 7th 8AM!2PM)!Fig (B)
Time
Po
we
r
1AM 4AM 7AM 10AM 1PM 4PM 7PM 10PM0
100
200Sampled Every Hour (April 1)!Fig (C)
Time
Po
we
r
Figure 7.4: Sampling rate top to bottom: 4Hz, minute sampling, hourly sampling. (A) re-veals the turn-on transient; (B) reveals the compressor and defrost modes of the refrigerator;and (C) reveals the human influence.
Certain features of a particular device can only be seen at certain resolutions. Usingthe power profile of a refrigerator as an example, shown in Figure 7.4, different resolutionsreveal different stories. Figure 7.4 (B), at a resolution of one sample per minute, clearlyshows two intrinsic characteristics or modes of the refrigerator - the compressor kicks inabout every 15 minutes while the defrost cycle has a period of around 1 hour. If we zoom in

CHAPTER 7. ANALYSIS AND MODELING 67
to the turn-on transition and view at a resolution of 4Hz, as shown in Figure 7.4 (A), we canobserve a spike of more than 1000 watts. This observation, which is potentially importantfor load disaggregation algorithms, would have been lost at the minute resolution. If we stepback and view its load profile at an hourly resolution, we start to see human influence inthe refrigerator’s energy usage. The increase in energy consumption around 1PM and 8PMindicates increased usage during lunch and dinner. In some sense, the refrigerator becomesan instrument for characterizing the daily “power” profile of people.
It is clear that each graph reveals a different story about the refrigerator’s power usage byobserving it at a particular resolution. Therefore, we need to choose an appropriate resolu-tion, sampling, filtering, and smoothing windows to both preserve the power characteristicsof the device, as well as provide clarity to the human who observes and analyzes the data.
7.2.3 Empirical Model
To construct models of devices that are not measured, we average the time-series ofdevices that are measured. These measured devices are of three varieties: (1) loads measureddirectly, (2) loads calculated using the additivity method described in Section 7.2.1, and (3)loads calculated using measured power strips. We describe each of these in turn.
The first variety is the simplest - measurements are provided directly from AC metersconnected to similar devices throughout the network. Since the electricity data are recordedevery minute, that is the minimum granularity of our power models, though in practice weuse hourly consumption in our calculations.
Next we find each device whose power is not directly measured by an AC meter, butcan be calculated because all of the other devices in its subtree are measured directly. Wecall this a constrained subtree. By leveraging the hierarchical nature of load trees, we cansubtract to find the consumption of this type of device. Together with the directly measureddevices of the same type, these measurements combine to form the baseline core power modelfor each appliance type.
The final step in creating individual device power models, called the proportional scalingstep, is to find those devices that have a parent appliance measured but are not part ofa constrained subtree (e.g. multiple unmeasured appliances connected to a power stripinstrumented with an AC meter). In this type of case, we begin with the core power modelfor each appliance. We then proportionally scale the estimate of the unmeasured devicesby using the available aggregate measurement from the parent device – that is, we scaledwhat we would expect from the composition of the unmeasured devices by what we haveactually measured at the power strip. Figure 7.5 shows a core model and scaled model forfour specific appliances in our deployment. If aggregate measurements are unavailable for adevice, we use only the core power model for that appliance.
After this process, we arrive at models for each appliance in the system that incorporateas much relevant empirical data as possible – devices not measured are a composition ofmeasured devices of similar type, while devices that are measured indirectly additionally

CHAPTER 7. ANALYSIS AND MODELING 68
0 4 8 12 16 200
20
40
60
8049 − lcd24
Pow
er (W
)
0 4 8 12 16 200
5
10
15
20
25
30133 − laptop
0 4 8 12 16 200
5
10
15
2094 − lcd17
Hour
Pow
er (W
)
0 4 8 12 16 200
10
20
30
40118 − laptop
Hour
ScaledCore Model
Figure 7.5: Result of calculating an improved empirical model using proportional scalingfrom a measured aggregate. By using upstream power measurements in addition to genericmodels of appliance behavior by type (“core power models”), models for specific appliancescan be augmented to incorporate device-specific measurements. Here we look at a 24” LCD,a 17” LCD, and two laptops.
reflect those measurements. We use these individual appliance models as the basis for theoffice-wide composition models throughout this paper.
7.2.4 Appliance Signature Analysis
Modern electronic devices are a composition of many sub-components. These multi-component, multi-state devices have distinguished power traces per state that uniquelyidentifies them. This leads to the conjecture that perhaps the natural level of disaggre-gating a load tree is not at the appliance level but at the sub-components of the appliance.Figure 7.6 (A) shows the power trace of the laptop. We can pull out two components –the charging curve of its battery, as modeled in Figure 7.6 (B), and the rest of the laptopconsisting primarily of the CPU, LCD, and fans, as shown in Figure 7.6 (C). In this case,

CHAPTER 7. ANALYSIS AND MODELING 69
we model the laptop charging curve as an exponential decay with formula shown in Equa-tion 7.1. This may aid in disaggregating the laptop power because now we have a genericmodel for the sub-components of this type of laptop.
10AM 11AM 12PM 4PM 5PM 6PM 7PM 8PM0
50Enveloping Total Power of Laptop!Fig (A)
Time
Po
we
r (W
att
s)
10AM 11AM 12PM 4PM 5PM 6PM 7PM 8PM0
10
20
30Battery Charging Model!Fig (B)
Time
Pow
er
(Watts)
10AM 11AM 12PM 4PM 5PM 6PM 7PM 8PM0
20
40Laptop Others (CPU,LCD,Fan,etc)!Fig (C)
Time
Pow
er
(Watts)
Figure 7.6: Laptop energy consumption disaggregation at the sub-component level.
26.33× e−3.366×10⁻²(x+4) + 12.33e−7.217×10⁻⁴(x+4) − 10.48 (7.1)
Additionally, devices that exhibit daily patterns in their power traces allow for creationof accurate models of daily consumption from historical data, precluding the need to metersuch devices. In Figure 7.7, we see the power consumption of the Water Dispenser overthe same day of the week for three weeks, excluding the week of spring vacation. Thoughno clear pattern exists, a rough average can be extracted from Figure 7.7 (B), which showsthe daily human influence on the device’s power trace. However, looking at the cumulativegraph of Figure 7.7 (C), a clear correlation in the cumulative power consumption of eachWednesday emerges.
The fundamental fact is that the power trace of an appliance is the superposition of powertraces of multiple sub-components within that appliance. In the case of a laptop, the power

CHAPTER 7. ANALYSIS AND MODELING 70
1AM 4AM 7AM 10AM 1PM 4PM 7PM 10PM0
500Daily Power of Water Dispenser on 3/11, 3/18, 4/1!Fig (A)
Watts (
Raw
)
1AM 4AM 7AM 10AM 1PM 4PM 7PM 10PM0
200
400Fig (B)
Watts (
Sm
ooth
ed)
1AM 4AM 7AM 10AM 1PM 4PM 7PM 10PM0
1
2x 10
5
TimeWatts (
Cum
ula
tive)
Fig (C)
Week 1
Week 2
Week 3
Figure 7.7: Water dispenser daily energy consumption over the same day of the week forthree weeks. Notice the general trend in power consumption in (B) as well as in (C).
trace of the charge and discharge state of its battery, the CPU, and the LCD can be modeledseparately; therefore, the most basic unit of disaggregation may not be the appliance, butactually the functional units within it. Moreover, the process of inference and disaggregationinvolves identifying not only the patterns within the device, but also the effects of humaninteraction with the device.
7.3 Summary
Techniques such as additivity, multi-resolution, and appliance signatures represent someof the analyses possible with high-fidelity per-appliance data, and reveal interesting phe-nomenons of either the appliance itself of the human behind it.
But more importantly, we show that using detailed measurements of a subset of moni-

CHAPTER 7. ANALYSIS AND MODELING 71
tored appliances, we can create empirical time-series based models for classes of appliances.While this idea is not novel, our approach is different from others in that our models arecontinuously updated in real-time, as opposed to static traces stored in a database. Thisapproach allows us to model the time-varying nature of actual consumptions of individualappliances with reasonable accuracy. Furthermore, our approach uses empirical measure-ments at aggregate points in the load tree (such as power strip and panel level data) to scaleindividual appliance models proportionally, which bonds the error and results in accurateaggregate usage statistics as well. This method is also scalable, and becomes increasinglymore accurate as more sensors are installed.
While using these models to infer real-time consumptions of unmetered devices is still farfrom ideal, this approach results in usage statistics, empirical or modeled, of all the end-uses,and can be re-aggregate at will to create interesting views. In this sense, modeling increasesthe coverage, but at lower fidelity than what would be possible with a real meter.

72
Chapter 8
Feedback
8.1 Re-aggregation
Disaggregating the load tree down to its leaves - the individual loads - gives us thebasic building block from which we can recompose according to other grouping criteria. Re-aggregation allows one to better understand the data, identify areas for improvement, andcreate more actionable forms of visualization.
In this section, we present three ways to recompose our computer science building loadtree - by function, by space, and by individual. Functional re-aggregation recomposes theload tree by function. For example, in our initial load tree in Figure 7.1, we can group allthree LCDs into one functional group - LCD, and the laptop with other students’ laptops intoanother group - laptop, and so forth. This is arguably the most natural form of recomposinga load tree - a direct regrouping of leaves according to their function. Spatial re-aggregationrecomposes devices based on where they are. This allows us to answer questions such as“Which room uses the most energy?” or “What is the energy consumption of the machineroom?” Unlike the functional re-aggregation, the unit of recomposition is often higher in theload tree, such as power strips or even circuit breakers. However, for some devices that areshared in space such as lights, one might need to subdivide it based on what proportion of itis illuminating a unit of space. Individual re-aggregation recomposes the loads by personalusage. For most appliances in an office, it is a simple one-to-one correspondence, but for someshared appliances such as refrigerators and lights, they should be attributed proportionallyto different individuals over time based on some definition of usage.
To enable functional, spatial, and individual re-aggregations, we perform a detailed surveyof a portion of the 4th floor, as shown in Figure 4.11. We associate meta-data with eachdevice in a database, such as its type of appliance, where it is, and to whom it belongs.The number of loads and sensors are shown in Table 8.1. We apply techniques described inSections 7.2 to disaggregate the load tree into 96 appliances, each with average hourly powerconsumptions over a day, some directly measured and some inferred.

CHAPTER 8. FEEDBACK 73
Category CountsRooms and cubicles 6
Students 28Appliances 96
Lights 26AC Meter 19
Light sensors 4
Table 8.1: Survey of densely instrumented region, depicted in Figure 4.11.
8.1.1 Functional Re-aggregation
Functional re-aggregation groups together loads that are of similar type. This type ofaggregation is useful in studying characteristics for a particular load class, finding trends,and making comparisons between load classes. This view also helps in validating the effectsof a targeted energy reduction effort by looking at the aggregate power of a particular loadclass over time.
For example, Figure 8.1 shows a small portion of the load tree that includes four differentfunctions or load classes - laptop, desktop, LCD, and light. Using techniques described inthe previous sections, we disaggregate the load tree into individual loads (leaves of the tree),albeit with varying degrees of accuracy. With meta-data associated with each load, in thiscase the function, we re-aggregate by simply summing across functions. Other statisticsover these functional groups such as average and variance are often useful for understandingcharacteristics of loads as well.
By grouping 96 appliances and 26 lights into four functional classes, we can observe theirrespective contribution to the total load and their tread over the course of a day, as shown inFigure 8.2. We see that desktops are by far the largest energy consumer, accounting for morethan half of the total energy. Furthermore, they stay on regardless of the time of day. Usingfunctional re-aggregation, we identify that students and professors fail to turn off desktopsafter leaving the lab, wasting approximately 30kWh of energy every day. In comparison,laptops are much more efficient, using only 5% of total energy. Lighting power consumptionis also very revealing. During the day, it remains at peak usage, as one might expect sincemost office buildings do not adjust lighting level based on ambient light. However, from thisfigure, we see that lights remain at maximum power from hour 20 until midnight (and likelylater if we choose a longer view) even when there is very little computer usage, as evidencedby the minimal LCD power. This shows us that either the time out for the light auto-shutoff(triggered by the motion sensors) is longer than the periodicity of human movement at night,or that one or two students are keeping all the lights on. The power consumption of LCDsseems to track laptops fairly accurately, showing that in this laboratory, most students and
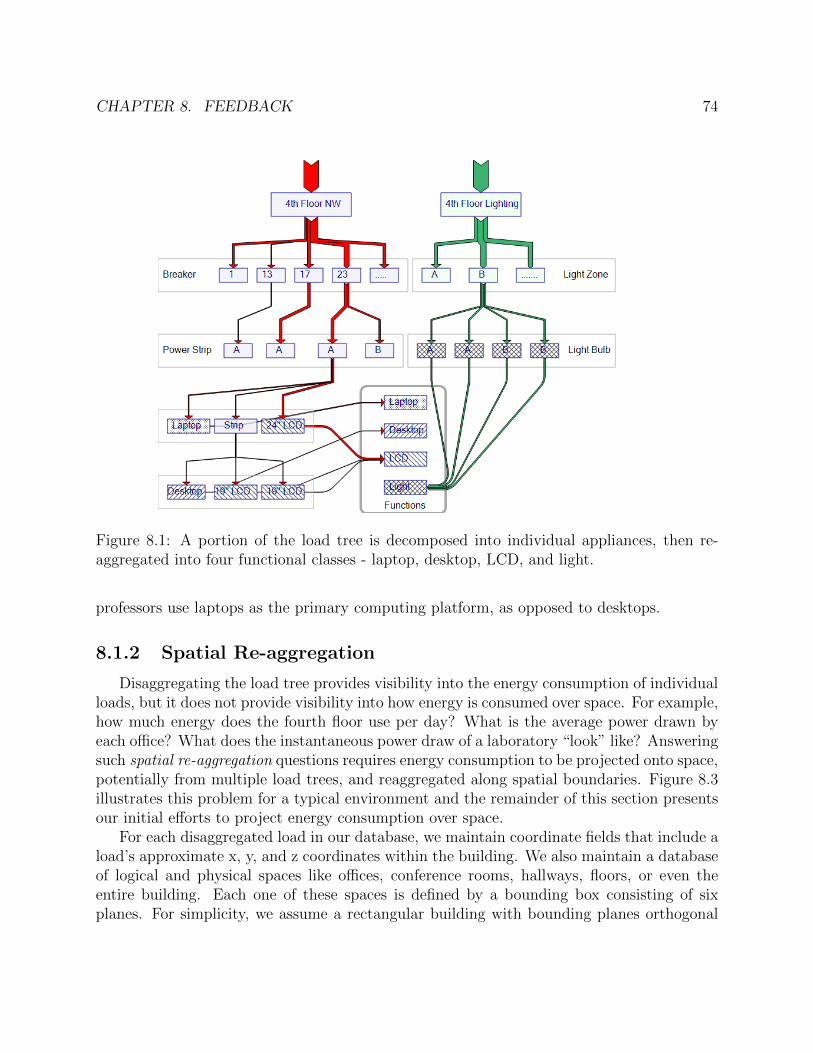
CHAPTER 8. FEEDBACK 74
Figure 8.1: A portion of the load tree is decomposed into individual appliances, then re-aggregated into four functional classes - laptop, desktop, LCD, and light.
professors use laptops as the primary computing platform, as opposed to desktops.
8.1.2 Spatial Re-aggregation
Disaggregating the load tree provides visibility into the energy consumption of individualloads, but it does not provide visibility into how energy is consumed over space. For example,how much energy does the fourth floor use per day? What is the average power drawn byeach office? What does the instantaneous power draw of a laboratory “look” like? Answeringsuch spatial re-aggregation questions requires energy consumption to be projected onto space,potentially from multiple load trees, and reaggregated along spatial boundaries. Figure 8.3illustrates this problem for a typical environment and the remainder of this section presentsour initial efforts to project energy consumption over space.
For each disaggregated load in our database, we maintain coordinate fields that include aload’s approximate x, y, and z coordinates within the building. We also maintain a databaseof logical and physical spaces like offices, conference rooms, hallways, floors, or even theentire building. Each one of these spaces is defined by a bounding box consisting of sixplanes. For simplicity, we assume a rectangular building with bounding planes orthogonal

CHAPTER 8. FEEDBACK 75
!"#$%&'(
)*+(,-./%(
01+(
,2'%&'(
)+(
,3!(
*)+(
4(
*(
0(
5(
6(
)(
7(
8(
*( 5( )( 8( 1( **( *5( *)( *8( *1( 0*( 05(
!"#$%&'()*&
+,-$&'."/%*&
,3!(57(
,2'%&'(06(
,-./%(07(
!"#$%&'(00(
Figure 8.2: Stacked graph of aggregate power consumption grouped by functional class overa day.
to the building walls, but the basic idea can be generalized to arbitrary-shaped boundingboxes. Computing a spatial re-aggregation is then a simple matter of filtering loads by theircoordinates.
Although coordinates provide point locations of energy consumption, in some cases theutility of an electrical load actually spans a wider physical area. Lighting, for example, canilluminate a single desk or an entire room. Heat can propagate across a room from a singlespace heater. And a projector, radio, or TV can inform or entertain all the occupants inthe room. In such cases, it can be useful to distribute the energy used by a load over spaceusing a smoothing kernel, especially if the consumption data are to be used for visualizationpurposes. Visualizing spatial energy consumption, however, presents an additional wrinkleto the problem: energy consumption in one space is often unrelated to consumption in anadjacent space. For example, a halogen lamp placed next to a wall usually illuminates onlythe room in which it is located. While it may be useful to smooth or spread such point loadsover space, indiscriminately doing so leads to unexpected and perhaps inaccurate results.
We currently visualize spatial energy consumption as follows. We begin with a blueprint-style floorplan of the space. We then create a pair of two-dimensional matrices whose ratioof rows to columns match the aspect ratio of the physical space. The actual number of rowsand columns depends on the desired spatial granularity (in our current design, each squarefoot of space is mapped to one element in the matrix). For each load in this space, we firstadd its consumption to the corresponding element in the first matrix, then run a load-specificsmoothing kernel over the matrix, then zero all elements that fall outside of the load’s nearestenclosing space (typically the surrounding walls), and finally add the resulting values to the
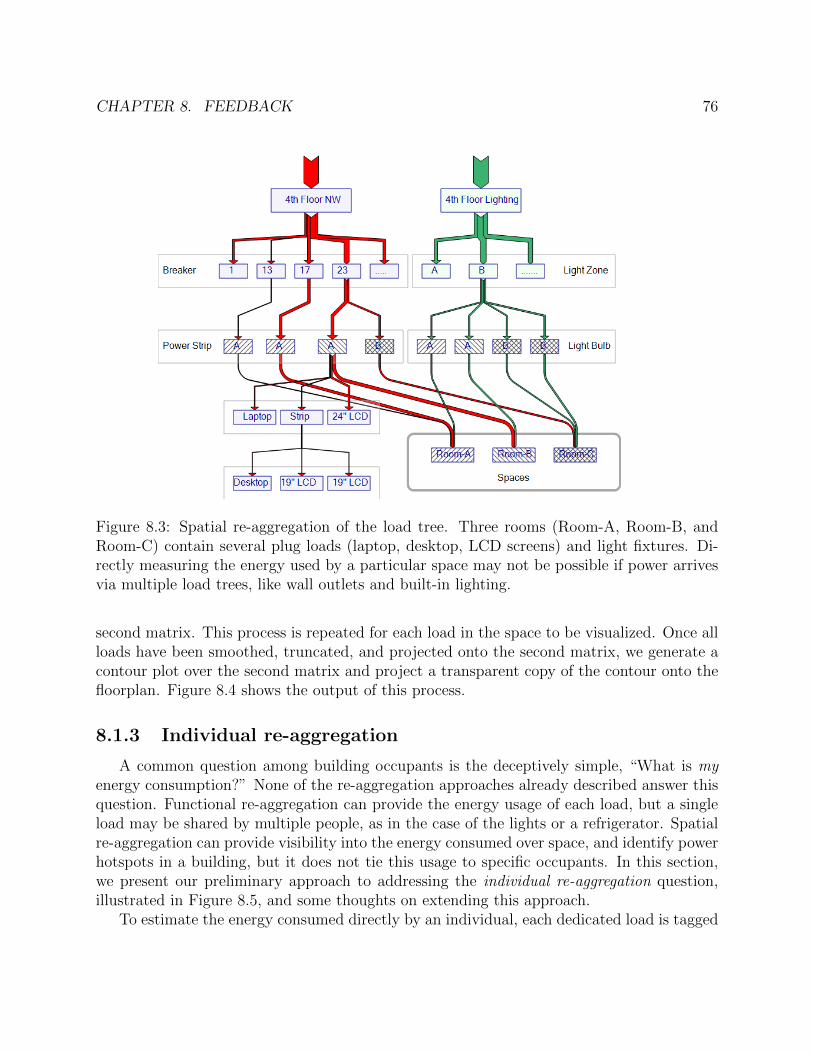
CHAPTER 8. FEEDBACK 76
Figure 8.3: Spatial re-aggregation of the load tree. Three rooms (Room-A, Room-B, andRoom-C) contain several plug loads (laptop, desktop, LCD screens) and light fixtures. Di-rectly measuring the energy used by a particular space may not be possible if power arrivesvia multiple load trees, like wall outlets and built-in lighting.
second matrix. This process is repeated for each load in the space to be visualized. Once allloads have been smoothed, truncated, and projected onto the second matrix, we generate acontour plot over the second matrix and project a transparent copy of the contour onto thefloorplan. Figure 8.4 shows the output of this process.
8.1.3 Individual re-aggregation
A common question among building occupants is the deceptively simple, “What is myenergy consumption?” None of the re-aggregation approaches already described answer thisquestion. Functional re-aggregation can provide the energy usage of each load, but a singleload may be shared by multiple people, as in the case of the lights or a refrigerator. Spatialre-aggregation can provide visibility into the energy consumed over space, and identify powerhotspots in a building, but it does not tie this usage to specific occupants. In this section,we present our preliminary approach to addressing the individual re-aggregation question,illustrated in Figure 8.5, and some thoughts on extending this approach.
To estimate the energy consumed directly by an individual, each dedicated load is tagged
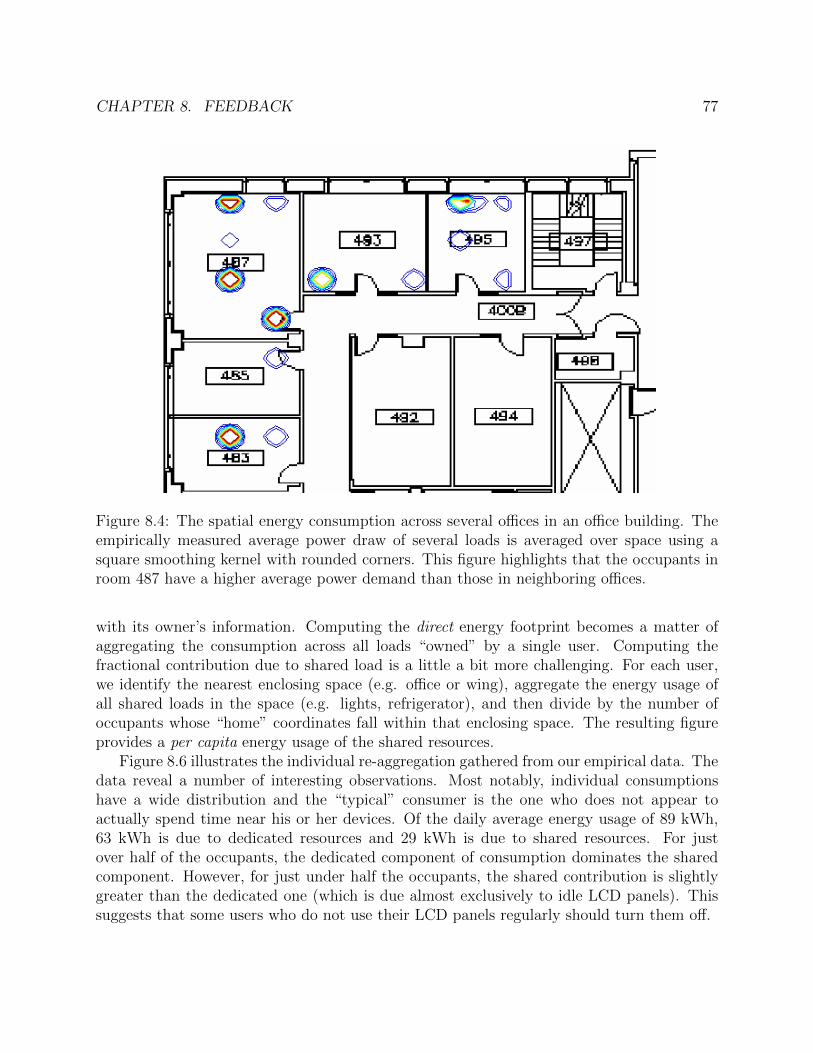
CHAPTER 8. FEEDBACK 77
Figure 8.4: The spatial energy consumption across several offices in an office building. Theempirically measured average power draw of several loads is averaged over space using asquare smoothing kernel with rounded corners. This figure highlights that the occupants inroom 487 have a higher average power demand than those in neighboring offices.
with its owner’s information. Computing the direct energy footprint becomes a matter ofaggregating the consumption across all loads “owned” by a single user. Computing thefractional contribution due to shared load is a little a bit more challenging. For each user,we identify the nearest enclosing space (e.g. office or wing), aggregate the energy usage ofall shared loads in the space (e.g. lights, refrigerator), and then divide by the number ofoccupants whose “home” coordinates fall within that enclosing space. The resulting figureprovides a per capita energy usage of the shared resources.
Figure 8.6 illustrates the individual re-aggregation gathered from our empirical data. Thedata reveal a number of interesting observations. Most notably, individual consumptionshave a wide distribution and the “typical” consumer is the one who does not appear toactually spend time near his or her devices. Of the daily average energy usage of 89 kWh,63 kWh is due to dedicated resources and 29 kWh is due to shared resources. For justover half of the occupants, the dedicated component of consumption dominates the sharedcomponent. However, for just under half the occupants, the shared contribution is slightlygreater than the dedicated one (which is due almost exclusively to idle LCD panels). Thissuggests that some users who do not use their LCD panels regularly should turn them off.

CHAPTER 8. FEEDBACK 78
Figure 8.5: Individual re-aggregation of the load tree. Three building occupants use a mixof electrical loads. Some loads, e.g. laptops or desktops, are dedicated to one user whileother loads, e.g. lights or a refrigerator are shared by some subset of the occupants. Directlymeasuring an occupant’s fractional usage may not be possible so approximation techniquesare needed.
While Figure 8.6 provides some insight into individual re-aggregations, and provides someguidance into how group usage could be reduced, it does not easily distinguish useful andwasted energy. For example, if a user is near his or her computer and actively using theLCD screen, we might call that energy consumption useful. In contrast, an LCD screen thatdisplays the screen manufacturer’s logo as a screen saver all night while the user is asleepmight be called wasted energy. Currently, we do not distinguish between these two cases.One possibility for this additional level of re-aggregation that we are currently exploringis to have users carry a wireless keyfob or amulet that listens for radio transmissions andperiodically reports the list of recently heard nodes to a server. Using this crude form oflocalization, we may then be able to further decompose individual consumption into timeswhen a load spends energy in the presence of its owner and times when it spends energy inthe absence of its owner. Additionally, by attributing energy consumption to a mobile user,we can readily calculate how an individual’s energy footprint spreads across time and space.
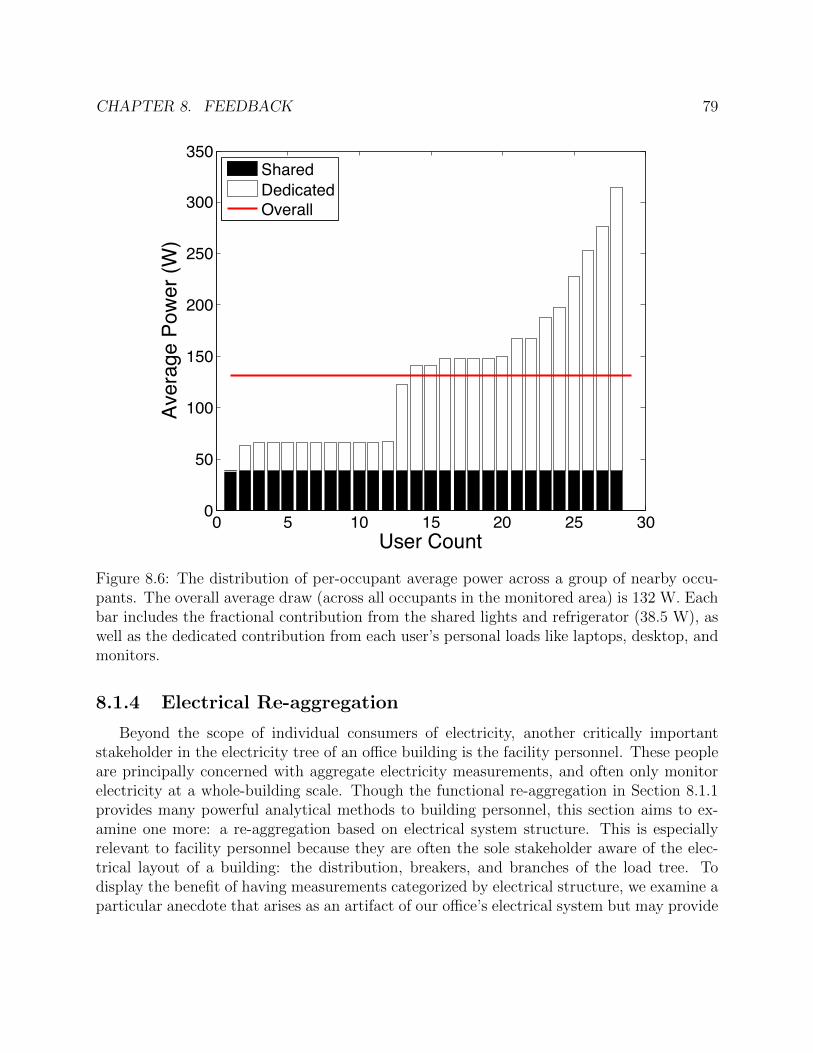
CHAPTER 8. FEEDBACK 79
0 5 10 15 20 25 300
50
100
150
200
250
300
350
User Count
Aver
age
Powe
r (W
)
SharedDedicatedOverall
Figure 8.6: The distribution of per-occupant average power across a group of nearby occu-pants. The overall average draw (across all occupants in the monitored area) is 132 W. Eachbar includes the fractional contribution from the shared lights and refrigerator (38.5 W), aswell as the dedicated contribution from each user’s personal loads like laptops, desktop, andmonitors.
8.1.4 Electrical Re-aggregation
Beyond the scope of individual consumers of electricity, another critically importantstakeholder in the electricity tree of an office building is the facility personnel. These peopleare principally concerned with aggregate electricity measurements, and often only monitorelectricity at a whole-building scale. Though the functional re-aggregation in Section 8.1.1provides many powerful analytical methods to building personnel, this section aims to ex-amine one more: a re-aggregation based on electrical system structure. This is especiallyrelevant to facility personnel because they are often the sole stakeholder aware of the elec-trical layout of a building: the distribution, breakers, and branches of the load tree. Todisplay the benefit of having measurements categorized by electrical structure, we examine aparticular anecdote that arises as an artifact of our office’s electrical system but may provide

CHAPTER 8. FEEDBACK 80
1,3,5 7,9,11 13,15,1719,21,2325,27,2926,28,30 31,33 32,34,360
50
100
150
200
250
300
350
400
450
Circuit Breaker Grouping
Aver
age
Pow
er (W
)
Figure 8.7: Per-circuit loads in our office deployment. Loads can be migrated within eachgrouping simply by moving to a different socket on the same outlet. This data could guidea building manager to improve load balancing among circuits.
guidance for future electricity re-aggregation exercises.In the office setting under study, electrical sockets are made available to people through
a series of floorboxes, where a floorbox consists of connections to all the wired services ofthe building: telephone lines, Ethernet ports, and electricity. In each floorbox, there aretwo sets of two outlets each, with each set of outlets in a particular floorbox on a differentbreaker circuit. However, the pair of breaker circuits in a floorbox is unique – that is, noother floorbox will have access to the same two circuits. Additionally, to further distributeload in the office, an individual circuit is always shared between two floorboxes, resulting ina situation of circuit triples, whereby each member of the triple shares exactly one floorboxwith each other member of the triple. This design is intended as a strategy for distributingload across the circuits; Figure 8.7 shows both the electrical load of each circuit as wellas the distribution of loads across a circuit triple. In cases where the loads on a circuittriple are extremely disparate (e.g. circuits 1, 3, and 5), distributing load can be achievedby simply relocating plug-loads from one outlet in a floorbox to another, protecting theelectrical system from overload.
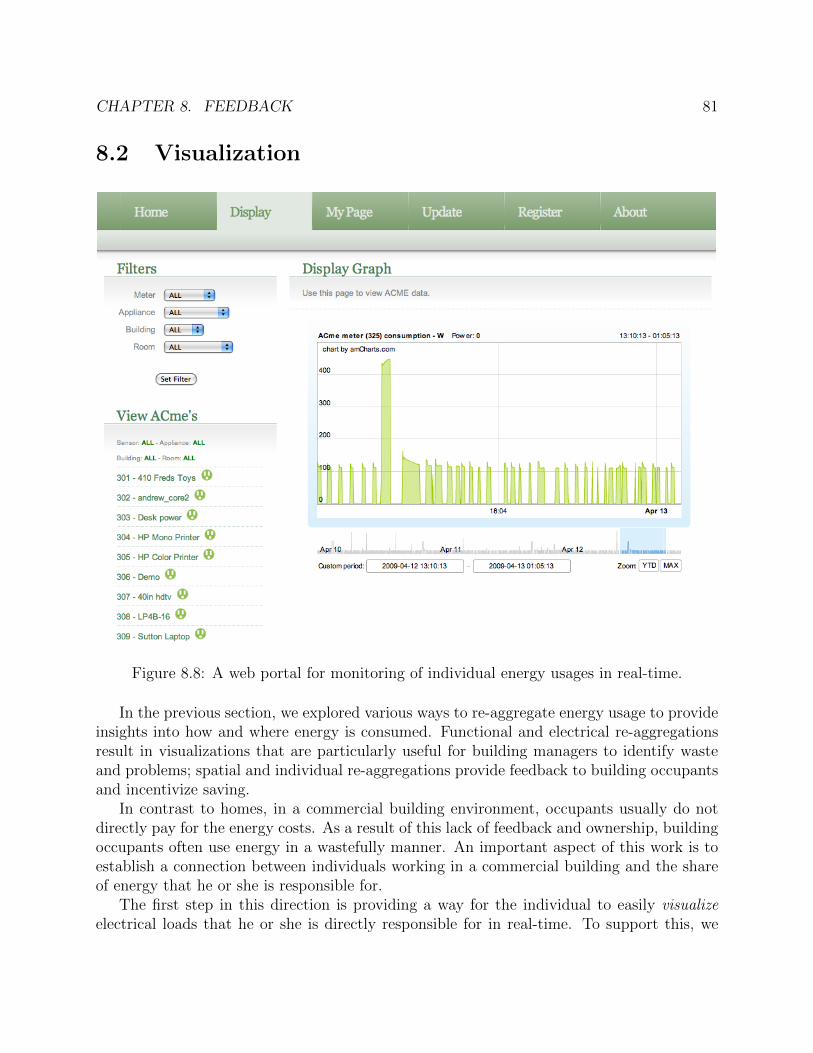
CHAPTER 8. FEEDBACK 81
8.2 Visualization
Figure 8.8: A web portal for monitoring of individual energy usages in real-time.
In the previous section, we explored various ways to re-aggregate energy usage to provideinsights into how and where energy is consumed. Functional and electrical re-aggregationsresult in visualizations that are particularly useful for building managers to identify wasteand problems; spatial and individual re-aggregations provide feedback to building occupantsand incentivize saving.
In contrast to homes, in a commercial building environment, occupants usually do notdirectly pay for the energy costs. As a result of this lack of feedback and ownership, buildingoccupants often use energy in a wastefully manner. An important aspect of this work is toestablish a connection between individuals working in a commercial building and the shareof energy that he or she is responsible for.
The first step in this direction is providing a way for the individual to easily visualizeelectrical loads that he or she is directly responsible for in real-time. To support this, we
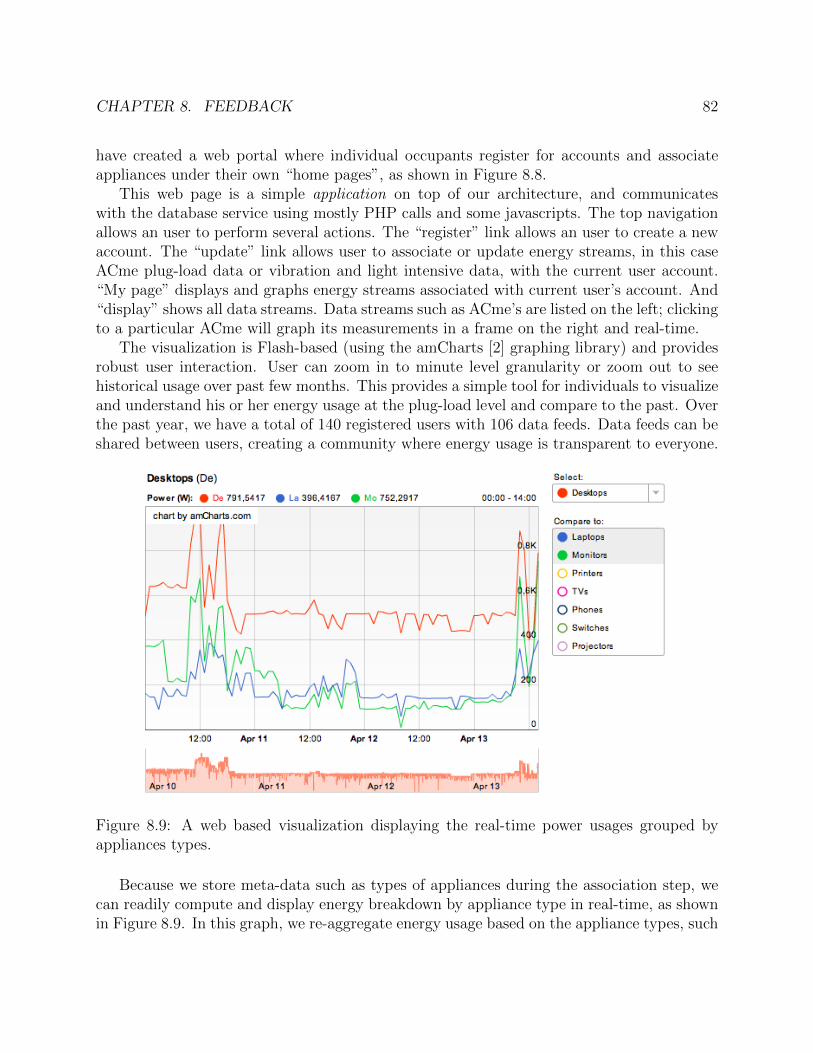
CHAPTER 8. FEEDBACK 82
have created a web portal where individual occupants register for accounts and associateappliances under their own “home pages”, as shown in Figure 8.8.
This web page is a simple application on top of our architecture, and communicateswith the database service using mostly PHP calls and some javascripts. The top navigationallows an user to perform several actions. The “register” link allows an user to create a newaccount. The “update” link allows user to associate or update energy streams, in this caseACme plug-load data or vibration and light intensive data, with the current user account.“My page” displays and graphs energy streams associated with current user’s account. And“display” shows all data streams. Data streams such as ACme’s are listed on the left; clickingto a particular ACme will graph its measurements in a frame on the right and real-time.
The visualization is Flash-based (using the amCharts [2] graphing library) and providesrobust user interaction. User can zoom in to minute level granularity or zoom out to seehistorical usage over past few months. This provides a simple tool for individuals to visualizeand understand his or her energy usage at the plug-load level and compare to the past. Overthe past year, we have a total of 140 registered users with 106 data feeds. Data feeds can beshared between users, creating a community where energy usage is transparent to everyone.
Figure 8.9: A web based visualization displaying the real-time power usages grouped byappliances types.
Because we store meta-data such as types of appliances during the association step, wecan readily compute and display energy breakdown by appliance type in real-time, as shownin Figure 8.9. In this graph, we re-aggregate energy usage based on the appliance types, such

CHAPTER 8. FEEDBACK 83
as “desktops”, “laptops”, “monitors”, and etc. The user can select which types to graph andcompare to. Because multiple users could access this page simultaneously and at fast rate,we need a way to cache the computed data for this graph. To reduce load, a simple cron jobruns once every minute and computes the aggregate electrical usage based on appliance typeand stores the results in a database table. This application represent yet another simpleapplication implemented on top of our architecture. This view allows occupants to visualizetheir collective effect on energy usage and identify top energy consuming appliances.
Figure 8.10: A live Sankey diagram showing the energy flows in the building electrical loadtree.
While these visualizations are valuable to individual occupants, building managers oflarge commercial buildings are often less concerned with individual loads, but more con-cerned with the overall health of the building, as embodied by its electrical load tree. Ourarchitecture also enable real-time monitoring and visualization of energy flows in the loadtree, as shown in Figure 8.10. This application is a live Sankey [81] diagram using datafrom mostly circuit level meters. The green rectangles represent nodes in the load tree andcorrespond to physical sense points. The lines represents the edges in the load tree and isproportional to the energy flowing on that edge. The structure of this diagram is createdbased on the electrical drawing of the building; energy flows from left (building substation) toright, as the load tree branches deeper into the leaves. The leaves are further re-aggregatedinto end uses, represented by red rectangles. The widths of flows are updated dynamically

CHAPTER 8. FEEDBACK 84
at a rate of once per minute, using real-time data from the circuit meters. This visualizationenables building managers to identify problems and respond in a timely fashion.
8.3 Google PowerMeter
Google PowerMeter [43] is a free web based energy visualization “gadget” created byGoogle. PowerMeter can be integrated in an user’s iGoogle tool and displays real-timepower traces based on data from utilities and compatible meters. Google PowerMeter usesthe Google GData API as the data protocol and XML as the interchange format. In someways, Google PowerMeter and sMAP serves the same purpose of decoupling energy data sup-pliers from consumers. However they are also very different and are designed with differentpurposes in mind, as illustrated in Table 8.2.
sMAP Google PowerMeterDevice-centric API (rooted at the device level) User and provider centric API (rooted per user)Measurement hierarchy built into directory Flat measurement structure
Does not include security model Authentication built into directory hierarchyIntegrated contextual/meta data Context through naming conventions
Table 8.2: Comparison of sMAP and Google PowerMeter
Google PowerMeter is a great visualization and feedback tool and provides simple analysisand prediction on personal energy usages. It is no different from any other building appli-cations that consumes energy data. From Google PowerMeter’s perspective, ACme is justanother GData-compatible meter. To enable Goole users to visualize their plug-load usage inreal-time through their iGoogle page, we have implemented a simple adapter application thatbridges ACme data to Google PowerMeter. During initialization, variables corresponding toACme’s are created under the “Berkeley” namespace; and authentication tokens returnedfrom Google are stored. A python based application periodically reads ACme energy datausing the sMAP interface, then creates and uploads the appropriate XML-encoded energydata structures to the corresponding variables’ “durMeasurement” attributes at 15 minuteintervals.
As shown in Figure 8.11, Google PowerMeter widget displays the historical data in real-time at 15 minutes granularity and provides a number of statistics such as energy used perday, approximate predicated cost in dollars, and breakdown by segments of the day. Whilefairly rudimentary, these types of personal energy feedback has been shown to incentivizesthe user to use less energy [31][65].
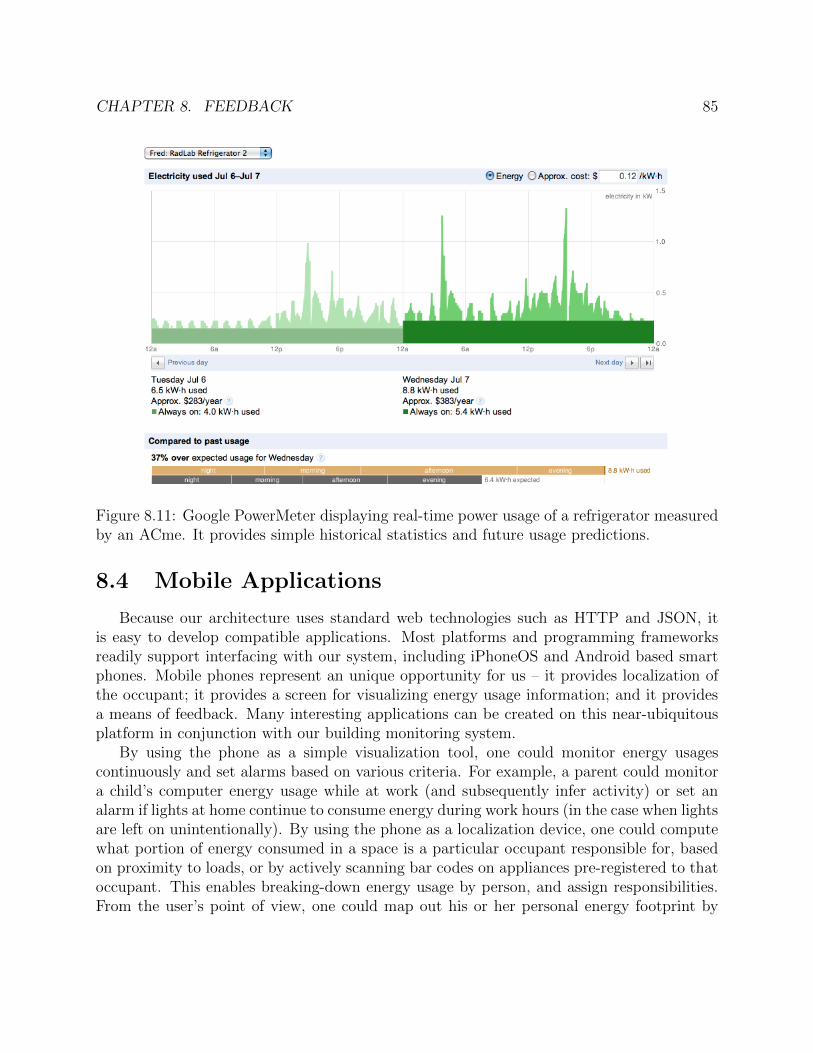
CHAPTER 8. FEEDBACK 85
Figure 8.11: Google PowerMeter displaying real-time power usage of a refrigerator measuredby an ACme. It provides simple historical statistics and future usage predictions.
8.4 Mobile Applications
Because our architecture uses standard web technologies such as HTTP and JSON, itis easy to develop compatible applications. Most platforms and programming frameworksreadily support interfacing with our system, including iPhoneOS and Android based smartphones. Mobile phones represent an unique opportunity for us – it provides localization ofthe occupant; it provides a screen for visualizing energy usage information; and it providesa means of feedback. Many interesting applications can be created on this near-ubiquitousplatform in conjunction with our building monitoring system.
By using the phone as a simple visualization tool, one could monitor energy usagescontinuously and set alarms based on various criteria. For example, a parent could monitora child’s computer energy usage while at work (and subsequently infer activity) or set analarm if lights at home continue to consume energy during work hours (in the case when lightsare left on unintentionally). By using the phone as a localization device, one could computewhat portion of energy consumed in a space is a particular occupant responsible for, basedon proximity to loads, or by actively scanning bar codes on appliances pre-registered to thatoccupant. This enables breaking-down energy usage by person, and assign responsibilities.From the user’s point of view, one could map out his or her personal energy footprint by

CHAPTER 8. FEEDBACK 86
summing all the energy attributed to him or her throughout the day. By utilizing thephone’s ability as an input device, one could provide feedback to the building. For example,occupants of a common space could collectively “vote” on the desirable temperature andarrives at some mean value.
Figure 8.12: An Android application that scans a bar code associated with an appliancemonitored by an ACme and graphs its power consumption in real-time.
One particular mobile application, created by two undergraduate students Jeff Hsu andSushant Shankar, is a simple Android application that interfaces with our building systemand provides feedback to the user. This application scans a bar code associated with anappliance monitored by an ACme and graphs its power consumption in real-time, and allowsthe user to turn it on or off, as shown in Figure 8.12. Please refer to [34] for more details.
8.5 Summary
Because this architecture provides high-fidelity energy monitoring data at the per-appliancelevel, and the proposed process flow infers unmetered devices through modeling, we can es-sentially approximate full coverage of all loads in the load-tree. This enables a wide rangeof visualization for feeding back to occupants, as seen in this chapter.

CHAPTER 8. FEEDBACK 87
There are many different ways to categorize these visualizations, such as by target plat-form, visualization fidelity, dynamics of visualization, and granularity in the load tree. How-ever, since our ultimate goal is to reduce consumption by voluntary reductions, we groupthese visualizations here by the target audience.
For building managers, functional and electrical re-aggregations help to identify wasteand problems. Combined with meta-data, functional re-aggregation is valuable as a real-time diagnostic and energy auditing tool for identifying the building’s energy response to aparticular stimulus. The live Sankey visualization also helps building managers to identifyproblems or areas for improvement in the electrical load tree.
To incentivize individuals to reduce energy, it is important to establish a connectionbetween individuals’ actions and their impact on the energy consumption of the building.The live web portal provides real-time feedback on the individual appliances an occupant isresponsible for, and gives visual feedback on their consumptions. The Google PowerMetergadget provides simple historical statistics and future usage predictions to further inducereduction. Additionally, mobile applications built on top of this architecture allows occu-pants to view appliance usages in-situ via geo-located bar codes, and provides the ability forturning them on and off remotely. This combination of localization, visualization, and userfeedback, provides an ideal platform for individualized energy tracking and actuation. Spa-tial and individual re-aggregations provide feedback to building occupants and incentivizesaving by comparing individual usages to others’ usages in a social, and possibly competitive,environment.

88
Chapter 9
RadLab as a Green Building Testbed
Motivated by research that real-time, per-appliance electricity usage feedback can inducebehavioral changes that lead to 10% to 20% reductions in usage [37], we have built anddeployed a network of nearly 50 ACme meters across a Computer Science department, anda web application to monitor the data produced by these nodes.
The goal of this deployment is to enable interactive, near real-time monitoring of numer-ous small loads and a few of the larger ones found in an office environment so that occupantscan understand their electricity usage patterns and alter their behavior to reduce their en-ergy footprint. This deployment enables building occupants to observe the energy usage oftheir everyday devices. It also allows us to better understand where energy goes inside thebuilding as a whole.
The green building deployment also serves as a concrete design point to evaluate theutility and performance of the ACme node and the blip network as a platform for energymetering and control applications. This application builds on numerous campus-wide effortsto monitor and control energy usage to control operating costs and reduce the campus carbonfootprint.
9.1 Network
A network of meters is essential to obtain time-correlated coverage of energy consump-tion over large spatial and temporal extents. Traditional energy monitoring solutions usea serial port or other wired backchannel to connect instruments to data loggers, which isnot scalable or practical at large scales. Our wireless network allows quick deployment andinstrumentation of a large number of AC plug meters by using an ad-hoc network layer whichprovides IP connectivity to the meters without requiring either wiring installation or sup-port infrastructure, as described in more detail in [51]. The network provides connectivitybetween the meters and other networks using an IP router.
Figure 9.1 shows the connectivity graph of 44 wireless sensors over the deployment space.

CHAPTER 9. RADLAB AS A GREEN BUILDING TESTBED 89
A
C M
ete
r L
ight S
ensor
Figure 9.1: Location and connectivity graph of AC meters and light sensors. There are atotal of 38 AC meters, 28 of which are spatially distinct, and 6 light sensors. The vibrationsensor, not shown here, is attached to the HVAC infrastructure in the basement of thebuilding.
They form a moderately dense network with an average degree of 4. Each sensor node isconfigured to report energy readings once per minute via UDP to a simple daemon processrunning on a server. Each UDP packet includes a sequence number, the energy used in theprevious minute, and average, minimum, maximum, and last instantaneous power observedduring this interval. The server process timestamps the readings and stores them in adatabase for later processing.
9.2 Usage Profiling
Building occupants check out one or more ACme meters from our research group, registertheir meters online, plug the loads they want to monitor into the meter, and plug the meterinto a power outlet. Figure 9.2 shows a typical ACme meter installation as well the aggregatestatistics of the type and number of plug-loads currently monitored with this system in ourself-contained lab.
In addition to enabling individuals to view and adapt their electricity, data collected fromthis application will allow us to build models of energy usage aggregated over space, time,person, load type, or other factors.

CHAPTER 9. RADLAB AS A GREEN BUILDING TESTBED 90
Load Type CountDesktop 9Other 6Microwave 5Projector 5Monitor 5Laptop 6Printer 4Lamp 3Switch 2Phone 1TV 1Refrigerator 1Coffee Maker 1
Figure 9.2: The type and number of plug-loads currently monitored using ACme nodes.
9.3 Deployment Model
To demonstrate that we have met our goal of unplanned deployment with minimal con-figuration, we walk through the steps necessary to deploy our network configured with thedata-collection application. For a given deployment, the first step is to deploy an edge routerwhich provides routing between our embedded IP network and the Internet. For us, thistypically means connecting one of our edge routers to an available LAN. If the subnet isIPv6 enabled, no particular configuration is necessary as the router will automatically ac-quire an IPv6 prefix. If not, we configure a tunnel to an external Point of Presence usingone of several freely available IPv6 tunnel brokers. The ACme’s are pre-configured with theIPv6 address of a machine “in the cloud” to which they report their data. While it wouldbe possible to map the IPv6 subnet of sensors to an IPv4 address range, or used NAT, wefeel that an IPv6-only network represents a better long-term perspective on how billions offuture devices will access the Internet.
When a sensor node is plugged in, it is automatically configured with a globally-routableIPv6 address using IPv6 stateless autoconfiguration. Once a node establishes a link with aneighbor, the node sends periodic reports to the central server containing power measure-ments. To enable users to configure their nodes and views their data, each device is labeledwith a random 32-bit key. In order to “claim” a particular sensor node, users need only totype that string in the application’s web page, which then displays the device’s data.

CHAPTER 9. RADLAB AS A GREEN BUILDING TESTBED 91
9.4 Results
(a) Power profile of a student’s
computer and monitor over a typ-
ical day.
(b) Power profile of a laptop and a
large LCD over a typical day.
(c) Power draw of a refrigerator and
a water dispenser on a typical day.
(d) Power draw of the microwaves
on the 3rd (bottom figure) to 7th
(top figure) floors on a typical day.
(e) Energy usage by plug-load type
on a Monday averaged across all
loads of the particular type.
(f) Data yield from 49 nodes over a
three day period.
Figure 9.3: Power traces from various appliances under measurement.
This section presents several cuts through the data we have collected continuously fromour operational network over the past 4 months. The “green building” application letsusers pose a range of questions that allow users to meter and visualize the energy usage oftheir everyday devices. For example, Figure 9.3(a) shows the power profile of a student’scomputer and monitor during a typical Monday. Monitor power draw is roughly correlatedwith computer usage, since the monitor enters a power saving mode after a few minutesof inactivity. However, the energy savings that accrue from the monitor’s automatic powerdown mode pale in comparison to the idle power of the computer, as evident from their totalcombined draw shown in the stacked bottom plot. This observation might cause a student topower down his or her computer over the weekend or even every night. Figure 9.3(b) showsthe power profile of a different system– a laptop and a 24” LCD screen (not connected toeach other).

CHAPTER 9. RADLAB AS A GREEN BUILDING TESTBED 92
We observe that the laptop has much better power management than the desktop, con-suming less than half of the desktop during active and going to sleep when not used. The24” LCD, on the other hand, draws more power than the laptop when active. The LCDpower trace also reveals something we did not previously notice: at hour 14, the laptopconnected to the LCD was unplugged, but instead of going to sleep, it displays a vendor logoand cable disconnect warning. This consumes 68W for almost four hours before sleeping.This suggests that we could save 272Wh per day just by turning off the LCD manually afterdisconnecting the video source. Figure 9.3(c) shows the power draw of a refrigerator anda water dispenser over a day. In the top graph, we note that the compressor during therefrigeration cycle draws around 100W and starts every 15 minutes; the heating element isactive during the defrost cycle and draws 440W every 12 hours. Similarly, the cooling cyclesin the water dispenser consume less than heating in the water dispenser but has a higherduty-cycle. Unsurprisingly, the average power is highest during the work day– from about10 AM to 5 PM.
In addition to these individual questions, the application lets one pose queries over theentire population of nodes and their plug-loads. For example, Figure 9.3(d) shows the powerdraw of the microwaves across a building. Although it is clear from this data that microwavescontribute relatively little to the department’s carbon footprint, it suggests natural ways ofusing electrical consumption for human activity monitoring. A different aggregation of thedata yields the energy usage, in kWh, of each type of plug-load, as shown in Figure 9.3(e).The load types, from left to right, are: (1) Refrigerator, (2) Desktop, (3) Switch, (4) CoffeeMaker, (5) Projector, (6) Other, (7) Printer, (8) Microwave, (9) Laptop, (10), Monitor, (11)TV, (12) Lamp, and (13) Phone.
This view allows us to build models of energy usage that can be used to estimate thecontribution of the various small and large loads based on the number of such loads and theaverage energy usage of their load class. It also focuses attention on the things that matter(in this case, the desktops and network switches), since they are heaviest consumers andthey are numerous. Figure 9.4 shows a breakdown of energy usage by appliance type in alaboratory that encompasses half of an entire floor in the building. The average measuredpower is multiplied by the number of appliances to yield the total energy footprint of eachplug-load type. The pie chart shows that desktops are the largest energy consumer, followedby LCDs and laptops. The time series shows that (1) desktops consume a lot of energyeven when idle; (2) projector consumption is determined only by utilization; and (3) somemonitors draw significant power when the source is unplugged.
9.5 Improvements
By far, the most beneficial result in building a dense energy measurement network isopening the door to a potential wealth of electricity savings. In this section, we relate twospecific anecdotes that resulted in reduced electricity consumption, the first of which resulted

CHAPTER 9. RADLAB AS A GREEN BUILDING TESTBED 93
!"
#!!"
$!!!"
$#!!"
%!!!"
%#!!"
&!!!"
&#!!"
'(!)!!" *" +,,-" $." /01!)!!" &!" +,,-"
!"#$%&'(
)&
23,-0"$4#"56,7"$4$"28,90:;,8"%4*"<,=00"$4$">8?1@0"$4$"A<B"C4%#"ADE;,E"*4%#"B0FG;,E"%4$#" C#H"
#H"
%IH"
#H"
%H"$#H"
!H"$H"
Monitor On, Unplugged
Desktop Idle
Obama Inauguration
Projector Left On Clean Shutdown
Desktop
LCD
Laptop
Projector
Fridge Coffee
XBox Phone
Figure 9.4: Aggregated energy usage by appliance type normalized by number of appliancesin an enclosed environment.
in up to a 32% reduction in LCD electricity consumption, and the second of which slashedthe sleep power of a desktop computer by a factor of 50.
Figure 9.5 provides an aggregate consumption of all of the LCD monitors measured inthe laboratory over the course of four weeks. Table 9.1 provides the weekday average foreach five-day period, represented by a white rectangle on the graph. At the beginning of thistimeframe, the authors made a presentation to the laboratory that enumerated the wasteof LCD monitors unplugged from laptops but not turned off. This, along with generallyspreading the word about the electricity measurement network, led to a significant initialreduction in LCD energy consumption - nearly a third from week 1 to week 2. However,as the effect of this impulse diffused, so did the reduction in electricity consumption, nearlyreturning to week 1 levels by week 4. Without drawing any concrete conclusions from thisexperiment, it appears that a single notice, though initially powerful, may taper off in effectover time without reinforcement.
Week 1 2 3 4Average Power (kW) 5.92 4.03 4.53 5.70
Change (%) N/A -31.9% +12.5% +25.8%
Table 9.1: Work-week average aggregate power for measured LCDs, along with week-by-weekpercentage changes.
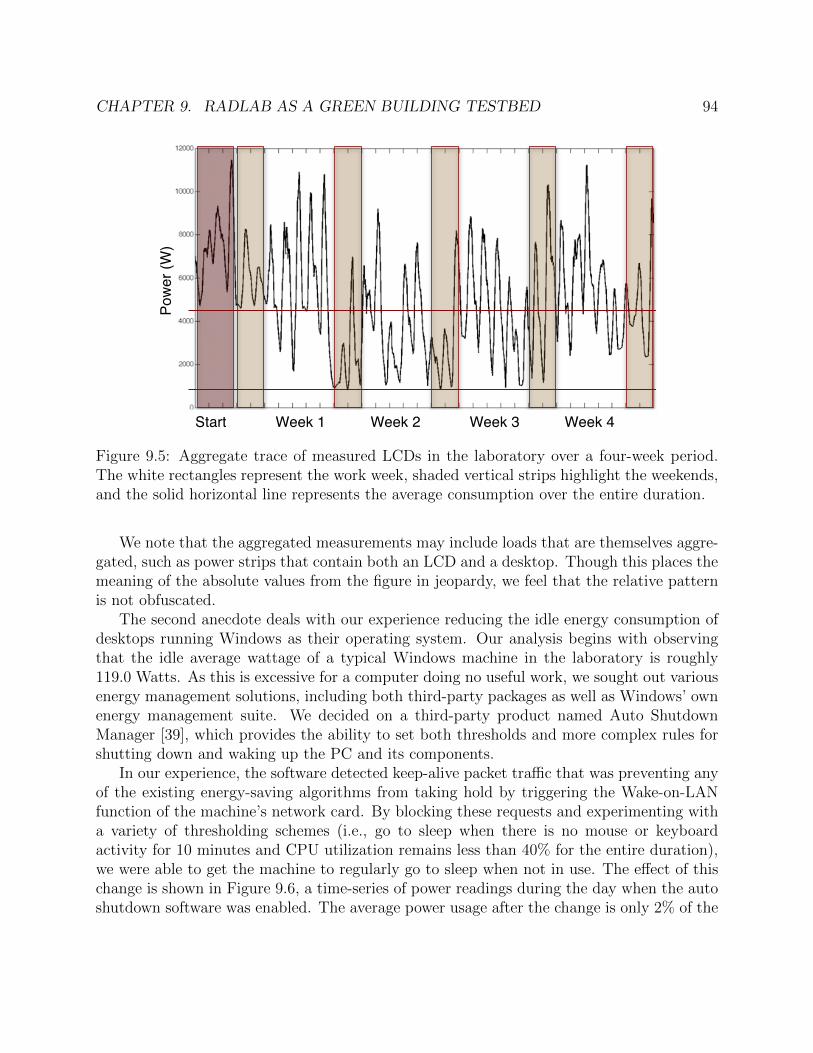
CHAPTER 9. RADLAB AS A GREEN BUILDING TESTBED 94
Start Week 1 Week 2 Week 3 Week 4!
Pow
er (W
)!
Figure 9.5: Aggregate trace of measured LCDs in the laboratory over a four-week period.The white rectangles represent the work week, shaded vertical strips highlight the weekends,and the solid horizontal line represents the average consumption over the entire duration.
We note that the aggregated measurements may include loads that are themselves aggre-gated, such as power strips that contain both an LCD and a desktop. Though this places themeaning of the absolute values from the figure in jeopardy, we feel that the relative patternis not obfuscated.
The second anecdote deals with our experience reducing the idle energy consumption ofdesktops running Windows as their operating system. Our analysis begins with observingthat the idle average wattage of a typical Windows machine in the laboratory is roughly119.0 Watts. As this is excessive for a computer doing no useful work, we sought out variousenergy management solutions, including both third-party packages as well as Windows’ ownenergy management suite. We decided on a third-party product named Auto ShutdownManager [39], which provides the ability to set both thresholds and more complex rules forshutting down and waking up the PC and its components.
In our experience, the software detected keep-alive packet traffic that was preventing anyof the existing energy-saving algorithms from taking hold by triggering the Wake-on-LANfunction of the machine’s network card. By blocking these requests and experimenting witha variety of thresholding schemes (i.e., go to sleep when there is no mouse or keyboardactivity for 10 minutes and CPU utilization remains less than 40% for the entire duration),we were able to get the machine to regularly go to sleep when not in use. The effect of thischange is shown in Figure 9.6, a time-series of power readings during the day when the autoshutdown software was enabled. The average power usage after the change is only 2% of the
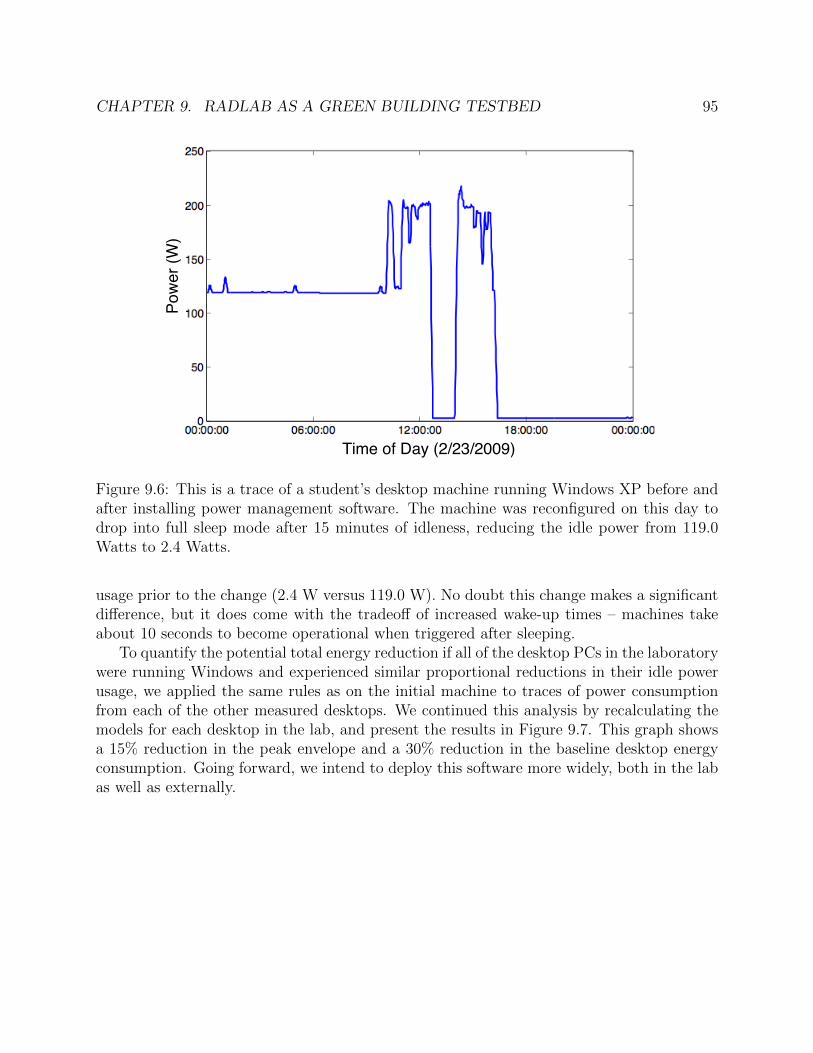
CHAPTER 9. RADLAB AS A GREEN BUILDING TESTBED 95
Pow
er (W
)!
Time of Day (2/23/2009)!
Figure 9.6: This is a trace of a student’s desktop machine running Windows XP before andafter installing power management software. The machine was reconfigured on this day todrop into full sleep mode after 15 minutes of idleness, reducing the idle power from 119.0Watts to 2.4 Watts.
usage prior to the change (2.4 W versus 119.0 W). No doubt this change makes a significantdifference, but it does come with the tradeoff of increased wake-up times – machines takeabout 10 seconds to become operational when triggered after sleeping.
To quantify the potential total energy reduction if all of the desktop PCs in the laboratorywere running Windows and experienced similar proportional reductions in their idle powerusage, we applied the same rules as on the initial machine to traces of power consumptionfrom each of the other measured desktops. We continued this analysis by recalculating themodels for each desktop in the lab, and present the results in Figure 9.7. This graph showsa 15% reduction in the peak envelope and a 30% reduction in the baseline desktop energyconsumption. Going forward, we intend to deploy this software more widely, both in the labas well as externally.

CHAPTER 9. RADLAB AS A GREEN BUILDING TESTBED 96
Figure 9.7: Estimated saving of the laboratory energy consumption if all of the desktopsincorporated energy management software.

97
Chapter 10
Ongoing and Future Research
10.1 Deployments
Over the course of this project, we have found ACme to be a versatile platform forenabling various energy related research projects. Several on-going deployments are usingACme as a building block for energy data collection. Figure 10.1 shows some of thesedeployments, described in more detail below.
The Miscellaneous and Electronic Loads (MELs) project is a collaborative effort betweenLawrence Berkeley National Laboratory (LBNL) and UC Berkeley, to study the energy useof plug load devices in several different buildings using ACme devices. 500 ACmes are usedin combination with other sensors to monitor and analyze energy usage of Building 90 inLBNL. The goal is to develop a metering methodology that will allow us to measure, forindividual devices, the long-term energy consumption, typical load (power) profile, and timespent in various power modes. In addition, we want to develop a categorization for collectionsof devices, such as by device type and end-use, based on load profiles.
The Cory Hall project is a building energy monitoring project aimed at developinga methodology for instrumenting large scale commercial buildings and as a build-to-gridtestbed. Following the architecture proposed in this thesis, various meters and transducersat different granularities are used to instrument different points in the load tree, includingDent PowerScout 18’s, PSL PQube, Dent RoCoill, Dent Split-Core CT, PSL Split-Core CT,and 100 ACmes. The ACme’s are used to monitor plug-loads in computer labs and offices.
The Free Speech Movement (FSM) Cafe deployment is a small ACme deployment fortracking energy usage in a cafe environment. Six ACmes are used to monitoring variousequipments such as soup warmers, coffee grinders, receipt printer, freezer, and etc. Data isalso used to identify possible savings and customer consumption patterns.
The Apartment deployment is another small ACme deployment for remote monitoringand control of apartment lighting and appliances. Six ACme’s are installed on variousappliances throughout the apartment, including refrigeration, TV, playstation, and lights.

CHAPTER 10. ONGOING AND FUTURE RESEARCH 98
Lawrence Berkeley National Lab 500 ACme
500 ACme’s used in combination with other sensors, such as temperature, humidity, and flow sensors, to monitor and analyze energy usage of Building 90 in Lawrence Berkeley National Laboratory.
Cory Hall – 100 ACme
100 ACme’s are used to monitor plug-loads in computer labs and offices, as part of a larger building-to-grid testbed involving various sensors and meters.
Apartment – 6 ACme
Remote monitoring and control of apartment lighting and appliances. Energy information is viewable globally in real-time. A mote is used as a light switch.
Atom Cluster – 16 ACme
High-fidelity power monitoring of a 16-node Atom cluster. ACme data is used to identify major power consuming components.
Free Speech Café – 6 ACme
Energy usage tracking in a café environment. Six ACme’s are used to monitoring various equipments such as soup warmers, coffee grinders, receipt printer, freezer, and etc. Data is also used to identify possible savings and customer consumption patterns.
Figure 10.1: ACme deployments and related research.

CHAPTER 10. ONGOING AND FUTURE RESEARCH 99
Because ACme is a standard IP device, and is connected to the cloud through the apartment’sInternet router, energy information is viewable globally in real-time; and appliances can beturned on or off from anywhere in the world. For convenience, a Telos mote next to the dooris used as a light switch.
To study the power proportionality of modern computers, a group of graduate studentsuses 16 ACme’s to monitor power usage of a 16-node Atom cluster. High-fidelity ACme datais used to understand, in real time, the change in power drawn by the cluster versus thechange in load on the cluster. This is used to vary quality of service offered by services onthe cluster depending upon it’s energy allowance, described in more detail in [55].
10.2 Building-to-Grid
Transmission
Distribution !"#$%&'
()**+,'
-.('
()**+,'
-.('
/0"1'
-.('
/0"1'
-.('
/0"1'
-.('()**+,'
-.('
Load / DG
Generation
Figure 10.2: Using historical load traces and simulated supply, the LoCal simulator predictsfuture load and performs trades on a virtual market consisting of two types of goods: basepower and variable power. The right side of the graph shows how the prediction (green ispurchased base power and blue is variable power) matches the actual load (shown in red).
Extending the notion of load monitoring from within buildings to the outside, we canview buildings as large loads to the power grid. In fact, these are loads that we can optimize(load-shaping) and match to the supply side, if a real-time monitoring, prediction, andcommunication network were to overlay on the existing electrical grid. LoCal (A NetworkArchitecture for Localized Electrical Energy Reduction, Generation, and Sharing) [46] isthe smart-grid project at Berkeley that I have been working on that borrows principlesfrom the Internet to the existing grid. The LoCal simulator, as seen in Figure 10.2, furtherdemonstrates the importance of load-side monitoring and prediction on the stability andoptimal operation of a future smart grid system. I believe it will be extremely meaningfulto continue this work and bring buildings to the grid as large loads that can be continuouslyshaped and optimized, far beyond what current demand-response envisions.

CHAPTER 10. ONGOING AND FUTURE RESEARCH 100
10.3 Online Energy-Climate Model
Figure 10.3: An online energy-climate model that combines real-time sensor feeds witharchitectural model of the building, enabling dynamic optimizing of energy and comfort.
The building energy monitoring architecture enables us to collect temporal and spatiallycorrelated sensor data in real-time, including power, temperature, light, humidity, and etc.By combining these data with the architectural model of the building (i.e. a CAD model),we can create an energy climate model of the building, updated in real-time, as seen inFigure 10.3. Such model will have a huge impact on our ability to optimize for energyutilization and meanwhile maintain comfort. This approach will enable us to model, predict,and control the thermal and electrical densities in real-time. Current state-of-art CADsimulators allow input of very simple stimulus such as trajectory of the sun, and outputthe thermal densities. I hope to create a system that combines building CAD models withon-line distributed sensing, climate modeling, and prediction.
Actuation will also play an important part in completing the control loop. I envisionthat, in parallel to the sensing layer described in this thesis, there will be an actuationlayer consisting of thermostats, ACme’s (specifically the relay function), VFDs, vents, fans,controllable window shades, and various set-points that already exist in building HVACsystems. Similar to the sensing layer, this actuation layer is represented by sMAP, and iseasily accessible by portable applications and services through the networking layer.

CHAPTER 10. ONGOING AND FUTURE RESEARCH 101
10.4 None-Intrusive Load Monitoring
A parallel but closely related research area to pervasive power monitoring is non-intrusiveload monitoring (NILM). NILM describes the set of techniques that uses signal analysis todisaggregate loads from a single high-fidelity aggregate measurement. However, most if notall NILM algorithms require time-consuming training on individual loads before they areeffective. Using the architecture proposed in this thesis and the vast amount of per-appliancedata I have collected, I plan to build an open appliance power signature database, whichwill allow users to minimize the training overhead and enable more accurate load signaturematching. I hope to continue this work and develop a set of NILM algorithms that can bewidely used in real environments.

102
Chapter 11
Conclusion
Existing solutions in commercial building energy monitoring are insufficient in identifyingwaste or guide improvement because they only provide usage statistics in aggregate, bothspatially and temporally.
By viewing the building as a system, we see that this lack of visibility into fine grainenergy data is due to several factors inherent in current building infrastructures:
• Current buildings optimize for human comfort, instead of energy efficiency. They areopen-loop systems where occupants, the primary load to the building, is given little orno feedback on the states of the building’s energy statistics, and therefore could notact to reduce it.
• Sensors and actuators are tightly integrated inside vertical stovepipe solutions, com-municating using legacy and proprietary protocols, and without an open interface forexternal communication. This design prevents data to be consumed programmaticallyand impedes the proliferation of portable building applications.
• Preliminary efforts to feedback energy data to occupants consist of displaying simplevisualizations of single-dimensional and unstructured metering data directly to theoccupants. This approach is insufficient in inducing occupants to reduce usage.
To significantly and sustainably reduce energy usage in buildings, we need an architec-ture and a system implementation that provide high-fidelity real-time visibility into eachcomponent of the building.
In the first half of this dissertation, we propose a three-tiered architecture consistingof “sensing”, “data delivery and representation”, and “applications and services”. We showthat this layering allows us to cleanly abstract the low-level details of the myriads of disparatemonitoring instruments and protocols, provide an uniform data representation interface, andenable innovation in portable building applications.

CHAPTER 11. CONCLUSION 103
We first show that ACme plug-load meter enables us to wirelessly instrument a largenumber of appliances continuously at high-fidelity, providing us visibility into the end-usesinside a building. In addition, the integrated IPv6 stack allows ACme to seamlessly inter-operate with other IP devices. We further demonstrate that by using other types of sensorssuch as vibration and light sensors, we can increase our coverage, especially in places wheredirect electrical measurement is inappropriate.
The “data delivery and representation” layer functions as a narrow-waist, decouplingportable application and services from the sensing layer below. We show that sMAP – SimpleMeasuring and Actuation Profile, is able to provide uniform data access to a large subset ofdevices typically found in buildings, allowing heterogenous sensors, meters, actuators, andother data sources to intercommunicate over IP.
Building on top of “sensing” and “data delivery and representation” layers, we showthat it is easy to create portable building “applications and services”. We present a simpleapplication that collects periodic energy reports from a mixture of sensors via UDP andstore them inside a database, along with associated meta data. This data is used later forcreating actionable feedbacks to the occupants.
This architecture provides the facilities for observing high-fidelity energy statistics, butdoes not create actionable views of those data. Therefore, in the second part of this disser-tation, we propose an application process flow for energy data analysis and visualization,instantiated by a real deployment, which also serves to evaluate our architecture. Thisprocess consists of three parts – we begin by understanding and instrumenting the loadtree, followed by data analysis, modeling, and disaggregation of energy usage statistics; andfinally, combined with meta-data, we re-aggregate individual load usages into actionablerepresentations for visualization and feedback to the occupants.
To understand how energy is consumed and wasted, we need to first observe the energyflows inside a building. Hence the first step in this process is understanding the structureof the load tree and instrumenting it with various sensors to obtain empirical measurement.However, it is impractical to instrument all points in the load tree and obtain both fulland detailed coverage. Realizing this constraint, we measure aggregate energy usage wherepossible, and we subsample plug-load appliances and HVAC systems to obtain measure-ments of representative end-use usage traces. In the second step of this process, we developseveral techniques for improving fidelity of appliance models. We show that these set oftechniques allow us to build representative models and disaggregate whole building energyconsumptions.
Finally, we present various ways to feedback energy data to the occupants that result inenergy reduction. We show various ways to re-aggregate energy usage to provide insightsinto how and where energy is consumed. Functional and electrical re-aggregations resultin visualizations that are particularly useful for building managers to identify waste andproblems; spatial and individual re-aggregations provide feedback to building occupants andincentivize saving.
We further demonstrate the potential of our architecture with several visualization ap-

CHAPTER 11. CONCLUSION 104
plications. The ACme web portal provides a way for individuals to easily visualize electricalloads that he or she is directly using in real-time, and the relative proportions amount dif-ferent types of loads. This applications helps establishing a connection between individualsworking in a commercial building and the share of energy that he or she is responsible for.A load-tree visualization application shows the real-time energy flow of the load tree, asrepresented by the width of the edges. This view gives the building managers an visualindication of the health of the building and areas for concentrating reduction efforts. TheGoogle PowerMeter application is a great visualization and feedback tool that can be easilyintegrated into user’s iGoogle page and provides simple analysis and prediction on personalenergy usages. Mobile phones also represent an unique opportunity for our system – itprovides localization of the occupant, a screen for visualizing energy usage, and a means offeedback. We demonstrate its interaction with our system with a simple Android applicationthat displays energy usage graphs (measured by ACme’s) of appliances physically close tothe cellphone, and presents an interface for actuation.
In conclusion, this work demonstrates that high-fidelity energy monitoring enables oc-cupants to reduce electrical use in buildings in the following ways:
• The ACme wireless power meter enables real-time and networked energy monitoringof individual plug-loads, providing high-fidelity measurements in terms of power reso-lution, sampling rate, and granularity in the load tree.
• By abstracting a wide range of sensors and meters, the three-tired architecture enablestime-correlated, whole-building scale energy monitoring, providing high-fidelity usagestatistics in terms of spatial and temporal coverage. In addition, the uniform datarepresentation layer enables building applications to easily access high-fidelity energydata.
• And finally, in contrast to existing building systems where occupants are unaware ofconsumption, the application process flow utilizes high-fidelity real-time energy datamade accessible by our architecture, to create actionable views of energy usages, whichlead to significant and sustainable energy reductions by the occupants.

105
Bibliography
[1] Ade7753 evaluation kit documentation. http://www.analog.com/static/imported-files/eval\_boards/ADE7753_EvalBoard.pdf.
[2] amCharts. http://www.amcharts.com/.
[3] Arch Rock. http://www.archrock.com/.
[4] BroadWin Technology. http://broadwin.com/.
[5] Campbell Scientific, Inc. http://www.campbellsci.com/scada.
[6] DOE-2. http://www.doe2.com/.
[7] Google PowerMeter. http://www.google.org/powermeter/.
[8] Green Box. http://www.getgreenbox.com/.
[9] Green Hub. http://www.energyhub.net/.
[10] Hall effect sensing and application. http://content.honeywell.com/sensing/prodinfo/solidstate/technical/hallbook.pdf.
[11] Ip-based wireless sensor networking: Secure, reliable, low-power ip connectivity for ieee82.15.4 networks. Arch Rock.
[12] Johnson Controls. http://www.johnsoncontrols.com/publish/us/en/products/building_efficiency/building_management.html.
[13] Kill-a-watt. http://www.p3international.com/products/special/P4400/P4400-CE.html.
[14] Meraki, inc. http://www.meraki.com.
[15] Microsoft Hohm. http://www.microsoft-hohm.com/.
[16] Open mesh mini-router. http://www.open-mesh.com.
BIBLIOGRAPHY 106
[17] SCADA Group. http://www.scadagroup.com/pages/.
[18] Schneider Electric. http://www.schneider-electric.com/corporate/en/products-services/buildings/intelligent-buildings/building-management-system.page.
[19] Sentilla. http://www.sentilla.com/.
[20] Technical overview of time synchronized mesh protocol (tsmp). White paper, DustNetworks.
[21] Tendril. http://www.tendrilinc.com/.
[22] TRNSYS: The Transient Energy System Simulation Tool. http://www.trnsys.com/.
[23] Wirelesshart technical data sheet. Data sheet, HART Communication Foundation, 2007.
[24] Aleka Pappas. Building Energy Modeling: An Overview of Available Software andModeling Strategies.
[25] Autodesk. Autodesk Ecotect Analysis. http://usa.autodesk.com/adsk/servlet/pc/index?siteID=123112&id=12602821.
[26] Autodesk. Autodesk Green Building Studio. http://usa.autodesk.com/adsk/servlet/pc/index?siteID=123112&id=11179508.
[27] M. Baranski and J. Voss. Genetic algorithm for pattern detection in nialm systems. InSystems, Man and Cybernetics, 2004.
[28] Chris Beckmann, Sunny Consolvo, and Anthony Lamarca. Some assembly required:Supporting end-user sensor installation in domestic ubiquitous computing environments.pages 107–124. 2004.
[29] D.B. Belzer. Energy end-use flow maps for the buildings sector, 2006. http://www.pnl.gov/main/publications/external/technical_reports/PNNL-16263.pdf.
[30] Ian D. Chakeres and Charles E. Perkins. Dynamic manet on-demand (dymo) routing(draft-ietf-manet-dymo-10), 2007.
[31] Marshini Chetty, David Tran, and Rebecca E. Grinter. Getting to green: understandingresource consumption in the home. In Hee Yong Youn and We-Duke Cho, editors,UbiComp, pages 242–251. ACM, 2008.
[32] Stephen Dawson-Haggerty. Design, implementation, and evaluation of an embeddedipv6 stack. In Master’s Thesis, 2010.

BIBLIOGRAPHY 107
[33] Stephen Dawson-Haggerty, Xiaofan Jiang, Gilman Tolle, Jorge Ortiz, and David Culler.smap – a simple measurement and actuation profile for physical information. In SenSys,2010.
[34] Stephen Dawson-Haggerty, Jorge Ortiz, Xiaofan Jiang, Sushant Shankar Jeff Hsu, andDavid Culler. Enabling green building applications. In The Sixth Workshop on HotTopics in Embedded Networked Sensors (HotEmNets 2010), 2010.
[35] DENT Instruments. PowerScout Press Release. http://www.dentinstruments.com/pr_power_scout_meters_monitors_launched.html.
[36] J.K. Dobson and J.D. Griffin. Conservation effect of immediate electricity cost. feedbackon residential consumption behavior. Proceedings of the 7th ACEEE Summer Study onEnergy Efficiency in Buildings, 1992.
[37] J.K. Dobson and J.D. Griffin. Conservation effect of immediate electricity cost. feedbackon residential consumption behavior. Proceedings of the 7th ACEEE Summer Study onEnergy Efficiency in Buildings, 1992.
[38] Prabal Dutta, Jay Taneja, Jaein Jeong, Xiaofan Jiang, and David Culler. A buildingblock approach to sensornet systems. In SenSys ’08: Proceedings of the 6th ACMconference on Embedded network sensor systems, pages 267–280, New York, NY, USA,2008. ACM.
[39] EnviProt. Auto shutdown manager, 2009. http://www.enviprot.com/.
[40] L. Farinaccio and R. Zmeureanu. Using a pattern recognition approach to disaggre-gate the total electricity consumption in a house into the major end-uses. Energy andBuildings, 30(3), p.245-259, 1999.
[41] Roy Thomas Fielding. Architectural Styles and the Design of Network-based SoftwareArchitectures. PhD thesis, University of California, Irvine, Irvine, California, 2000.
[42] Rodrigo Fonseca, Omprakash Gnawali, Kyle Jamieson, and Philip Levis. Collection treeprotocol. http://www.tinyos.net/tinyos-2.x/doc/html/tep123.html.
[43] Google.org. Google PowerMeter Overview. http://www.google.com/powermeter/about/about.html.
[44] G.W. Hart. Nonintrusive appliance load monitoring. Proceedings of the IEEE, 1992.
[45] Mike He, Evan Reutzel, Xiaofan Jiang, Randy Katz, Seth Sanders, David Culler, andKen Lutz. An architecture for local energy generation, distribution, and sharing. IEEEConference on Global Sustainable Energy Infrastructure (Energy2030 ’08), 2008.

BIBLIOGRAPHY 108
[46] Mike M. He, Evan M. Reutzel, Xiaofan Jiang, Randy H. Katz, Seth R. Sanders, David E.Culler, and Ken Lutz. An architecture for local energy generation, distribution, andsharing. In IEEE Energy2030 Conference Proceedings, 2008.
[47] Jonathan Hui. An Extended Internet Architecture for Low-Power Wireless Networks–Design and Implementation. PhD thesis, University of California at Berkeley, Berkeley,CA, USA, 2008.
[48] Wireless systems for industrial automation: Process control and related applications.Draft, ISA, 10.-September 2009.
[49] Ulla Janson. Passive houses in sweden: Experiences from design and construction phase.Report EBD-T–08/9, 2008.
[50] Xiaofan Jiang, Stephen Dawson-Haggerty, and David E. Culler. smap: simple monitor-ing and actuation profile. In IPSN, pages 374–375, 2010.
[51] Xiaofan Jiang, Stephen Dawson-Haggerty, Prabal Dutta, and David Culler. Design andimplementation of a high-fidelity ac metering network. In IPSN ’09: Proceedings of the2009 International Conference on Information Processing in Sensor Networks, pages253–264, Washington, DC, USA, 2009. IEEE Computer Society.
[52] Xiaofan Jiang, Prabal Dutta, David E. Culler, and Ion Stoica. Micro power meter forenergy monitoring of wireless sensor networks at scale. In IPSN, pages 186–195. ACM,2007.
[53] Younghun Kim, Zainul M Charbiwala, Akhilesh Singhania, Thomas Schmid, and Mani BSrivastava. Spotlight: Personal natural resource consumption profiler. HotEmNets 2008,2008.
[54] Younghun Kim, Thomas Schmid, Zainul M. Charbiwala, and Mani B. Srivastava.Viridiscope: Design and implementation of a fine grained power monitoring systemfor homes. 11th international conference on Ubiquitous Computing (UbiComp 2009),2009.
[55] Andrew Krioukov, Prashanth Mohan, Sara Alspaugh, Laura Keys, David Culler, andRandy Katz. Napsac: The design and implementation of a power proportional webcluster. In Proceedings of the 1st ACM SIGCOMM Workshop on Green Networking,New York, NY, USA, 2010. ACM.
[56] C. Laughman, K. Lee, R. Cox, S. Shaw, S. Leeb, L. Norford, and P. Armstrong. Powersignature analysis. IEEE Power & Energy Magazine, 2003.
[57] K. D. Lee. Electric load information system based on non-intrusive power monitoring.PhD Thesis, MIT, 2003.

BIBLIOGRAPHY 109
[58] S. B. Leeb, S. R. Shaw, and J. R. Kirtley Jr. Transient event detection in spectralenvelope estimates for nonintrusive load monitoring. IEEE Trans. on Power Delivery,10(3):12001210, 1995.
[59] Joshua Lifton, Mark Feldmeier, Yasuhiro Ono, Cameron Lewis, and Joseph A. Par-adiso. A platform for ubiquitous sensor deployment in occupational and domestic en-vironments. IPSN ’07: Proceedings of the 6th international conference on Informationprocessing in sensor networks, 2007.
[60] Yun Mao, Feng Wang, Lili Qiu, Simon Lam, and Jonathan Smith. S4: Small state andsmall stretch routing protocol implementation. http://www.cs.utexas.edu/~lili/projects/s4.htm.
[61] G. Montenegro, N. Kushalnagar, J. Hui, and D. Culler. Transmission of ipv6 packetsover ieee 802.15.4 networks, 2007.
[62] Razvan Musaloiu-E. and Andreas Terzis. Minimising the effect of wifi interference in802.15.4 wireless sensor networks. Int. J. Sen. Netw., 3(1):43–54, 2007.
[63] National Renewable Energy Laboratory. Energy10. http://www.nrel.gov/buildings/energy10.html.
[64] Pacific Gas and Electric. Demand Response Incentives. http://www.pge.com/demandresponse/.
[65] Danny Parker, David Hoak, and Jamie Cummings. Pilot evaluation of energy savingsfrom residential energy demand feedback devices. In Contract Report FSEC-CR-1742-08. ACM, 2008.
[66] S. N. Patel, T. Robertson, J. A. Kientz, M. S. Reynolds, and G. D. Abowd. At the flickof a switch: Detecting and classifying unique electrical events on the residential powerline. 9th international conference on Ubiquitous Computing (UbiComp 2007), 2007.
[67] Charles E. Perkins and Elizabeth M. Belding-Royer. Ad-hoc on-demand distance vectorrouting. In WMCSA, pages 90–100, 1999.
[68] Joseph Polastre, Robert Szewczyk, and David Culler. Telos: enabling ultra-low powerwireless research. In IPSN ’05: Proceedings of the 4th international symposium onInformation processing in sensor networks, page 48, Piscataway, NJ, USA, 2005. IEEEPress.
[69] A. Prudenzi. A neuron nets based procedure for identifying domestic appliances pattern-of-use from energy recordings at meter panel. In Power Engineering Society WinterMeeting, 2002.

BIBLIOGRAPHY 110
[70] Smart Energy Profile 2.0. Zigbee Alliance, 2010.
[71] Thanos Stathopoulos, Lewis Girod, John Heideman, Deborah Estrin, and Karen Weeks.Centralized routing for resource-constrained wireless sensor networks (sys 5), 2006.
[72] W. Swan. The language of bacnet. Engineered Systems. Vol. 13, No. 7, pp. 24-32, 1996.
[73] Tektronix. SDH Telecommunications Standard Primer. http://www.tek.com/Measurement/App_Notes/sdhprimer/2RX_11694_2.pdf.
[74] Tektronix. SONET Telecommunications Standard Primer. http://www.tek.com/Measurement/App_Notes/SONET/.
[75] The Modbus Organization. Modbus Application Protocol Specification. http://www.modbus.org/specs.php.
[76] U.S. Department of Energy. EnergyPlus. http://apps1.eere.energy.gov/buildings/energyplus/.
[77] U.S. DOE Energy Information Administration. Commercial buildings energy consump-tion survey, 2003. http://www.eia.doe.gov/emeu/cbecs/.
[78] U.S. DOE Energy Information Administration. Buildings energy data book, 2008. http://buildingsdatabook.eere.energy.gov/.
[79] Kamin Whitehouse, Chris Karlof, Alec Woo, Xiaofan Jiang, and David E. Culler. Theeffects of ranging noise on multihop localization: an empirical study. In IPSN, pages73–80, 2005.
[80] Wikipedia. Building management system — Wikipedia, the free encyclopedia, 2010.[Online; accessed 9-August-2010].
[81] Wikipedia. Sankey diagram, 2010. [Online; accessed 9-August-2010].
[82] Wikipedia. Scada – Wikipedia, the free encyclopedia, 2010. [Online; accessed 9-August-2010].
[83] WirelessHART. HART Communication Foundation, 2009.
[84] Alec Woo, Terence Tong, and David Culler. Taming the underlying challenges of reliablemultihop routing in sensor networks. In SenSys ’03: Proceedings of the 1st internationalconference on Embedded networked sensor systems, pages 14–27, New York, NY, USA,2003. ACM.