GENDER STATISTICS: the work of the FAO Regional Office for Europe and Central Asia (REU)
Republic of Mauritius
Ministry of Finance and Economic Development
Central Statistics Office
A guide to the
Central Statistics Office
October 2005
Foreword
This guide describes the Central Statistics Office (CSO) and the services it provides to users of statistics and the public in general.
Since its creation in 1945, the output of the CSO has been growing continuously to meet data needs of planners and users, while at the same time the technical staff has increased from 8 to around 200.
A new Statistics Act is in force since April 2001, which extends the list of matters on which information may be collected. The new Act also provides for the setting up of a Statistics Advisory Council to advise, among other things, on the improvement, extension, co-ordination and harmonisation of statistical activities in Mauritius, and the maintenance of independence, accuracy, relevance, integrity, timeliness and professional standard of statistical information produced by Government.
In 2000 Government subscribed to the IMF General Data Dissemination System (GDDS). This system aims at improving the quality and accessibility of data produced and disseminated by member countries of the IMF. The country expects to graduate to the more stringent requirements of the IMF Special Data Dissemination Standard (SDDS) in the near future.
It is hoped that this publication will create better awareness and understanding of the CSO and its products, thereby encouraging both professional data users and the public at large to make more effective use of the services it provides. To facilitate access to these services, the name and telephone number of the contact person for each subject area is included.
H. Bundhoo Director of Statistics
Guide to CSO
Table of Contents
Foreword
Our Mission
Our Vision 1 Statistical Data Collection in Mauritius 2 The Central Statistics Office 3 Cartography
4 Data Processing & Computerisation 5 Data Dissemination 6 Censuses and Surveys 7 Indices 8 Agriculture 9 Co-operatives 10 Crime 11 Education 12 Energy
13 Environment
14 External Trade 15 Financial Services 16 Government Finance 17 Housing 18 Industrial Production 19 Judiciary
20 Labour 21 National Accounts (Annual) 22 National Accounts (Quarterly) 23 Population 24 Prices 25 Productivity 26 Road Accidents 27 Road Transport 28 Social Security
29 Tourism
30 Women and Child Welfare
31 Statistics not Covered by C.S.O
Annex

Our Mission
To provide timely, relevant and reliable
statistics, consistent with international
principles and standards, for effective
decision-making and monitoring
Our Vision
To be a key provider of world-class
statistical information
1. STATISTICAL DATA COLLECTION IN MAURITIUS
1.1 Organisational Framework
The Central Statistics Office (CSO), which was set up in 1945, is the official organisation responsible for the collection, compilation, analysis and dissemination of all official statistics relating to all aspects of the economic and social activities of the country. By virtue of the Statistics Act 2000, the CSO is the central depository for all statistics produced in Mauritius. Section 5(c) of the Act stipulates that the Director "shall co-ordinate and monitor statistical activities in all ministries and government departments, local authorities and other statutory bodies" with a view to ensuring, among other things, that approved statistical standards and procedures are applied. Currently there are two ministries which have developed their own statistical systems. These are the Ministry of Health and Quality of Life and the Ministry of Fisheries.
1.2 Organisations involved in data collection
Statistical data collection in Mauritius is not restricted to the CSO and government ministries and departments. A number of non-government organisations are also actively engaged in statistical data production for their own internal purposes and/or for servicing other organisations, including government ministries and departments. Foremost among them is the University of Mauritius which often conducts surveys and studies, either as part of its own research activities or on behalf of other bodies.
The Centre for Applied Social Research (CASR), which is a joint initiative of the University of Mauritius and the Mauritius Research Council, was set up in the year 2000 with a view to undertaking further research on the strengths and weaknesses of the Mauritian society. The centre piece activity of the CASR is the Mauritius Social Audit - a project meant to provide barometric measures on major issues concerning the welfare of the population. Thus the Centre collects data on topics such as financial well-being and stability, access to financial services, employment, health, education, inequality, family dynamics, local environment, social network/capital, social attitudes and demographics.
The Bank of Mauritius, which is responsible for balance of payments, also produces a wide range of monetary and banking statistics such as reserve money, monetary ratios, circulation of money, commercial banks' assets and liabilities and inter-bank transactions.
Business organisations such as Mauritius Chamber of Commerce and Industry, Mauritius Sugar Syndicate, Mauritius Chamber of Agriculture, Mauritius Employers' Federation, have their own system of data collection for their respective fields of interest.
Some non-profit institutions also produce statistics from their administrative records and conduct surveys from time to time on subjects of topical interest or current concern. Foremost among these NGO's is the Mauritius Family Planning Association
which has carried out studies on abortion and AIDS-related risk behaviour in Mauritius.
1.3 Data sources
The main sources used by CSO to obtain information for the compilation of official statistics are: (a) censuses, (b) sample surveys and (c) administrative records.
(a) Censuses
Censuses provide first hand primary data at source. Mauritius has a long history in the taking of censuses and a detailed description of these censuses is given in Section 5: "Censuses and Surveys".
Censuses are conducted at regular intervals to provide up to date data at low spatial level for planners and decision makers. They also provide data for benchmarking purposes. The results provide sampling frames for the conduct of other sample surveys. (b) Sample Surveys
The CSO has a regular programme of sample surveys covering household and enterprise income and expenditure and labour force. These surveys are conducted at periodic intervals and provide an important source of data to planners. Furthermore, in order to address the demand for more social indicators, a Continuous Multipurpose Household Survey has been conducted since the year 1999 and is meant to be an on-going exercise covering various topics of interest.
The details of these sample surveys are given in section 6 "Censuses and Surveys".
(c) Administrative records
As a result of their routine administrative activities, most government ministries and departments generate various types of information that can be used as primary sources for statistics, depending on their relevance, consistency, coverage, completeness and accuracy. The main organisations whose record systems are exploited routinely to yield substantial statistical output are:
• Civil Status Division of the Prime Minister's Office (vital statistics) • Customs and Excise Department (trade statistics) • Income Tax Department (income tax statistics) • Judicial Department (judicial activities) • Ministry of Education and Scientific Research(education statistics) • Ministry of Finance (Government Finance statistics) • Ministry of Local Government and Solid Waste Management (licensing
statistics) • Ministry of Social Security, National Solidarity & Senior Citizen Welfare and
Reform Institutions (pension contributions and benefits) • National Transport Authority and Traffic Management Unit (road transport
statistics) • Passport and Immigration Office (statistics of international travel and tourism)

• VAT Department (VAT statistics)
1.4 Problems of data collection
(a) Response problems
In spite of this provision, however, there are always some respondents who feel reluctant to provide data requested by the CSO. The main reasons for this reluctance are twofold: on the one hand there is the response burden imposed on respondents who have to make special efforts and find the time to assemble the information, and on the other there is the fear that the data may be used for purposes other than statistical, especially taxation.
Because of these restrictions, CSO assists ministries and Government departments to collect data under their own legislation. Besides, the Statistics Act 2000 makes provision for the joint collection of data by the Central Statistics Office and any other Ministry of Government Department, local authority or statutory body.
(b) Other problems
Many research institutes or private firms are conducting surveys for market research or opinion polls, thus increasing the burdens on would be respondents who may be selected in more than one survey at a time. Some people may not be able to differentiate between questionnaires for an official survey conducted by the CSO and those carried out by private organisations.
Data collected from administrative sources are not devoid of problems. The forms and documents which have been established independently of the CSO, may lead to inconsistencies and incomplete coverage. Besides, these organisations may be using non-standard definitions and methods and this necessitates careful putting together to have meaningful statistics.

2. THE CENTRAL STATISTICS OFFICE
2.1 Introduction
The Central Statistics Office (CSO), formerly known as the Central Statistical Office was created in July 1945, in consequence of a recommendation made by the "Commission of Enquiry into the disturbances which occurred in the North of Mauritius in 1943". The primary function of the Office was to collect, improve, co-ordinate and analyse statistical information regarding every branch of the economic activity of the country.
Following the introduction of the Statistics Act 2000, the Office is known as the Central Statistics Office. The scope of its activities has gradually been extended to cover a large range of statistical activities, and now includes:
• General organisation of a consolidated scheme of social/economic statistics. • Coordinating and monitoring statistical activities in government and statutory
bodies. • Conduct of national censuses and surveys. • Regular publication of Economic and Social Indicators, various statistical
digests and ad-hoc statistical reports. • Participation in international conferences/seminars/meetings.
2.2 Location
The CSO was first located in the upper wing of the building of the Town Hall of the Municipality of Beau-Bassin Rose-Hill.
In 1949, it moved to a rented building at 8, Reverend Lebrun Street in Rose Hill. Following a request by the Director of Statistics for the construction of suitable offices, a building to accommodate the CSO was constructed on a plot of state land situated near the Court House in Rose Hill. This building has been the CSO's headquarters until 1989.
With increasing statistical activities as well as staff, C.S.O had to rent additional office space in nearby buildings. When this also proved insufficient, six storeys were rented in the Toorawa building, situated in Jummah Mosqué Street, Port Louis, to house the office headquarters.
In 1996, CSO headquarters had to move again, this time to the L.I.C. Centre in Port Louis, where it currently occupies an office space of around 1,820 m2 of office space.
2.3 The Statistics Act
The overall framework governing the collection, compilation and dissemination of statistics is embodied in the Statistics Act which was first passed on the 7 April 1951. This act was repealed on 2 April 2001 and replaced by the Statistics Act 2000, which was proclaimed on the same day. The new Act is posted on CSO's website

http://statmauritius.gov.mu. Section 5 empowers the Director of Statistics to, inter alia,
Take any Census in Mauritius. Collect, compile, analyse, abstract, publish and otherwise disseminate
statistical information relating to the commercial, industrial, financial, agricultural, social, demographic, economic activities and general conditions of the people of Mauritius.
Co-ordinate and monitor statistical activities in all Ministries and Government Departments, local authorities and statutory bodies.
Collaborate with Ministries and Government Departments in the collection, compilation, analysis, publication and dissemination of statistical information including statistics derived from the activities of those Ministries and departments.
Organise a co-ordinated scheme of social and economic statistics and statistics of sustainable development relating to Mauritius.
Ensure the independence, accuracy, relevance, integrity, timeliness and professional standard of statistical information produced by the Central Statistics Office.
Ensure the security and confidentiality of information collected under this Act. Cause the statistics collected under this Act to be compiled, tabulated and
analysed and, subject to this Act, cause the statistics or abstracts of them to be published and disseminated, with or without observations thereon, in such manner and by such media as he may determine.
The Statistics Act puts an obligation on respondents to furnish information required by the CSO. In fact Section 15 of the Act stipulates, inter alia, that any person who
o Hinders or obstructs an authorised officer in the execution of any powers under the act.
o Refuses to fill up and supply the particulars required in any return, form or other document, lawfully left with or sent to him.
o Knowingly makes any statement which is untrue shall commit an offence and shall, on conviction, be liable to a fine not exceeding 20,000 rupees and to imprisonment for a term not exceeding one year.
At the same time, the Act makes provision to ensure confidentiality of information supplied by respondents. Any officer who, without lawful authority publishes or communicates to any person otherwise than in the ordinary course of his employment any information acquired by him in the course of his employment shall commit an offence and shall, on conviction, be liable to a fine not exceeding 50,000 rupees and to imprisonment for a term not exceeding one year.
The CSO does not publish any individual return or part of it. Besides, no report, abstract or other document, containing particulars comprised in the return or answer so arranged as to enable identification of the particulars with any person, undertaking or business, shall be published, admitted in evidence or disclosed to any Ministry or Government Department unless the previous consent in writing has been obtained from the person making the return or giving the answer.

2.4 Statistics Advisory Council
The Statistics Act 2000 provides for the establishment of a Statistics Advisory Council. The functions of the Council are to advise the Minister with regard to:
1. The improvement, extension, co-ordination and harmonisation of statistical activities in Mauritius.
2. Any gaps and deficiencies in the provision of statistical services in Mauritius. 3. The actual and perceived integrity of, and public confidence and trust in,
statistics produced in Mauritius. 4. The setting up of priorities and programmes of work to be adopted by the
Central Statistics Office. 5. The promotion of an environment which is supportive of the collection,
production, dissemination and use of statistics. 6. The maintenance of confidentiality and security of individual information. 7. The maintenance of independence, accuracy, relevance, integrity, timeliness
and professional standard of statistical information produced in Mauritius. 8. Any matter referred to it by the Minister relating to statistical activities and
provision of statistical services in Mauritius.
The Council comprises members with experience in statistical matters, broadly representative of groups or interests concerned with the production and use of statistics, including Ministries and Government Departments, employers, labour unions, specialists in information technology, economic, financial and banking interests, social interests, users and producers of statistics, academia and consumer organisations.
2.5 Organisation of the CSO
(a) General
The CSO falls under the Ministry of Finance and Economic Development. It is responsible for all statistical activities, with a few exceptions such as
• fisheries and health statistics which fall under the responsibility of the respective Ministry, and
• banking and balance of payment statistics for which the Bank of Mauritius is responsible
The Office has decentralised its activities through the creation of Statistical Units in many government ministries. These Units are staffed by officers on the establishment of the CSO but directly servicing their respective ministries in all statistical matters. There are some 50 officers of the office posted in various Ministries/Departments:
(b) Staffing
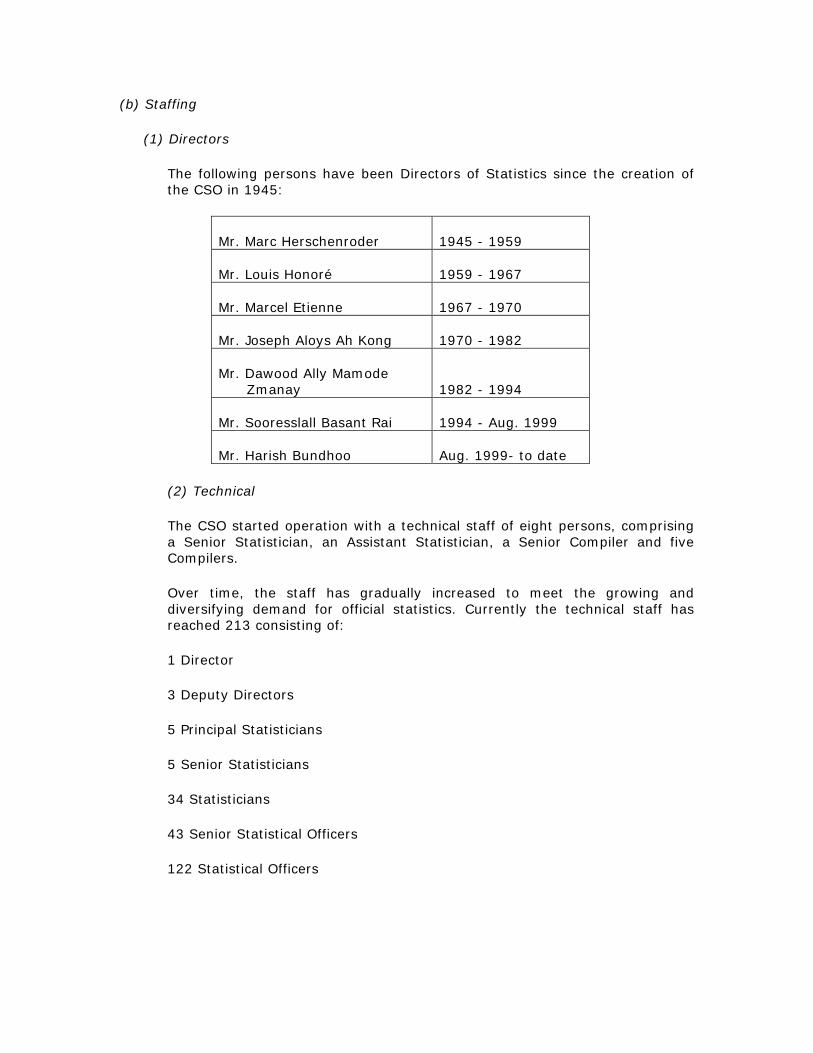
(1) Directors
The following persons have been Directors of Statistics since the creation of the CSO in 1945:
Mr. Marc Herschenroder
1945 - 1959
Mr. Louis Honoré
1959 - 1967
Mr. Marcel Etienne
1967 - 1970
Mr. Joseph Aloys Ah Kong
1970 - 1982
Mr. Dawood Ally Mamode Zmanay
1982 - 1994
Mr. Sooresslall Basant Rai
1994 - Aug. 1999
Mr. Harish Bundhoo
Aug. 1999- to date
(2) Technical
The CSO started operation with a technical staff of eight persons, comprising a Senior Statistician, an Assistant Statistician, a Senior Compiler and five Compilers.
Over time, the staff has gradually increased to meet the growing and diversifying demand for official statistics. Currently the technical staff has reached 213 consisting of:
1 Director
3 Deputy Directors
5 Principal Statisticians
5 Senior Statisticians
34 Statisticians
43 Senior Statistical Officers
122 Statistical Officers
(3) Non-technical
Besides staff of the Statistical Cadre, the Office has a pool of administrative staff which provides the necessary supporting services. This pool presently consists of a Personnel Officer, an Office Superintendent, an Office Supervisor, a Higher Purchasing and Supply Officer, a Finance Officer, a Higher Executive Officer, an Assistant Finance Officer, an Executive Officer, twelve Clerical Officers/Higher Clerical Officers, two Confidential Secretaries, a Senior Word Processing Operator, four Word processing Operators, a Head Office Attendants, ten Office Attendants, two Receptionists/Telephone Operators, three Drivers and two General Workers.
(c) Equipment
In order to avail itself of the facilities offered by development in modern technology, the CSO has acquired latest office equipment to enhance the quality and timeliness of its output. The Cartography Unit is equipped with digitizers, plan plotters and a plan photocopier for the production of Enumeration Area maps for field work and presentation maps for publication.
All statistical units are equipped with PCs, and are connected to a local server. Access to internet and e-mail is available to all staff. The office has also acquired a heavy duty photocopier and 2 duplicating machines for the production of economic and social indicators and other publications.

3. Cartography
3.1 Historical Background The Cartography Unit was set up in the mid-seventies to undertake extensive map preparation and production activities for censuses and surveys undertaken by the CSO. 3.2 Activities The main tasks of the unit consist of:
• preparing, updating and producing Enumeration Area (EA) maps for fieldworkers in censuses and surveys
• updating the number of households in each EA • preparing the primary sampling frame to be used during the sampling process in surveys, • allocating workloads to field workers in decennial censuses and • producing dot, density, cloropeth and other publication maps for reports produced by the
CSO 3.3 Data sources Data for the updating of maps are obtained mainly from (1) field visits carried out by officers in the unit, (2) Ministry of Housing for available updated maps, (3) location plan of sub-division of lands from the Ministry of Works, (4) plans of housing estates from the National Housing Development Company. 3.4 Scope and coverage Maps and number of households for Enumeration Areas are available for the whole Republic of Mauritius. 3.5 Computerisation The unit is in the process of computerising its mapping activities. Software used are : Autocad and Mapinfo. 3.6 Outputs Apart from continuously providing maps for census and surveys, the unit had produced an analytical report on Population Distribution and Migration Characteristics based on the 2000 Housing and Population Census. It is currently working in the production of a Census Atlas. 3.7 Future plans Further to the computerisation of the cartographic activities, the unit aims at producing EA maps in an automated format for the whole Republic of Mauritius by making use of Autocad.
Contact Person Mr. S. Mungrallee Acting Statistician Central Statistics Office L.I.C. Centre John Kennedy Street Port Louis MAURITIUS. Tel: (230) 212-2316, (230) 208-0781 Fax: (230) 211-4150 Email: [email protected]
4. DATA PROCESSING AND COMPUTERISATION
4.1 Background
At the creation of the Central Statistics Office in 1945, data processing was mostly done using mechanical punching, sorting and tabulation equipment.
With the acquisition of a computer mainframe in 1971 by the then newly created Data Processing Division of the Ministry of Finance (now Central Information System Division), the data processing activities of the CSO were then transferred to this department. However, at the same time, government administrative activities, of which payrolls and income tax, which had so far relied on manual systems, were being computerised. Very soon, these other government activities took precedence over CSO's requirements. These, together with the turnover of data processing staff, who were in great demand, gradually led to the accumulation of delays in processing of CSO's censuses and surveys and generally in the production of statistical data.
Difficulties encountered at the 1983 Housing and Population Census compelled the CSO to start thinking about self-reliance in data processing. In fact, many tables needed for the analysis of the census data could not be produced. At the same time, micro-computers were making their appearance on the market. CSO staff, on training courses overseas, came back with some knowledge about their uses and capabilities, while more and more user friendly software were becoming available. The computerisation of CSO's smaller tasks had begun.
The 1990 Housing and population Census was, however, a turning point in strengthening the data processing capabilities of the Office. The acquisition of equipment and training of staff began in 1989 with the assistance of United Nations Fund for Population Activities (UNFPA) and Economic Commission for Africa (ECA). Several staff were trained locally or overseas, on the software Integrated Microcomputer Processing System (IMPS) developed by the International Statistical Programs Centre (ISPC) of the U.S Bureau of Census for processing census and survey data. Data processing consultancy services were also provided by UNFPA at the actual processing stage of the Census.
The processing of the 1990 Housing Census data and the production of tabulations at national, regional and sub-regional levels were completed before the end of the census year, while similar tasks for the Population Census were completed by the end of the following year.
4.2 Latest development
With the competencies acquired during the 1990 Census, it was possible to produce tabulations based on the 2000 Housing and Population Census data in-house. Also, the office has created a few geographical databases based on the 2000 Census data and proposes to extend them to other datasets so as to arrive at a comprehensive Geographical Information System.
Further, the census data processing know-how has also spilled over to other units of the CSO. The development of a social accounting system and the integration of socio-demographic variables in the analysis and appraisal of economic performance are also in progress.
4.3 Present situation
The several censuses and surveys carried out by the CSO still rely on the CISD for data capture and some tabulations. In addition, many units use applications developed by CISD based on Foxpro, Access, Visual Basic and SQL Server. However the respective statistical units are tending more and more to rely on their own equipment and skills for statistical computation. This is further facilitated by the increased availability of hardware and user friendly software at the CSO. In terms of hardware, the CSO at headquarters is presently equipped with some 100 microcomputers distributed among its various statistical units. Two servers, one operational since 1998 using Windows NT 4.0 and a recently purchased entry level server having Windows Server 2000 as operating system, link 40 of these computers which constitute our Local Area Network (LAN). Each unit located at the head office is connected to the LAN.
Statistical units in other ministries and departments are also equipped with microcomputers and basic software provided by their respective ministries or departments.
The CSO uses standard software from Microsoft, as well as specialised statistical packages. Over the past years, several statisticians have undergone training in the use of IMPS, SPSS and STATA which are mainly used for census and survey data analysis.
In addition to these specialized packages, the following are being used:
• EUROTRACE for processing of trade statistics • PEOPLE for population projections • WORKERS for labour statistics • Adobe Acrobat Pro, Autocad, Dbase, Foxpro, MapInfo, Star Office and Visio.
4.4 Future plans
The CSO is committed to enhance its operations through an appropriate IT strategy. Preliminary work has started for the preparation of an e-business plan for the office. It is expected that the e-business plan will address the core functions of CSO in terms of data collection, processing and dissemination by way of print publications and through its website.

5. DATA DISSEMINATION
5.1 Introduction
Official statistics were initially published in a "Yearbook of Statistics", which first appeared in 1946. The publication of this Yearbook was discontinued in 1959 and was replaced by a Quarterly Digest of Statistics as from 1961. The periodicity of this Digest was subsequently reduced to biannual as from 1966 and finally to an annual one as from 1984. At the same time a number of specialised digests covering specific domains were started, while the present Economic and Social Indicators became a regular feature as from 1984.
Presently, the Central Statistics Office disseminates its data through the following publications:
• Digests of Statistics • Economic and Social Indicators • Ad-hoc reports • Mauritius in Figures
These publications are printed with the support of the Government Printer and are distributed free of charge to Ministries and government departments. Economic and Social Indicators are on sale at the office; the other publications are on sale both at the office and at the Government Printer’s Sales Office Unit, located in Ramtoola Building, Sir S. Ramgoolam Street, Port Louis.
A list of C.S.O publications is found at annex.
5.2 Digest of Statistics
The digests are mostly annual publications covering various topics. They are meant to bring together in a single volume all data pertaining to a given subject matter. Besides the Annual Digest of Statistics which generally covers the whole spectrum of statistics produced by CSO, the office also publishes separate annual digests covering the following domains, the figure in brackets showing the year in which the digest first appeared:
• Labour (1966) • International Travel & Tourism (1974) • External Trade (1977) • National Accounts (1983) • Education (1984) • Agriculture (1984) • Industry (1984) • Road Transport (1984) • Demography (1985) • Public Finance (1988) • Rodrigues (1994)

• Business Activity (1997) • Productivity and Competitiveness Indicators (1998) • Energy (1998) • Environment (2002) • Social Security (2002)
5.3 Economic and Social Indicators
In its endeavour to make data available to users within the shortest possible delay, the CSO publishes "Economic and Social Indicators" covering various sectors. These are indicators, which are mostly quarterly publications, are designed to rapidly disseminate the main statistical data pending the publication of the detailed digests or reports.
Each year, around 60 Economic and Social Indicators are released and they cover around 26 subjects on various socio - economic sectors. All these indicators are available on the internet at the following address: http://www.gov.mu/portal/goc/cso/indicate_1.htm
5.4 Ad-hoc publications
Ad-hoc reports follow mainly the completion or part completion of censuses and surveys, or availability of other sources of data. The results of censuses and surveys conducted by the Office are disseminated through two types of reports: one containing mainly statistical tables and another one dealing with the methodological aspects and analysis of the data.
5.5 Other means of data dissemination
Besides the above-mentioned print publications, the CSO releases the annual publication "Mauritius in Figures" which presents the main statistics in a pocket sized format. It is produced in 2000 copies and is made available free of charge to users.
5.6 Future plans
The Office intends to produce soft copies of reports and indicators for quicker and easier dissemination of statistical information.
The coverage of the CSO website will be expanded and will contain latest available data. It is also proposed to improve the website by making it dynamic and interactive.
6. CENSUSES AND SURVEYS
6.1 Introduction
The Central Statistics Office (CSO) has a long history in the taking of censuses and surveys, the most popular one being the Housing and Population Census which is conducted every ten years. The periodic surveys conducted by the office every five years cover household income and expenditure (Household Budget Survey), labour force (Labour Force Sample Survey) and industrial production (Census of Economic Activities). It is to be noted that a Continuous Multi-Purpose Household Survey (CMPHS), which is an on-going monthly survey, was launched in 1999.
The censuses and surveys are important statistical exercises which, besides supplying data of a temporal and spatial nature, also provide bench mark data to update existing series and projections.
6.2 Housing and Population Census
(a) Introduction
The general objectives of the census are to have up-to-date and disaggregated data on the housing conditions, spatial distribution and the demographic and economic characteristics of the population. These data are essential for reviewing and implementing housing, population, education and manpower policies, and for preparing, monitoring and evaluating development plans and programmes at both regional and national levels.
(b) Historical background
The first complete census for the Island of Mauritius was taken in 1735 under the governorship of Mahé de Labourdonnais. Since then, numerous complete censuses or partial counts of the population have been taken. However, the first census report to be printed was probably that of 1846. The 1846 census was followed by that of 1851. Since that date censuses have been taken every ten years up to 1931. With the outbreak of the Second World War, the one which was due in 1941 had to be postponed to 1944. The first census to be taken after the War was in 1952, and the ten-yearly programme was subsequently resumed with a census taken in 1962 and another one in 1972. The one scheduled for 1982 was postponed to 1983 because of the 1982 parliamentary elections. The following census which was due in 1993 was preponed to 1990 to satisfy an urgent need for up-to-date and reliable data, particularly on the economic characteristics of the population. The 2000 Census is the seventeenth for the Island of Mauritius and the seventh for the Island of Rodrigues.
(c) Methodology
Concepts and definitions used are according to those described in the handbook "Principles and recommendations for Population and Housing Censuses" (Statistical Papers Series M No. 67/ Rev.1) of the United Nations Statistical Office.
The Housing and Population Census is conducted in two distinct rounds: the Housing Census is carried out from February to April and the Population Census around June/July in respect of all persons alive on census night. The Housing Census enumerates all buildings, housing units, households, commercial and industrial establishments, hotels and boarding houses. A list of heads of households and their addresses is also drawn to serve as frame for the Population Census enumeration, which constitutes the second round of the census exercise.
The Census covers the whole Republic of Mauritius, i.e. the islands of Mauritius, Rodrigues and the Outer Islands (Agalega and St. Brandon).
(d) Data items
Housing Census 2000: Location and type of building characteristics (year of completion, principal material of construction used, etc.), ownership, occupancy, utilities (water, electricity, toilet, bathroom), refuse disposal, households characteristics (number of persons, number of rooms, fuel used for cooking and for heating water in bathroom), fruit trees on premises.
Population Census 2000: Relationship to head, sex, age, whereabouts on census night, usual address, citizenship, usual address five years ago, disability, marital status, age at first marriage, number of children ever born, religion and linguistic group, languages (read, written, spoken), school attendance and qualifications, and economic activity.
(e) Processing
Census data processing was until 1983 done by CISD on mainframe. In 1990, the office decided to assume responsibility for the processing of census data on microcomputers. The software used was the Integrated Micro-computer Processing System (IMPS) developed by the International Programs Centre (IPC) of the US Bureau of Census. The benefits of in-house census data processing were tremendous: timeliness was respected; tables for small geographical areas became available while ad-hoc needs of data users were satisfied within short periods of time. Census 2000 was also processed in-house using IMPS.
(f) Main outputs, indicators and dissemination
CSO publishes a series of tabulated data reports as well as reports on methodology and on sectoral analytical studies of the census results.
The following 2000 Census table reports are available:
• Housing and living conditions • Demographic and fertility characteristics
• Economic characteristics • Educational characteristics • Household characteristics • Geographical and migration characteristics • Disability
The 2000 Census analytical reports cover the following:
• Census methodology • Housing and household characteristics • Population data evaluation and projections • Population distribution and migration • Health, morbidity and mortality • Disability characteristics • Education • Nuptiality and fertility • Economic activity • Elderly
The first seven analytical reports have already been published and the other reports are expected by end of 2005.
Additional tables are prepared as and when needed upon request.
(g) Problems
Members of wholly absent households who are not in Mauritius on census night are not enumerated and hence are excluded from all tabulations. On the other hand, those of wholly absent households who are elsewhere in Mauritius (in secondary residences, etc.) are enumerated at the place of their whereabouts.
There have been an increasing number of non-contacts at the last census compared to previous ones. This is attributable to more persons working late in the evening and during week-ends, and also to the growing number of secondary residences. Multiple visits were needed to solve the problems of non-contact due to heads of households working at late hours.
(h) Future plans
It is proposed:
• To publish a Census Atlas in order to make census results more meaningful to a wider community; this will allow users to visualise the geographical distributions and patterns indicated by Census data.
• To relate the socio-demographic and economic characteristics to the housing and living conditions of the population by merging records of the Housing Census and the Population Census. This will enable a more comprehensive analysis of the census data.
6.3 Household Budget Survey
(a) Historical Development
The C.S.O conducted its first Household Budget Survey (HBS) in 1961/62 under the guidance of an expert from the International Labour Office, Mr. Wolf Scott. This survey was conducted among a sample of 1,053 households in the Island of Mauritius.
The second HBS was taken 14 years later, in 1975, with the assistance of the Government of India through the services of Mr. D.S. Ramaratnam. It was conducted among a sample of 2,400 households in both the islands of Mauritius and Rodrigues over the twelve-month period, January to December 1975.
The third HBS carried out in 1980/81, was the first household budget survey conducted by the CSO without foreign expertise. It covered a sample of 3,360 households in the Republic of Mauritius.
The fourth HBS was conducted among a sample of 4,800 households from July 1986 to June 1987.
Since then, the surveys have been conducted at regular intervals of five years. The 1991/92 and 1996/97 surveys covered 5,712 households and 6,240 households respectively. The latest HBS was conducted from July 2001 to June 2002 among a sample of 6,720 households.
(b) Objectives
The objectives of the HBS are to:
1. Determine the items of households goods and services which will constitute the basket of goods and services for the calculation of the CPI.
2. Estimate the weight for each consumption item in the CPI basket. 3. Supplement the data used in household accounts in the System of National
accounts and Balances. 4. Provide data on the distribution of household income and expenditure. 5. Provide information for the nutritional analysis of food consumption. 6. Make data available for social and economic planning.
(c) Data Collected
The latest 2001/2002 HBS covered all the regions in both Mauritius and Rodrigues. The unit of enquiry was the private non-institutional household. A sample of 6,720 households was selected using a two stage stratified sample, in such a way as to ensure overall representativeness of the whole resident population.
Data on the following were collected using five different questionnaires:
• Household expenditure data on a daily basis for the reference month. • Income data for each income earner in the responding households.
• Living conditions (type of dwelling, number of rooms, tenure, vehicles possessed, availability of other household amenities, fuel used for cooking, etc.).
• Socio-demographic characteristics of household members (age, sex, marital status, educational attainment and activity status).
• Regions and types of outlets where households usually made their purchases.
(d) Data processing
For the 2001/2002 HBS, data capture was carried out at the Central Information System Division (CISD) after all completed questionnaires had been checked for completeness and consistency by the officers of the C.S.O. The electronic data files obtained were then further processed and tabulated on the CSO’s microcomputers using the IMPS package.
(e) Dissemination
The main results of the Household Budget Survey 2001/2002 were published in an issue of the Economic and Social Indicators in November 2002. The methodological report was released in September 2003 and the analytical report in April 2005. All these publications are available on the CSO’s website at http://statsmauritius.gov.mu.
6.4 Continuous Multi-Purpose Household Survey
(a) Introduction
The Central Statistics Office (CSO) launched a Continuous Multi-Purpose Household Survey (CMPHS) in 1999. The primary objective of the survey is to provide a permanent platform for the collection of information relevant to the computation of appropriate socio-economic indicators to keep track of development on the social front.
The on-going nature of the survey also allows any topic of current interest to be easily integrated as a distinct module in the questionnaire. Every year, the topics to be covered are reviewed to take into consideration users' current needs.
(b) Objective
The main objective of the CMPHS is to obtain, on a regular basis, statistical information on the social and economic characteristics of the population of the islands of Mauritius and Rodrigues.
The data collected provide inputs for the development of social and economic indicators describing the various aspects of socio-economic development and its impact on the population. They are essential in the formulation and monitoring of policy programmes.
As from 2004, the CMPHS is being used as the dedicated instrument for the direct measurement of labour force, employment and unemployment on a quarterly basis. As such, the survey will help graduation to the Special Data Dissemination Standard (SDDS) of the International Monetary Fund (IMF).
(c) Coverage
The CMPHS is designed to cover all private households in the islands of Mauritius and Rodrigues.
From 1999 to 2002, a sample of 6,300 households was selected each year. In 2003 the sample size was increased to 6,480. The additional households covered were in the island of Rodrigues so as to produce some separate results for the island. In 2004, the overall sample size was further increased to 8,640 households to produce reasonably reliable quarterly estimates of labour force, employment and unemployment. Following a mission undertaken by an International Labour Organisation (ILO) consultant for the development of an efficient sample design that can also measure quarterly and yearly changes, the sample size has been increased to 11,280 in 2005.
(d) Data collection
The questionnaire consists of several modules:
1. A basic module covering the general characteristics of households and their members. This module is common to all rounds of the survey and pertains mainly to classificatory variables and information relating to the household as a whole.
2. One or more special topic modules dealing with subjects of current interest for in-depth investigation to assist policy. Every year different topics are investigated and questions are usually addressed to members of the household. As from 2004, one of the special topic modules deals exclusively with labour force characteristics of household members.
3. A final module grouping several other topics of general interest, but investigated in less detail.
(e) Office Organisation
The CMPHS Unit is responsible for the organisation and conduct of the CMPHS. The main duties consist of the following:
• questionnaire design • organisation and management of fieldwork • selection of areas and households to be surveyed • recruitment and training of field staff • editing and coding of data • tabulation, analysis and report writing

(f) Field organisation
The exercise involves fieldwork outside office hours, and specifically during weekends, to ensure contact for interview of working members of selected households.
(g) Data processing and dissemination of results
Data entry is done by staff of the Central Information Systems Division (C.I.S.D). The software IMPS is used for data capture. IMPS and STATA are used for tabulation.
From 1999 to 2003, the survey results were based on responses cumulated over the twelve survey months. As from 2004, labour force estimates and some main results on the other topics covered are published on a quarterly basis in the series Economic and Social Statistics: Continuous Multi-purpose Household Survey – Main Results (incl. Labour Force Estimates) available on CSO’s website at http://statsmauritius.gov.mu.
6.5 Census of Economic Activities
(a) Historical background
A Census of Economic Activities is a key statistical instrument for the collection of detailed comprehensive data on the structure of all economic activities carried out in a country.
Industrial output in Mauritius was first measured in 1964 and this exercise was repeated in 1968 but was restricted to the Manufacturing sector only. The first comprehensive Census of Economic Activities covering all sectors, except Agriculture, was undertaken in 1985-86 and a wealth of relevant and useful information was gathered therein. Subsequently, it was decided to undertake similar censuses at regular intervals of five years. Thus, Censuses were carried out successively in 1992, 1997 and 2002.
(b) Objectives
The main objectives of a Census of Economic Activities are:
• To collect statistics on the operating characteristics and structure of all units engaged in economic activities, outside Agriculture, carried out in Mauritius and Rodrigues.
• To assess the contribution of each sector in the overall economy, and in particular that of the small units.
• To provide detailed data for updating the National Accounts estimates and for the construction of an Input-Output table.
• To provide benchmark data and weights for the construction of production, productivity and other specific price indices.
(c) Methodology
The Census is undertaken in two phases. The focus at the first phase, lasting from January to December of the Census year, is on small establishments and itinerant units, operating with nine or fewer persons, inclusive of self-employed and own account workers. Data are collected from a sample of these small units by direct interview method.
The second phase consists of a complete enumeration of the large non-agricultural establishments which are surveyed by mail questionnaire. The reference period for the collection of data is nominally the calendar year. However, as all firms do not have a common accounting year, data referring to any twelve month covering part of the reference year are accepted.
(d) Topics covered
The questionnaires seek information on a wide range of data items which can be summarised under the following broad headings:
description of the establishment employment and labour cost purchase of raw materials and services receipts from sale of goods or provision of services inventories capital account supplementary information
(e) Dissemination of results
The results of the Census are published in four publications:
• An ‘Economic and Social Indicators’ presenting the main findings of the first phase.
• Report- vol.1: Describing the methodology and organisation of the first phase, covering small establishments and itinerant units.
• Report- vol.2: An analysis of the results of the first phase, and • Report- vol.3: The methodology and analysis of data from the second phase,
covering large establishments.
6.6 Labour Force Sample Survey
(a) Historical background
Comprehensive information on the economically active population had up to 1995 been collected at population censuses, carried out every ten years. From this source, it has been possible to determine the size and basic characteristics of the population of working age. The number of persons employed by industry, occupation, status in employment, etc. as well as the number of unemployed persons have thus been obtained for these specific years. However, the efficient planning and management of the rapid changes in the labour market, economic growth and development calls for similar data at shorter intervals of time. Hence the decision to carry out labour force sample surveys midway between two population census years. The first one was conducted in mid-1995.
(b) Objectives
The principal objective of the Labour Force Sample Survey is to obtain comprehensive statistical data on the economically active population, comprising employed and unemployed persons, as well as on the inactive population of working age. Statistics compiled from the survey data are useful not only for government planners, but for businessmen and research workers as well.
The size and structure of the country’s workforce can also be determined so as to assess changes in the labour market and in the employment situation by comparing with figures for previous years, obtained from past censuses and surveys. These data also enable a review of previously made projections for the coming years.
Another objective in collecting data on the economically active population is to measure labour supply and the extent to which available human resources are being utilised in the different sectors of the economy. Such information is essential for planning and formulating policies on the development of human resources.
(c) Methodology
The 1995 survey was carried out in two phases. First, a systematic and complete listing of all private households was made within each of a number of selected enumeration areas. Information listed includes name and address of head of household, number of working members, household size and total monthly expenditure. The last two items were used for grouping of households into strata before selection of the sample households for follow-up and interview.
At the second stage, households were selected from the listings and all members aged 12 years or more were interviewed. The information gathered in the questionnaire was grouped under the following sections: household characteristics and demographic characteristics of members, usual activity during the last year, current activity during a survey week and current employment.
(d) Processing and Dissemination Data entry and tabulations were carried out with the collaboration of the Central Information Systems Division (CISD) using the software IMPS. The results were published in the report: Labour Force Sample Survey 1995.
6.7 Survey of Outgoing Tourists
(a) Introduction
The Survey of Outgoing Tourists is conducted by the Statistics Unit of the Ministry of Tourism and Leisure and is financed by that Ministry. The first survey was organised in 1984, and since then it has been carried out every two years.
(b) Objectives
The primary objective of this survey is to obtain comprehensive statistical information relating to foreign tourists who visit the country in order to supplement data on tourism statistics compiled from embarkation and disembarkation cards and from other sources.
The results of the survey provide the Ministry of Tourism and other stakeholders of the tourist industry with a rigorous basis for better planning and marketing decisions.
(c) Topics covered
The survey covers aspects such as purpose of visit, mode of travel, party size, length of stay, expenditure patterns and items purchased, frequency of visits. Respondents are also invited to evaluate their stay in the country and to make suggestions for the improvement of tourist facilities.
(d) Methodology
Data are collected during one whole week for each month of the survey year. The weeks are selected on a rotating basis, e.g. is if the survey is conducted during the first week of January, then in February the second week will be chosen, the third week in March, etc. This is done in order to take care of seasonality and other fluctuations.
A team of trained interviewers is posted in the departure lounge of the Sir Seewoosagur International Airport to interview a sample of departing tourists.

(e) Sample selection
No "a priori" sample design is established. Interviews are conducted among tourists as they enter the departure lounge after completing check-in and immigration formalities. A Supervisor closely monitors the situation and ensures representativeness among all departing flights by appropriately directing interviewers to visitors to be interviewed.
On the average, around 15,000 interviews are conducted during each round of the survey, covering some 31,000 tourists. This represents between 5 to 6% of all tourists visiting the country.
6.8 AGRICULTURAL COST OF PRODUCTION SURVEY
(a) Introduction
The Central Statistics Office is presently conducting an Agricultural Cost of Production Survey (ACOPS) for the first time in Mauritius and Rodrigues.
(b) Objectives
The primary objectives of the survey are to:
a. Strengthen the database relating to various inputs which are used in the cultivation of sugar cane, tea, tobacco, flowers and food crops;
b. Update the technical coefficients used in the compilation of production accounts for agriculture; and
c. Provide accurate measures of unit cost of production.
(c) Period
The fieldwork started in January 2005 and will extend over the whole year.
(d) Sample/Methodology
A sample of 1,100 planters has been selected in the Island of Mauritius and 90 planters in Rodrigues. Sugar cane, tobacco, tea, commercial flowers and the major foodcrops are being covered.
The selected planters are visited regularly during the whole cycle of a crop to collect data on inputs used for the various operations throughout the cycle, and the disposal of the agricultural products.
(e) Field staff
The whole operation is coordinated by a Chief Supervisor, assisted by a Senior Supervisor. The fieldwork is undertaken by a team of four Supervisors and sixteen Interviewers in the Island of Mauritius, and one Supervisor and two Interviewers in Rodrigues.
(f) FAO Assistance
Since it is the first time that such a survey is undertaken in Mauritius, the technical assistance of FAO has been sought. Up to now three technical missions have visited the CSO and have provided guidance on the design of the questionnaire, the selection of the sample, the overall methodology and the methods of estimation.
(g) Cost of Project
The total cost of the project is Rs 6 million. The Government of Mauritius will contribute Rs 4.5 million while the FAO contribution is estimated around Rs 1.5 million (US $ 49,000).
(h) Release of results
The results are expected in December 2006.
Contact Person Mr. C. Ramnath Ag. Senior Statistician Central Statistics Office L.I.C. Centre John Kennedy Street Port Louis MAURITIUS. Tel: (230) 208-0781, (230) 212-2783 Fax: (230) 211-4150 E-mail: [email protected]

7. INDICES
7.1 Introduction The general aim of an index number is to indicate changes over time in an economic phenomenon such as prices, volume of production, etc. Index numbers compress many facts into a few simple figures and, in conjunction with other data, their use in economic analysis are in summarising past developments, forecasting future trends and making decisions on policy.
The Consumer Price Index was the first index to be compiled at a national level by the C.S.O in 1961. Since then, the office has compiled a battery of indices to include other price and volume indices such as index of industrial production, export price index, producers' price index (agriculture and manufacturing) and construction price index. These indices are particularly useful for national accounts estimates at constant prices.
7.2 Consumer Price Index (a) Introduction The Consumer Price Index (C.P.I) is a number which expresses the changes over time in the level of prices of goods and services purchased by private households. It is widely used for adjusting wages, pensions and other social security benefits, and for adjusting prices in commercial and civil contracts, and, as such, is of paramount interest to government, unions, business organisations, research institutions and very large segments of the general public.
Since the creation of the Central Statistics Office in 1945, price level indices and cost of living indices for selected groups were already being computed. However, a Consumer Price Index was compiled for the first time by the C.S.O in 1961. In fact, three sets of indices were calculated, one for urban region, one for rural region and one for the whole country. This index was revised in 1976, and subsequently every five years. It is to be noted that, since there were no major differences among the regional indices, only one index was compiled for the whole country as from 1976.
The C.S.O has set up a Unit which is responsible for the calculation of the monthly C.P.I and the organisation of the Household Budget Survey every five years. The regular staff consists of a Statistician, a Senior Statistical Officer and six Statistical Officers. Additional officers are recruited on an ad-hoc basis for the fieldwork and processing of the Household Budget Survey data.
(b) Methodology
The compilation of C.P.I follows standards of the International Labour Office (ILO).
Prior to July 2002, goods and services constituting the basket were classified according to the 1968 System of National Accounts (SNA). Following the conduct of

the 2001/2002 Household Budget Survey, the UN COICOP (Classification of Consumption Expenditure according to Purpose) is being used since July 2002.
The C.P.I covers both the islands of Mauritius and Rodrigues. The sample of goods and services, and their corresponding weights, as well as the sample of outlets where prices are collected, are derived from the Household Budget Survey.
(c) Price collection
Computation of the CPI mainly involves price collection and verification. Collection of prices is performed through field visits to the selected outlets in the selected regions. For perishable items such as fresh vegetables, fresh fruits, fresh meat and fish, prices are collected on a weekly basis from markets and the monthly national average prices are computed. For non-perishables, prices are collected once a month from the 12th to the 18th of each month. Prices on rented dwellings are collected every quarter. It is to be noted that the index is based on transaction prices, that is prices that any member of the public would be paying to purchase the specified good or service in specific outlets and regions.
In addition, items that are no longer available need to be replaced. Appropriate adjustments for quality changes are made by collecting prices for an overlap period or by consulting the selling unit.
Currently a total of about 6,200 price quotations are collected from 370 outlets each month. The prices are checked for consistency and used in the compilation of the monthly index.
(d) Processing
On average about 450 price changes are noted per month. Amendments are made in respect of these price changes on the computer. The C.P.I is compiled independently on two applications: a Foxpro-based application and on Excel. This is done in order to ensure the correctness of data entry and calculations.
(e) Dissemination
The monthly CPI is released within five working days after the reference month. It is published in the Government Gazette and is posted on the CSO website.
Quarterly Economic and Social Indicators on the CPI are published within one month after the reference quarter. Contact Person Mr S. Bhonoo Statistician Central Statistics Office John Kennedy St Port Louis MAURITIUS Tel: 212-2316, 208-0781 Fax: 211-4150 Email: [email protected]

7.3 Foreign Trade Unit Value Indices
The unit value index is an estimate of the unit values of imports/exports in any given period relative to the unit values of those imports/exports in a predetermined (base) year.
Unit value indices have been calculated as far back as 1964. The present ones are being compiled using 2002 as base year. They are used
• to analyse the effects of devaluation
• to provide deflators for national accounts
• to make budget revenue projections and macro-economic forecasts
• to break down the global value of imports and exports into their price component and subsequently volume component
• to provide quarterly measures of the trend in the price of the country's exports and imports
The CSO presently compiles on a quarterly basis three series of unit value trade indices:
Domestic exports unit value index Imports unit value index EPZ exports unit value index
A major problem of such an index is that a change in the average unit value index does not necessarily signify that the fluctuation is due to a difference in price, but could well be attributable either to a shift in the quality of a product or to a change in the product mix within the commodity code or still to a change in the country of destination/origin. This is why "pure" price indices are recommended since they measure changes in actual prices paid by importers and exporters. Contact Person Mr. D. Pothegadoo Statistician Central Statistics Office L.I.C. Centre John Kennedy Street Port Louis MAURITIUS. Tel: (230) 208-0781, (230) 212-2783 Fax: (230) 211-4150 Email: [email protected]
7.4 Export Price Index
(a) Introduction The Export Price Index (EPI) is a measure of price changes of domestically produced Mauritian products exported to other countries, that is it excludes re-exports. It is an indicator of price trends for exported commodities. The EPI was first compiled by the CSO in 1993, with that year being used both as reference period and base period for the calculation of weights. The index is calculated on the basis of fixed weights and is thus affected by changes in the composition of exports. Consequently, after some time, the index becomes less representative of the actual price movements it is supposed to monitor, and the structure of the index must be revised periodically. The index was first revised in 1997 and subsequently in 2003. For the EPI revision in 2003, the base period is the calendar year 2002 as the weights were derived from the 2002 domestic exports and the reference period is 2003. The EPI is used mainly as an indicator of price trends for exported commodities. It serves also as a deflator for exported goods at current prices. This index can also be used to assess the competitiveness of Mauritian products in relation to price trends of similar products of other countries. (b) Selection of commodity items (2003 revision) At a first stage, all Standard International Trade Classification (SITC) groups at the 3-digit level whose domestic exports for the year 2002 represented at least 0.2% of domestic exports were selected. Within each group, all major products (SITC 7-digit) were chosen, based on the volume and frequency of exports. If the volume of exports of a product is not substantial, there is the possibility that exports of such product will phase out. Similarly, an item which was not exported frequently would not be a good pricing indicator since breaks in pricing will affect the sensitivity of the price index. (c) Selection of exporters For an establishment to be selected, its exports had to be sufficiently representative of the traders engaged in similar trade. Based on the criteria of both regularity and size of trading transactions, a suitable number of exporters were selected for the collection of prices. These exporters accounted for a sizeable proportion of the market share and were less likely to be engaging in casual trading of the respective items. However, in order to take care of possible closure of an establishment that may occur before the next revision of the index, a few additional respondents were selected for pricing. (d) Price collection A survey form with detailed description of the product, SITC code and unit of quantity is used for the collection of prices. At the end of every quarter, officers of the Prices Unit visit the responding establishments to collect, for each month of the quarter, prices of commodities exported. Prices for a particular month are compared with those of previous months and the respondents are asked for clarification for prices that display unusual variations.
(e) Index computation and dissemination The EPI is computed on a quarterly basis using the Laspeyres’ formula. In case prices for a commodity are not available for a particular quarter, due largely to no exports during that period, they are regarded as being unchanged for that quarter compared to the previous one. However, if such commodities are no longer exported, their prices are imputed using price movements of similar commodity items.
The EPI is released on a quarterly basis in Economic and Social Indicators, a publication of the CSO (also available at http://statsmauritius.gov.mu).
Contact Person Mr. D. Pothegadoo Statistician Central Statistics Office L.I.C. Centre John Kennedy Street Port Louis MAURITIUS. Tel: (230) 208-0781, (230) 212-2783 Fax: (230) 211-4150 Email: [email protected]
7.5 Import Price Index
(a) Introduction
The Import Price Index (IPI) provides an overall measure of pure price changes of goods imported into the country. Goods imported by the Mauritius Freeport Authority (MFA) are excluded since they are meant mainly for re-exports. The IPI was first published by the CSO in 2004 with 2003 as the reference period. The IPI is also used to calculate changes in the volume of imports. (b) Selection of commodity items and importers Based on total imports for the year 2002, all Standard International Trade Classification (SITC) groups at the 3-digit level whose total value for the year represented at least 0.5% of total imports were selected. These selected groups directly covered around 61% of the total imports for the year 2002. Within each group, commodities (SITC 7-digit) were selected based on the following criteria:
• An item is included if it is imported regularly and frequently. • The volume of imports of the commodity was substantial. • There must be a sustained demand.
• Items had to be specific and detailed enough for pricing. Similarly, an importer for a particular product is selected provided that he imports that product on a regular basis. (c) Price collection Prices are collected by officers of the Prices Unit. Each reporting firm is visited once every quarter and prices are supplied for the last consignment of goods imported for that quarter. Prices are reported on a cost, insurance and freight (c.i.f) basis and are expressed in Mauritian Rupees. (d) Index computation and dissemination The IPI is computed on a quarterly basis using the Laspeyres’ formula. In case prices of commodities are not available for a particular quarter (no imports), the fluctuations in exchange rates for that quarter compared to the previous one are used to adjust the prices. The IPI is released on a quarterly basis in the Economic and Social Indicators. Contact Person Mr. D. Pothegadoo Statistician Central Statistics Office L.I.C. Centre John Kennedy Street Port Louis MAURITIUS. Tel: (230) 208-0781, (230) 212-2783 Fax: (230) 211-4150 Email: [email protected]
7.6 Construction Price Index (Residential)
(a) Introduction
A Construction Price Index measures the change in the level of construction prices. The construction industry is very broad and highly diversified with considerable variations from one type of construction to another. This makes it difficult to derive generalized indices that would be applicable to the industry as a whole. As a result, different approaches to index number compilation are used depending on the purpose for which the index is required. The input approach measures changes in the prices of inputs used in the construction of the given structure, while the output method measures the change in prices the client has to pay the construction industry for construction works. The output price depends not only on the inputs but also on market conditions.

The office opted for the input price index, which though more limiting than the output price index, is simpler and less expensive to construct and maintain. An index to cover the whole construction sector would have mobilised an unduly large amount of financial and human resources. It was therefore decided that the CSO would start with an input price index for residential buildings only. Furthermore, since it would have been time consuming and costly to include all types of residential buildings, it was decided to restrict the index to the most common type identified at Housing Censuses.
The Construction Price Index was first compiled by the Central Statistics Office in 1994. The index had as base period the fourth quarter of 1993 and the model house used for computing the index was the most common type enumerated at the 1990 Housing Census.
A review of the specifications and weights was necessary to take into account changes with respect to both inputs and technology that have occurred in the construction industry since 1993. Consequently, the index was updated in 2001 and the model dwelling used was the most common housing unit identified at the 2000 Housing Census.
The drawings of the prototype model house were provided by the Mauritius Housing Company Ltd. The quantity survey work to determine the weighting pattern for the index was entrusted to a private firm of quantity surveyors following established procedures.
(b) Uses
The index is used as a deflator of investment in residential buildings. It also serves as a guide to estimate the deflator of both the investment in non-residential buildings and the output of the construction sector. It can also be useful for renegotiating owner-tenant agreements.
(c) Calculation
The index is calculated on a monthly basis but published on a quarterly basis. Any given construction consists of an assembly of a certain number of stages or work categories. Nineteen stages or broad work categories were identified and detailed costs of inputs in terms of labour, plant, materials and transport that go into the construction of the selected model were calculated under each of the 19 work categories. The weights have been worked out in such a way that they can be presented in terms of inputs as well as work categories. For publication purposes, weights and sub-indices are shown not only for the 19 work categories, but also for the 4 broad input categories of labour, plant, materials and transport, the “materials” category being further sub-divided into 17 sub-categories. The index is calculated according to the modified Laspeyres formula and is a weighted average of price relatives for individual items or work categories. The base period for the calculation of weights is the fourth quarter of 2001.
(d) Data Collection
The data needed for the computation of the index are collected every month by staff of the Central Statistics Office from a sample of 53 outlets in 8 regions of the island. Prices are collected in respect of some 84 items representative of all items that go into the computation of the index.
(e) Dissemination
The index is calculated on a monthly basis and published in the Economic and Social Indicators on a quarterly basis. The first issue showing indices for the first quarter of 1994 was published in September 1994. The index is also published in the Annual Digest of Statistics and is available on CSO's website at http://statsmauritius.gov.mu.
(f) Future plan
The Construction Price Index which is currently being compiled is of limited use since it does not cover the whole construction sector. It is therefore proposed to extend the index to non-residential buildings and other construction work. Contact Person Mr A.Ramasamy Ag. Statistician Central Statistics Office L.I.C. Centre John Kennedy Street Port Louis MAURITIUS. Tel: (230) 212-2316, (230) 208-0781 Fax: (230) 211-4150 Email: [email protected]
7.7 Producer Price Index (Agriculture) – PPI-A
(a) Introduction The PPI-A provides information on trends in producer prices of agricultural products and purchase prices of the means of agricultural production. In 1993, the CSO started the compilation of a Producer Price Index to measure the output price for different groups of agricultural commodities.
In order to reflect changes in the production pattern of agricultural products, a new set of weights was calculated in 2002, the base year being 1997.
The index is calculated on a monthly, quarterly as well as on an annual basis and published on a quarterly basis in the Economic and Social Indicators. The indicators are published within 10 weeks of the reference quarter. The index is also published

in the Digest of Agricultural Statistics and can be accessed from the CSO website: http://statsmauritius.gov.mu. (b) Uses The PPI-A may serve various purposes such as:
1. Estimation of general price trends and their relationship with other pertinent variables.
2. Monitoring the implementation of agricultural price policy decisions: e.g. the introduction or modification of support prices.
3. Forecasting price movements in connection with market studies or business cycle research.
4. Compilation of national accounts at constant prices. (c) Methodology Weighting scheme and base period
As price data are associated with commercial transaction, it is logical to relate prices to sales rather than total production. However, since value of production for the market (sales) is not available, the value of total production is considered as a proxy in calculation of weights.
The base weights have been derived by multiplying the average production for 1996-1998 by the average unit price in 1997. The weight assigned to each commodity group is on the basis of total production pertaining to each group. At commodity level, the weights are apportioned within the commodity group on the basis of production of each product.
Coverage
The bulk of the products in agriculture, with the exception of forestry, fishing and agricultural services, is taken into account in the PPI-A. Thus, almost 90% of the total value of agricultural production is covered.
Price collection
In principle, the prices collected for the index should be farm-gate prices, but this is not possible in many cases. For example, in the case of vegetables, farm-gate prices are extremely difficult to obtain, not only because of the enormous resources to be mobilised but also because of the inexistence of a list of planters. Hence, in lieu of farm-gate price, the wholesale price of the produce is recorded at the two main auction markets located in Port Louis and Vacoas. For the main commercial crops (sugarcane, tea leaf and tobacco leaf, etc.), the respective marketing agencies are the source of the price data. For fruits, price is recorded from different sources such as planters and first middlemen. For animals and animal products, price data are available at sources varying from marketing agencies to producers.
Frequencies of price collection vary from weekly for some commodities to only once a year for others. For vegetables, prices are collected once a week while for commodities for which prices are fairly stable, data suppliers are visited on a quarterly basis, but prices are collected for each month of the quarter. For the main agricultural crops like sugarcane, tea leaf and tobacco leaf, the reported prices are
normally fixed for the crop year by the respective marketing agencies. For the remaining items, prices are collected on a monthly basis.
Seasonality and periodicity
In order to take seasonality into account, the method of variable baskets with fixed monthly weights in the base year is used. There are 12 monthly baskets of representative products, with varying composition. Certain products whose marketing period covers the whole year appear in all 12 monthly baskets, while others, which are more seasonal, appear only in some of them. However, the composition of the basket for a given month is fixed over time. Contact Person Mr B. Unmar Statistician Central Statistics Office L.I.C. Centre John Kennedy Street Port Louis MAURITIUS Tel: (230) 213 3073, (230) 208 0781 Fax: (230) 211 4150 Email: [email protected]
7.8 Producer Price Index (Manufacturing)
(a) Introduction The Production Price Index-Manufacturing (PPI-M) measures changes in the effective selling prices received by producers for that part of their output which is sold on the domestic market. It reflects the price trends of a constant basket of goods representative of the total output of an industry. The CSO started the compilation of such an index in 1993. However, due to lack of resources, the index was limited to “Food, Beverages and Tobacco” establishments whose output is sold on the domestic market. The scope of the index has now been extended to cover all relevant industry groups of the Non-EPZ manufacturing sector. The PPI-M is calculated on a monthly basis, but published quarterly in the Economic and Social Indicator.
(b) Uses • The PPI provides specific price deflators for the computation of national accounts
at constant prices in order to measure real growth. • It is helpful in the formulation of contract agreement. It can be used as an
escalation clause to protect buyers and sellers against inflation or deflation.

• It can also used in econometric models, in forecasting and in inventory accounting.
(c) Methodology Scope The PPI-M covers all large establishments (that is those employing 10 or more persons) whose output is mainly sold on the domestic market that is divisions 15 to 37 of the National Standard Industrial Classification of Economic activities (NSIC). Weighting scheme The weights have been calculated from the gross output figures derived from the 1997 Census of Economic Activities. Gross output is valued at basic prices, and thus excludes all taxes on products, namely excise duties and value added tax. The weight of a product represents the share of its gross output of the total of the manufacturing sector. In the case of sugar, only the output sold on the local market has been taken into consideration in establishing weights. Reference Year The reference year for the calculation of price relatives is 1998. The base price for a particular product is the simple average of the 12 monthly prices in 1998. Selection of outlets and products For each industry group, only products that typically represent the output of that industry and that are produced continuously were selected. Detailed specifications of the selected products were obtained from the enterprises. These specifications include weight, brand, size, etc. Some 100 products from around 70 producers were selected for price collection. The weights allocated to an industry is redistributed among the products representing that group taking into consideration the relative importance of the selected products within the industry group. Price The price is the amount realized by a producer when selling his products on the local market. This excludes all taxes on products, namely excise duty and value added tax. Services, if provided by the producer, for example transport and other distribution costs, are considered to be part of the price. Contact Person Mr L. Persand Statistician Ministry of Industry, Small and Medium Enterprises, Commerce and Cooperatives Level 5

Air Mauritius Building J. Kennedy St. Port Louis MAURITIUS Tel : (230) 211-5356, (230) 211-7799 Fax : (230) 212-8429 Email: [email protected]
8. AGRICULTURE
8.1 Historical background
Data on agriculture, in particular, on sugar cane, dates back to 1881, but the first set of official figures published by the CSO appeared in the Year Book of 1948. The agricultural statistics unit was, until 1999, attached to the Extension Services Division of the Ministry of Agriculture, at Réduit. In 1999, following the taking over of the activities of the Extension Unit by the newly created Agricultural Research and Extension Unit (AREU), the Unit was transferred to the CSO.
8.2 Activities
The activities in the unit comprise:
• Compilation of annual and quarterly national accounts data (value added at
current and constant prices and growth rates) for agriculture, sugar milling and
mining and quarrying.
• Computation of data on production and yield by main commodity.
• Preparation of annual food balance sheets.
• Computation of agricultural producer price indices.
• Conduct of ad-hoc surveys.
8.3 Sources of data
(a) Administrative sources:
Sugar cane: Aggregated production and data on cost of production of the
sugar estates are supplied by the Mauritius Chamber of Agriculture Tea and tobacco: Tea Board and Tobacco Board respectively FoodCrops: As from 1998, the Agricultural Research and Extension Unit
(AREU) Livestock: The Mauritius Meat Authority provides monthly statistics on
animals slaughtered Fishing: The Albion Fisheries Research Centre (AFRC) Government services: The Accountant General's Department Foreign trade: Customs Department Irrigation: The Irrigation Authority
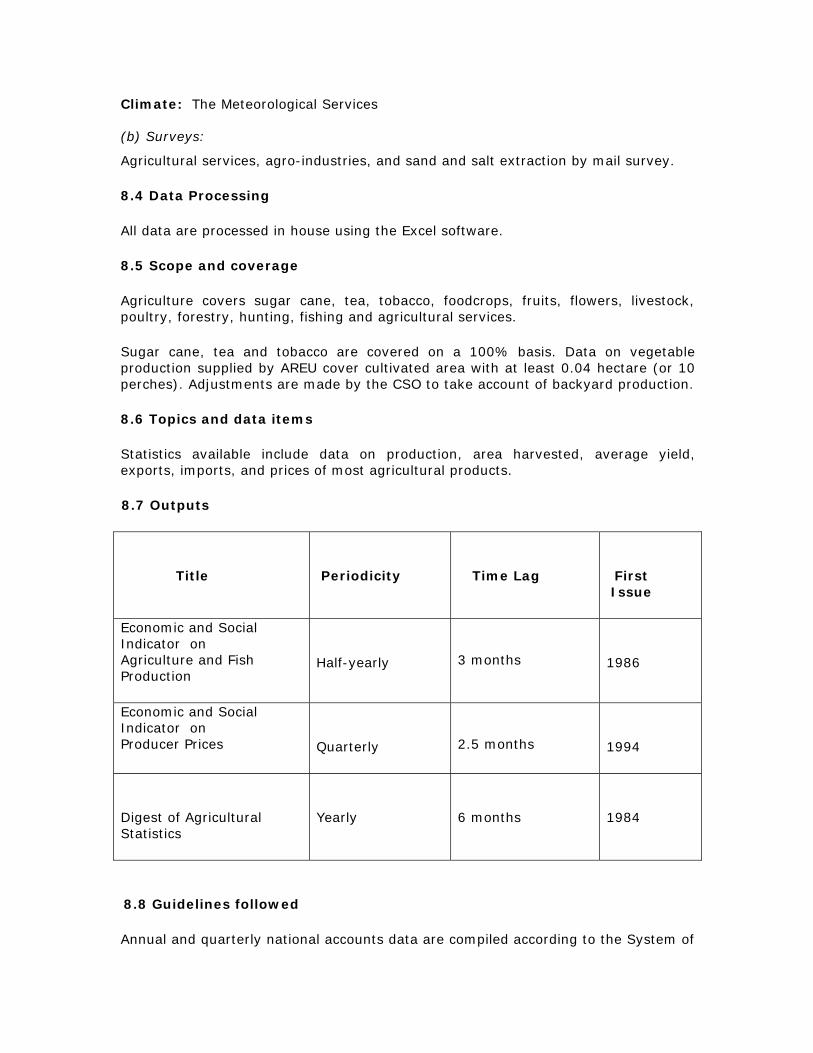
Climate: The Meteorological Services
(b) Surveys:
Agricultural services, agro-industries, and sand and salt extraction by mail survey.
8.4 Data Processing
All data are processed in house using the Excel software.
8.5 Scope and coverage
Agriculture covers sugar cane, tea, tobacco, foodcrops, fruits, flowers, livestock, poultry, forestry, hunting, fishing and agricultural services.
Sugar cane, tea and tobacco are covered on a 100% basis. Data on vegetable production supplied by AREU cover cultivated area with at least 0.04 hectare (or 10 perches). Adjustments are made by the CSO to take account of backyard production.
8.6 Topics and data items
Statistics available include data on production, area harvested, average yield, exports, imports, and prices of most agricultural products.
8.7 Outputs
Title
Periodicity
Time Lag
First Issue
Economic and Social Indicator on Agriculture and Fish Production
Half-yearly
3 months
1986
Economic and Social Indicator on Producer Prices
Quarterly
2.5 months
1994
Digest of Agricultural Statistics
Yearly
6 months
1984
8.8 Guidelines followed
Annual and quarterly national accounts data are compiled according to the System of
National Accounts (SNA), 1993.
Data for the preparation of food balance sheets are compiled according to the ‘Handbook for the preparation of Food Balance Sheets, 1949’ of the Food and Agriculture Organisation (FAO).
8.9 Classifications used
• National Standard Industrial Classification of Economic Activities (NSIC) for the
classification of activities
• Central Product Classification (CPC) for products
8.10 Data availability
Series of data on sugar production are available as from 1881 and those on other crops, from 1947.
8.11 Future plans
• To compile a register of planters and livestock breeders.
• To improve the presentation of food balance sheets (FBS) by further disaggregating certain commodity groups and also converting food items into nutritive values. FBS will be compiled using the ‘Handbook for the Preparation of Food Balance Sheets, 2001’ of the FAO.
Contact Person Mr B. Unmar Statistician Central Statistics Office John Kennedy Street Port Louis Mauritius Tel: (230) 213 3073, (230) 208 0781 Fax: (230) 211 4150 Email: cso [email protected]
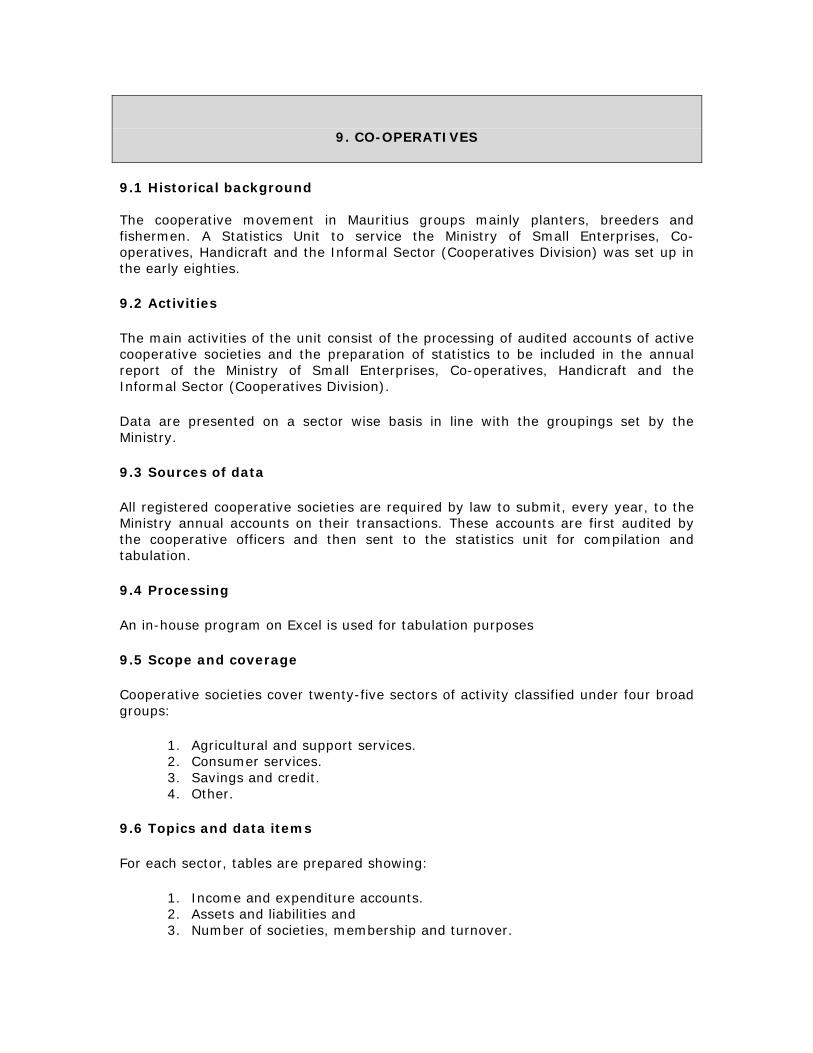
9. CO-OPERATIVES
9.1 Historical background The cooperative movement in Mauritius groups mainly planters, breeders and fishermen. A Statistics Unit to service the Ministry of Small Enterprises, Co-operatives, Handicraft and the Informal Sector (Cooperatives Division) was set up in the early eighties.
9.2 Activities
The main activities of the unit consist of the processing of audited accounts of active cooperative societies and the preparation of statistics to be included in the annual report of the Ministry of Small Enterprises, Co-operatives, Handicraft and the Informal Sector (Cooperatives Division).
Data are presented on a sector wise basis in line with the groupings set by the Ministry.
9.3 Sources of data
All registered cooperative societies are required by law to submit, every year, to the Ministry annual accounts on their transactions. These accounts are first audited by the cooperative officers and then sent to the statistics unit for compilation and tabulation.
9.4 Processing
An in-house program on Excel is used for tabulation purposes
9.5 Scope and coverage
Cooperative societies cover twenty-five sectors of activity classified under four broad groups:
1. Agricultural and support services. 2. Consumer services. 3. Savings and credit. 4. Other.
9.6 Topics and data items
For each sector, tables are prepared showing:
1. Income and expenditure accounts. 2. Assets and liabilities and 3. Number of societies, membership and turnover.
9.7 Outputs
The majority of the statistical tables appear in the annual Report of the Ministry of Small Enterprises, Co-operatives, Handicraft and the Informal Sector (Cooperatives Division), within 2 years of the reference accounting year.
9.8 Future plan
To start preparation of production accounts of the cooperative sector and evaluate its contribution in the economy. Contact Person Ms. P. Ramchurn Senior Statistical Officer Ministry of Small Enterprises, Co-operatives, Handicraft and the Informal Sector L.I.C. Centre John Kennedy Street Port Louis MAURITIUS. Tel: (230) 208-4812, (230) 208-4813 Fax: (230) 208-9263 Email: [email protected]
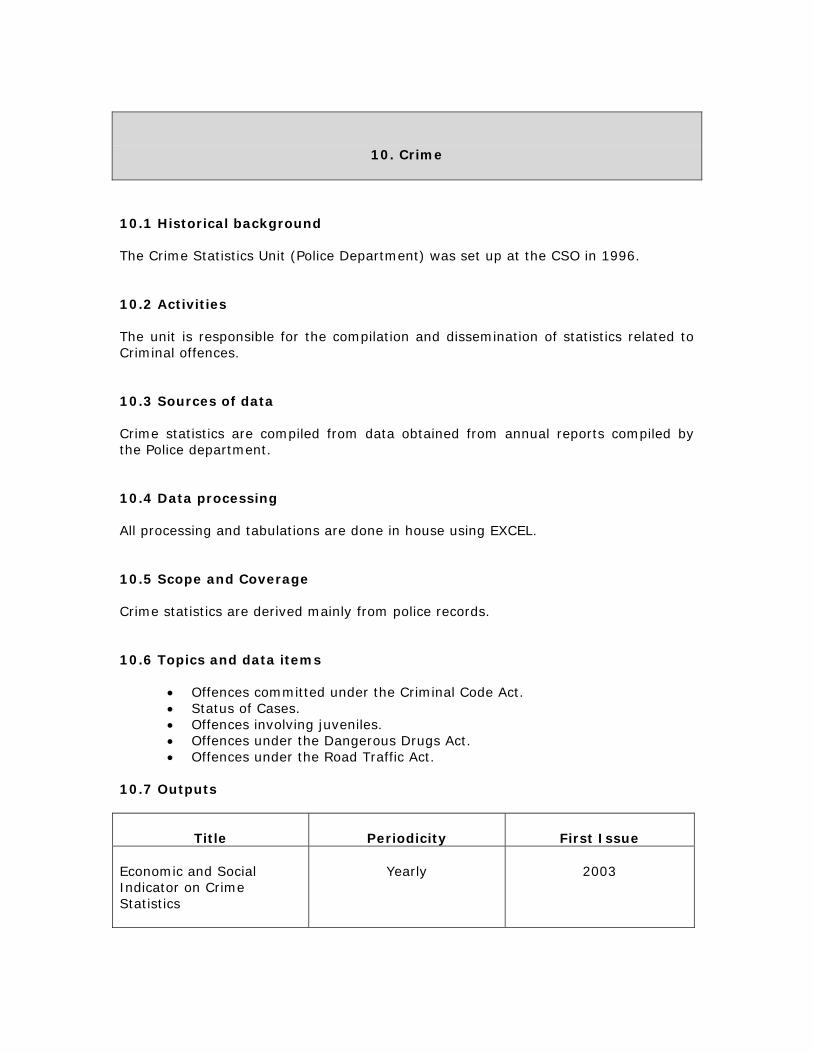
10. Crime
10.1 Historical background The Crime Statistics Unit (Police Department) was set up at the CSO in 1996. 10.2 Activities The unit is responsible for the compilation and dissemination of statistics related to Criminal offences. 10.3 Sources of data Crime statistics are compiled from data obtained from annual reports compiled by the Police department. 10.4 Data processing All processing and tabulations are done in house using EXCEL. 10.5 Scope and Coverage Crime statistics are derived mainly from police records. 10.6 Topics and data items
• Offences committed under the Criminal Code Act. • Status of Cases. • Offences involving juveniles. • Offences under the Dangerous Drugs Act. • Offences under the Road Traffic Act.
10.7 Outputs
Title
Periodicity
First Issue
Economic and Social Indicator on Crime Statistics
Yearly
2003
10.8 Guidelines followed Criminal offences follow the Criminal Code Act. 10.9 Classification used All data are classified according to the 2000 Revised Laws of Mauritius. 10.10 Data availability Data on type of cases and offences are available since 1980. 10.11 Future plan The office is planning to set up a Statistical Unit at the Police Headquarters. Contact Person Mr. A. Haulkhory Statistician Police and Judicial Statistics Unit New Court House Pope Hennessy Street Port Louis MAURITIUS. Tel: (230) 213-3051 Fax: (230) 212-0576 Email: [email protected]
11. EDUCATION
11.1 Historical background
An Education Unit, located at the Ministry of Education and Scientific Research, was created by the Central Statistics Office in the early sixties to meet the demand for timely and reliable education statistics.
11.2 Activities
• The collection, editing, processing and analysis of data from multiple sources in the educational field.
• The compilation of enrolment statistics in pre-primary, primary, secondary, and post secondary educational sectors.
• The compilation of characteristics of personnel employed in the educational sector.
• The compilation of examination results in the primary and secondary educational sectors.
• The computation of indicators on education, such as Pupil/Teacher ratios and Gross/Net Enrolment Ratios.
• The calculation of value added for the education sector on a quarterly and annual basis.
11.3 Sources of data
Data are collected every year from the following sources:
o Pre-primary, primary and secondary schools (annual survey) o Mauritius Examinations Syndicate (MES) (administrative records) o Industrial and Vocational Training Board (IVTB) (administrative records) o Tertiary Education Commission (TEC), (administrative records) o University of Mauritius (annual survey) o University of Technology – Mauritius (UTM) (annual survey) o Mauritius Institute of Education (MIE) (annual survey) o Mauritius College of the Air (MCA) (annual survey) o Mahatma Gandhi Institute (MGI) (annual survey) o School Management Trust Fund (annual survey) o Mauritius Institute of Health (annual survey)
11.4 Data processing
Data from the different sources are processed and tabulated in-house on stand alone PCs using the Integrated Microcomputer Processing Software (IMPS).
11.5 Scope and coverage
All educational and training institutions except private training institutions and special needs schools are covered.

11.6 Topics and data items
School infrastructure: number of classrooms, equipment, recreational facilities Enrolment: age, grade and sex Personnel: occupational status, sex, age Examination results: sex, subject and grade
11.7 Outputs
Title
Periodicity
First issue
Economic and Social indicator on Education Statistics
Annual
1991
Digest of Educational Statistics
Annual
1984
Education Card (published by Ministry of Education)
Annual
1989
Other tables are produced on request as and when required.
11.8 Guidelines followed
Education statistics are compiled, as far as possible, according to the recommendations of the United Nations Education, Scientific and Cultural Organisation (UNESCO).
11.9 Classifications used
International Standard Classification of Education (ISCED) developed by the United Nations
11.10 Data availability
Data is available as from 1968.
11.11 Future plans
Produce a report with main indicators on education, as proposed by UNESCO. Extract information relating to personnel from the Ministry of Education
central database instead of collecting the same information directly from schools.
Contact Person Ms. N.Gujadhur Acting Statistician Ministry of Education and Scientific Research IVTB House Pont Fer Phoenix MAURITIUS Tel: (230) 601-5252, (230) 601-5200 (Ext. 5430 / 5478) Fax: (230) 686-8774 Email: [email protected]
12. ENERGY
12.1 Historical background With the increasing demand for statistics on energy, the CSO set up a Statistical Unit in the late nineteen eighties to assist the Ministry of Public Utilities in creating a database on energy statistics and performing statistical analyses. 12.2 Activities The main task of the Unit consists in collecting and disseminating data on energy and water statistics. Energy commodity balance and similar tables are compiled, analysed and used for forecasting energy demand and supply. The unit is also involved in the computation of annual and quarterly value added for the “Electricity, gas and water” sector. A quarterly index for “Electricity, gas and water” sector for use in the Quarterly Index of Production is also prepared. Relevant data are also prepared for the construction of models.
12.3 Sources of data
The Central Electricity Board is the main supplier of data on electrical energy. Data on water are supplied by the Central Water Authority and the Water Resources Unit. The State Trading Corporation provides data on bunkering while Airports of Mauritius supplies information on aviation fuel.
Besides, two surveys are conducted: an annual energy survey to collect data from sugar factories and the Independent Power Producers, and a quarterly survey of petroleum companies on the sales of their products. 12.4 Data processing Data are compiled on a daily, monthly, quarterly and yearly basis. Microsoft Excel is used for processing, tabulating and presenting the data collected. For analysis and forecasting purposes, SPSS software is used.
12.5 Scope and coverage
Energy data relate to imports, re-exports, bunkers, transformation and consumption of energy sources as well as electricity generation, sales and losses.
Water statistics cover rainfall, production, storage and sales.
12.6 Topics and data items Electricity: installed and effective capacities, peak demand, generation and sales by category of consumers
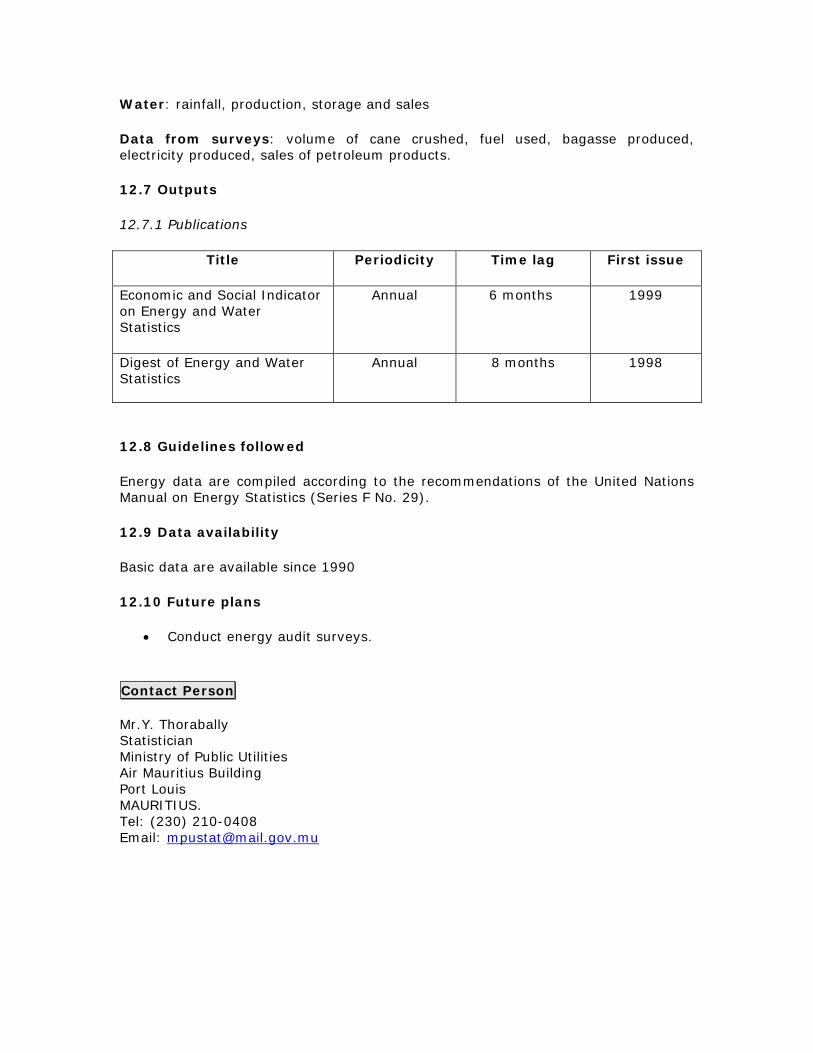
Water: rainfall, production, storage and sales
Data from surveys: volume of cane crushed, fuel used, bagasse produced, electricity produced, sales of petroleum products. 12.7 Outputs
12.7.1 Publications
Title Periodicity Time lag First issue
Economic and Social Indicator on Energy and Water Statistics
Annual 6 months 1999
Digest of Energy and Water Statistics
Annual 8 months 1998
12.8 Guidelines followed
Energy data are compiled according to the recommendations of the United Nations Manual on Energy Statistics (Series F No. 29).
12.9 Data availability
Basic data are available since 1990
12.10 Future plans
• Conduct energy audit surveys. Contact Person Mr.Y. Thorabally Statistician Ministry of Public Utilities Air Mauritius Building Port Louis MAURITIUS. Tel: (230) 210-0408 Email: [email protected]

13. ENVIRONMENT
13.1 Historical background In order to meet the data needs of planners, policy makers in environmental and related socio-economic field, the CSO, in 1994, started work on the development of environmental statistics. In June 1999, a Statistics unit was subsequently created at the Department of Environment of the Ministry of Environment and National Development Unit. 13.2 Activities Environment is a very broad and complex subject. The Ministry has recently prepared a National Environment Action Plan (NEAP) which serves as a guideline as it has identified areas of concern. The main activities of the statistics unit consist of the following:
Undertake a thorough inventory of all existing information relevant to the environment, including actual and potential suppliers of data.
Prepare a database on environmental statistics. Compute annual inventory of greenhouse gas emissions. Construct indicators to monitor trends and impacts of measures. Conduct ad hoc environmental surveys. Disseminate data on the status of the environment.
13.3 Sources of data Since environment statistics are multi disciplinary covering a wide range of diverse subjects, the data sources are also varied. Information is extracted from the various digests of statistics published by the CSO and from the reports of the following ministries and departments:
Ministry of Agro Industry and Fisheries Ministry of Public Utilities Ministry of Industry, Small and Medium Enterprises, Commerce and Co-
operatives Ministry of Labour, Industrial Relations and Employment Ministry of Health and Quality of Life Ministry of Local Government Ministry of of Environment and National Development Unit Central Water Authority Central Electricity Board Meteorological Services National Transport Authority
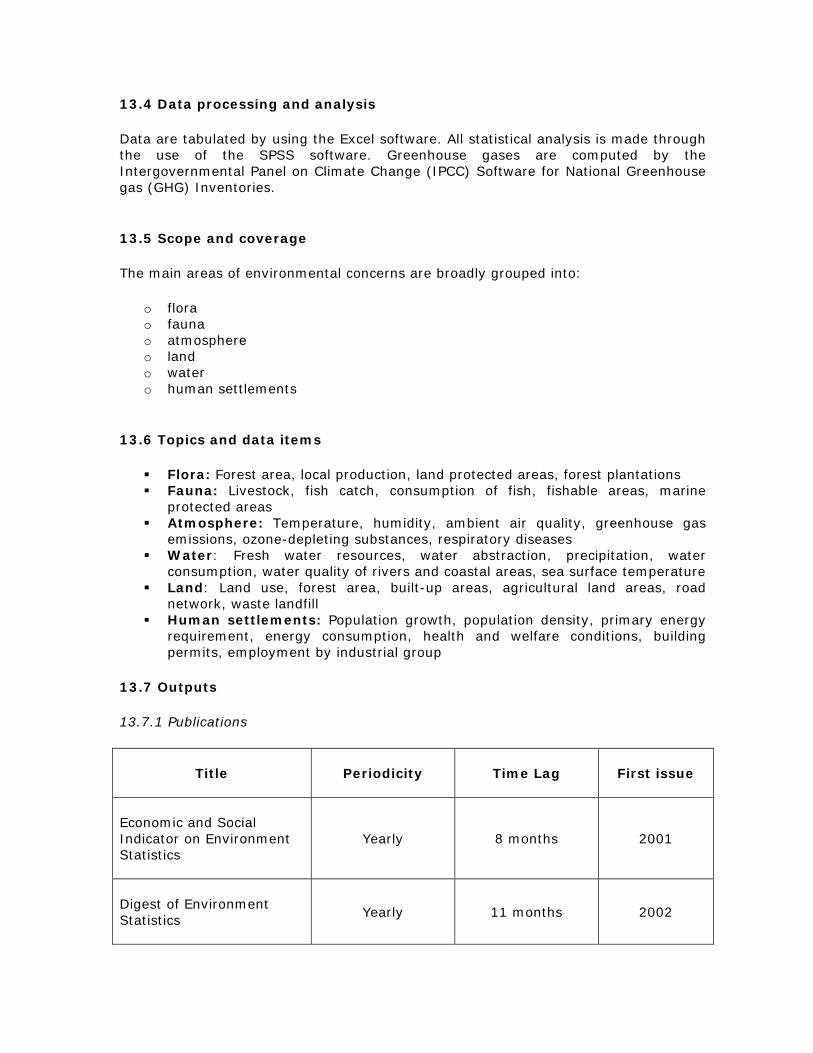
13.4 Data processing and analysis
Data are tabulated by using the Excel software. All statistical analysis is made through the use of the SPSS software. Greenhouse gases are computed by the Intergovernmental Panel on Climate Change (IPCC) Software for National Greenhouse gas (GHG) Inventories.
13.5 Scope and coverage
The main areas of environmental concerns are broadly grouped into:
o flora o fauna o atmosphere o land o water o human settlements
13.6 Topics and data items
Flora: Forest area, local production, land protected areas, forest plantations Fauna: Livestock, fish catch, consumption of fish, fishable areas, marine
protected areas Atmosphere: Temperature, humidity, ambient air quality, greenhouse gas
emissions, ozone-depleting substances, respiratory diseases Water: Fresh water resources, water abstraction, precipitation, water
consumption, water quality of rivers and coastal areas, sea surface temperature Land: Land use, forest area, built-up areas, agricultural land areas, road
network, waste landfill Human settlements: Population growth, population density, primary energy
requirement, energy consumption, health and welfare conditions, building permits, employment by industrial group
13.7 Outputs
13.7.1 Publications
Title
Periodicity Time Lag First issue
Economic and Social Indicator on Environment Statistics
Yearly 8 months 2001
Digest of Environment Statistics
Yearly 11 months 2002

13.8 Guidelines followed
The environment indicators are being developed, as far as possible, according to the recommendations of the following UN manuals:
o A Framework for the Development of Environment Statistics, Statistical Papers, Series M, No.78
o Concepts and Methods of Environment Statistics: Statistics of the Natural Environment, Studies and Methods, Series F, No.57
o Concept and Methods of Environment Statistics: Human Settlements Statistics, Studies and Methods, Series F, No.51
13.9 Data availability Environment statistics has only been recently developed. Consequently, data relating to a limited number of specific areas are currently available.
13.10 Future plans
• To fill in data gaps. • To develop methodology for the preparation of environment accounting.
Contact Person Mr A. Sookun Acting Statistician Statistics Unit Department of Environment Ken Lee Tower Port Louis MAURITIUS. Tel: (230) 213-3058 Fax: (230) 211-9178 Email: [email protected]
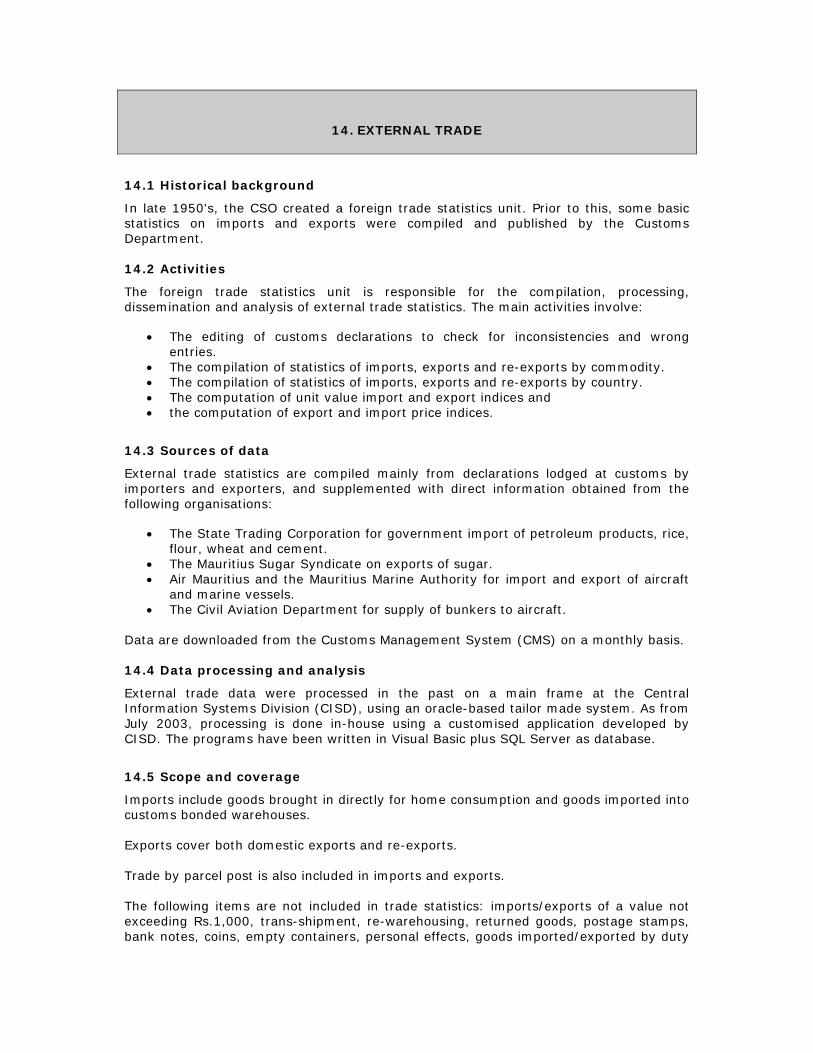
14. EXTERNAL TRADE
14.1 Historical background
In late 1950's, the CSO created a foreign trade statistics unit. Prior to this, some basic statistics on imports and exports were compiled and published by the Customs Department. 14.2 Activities
The foreign trade statistics unit is responsible for the compilation, processing, dissemination and analysis of external trade statistics. The main activities involve:
• The editing of customs declarations to check for inconsistencies and wrong entries.
• The compilation of statistics of imports, exports and re-exports by commodity. • The compilation of statistics of imports, exports and re-exports by country. • The computation of unit value import and export indices and • the computation of export and import price indices.
14.3 Sources of data
External trade statistics are compiled mainly from declarations lodged at customs by importers and exporters, and supplemented with direct information obtained from the following organisations:
• The State Trading Corporation for government import of petroleum products, rice, flour, wheat and cement.
• The Mauritius Sugar Syndicate on exports of sugar. • Air Mauritius and the Mauritius Marine Authority for import and export of aircraft
and marine vessels. • The Civil Aviation Department for supply of bunkers to aircraft.
Data are downloaded from the Customs Management System (CMS) on a monthly basis. 14.4 Data processing and analysis
External trade data were processed in the past on a main frame at the Central Information Systems Division (CISD), using an oracle-based tailor made system. As from July 2003, processing is done in-house using a customised application developed by CISD. The programs have been written in Visual Basic plus SQL Server as database.
14.5 Scope and coverage
Imports include goods brought in directly for home consumption and goods imported into customs bonded warehouses. Exports cover both domestic exports and re-exports. Trade by parcel post is also included in imports and exports. The following items are not included in trade statistics: imports/exports of a value not exceeding Rs.1,000, trans-shipment, re-warehousing, returned goods, postage stamps, bank notes, coins, empty containers, personal effects, goods imported/exported by duty
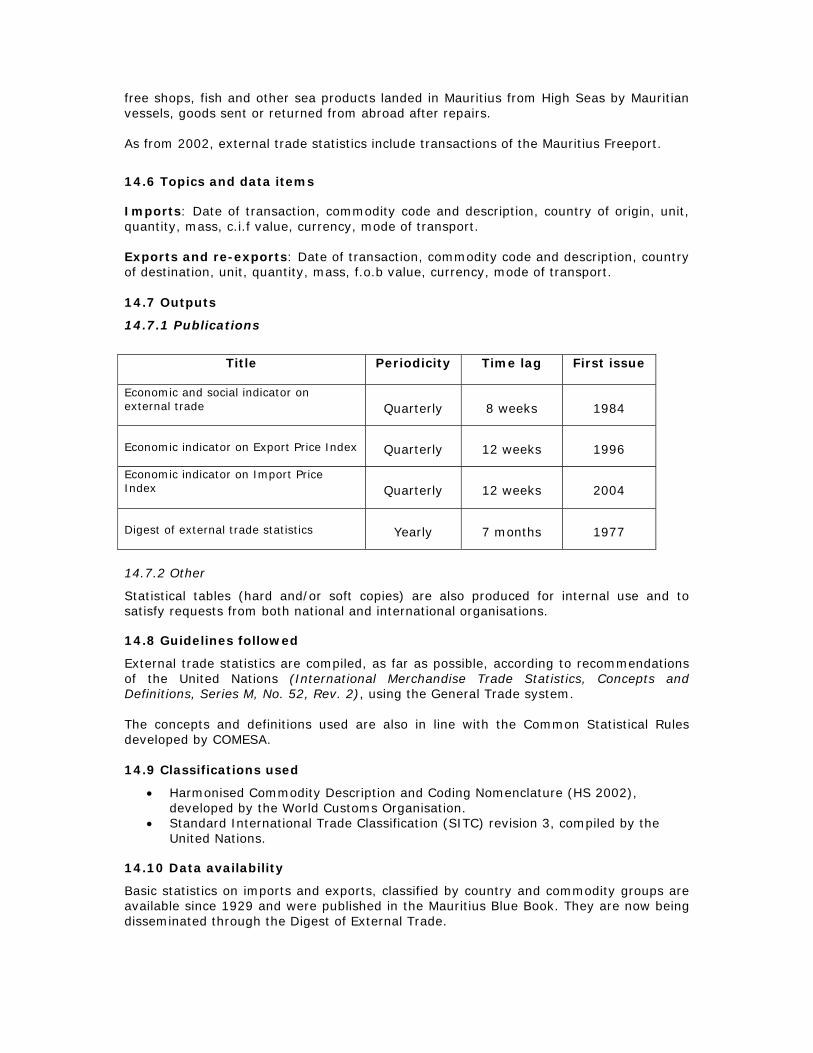
free shops, fish and other sea products landed in Mauritius from High Seas by Mauritian vessels, goods sent or returned from abroad after repairs. As from 2002, external trade statistics include transactions of the Mauritius Freeport.
14.6 Topics and data items Imports: Date of transaction, commodity code and description, country of origin, unit, quantity, mass, c.i.f value, currency, mode of transport. Exports and re-exports: Date of transaction, commodity code and description, country of destination, unit, quantity, mass, f.o.b value, currency, mode of transport. 14.7 Outputs
14.7.1 Publications
Title Periodicity Time lag First issue
Economic and social indicator on external trade
Quarterly
8 weeks
1984
Economic indicator on Export Price Index
Quarterly
12 weeks
1996
Economic indicator on Import Price Index
Quarterly
12 weeks
2004
Digest of external trade statistics
Yearly
7 months
1977
14.7.2 Other
Statistical tables (hard and/or soft copies) are also produced for internal use and to satisfy requests from both national and international organisations. 14.8 Guidelines followed
External trade statistics are compiled, as far as possible, according to recommendations of the United Nations (International Merchandise Trade Statistics, Concepts and Definitions, Series M, No. 52, Rev. 2), using the General Trade system. The concepts and definitions used are also in line with the Common Statistical Rules developed by COMESA. 14.9 Classifications used
• Harmonised Commodity Description and Coding Nomenclature (HS 2002), developed by the World Customs Organisation.
• Standard International Trade Classification (SITC) revision 3, compiled by the United Nations.
14.10 Data availability
Basic statistics on imports and exports, classified by country and commodity groups are available since 1929 and were published in the Mauritius Blue Book. They are now being disseminated through the Digest of External Trade.
14.11 Future plans
The Central Statistics Office is planning to use the software NEW EUROTRACE, for which technical and material support are provided by COMESA, to cater for ad-hoc requests of users.
Contact Person
Mr. D. Pothegadoo Statistician Central Statistics Office L.I.C. Centre Port Louis MAURITIUS. Tel: (230) 208-0781, (230) 212-2783 Fax: (230) 211-4150 Email: [email protected]

15. Financial Services
15.1 Historical background In response to the need for comprehensive and timely data to monitor the fast growing financial sector, the Financial Services Unit was set up in 2001.
15.2 Activities The Unit is responsible for the collection and compilation of statistics related to the Financial Corporation Sector. Data on income and expenditure are collected and compiled from banks holding a Category 1 Banking Licence (domestic banks) and banks holding a Category 2 Banking Licence (offshore banks), insurance companies and other financial intermediaries both on a quarterly and annual basis. 15.3 Sources of data
• Financial Services Commission (FSC) • Domestic and Offshore banks • Bank of Mauritius • Insurance companies • Leasing Companies • Stock broking Companies • Investment Pools • Insurance Brokers • Money-Changers • Foreign Exchange Dealers
15.4 Processing Processing of data collected is carried out using Microsoft Excel.
15.5 Scope and coverage
The Financial Services statistics covers the Financial Corporation Sector which consists of the following sub-sectors: (a) Depository Corporation
1. Central Bank 2. Other Depository Corporations
• Domestic banks • Offshore banks • Non-Bank Financial Institutions
(b) Other Financial Corporation
1. Insurance Corporations and Pension Funds 2. Other Financial intermediaries (except insurance corporations and
pension funds) • Stock broking Companies • Investment Pools

3. Financial auxiliaries • Insurance Brokers • Money-Changers • Foreign Exchange Dealers • Other Financial Auxiliaries
15.6 Guidelines followed
Data for National Accounts are compiled according to the 1993 System of National Accounts (SNA 1993).
15.7 Classifications used The National Standard Industrial Classification of Economic Activities, an adapted version of the International Standard Industrial Classification of Economic Activities (NSIC rev 3), developed by the United Nations is used. 15.8 Topics and data items Output, intermediate consumption, value added, compensation of employees for the Financial Corporation Sector.
15.9 Outputs
The Financial Services Unit produces relevant tables to be included in Economic and Social Indicators, and other reports published by the CSO.
15.10 Data availability
Data on certain aggregates are available as from 1948
15.11 Future plans • collection and compilation of Balance Sheets for the "Other Financial
Corporation Sector" • consolidation of the financial accounts for the Financial Corporation Sector
Contact Person Ms. N. Guillaume Acting Statistician Central Statistics Office L.I.C. Centre John Kennedy Street Port Louis MAURITIUS. Tel: (230) 212-2316, (230) 208-0781 Fax: (230) 211-4150 Email: [email protected]
16. Government Finance
16.1 Historical background
The Central Statistics Office (CSO) started preparation of the economic accounts of government in the early 1970s. These accounts were prepared by the National Accounts Unit up to 1985, when the work was taken over by the newly created Public Finance Unit. The latter was also responsible for the compilation of government finance statistics required by the IMF.
As from 1990, the collection and compilation of the production accounts of the General Government sector is also the responsibility of the Public Finance Unit.
16.2 Activities
• Detailed classification of government transactions. • National accounts estimates for government. • Distribution of employees in the public sector by salary range.
16.3 Sources of data
• Government transactions:
Administrative records of the Treasury, a department of the Ministry of Finance and Economic Development
• Other Units forming part of the General Government Sector: Financial Accounts
16.4 Processing
Processing of data is done using Microsoft Excel.
16.5 Scope and coverage
• The General government sector is made up of Central Government, Regional Government and Local Government.
• The Central Government consists of ministries/ departments, Extra Budgetary Units and Social Security Fund.
• The Regional Government refers to the administration of Rodrigues (Rodrigues Regional Assembly).
• The Local Government consists of 5 municipalities and 4 district councils.
16.6 Topics and data items
• Government Finance Statistics All governmental transactions are regrouped and detailed tables are prepared, showing:
a. Tax and non-tax revenue. b. Current and capital expenditure by functional and economic
classification. c. Domestic and foreign financing. d. Domestic and foreign debt.
• National Accounts
Production accounts of general government, as well as data on government final consumption expenditure.
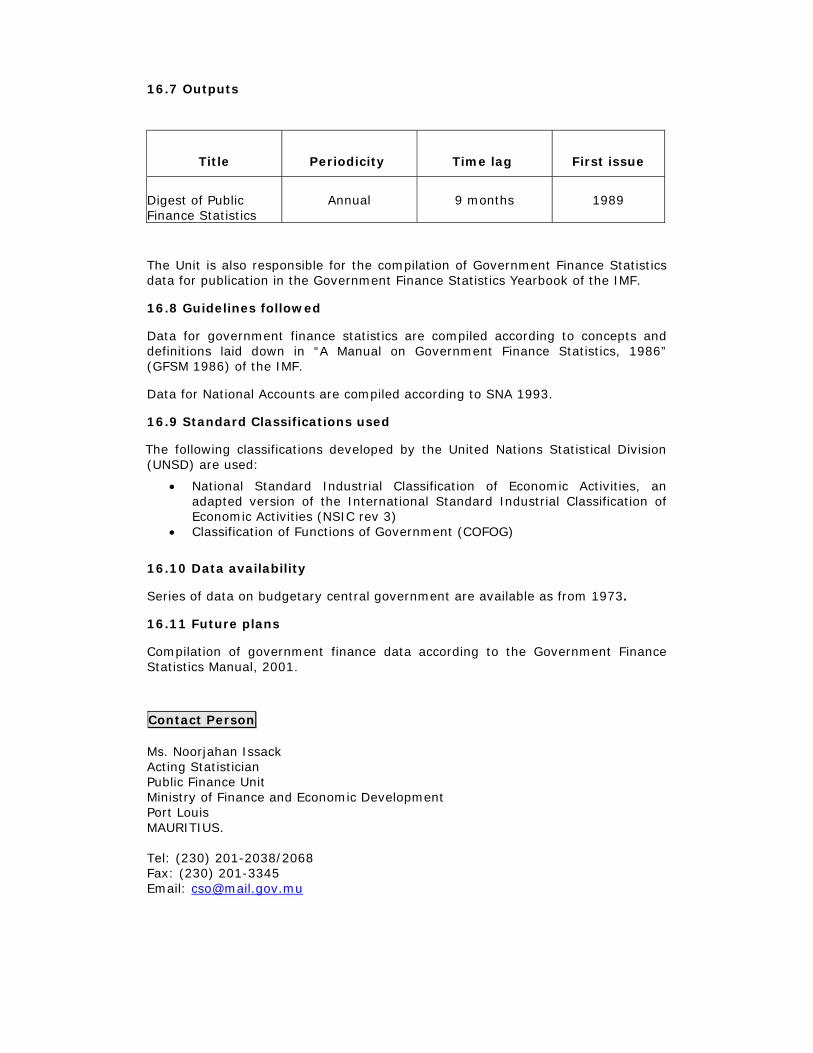
16.7 Outputs
Title
Periodicity
Time lag
First issue
Digest of Public Finance Statistics
Annual 9 months 1989
The Unit is also responsible for the compilation of Government Finance Statistics data for publication in the Government Finance Statistics Yearbook of the IMF.
16.8 Guidelines followed
Data for government finance statistics are compiled according to concepts and definitions laid down in “A Manual on Government Finance Statistics, 1986” (GFSM 1986) of the IMF.
Data for National Accounts are compiled according to SNA 1993.
16.9 Standard Classifications used
The following classifications developed by the United Nations Statistical Division (UNSD) are used:
• National Standard Industrial Classification of Economic Activities, an adapted version of the International Standard Industrial Classification of Economic Activities (NSIC rev 3)
• Classification of Functions of Government (COFOG)
16.10 Data availability
Series of data on budgetary central government are available as from 1973.
16.11 Future plans
Compilation of government finance data according to the Government Finance Statistics Manual, 2001.
Contact Person Ms. Noorjahan Issack Acting Statistician Public Finance Unit Ministry of Finance and Economic Development Port Louis MAURITIUS. Tel: (230) 201-2038/2068 Fax: (230) 201-3345 Email: [email protected]
17. HOUSING
17.1 Historical background A Housing Statistics Unit was created in the early eighties with the main objective of servicing the Ministry of Housing and Lands. Its objectives and activities have however evolved over the years while the needs of the Ministry are still catered for. 17.2 Activities The main tasks are as follows:
• Undertaking of the Housing Census • Estimation of housing stock • Computation of the Construction Price Index • Compilation of building permits statistics by use, type, geographical district
and floor area • Annual and quarterly estimates of investment (construction) • Annual and quarterly estimates of output and value added of the construction
industry • Annual and quarterly estimates of output and value added of Ownership of
Dwelling • Census of Economic Activities – Construction
17.3 Sources of data The main sources of data are:
o The decennial Housing and Population Census. o For Construction Price Index: hardware shops, manufacturers of blocks,
aggregates and rock sand, lorry drivers, workers in the construction industry. o Survey of large establishments of the construction industry. o Ministry of Finance and Economic Development. o Government Finance Statistics. o The local authorities (Municipalities and District Councils) for building permits. o The Ministry of Public Infrastructure. o Survey of parastatal bodies. o Survey of sugar estates and hotels. o Census of Economic Activities – Construction. o Ministry of Tourism. o Other bodies responsible for major investment like BPML, Mauritius Freeport
Authority, Mauritius Ports Authority, NHDC.
17.4 Data processing
Computation work is carried out in-house using the commercial spreadsheet software Excel and the Integrated Microcomputer Processing System (IMPS), a software developed by the U.S. Census Bureau.

17.5 Scope and coverage
• The Housing Census: Islands of Mauritius, Rodrigues and Agalega. • Construction Price Index: residential buildings only. • Construction, Investment on construction, and ownership of dwellings: Republic
of Mauritius. 17.6 Topics and data items
Data items covered are
Household size Headship rate Dilapidation rate Housing units Households Gross Domestic Fixed Capital Formation (GDFCF) on construction – by type,
industrial use, private/public Output and value added of the Construction and Ownership of Dwelling Growth rates of GDFCF on construction, and value added of construction
industry and Ownership of Dwelling
17.7 Outputs
17.7.1 Economic and Social Indicator
Title
Periodicity
First issue
Economic and Social Indicator on: Construction Price Index 1
Quarterly
1994
1 The time lag is six weeks
17.7.2 Other
• Housing Census table and analysis reports • Tables produced on request, hard and soft copies • Construction (GDFCF, Value added- annual and quarterly) • Ownership of Dwelling (value added- annual and quarterly)
17.8 Guidelines followed Definitions and methods used for the Housing Census are according to recommendations of the United Nations - Principles and recommendations for population and housing censuses, revision 1 and Methods of estimating housing needs, series F No. 12. Gross output, value added and Investment, are compiled according to the 1993 System of National Accounts (SNA 93)
17.9 Classification used
National Standard Industrial Classification of Economic Activities, an adapted
version of the International Standard Industrial Classification of Economic Activities (NSIC rev 3)
17.10 Data availability Data for census years are published in the housing and household census reports while annual estimates, though not published, are available in the unit since 1991. Monthly data for the Construction Price Index are available since January 1994. Quarterly and yearly averages are also available for the same period. 17.11 Future plans
a. Extension of the Construction Price Index to non-residential and other construction work.
b. To produce a publication on “Construction Statistics” which will present in a single report detailed available data concerning the construction sector.
Contact Person Mr. A.Ramsamy Acting Statistician L.I.C. Centre John Kennedy Street Port Louis MAURITIUS. Tel: (230) 208-0781, (230) 212-2783, (230) 212-2316 Fax: (230) 211-4150 Email: [email protected]

18. INDUSTRIAL PRODUCTION
18.1 Historical background
Until the mid 70's, aggregated data pertaining to the industrial sector were produced by the National Accounts unit of the CSO. In 1975, following a request from the Ministry of Industry, a unit was created within that Ministry to respond to its specific statistical needs, especially data for the monitoring of individual establishments. In 1999, the Unit responsible for the "Manufacturing" sector in the National Accounts was integrated to the unit at the Ministry of Industry.
18.2 Activities
The statistics unit is responsible for the collection, compilation, analysis and dissemination of statistics relating to the industrial sector. The main activities are:
• conducting regular surveys covering the Industrial Sector • computation of the Index of Industrial Production • computation of the Producer Price Index (Manufacturing) • compilation of economic accounts by industry group for the manufacturing sector • calculation of value added of the manufacturing sector • compilation of data on local production of main commodities
18.3 Sources of data
In addition to secondary statistics collected from administrative sources, data collection is also done through the following surveys/census:
• Quarterly survey of employment in the Export Processing Zone (EPZ) sector and enterprises having a Pioneer Status certificate (PSE).
• Annual Industrial Production Survey (CIP1) conducted in January/February and covering non-EPZ establishments.
• Annual Industrial Production Survey (CIP2) conducted in August/September and covering the whole manufacturing sector.
• Census of Industrial Production (every five years).
18.4 Data processing
All processing is done on microcomputers using Dbase, EXCEL and IMPS. Assistance is sought from the CISD as and when necessary.
18.5 Scope and coverage
(a) Quarterly Survey of Employment:
This is a mail survey covering all EPZ and PSE enterprises. The response rate is around 90%.
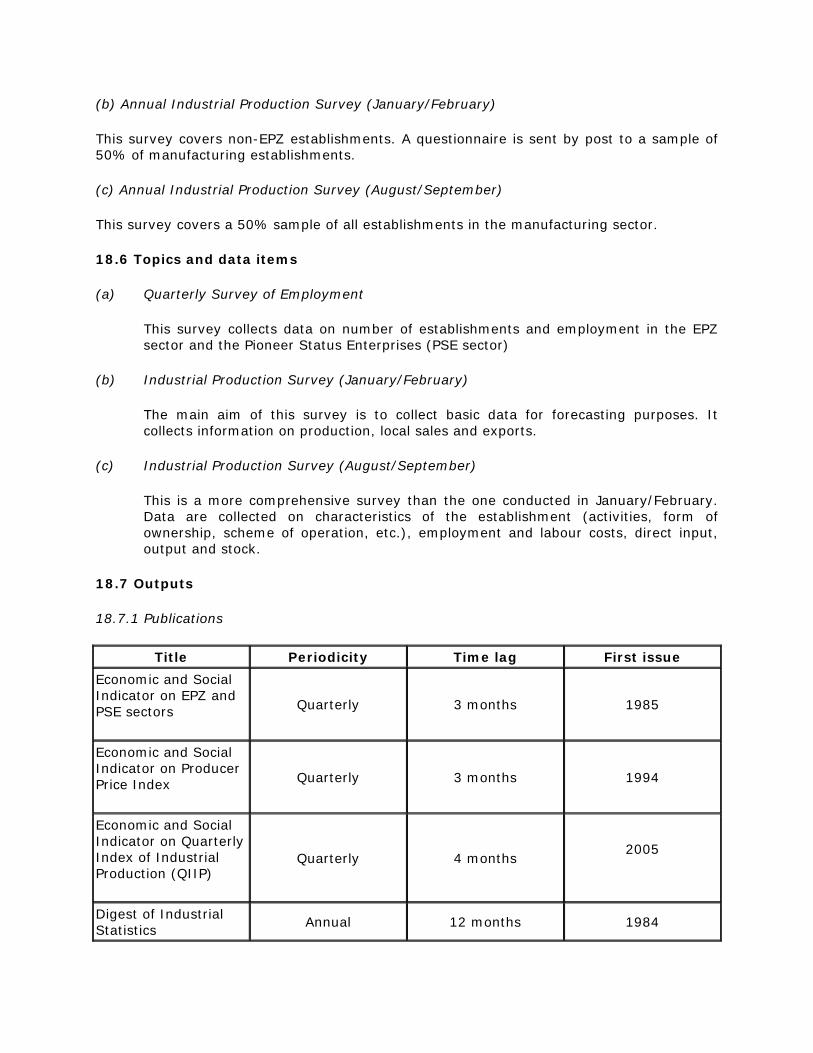
(b) Annual Industrial Production Survey (January/February)
This survey covers non-EPZ establishments. A questionnaire is sent by post to a sample of 50% of manufacturing establishments.
(c) Annual Industrial Production Survey (August/September)
This survey covers a 50% sample of all establishments in the manufacturing sector.
18.6 Topics and data items
(a) Quarterly Survey of Employment
This survey collects data on number of establishments and employment in the EPZ sector and the Pioneer Status Enterprises (PSE sector)
(b) Industrial Production Survey (January/February)
The main aim of this survey is to collect basic data for forecasting purposes. It collects information on production, local sales and exports.
(c) Industrial Production Survey (August/September)
This is a more comprehensive survey than the one conducted in January/February. Data are collected on characteristics of the establishment (activities, form of ownership, scheme of operation, etc.), employment and labour costs, direct input, output and stock.
18.7 Outputs
18.7.1 Publications
Title Periodicity Time lag First issue Economic and Social Indicator on EPZ and PSE sectors
Quarterly 3 months 1985
Economic and Social Indicator on Producer Price Index
Quarterly 3 months 1994
Economic and Social Indicator on Quarterly Index of Industrial Production (QIIP)
Quarterly 4 months 2005
Digest of Industrial Statistics Annual 12 months 1984

18.7.2 Other
Compilation of statistics for internal purposes
18.8 Guidelines followed
• International Labour Organisation for definitions of employment, establishment, wages and salaries.
• Industrial Expansion Act for categorisation of industries (Export Processing Zone, Export Services Zone, Pioneer Status Enterprises).
18.9 Classifications used
• National Standard Industrial Classification (an adapted version of the International Standard Industrial Classification of the UN)
• Central Product Classification (UN)
18.10 Data availability
Detailed statistical information on the industrial sector is available since 1980 and appears in the Digest of Industrial Statistics (first issued in 1984)
18.11 Future plans
It is intended in the near future to
• Consolidate and improve the industrial statistical information system with emphasis on improvement of the quality of data produced.
Contact Person Mr. L. Persand Statistician Ministry of Industry, Small and Medium Enterprises, Commerce and Cooperatives Level 5, Air Mauritius Building J. Kennedy Street Port Louis MAURITIUS Tel: (230) 212-8429 Fax: (230) 212-8429 Email: [email protected]

19. Judiciary
19.1 Historical background A statistics unit was created at the Judiciary in May 1999 to develop a harmonized system for the collection of Court Statistics data. 19.2 Activities
compile, analyse and disseminate Court Statistics
19.3 Source of data Data are collected once monthly from the various court Registries. 19.4 Scope and coverage The Statistics collected covers the Supreme Court and all other subordinate Courts. 19.5 Data processing The data on crime statistics are processed by the CISD using IMPS and it is proposed to carry out the same exercise, in house, using EXCEL as other court statistics are presently being processed. 19.6 Topics and data items
• Civil and Criminal cases: lodged, disposed, outstanding number of cases • Criminal offences: offences by category
• Divorce cases: by different categories
• Fines and fees: fines and fees collected by various Courts
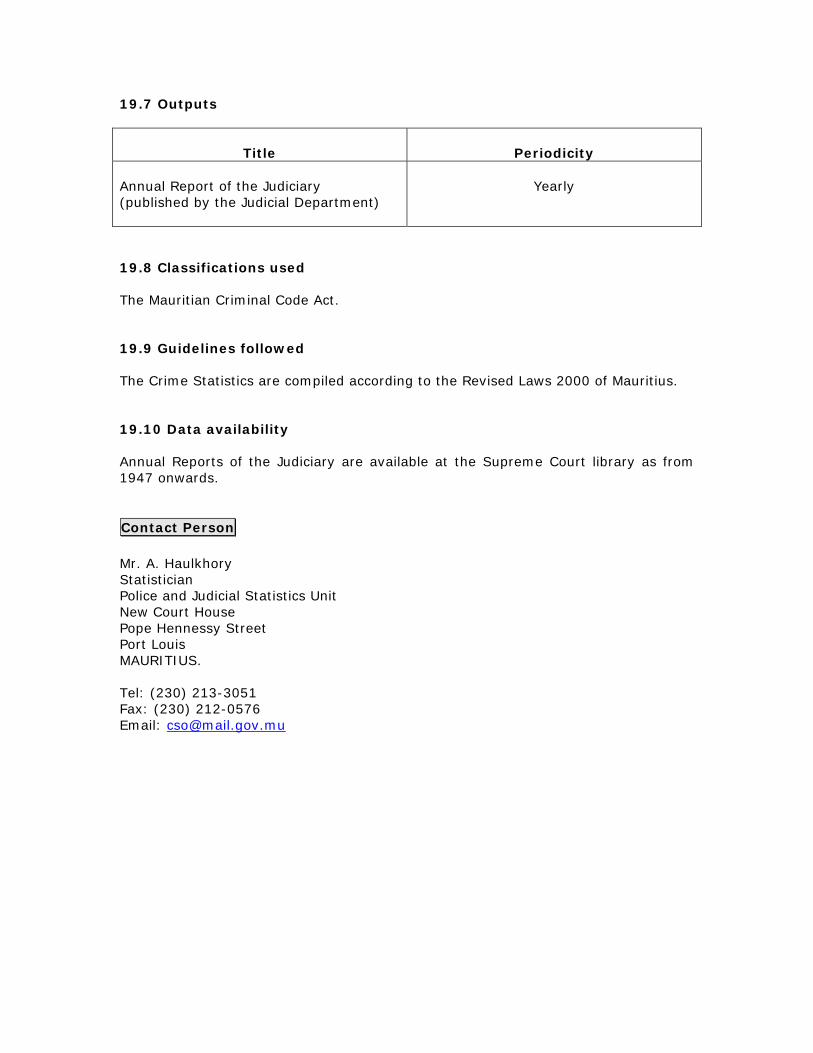
19.7 Outputs
Title
Periodicity
Annual Report of the Judiciary (published by the Judicial Department)
Yearly
19.8 Classifications used The Mauritian Criminal Code Act. 19.9 Guidelines followed The Crime Statistics are compiled according to the Revised Laws 2000 of Mauritius. 19.10 Data availability Annual Reports of the Judiciary are available at the Supreme Court library as from 1947 onwards. Contact Person Mr. A. Haulkhory Statistician Police and Judicial Statistics Unit New Court House Pope Hennessy Street Port Louis MAURITIUS. Tel: (230) 213-3051 Fax: (230) 212-0576 Email: [email protected]
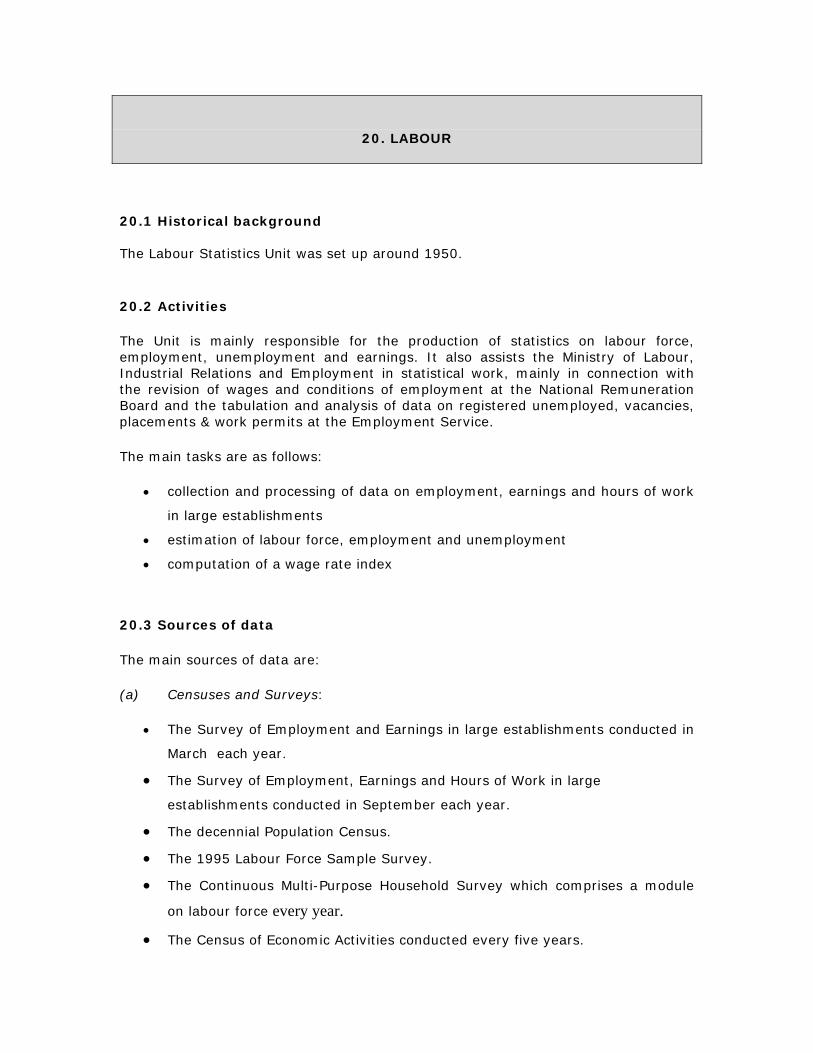
20. LABOUR
20.1 Historical background The Labour Statistics Unit was set up around 1950. 20.2 Activities The Unit is mainly responsible for the production of statistics on labour force, employment, unemployment and earnings. It also assists the Ministry of Labour, Industrial Relations and Employment in statistical work, mainly in connection with the revision of wages and conditions of employment at the National Remuneration Board and the tabulation and analysis of data on registered unemployed, vacancies, placements & work permits at the Employment Service.
The main tasks are as follows:
• collection and processing of data on employment, earnings and hours of work
in large establishments • estimation of labour force, employment and unemployment • computation of a wage rate index
20.3 Sources of data
The main sources of data are:
(a) Censuses and Surveys:
• The Survey of Employment and Earnings in large establishments conducted in
March each year.
• The Survey of Employment, Earnings and Hours of Work in large
establishments conducted in September each year.
• The decennial Population Census.
• The 1995 Labour Force Sample Survey.
• The Continuous Multi-Purpose Household Survey which comprises a module
on labour force every year.
• The Census of Economic Activities conducted every five years.
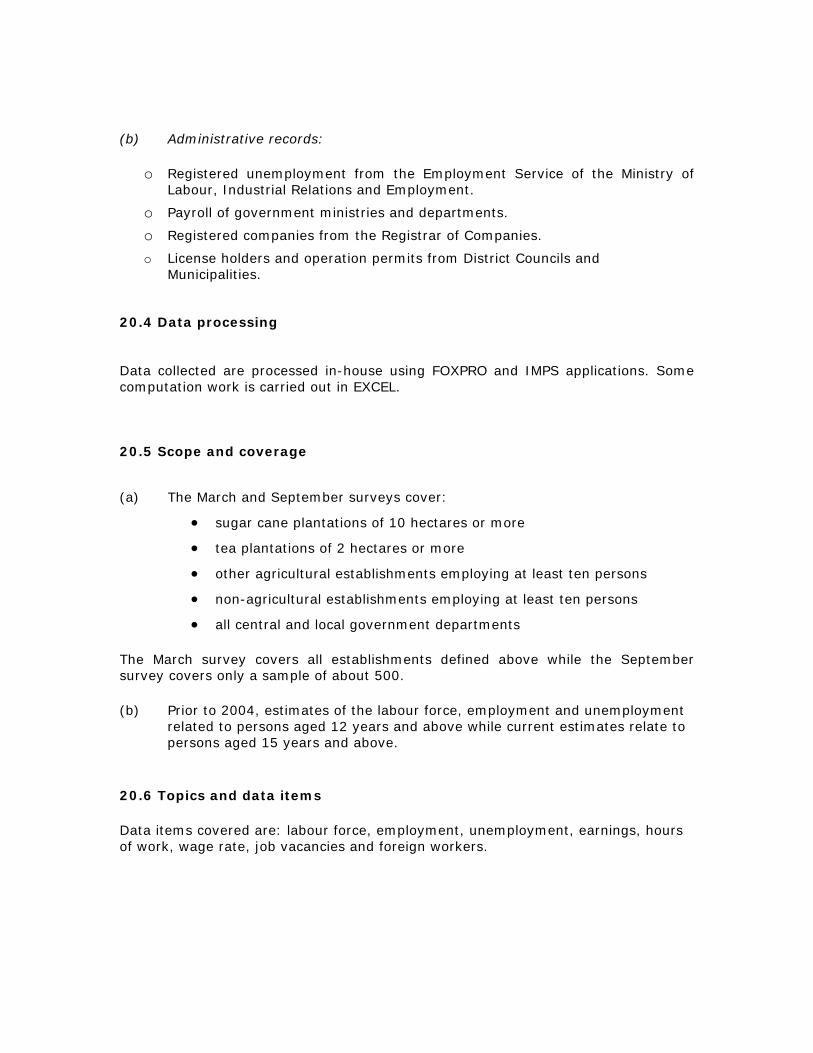
(b) Administrative records:
o Registered unemployment from the Employment Service of the Ministry of Labour, Industrial Relations and Employment.
o Payroll of government ministries and departments. o Registered companies from the Registrar of Companies. o License holders and operation permits from District Councils and
Municipalities.
20.4 Data processing Data collected are processed in-house using FOXPRO and IMPS applications. Some computation work is carried out in EXCEL. 20.5 Scope and coverage
(a) The March and September surveys cover: • sugar cane plantations of 10 hectares or more • tea plantations of 2 hectares or more • other agricultural establishments employing at least ten persons • non-agricultural establishments employing at least ten persons • all central and local government departments
The March survey covers all establishments defined above while the September survey covers only a sample of about 500.
(b) Prior to 2004, estimates of the labour force, employment and unemployment related to persons aged 12 years and above while current estimates relate to persons aged 15 years and above.
20.6 Topics and data items
Data items covered are: labour force, employment, unemployment, earnings, hours of work, wage rate, job vacancies and foreign workers.
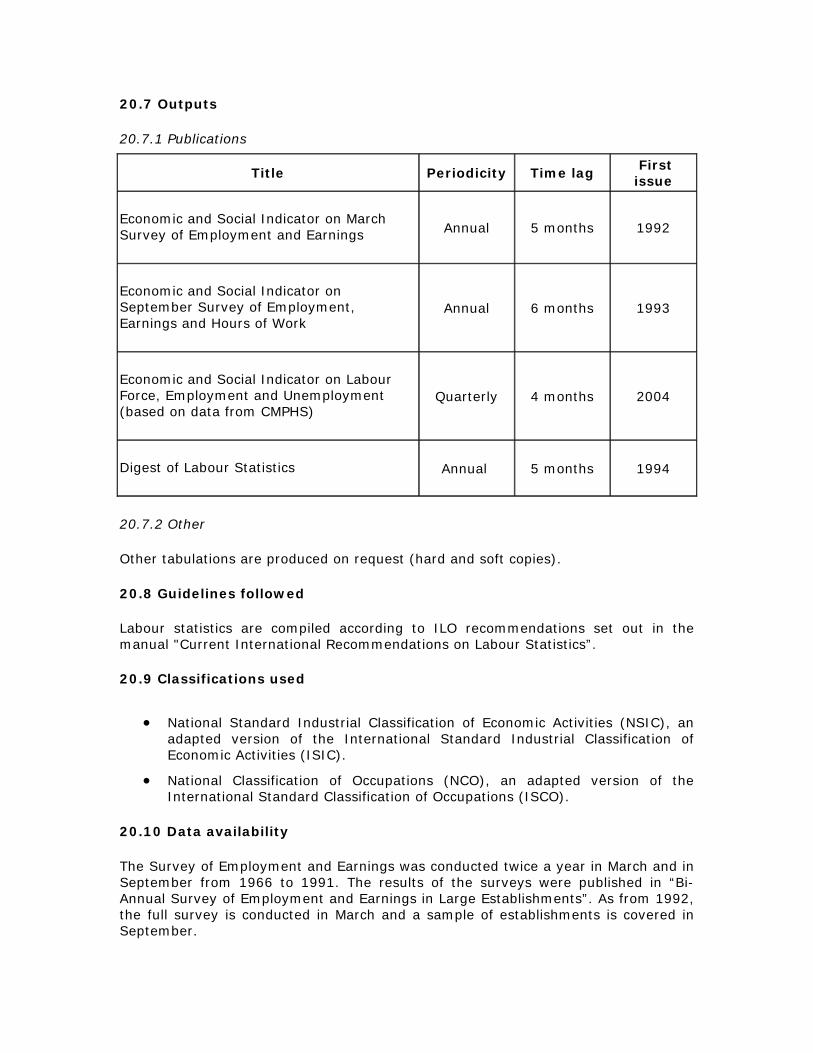
20.7 Outputs
20.7.1 Publications
Title Periodicity Time lag First issue
Economic and Social Indicator on March Survey of Employment and Earnings
Annual 5 months 1992
Economic and Social Indicator on September Survey of Employment, Earnings and Hours of Work
Annual 6 months 1993
Economic and Social Indicator on Labour Force, Employment and Unemployment (based on data from CMPHS)
Quarterly 4 months 2004
Digest of Labour Statistics
Annual 5 months 1994
20.7.2 Other
Other tabulations are produced on request (hard and soft copies).
20.8 Guidelines followed Labour statistics are compiled according to ILO recommendations set out in the manual "Current International Recommendations on Labour Statistics”. 20.9 Classifications used
• National Standard Industrial Classification of Economic Activities (NSIC), an adapted version of the International Standard Industrial Classification of Economic Activities (ISIC).
• National Classification of Occupations (NCO), an adapted version of the International Standard Classification of Occupations (ISCO).
20.10 Data availability
The Survey of Employment and Earnings was conducted twice a year in March and in September from 1966 to 1991. The results of the surveys were published in “Bi-Annual Survey of Employment and Earnings in Large Establishments”. As from 1992, the full survey is conducted in March and a sample of establishments is covered in September.

Annual estimates of labour force, employment and unemployment are available from 1983 to 2003.
Estimates of labour force, employment and unemployment, based on data from the Continuous Multi-purpose Household Survey, are published on a quarterly basis as from 2004.
20.11 Future plans
It is intended to extend the coverage of current labour statistics so as to include accidents at work, strikes and trade union statistics. Contact Person Ms. M. Ganoo Acting Senior Statistician Central Statistics Office L.I.C. Centre John Kennedy Street Port Louis MAURITIUS. Tel: (230) 212-2316, (230) 208-0781 Fax: (230) 211-4150 Email: [email protected]
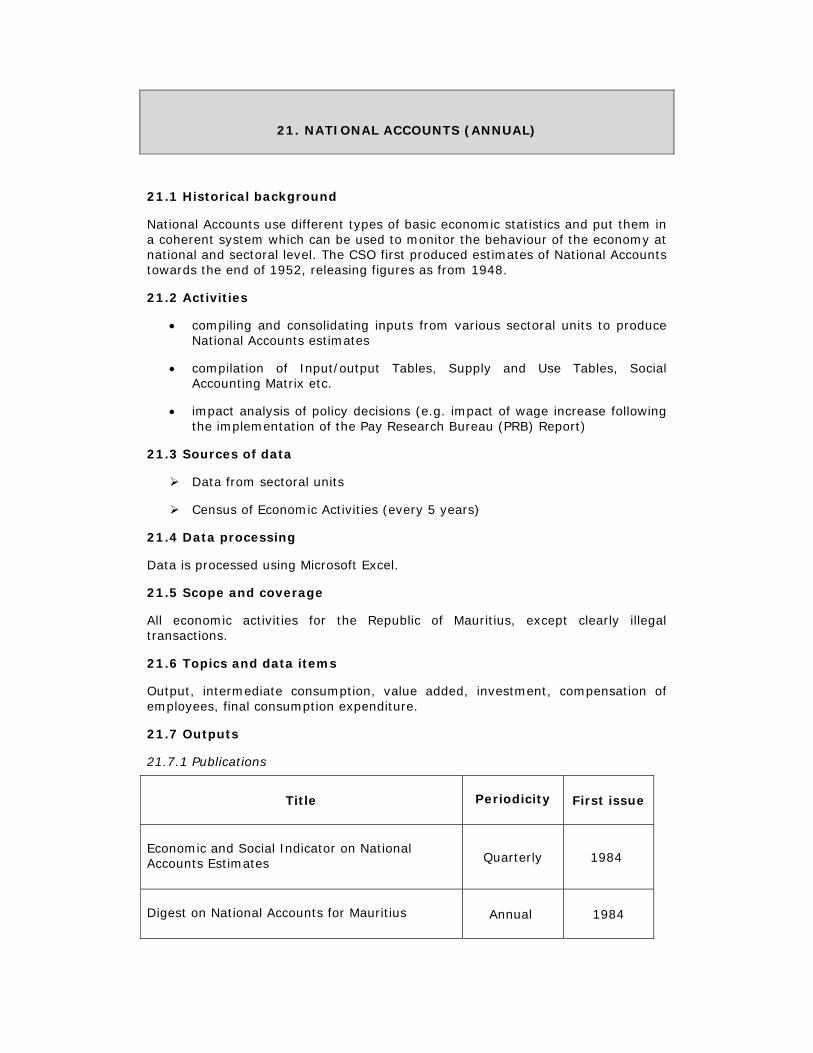
21. NATIONAL ACCOUNTS (ANNUAL)
21.1 Historical background
National Accounts use different types of basic economic statistics and put them in a coherent system which can be used to monitor the behaviour of the economy at national and sectoral level. The CSO first produced estimates of National Accounts towards the end of 1952, releasing figures as from 1948.
21.2 Activities
• compiling and consolidating inputs from various sectoral units to produce National Accounts estimates
• compilation of Input/output Tables, Supply and Use Tables, Social Accounting Matrix etc.
• impact analysis of policy decisions (e.g. impact of wage increase following the implementation of the Pay Research Bureau (PRB) Report)
21.3 Sources of data
Data from sectoral units
Census of Economic Activities (every 5 years)
21.4 Data processing
Data is processed using Microsoft Excel.
21.5 Scope and coverage
All economic activities for the Republic of Mauritius, except clearly illegal transactions.
21.6 Topics and data items
Output, intermediate consumption, value added, investment, compensation of employees, final consumption expenditure.
21.7 Outputs
21.7.1 Publications
Title
Periodicity
First issue
Economic and Social Indicator on National Accounts Estimates
Quarterly 1984
Digest on National Accounts for Mauritius
Annual 1984
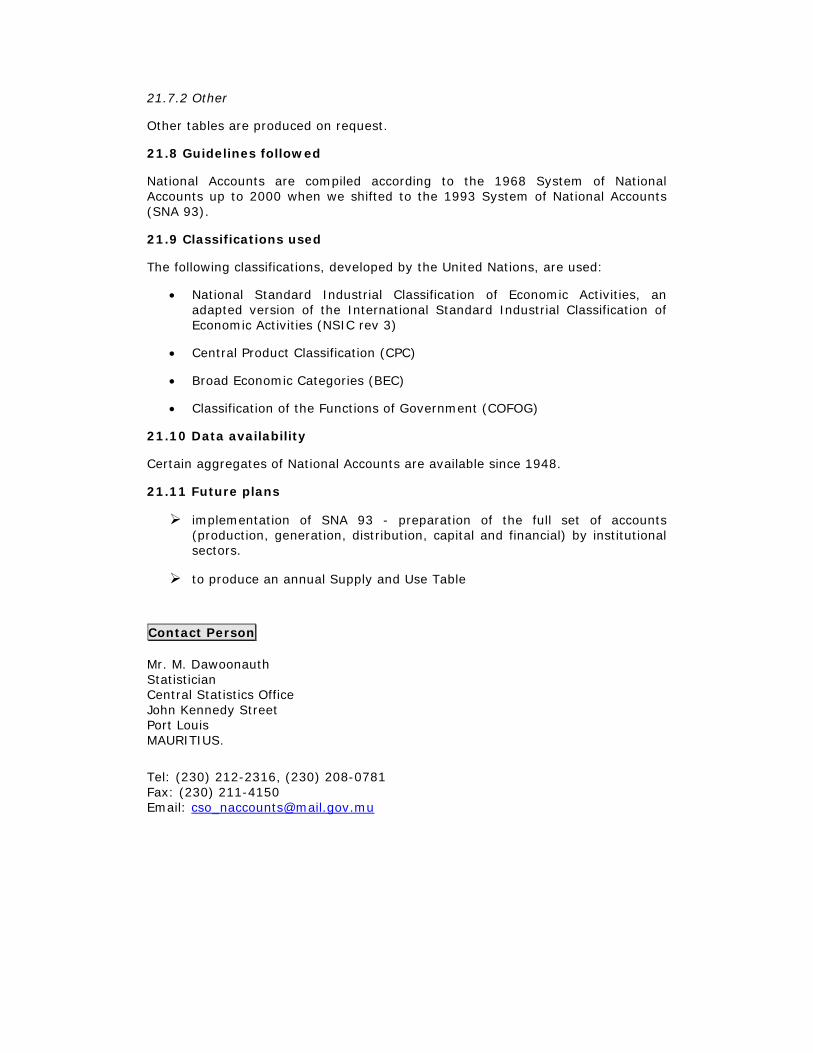
21.7.2 Other
Other tables are produced on request.
21.8 Guidelines followed
National Accounts are compiled according to the 1968 System of National Accounts up to 2000 when we shifted to the 1993 System of National Accounts (SNA 93).
21.9 Classifications used
The following classifications, developed by the United Nations, are used:
• National Standard Industrial Classification of Economic Activities, an adapted version of the International Standard Industrial Classification of Economic Activities (NSIC rev 3)
• Central Product Classification (CPC)
• Broad Economic Categories (BEC)
• Classification of the Functions of Government (COFOG)
21.10 Data availability
Certain aggregates of National Accounts are available since 1948.
21.11 Future plans
implementation of SNA 93 - preparation of the full set of accounts (production, generation, distribution, capital and financial) by institutional sectors.
to produce an annual Supply and Use Table
Contact Person Mr. M. Dawoonauth Statistician Central Statistics Office John Kennedy Street Port Louis MAURITIUS.
Tel: (230) 212-2316, (230) 208-0781 Fax: (230) 211-4150 Email: [email protected]
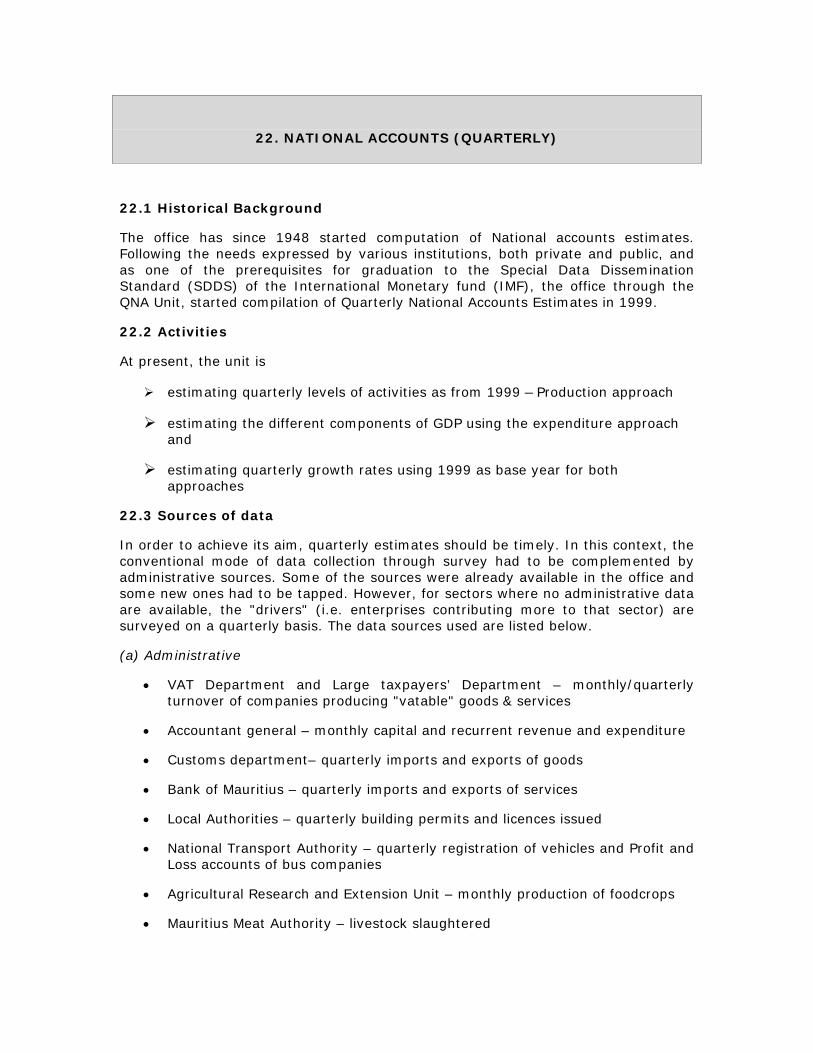
22. NATIONAL ACCOUNTS (QUARTERLY)
22.1 Historical Background
The office has since 1948 started computation of National accounts estimates. Following the needs expressed by various institutions, both private and public, and as one of the prerequisites for graduation to the Special Data Dissemination Standard (SDDS) of the International Monetary fund (IMF), the office through the QNA Unit, started compilation of Quarterly National Accounts Estimates in 1999.
22.2 Activities
At present, the unit is
estimating quarterly levels of activities as from 1999 – Production approach
estimating the different components of GDP using the expenditure approach and
estimating quarterly growth rates using 1999 as base year for both approaches
22.3 Sources of data
In order to achieve its aim, quarterly estimates should be timely. In this context, the conventional mode of data collection through survey had to be complemented by administrative sources. Some of the sources were already available in the office and some new ones had to be tapped. However, for sectors where no administrative data are available, the "drivers" (i.e. enterprises contributing more to that sector) are surveyed on a quarterly basis. The data sources used are listed below.
(a) Administrative
• VAT Department and Large taxpayers’ Department – monthly/quarterly turnover of companies producing "vatable" goods & services
• Accountant general – monthly capital and recurrent revenue and expenditure
• Customs department– quarterly imports and exports of goods
• Bank of Mauritius – quarterly imports and exports of services
• Local Authorities – quarterly building permits and licences issued
• National Transport Authority – quarterly registration of vehicles and Profit and Loss accounts of bus companies
• Agricultural Research and Extension Unit – monthly production of foodcrops
• Mauritius Meat Authority – livestock slaughtered
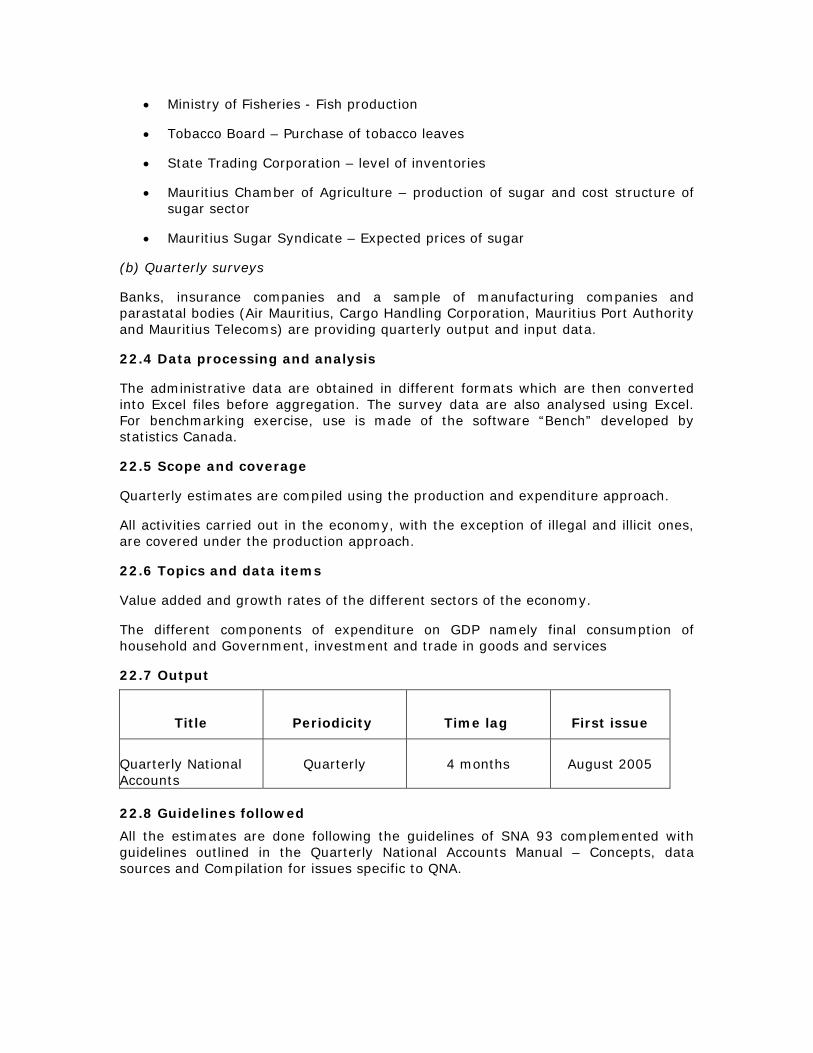
• Ministry of Fisheries - Fish production
• Tobacco Board – Purchase of tobacco leaves
• State Trading Corporation – level of inventories
• Mauritius Chamber of Agriculture – production of sugar and cost structure of sugar sector
• Mauritius Sugar Syndicate – Expected prices of sugar
(b) Quarterly surveys
Banks, insurance companies and a sample of manufacturing companies and parastatal bodies (Air Mauritius, Cargo Handling Corporation, Mauritius Port Authority and Mauritius Telecoms) are providing quarterly output and input data.
22.4 Data processing and analysis
The administrative data are obtained in different formats which are then converted into Excel files before aggregation. The survey data are also analysed using Excel. For benchmarking exercise, use is made of the software “Bench” developed by statistics Canada.
22.5 Scope and coverage
Quarterly estimates are compiled using the production and expenditure approach.
All activities carried out in the economy, with the exception of illegal and illicit ones, are covered under the production approach.
22.6 Topics and data items
Value added and growth rates of the different sectors of the economy.
The different components of expenditure on GDP namely final consumption of household and Government, investment and trade in goods and services
22.7 Output
Title
Periodicity
Time lag
First issue
Quarterly National Accounts
Quarterly 4 months August 2005
22.8 Guidelines followed All the estimates are done following the guidelines of SNA 93 complemented with guidelines outlined in the Quarterly National Accounts Manual – Concepts, data sources and Compilation for issues specific to QNA.
22.9 Classification used
The following classifications developed by the United Nations are used:
• International Standard Industrial Classifications (ISIC rev.3)
• Classification of Broad Economic Categories
• Classification of Functions of Government (COFOG)
22.10 Data availability
o Quarterly levels at current prices for both the production and expenditure approaches are available as from 1999.
o Growth rates over corresponding period of the previous year as from first quarter of 2001.
22.11 Future plans
The series will be adjusted to account for seasonal effects.
In the long term, the other accounts, namely Income and Capital accounts, which are compiled annually have to be computed on a quarterly basis depending on availability of data and resources.
Contact Person Ms. S.F. Cheung Tung Shing Ag. Senior Statistician Central Statistics Office L.I.C. Centre John Kennedy Street Port Louis MAURITIUS. Tel: (230) 212-2316, (230) 208-0781 Fax: (230) 211-4150 Email: [email protected]

23. POPULATION
23.1 Historical background
The responsibility for the computation of resident population rested with the Registrar General’s Office until the creation of the Central Statistical Office in 1945.
23.2 Activities
The Unit is mainly responsible for the production of statistics on population and vital statistics.
The main tasks are as follows:
• coding and tabulation of data on vital events • preparation of population estimates, end of year and mid-year • calculation of vital rates • computation of life-tables • preparation of population projections
23.3 Sources of data
The main sources of data are:
(a) Censuses
• The decennial Housing and Population Census.
(b) Administrative records:
• vital registration from the Central Civil Status Division • international passenger traffic records from the Passport and Immigration
Office • divorce statistics from the Judicial Department
23.4 Data processing
Data on vital events are processed by the Central Information Systems Division using FOXPRO and IMPS (Integrated Micro-computer Processing System) applications, while data on international passenger traffic are processed in-house using Dbase and IMPS. Further computation is carried out using commercial spreadsheet software EXCEL.
The software PEOPLE, developed jointly by the Overseas Development Administration (UK) and the Economic Planning Unit (Malaysia), is used extensively for population projections.
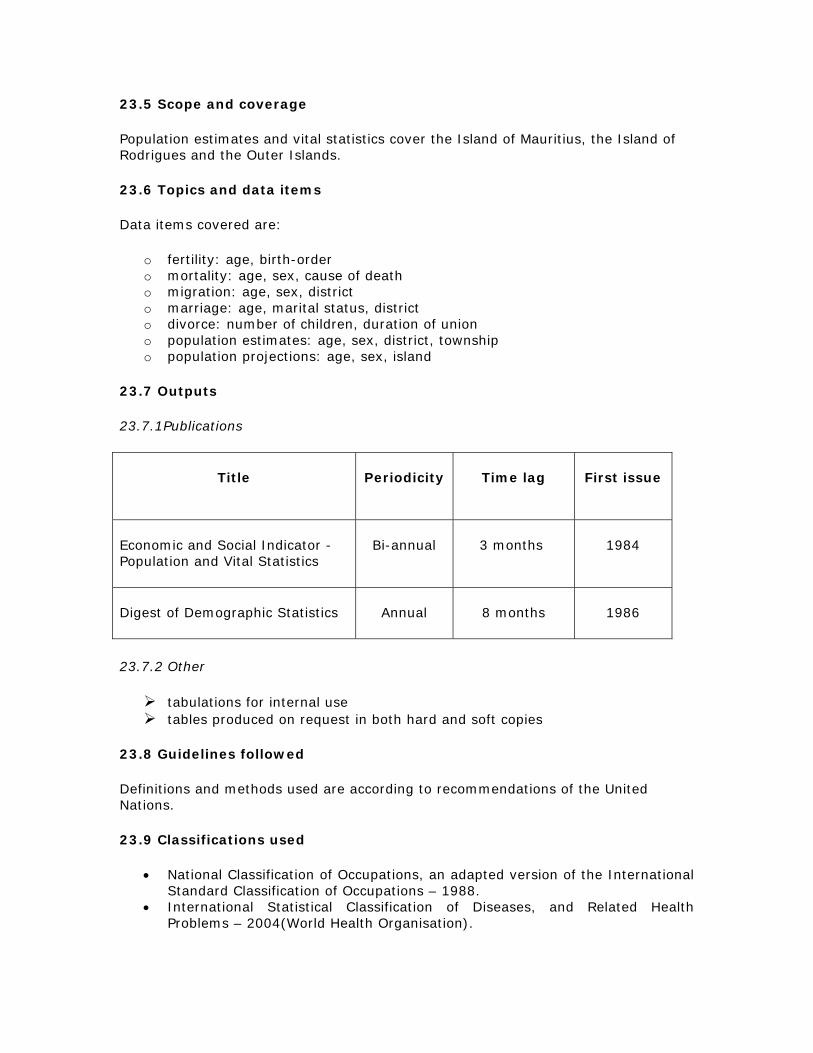
23.5 Scope and coverage
Population estimates and vital statistics cover the Island of Mauritius, the Island of Rodrigues and the Outer Islands.
23.6 Topics and data items
Data items covered are:
o fertility: age, birth-order o mortality: age, sex, cause of death o migration: age, sex, district o marriage: age, marital status, district o divorce: number of children, duration of union o population estimates: age, sex, district, township o population projections: age, sex, island
23.7 Outputs
23.7.1Publications
Title
Periodicity
Time lag
First issue
Economic and Social Indicator - Population and Vital Statistics
Bi-annual
3 months
1984
Digest of Demographic Statistics
Annual
8 months
1986
23.7.2 Other
tabulations for internal use tables produced on request in both hard and soft copies
23.8 Guidelines followed
Definitions and methods used are according to recommendations of the United Nations.
23.9 Classifications used
• National Classification of Occupations, an adapted version of the International Standard Classification of Occupations – 1988.
• International Statistical Classification of Diseases, and Related Health Problems – 2004(World Health Organisation).
23.10 Data availability
Prior to the creation of the Office in 1945, compilation of population estimates and statistics on vital events were done by the Registrar General’s Office. These figures are available in the Annual Report of the Registrar General on Births, Deaths and Marriages.
23.11 Future plans
The manual system of vital registration is being replaced by an on-line computer system. Data will then be provided on diskettes and processed in-house with the assistance of CISD officers. It is expected that the new system will become available in 2005, which will enhance timeliness in the production of demographic statistics.
Contact Persons Mr. S. Jugoo Ag. Statistician Central Statistics Office L.I.C Centre John Kennedy Street Port Louis MAURITIUS Tel: (230) 208-0781, (230) 212-2783, (230) 213-3074 Fax: (230) 211-4150 Email: [email protected] Mr. J. Sunkur Principal Demographer Ministry of Health & Quality of Life 3rd Floor, Atchia Building Suffren Street Port Louis MAURITIUS Tel: (230) 212- 2536 Fax: (230) 212-2482 Email: [email protected] / [email protected]
24. PRICES
24.1 Historical background The Prices Unit has been set up since October 1992. It is responsible for the collection of prices used to compute the following indices:
• Construction Price Index • Producer Price Index – Manufacturing (PPI-M) • Producer Price Index- Agriculture (PPI-A) • Export Price Index (EPI) and • Import Price Index (IPI)
24.2 Activities Besides price collection, the Unit is also involved in:
identification and selection of appropriate indicators for pricing updating the base prices and weights of different commodities every five
years making adjustments for quality when original items are no longer available
and are being replaced
Since 1999, data on turnover and stock of finished goods are also collected for the computation of Quarterly National Accounts.
24.3 Sources of data Prices for the Producer Price Index (Manufacturing), the Export Price Index and the Import Price Index are collected from a sample of establishments. For the Producer Price Index (Agriculture), prices are collected from auction markets, marketing agencies, planters, first middlemen and producers. All prices are collected through personal visits.
24.4 Scope and coverage The PPI-M relates to the selling price of products by manufacturers on the domestic market, the EPI to export prices of the exporting firms and the IPI to import prices of the importing firms.
For PPI-A, the observed prices are producer prices except for vegetables for which wholesale prices at auction markets are collected instead of farm gate prices.
The Construction Price Index relates to transaction prices, that is, prices that any member of the public would be paying to purchase the specified good or service.
24.5 Outputs Both monthly and average quarterly prices for the indices are available in the unit.

24.6 Classifications used The NSIC is used to classify the items that are being priced for PPI-M, while SITC (REV3) is used for EPI and IPI
24.7 Future plans To make available all basic statistics shortly after the reference quarter to improve timeliness for the production of the different indices.
Contact Person Mr. S. Boodoo, Statistician Central Statistics Office John Kennedy Street Port Louis MAURITIUS. Tel: (230) 212-2316, (230) 208-0781 Fax: (230) 211-4150 Email: [email protected]
25. PRODUCTIVITY
25.1 Historical background In 1996, following the recommendation of a mission from the National Productivity Institute of South Africa, a unit was set up to compute the different productivity and competitiveness indices. 25.2 Activities
• Collection of the basic data for the economy and different activity group from the different units of the office and other organisations.
• Extraction of information from international publications. • Downloading of reports from website for international comparison. • Computation of the different productivity and competitiveness indices.
25.3 Sources of data
The different sources tapped are
(a) Different units of the office
National Accounts Unit Labour Unit Industry Unit Energy Unit Public Finance Unit Trade Unit CPI Unit
(b) National organisations Mauritius Telecoms Development Bank of Mauritius MIDA Air Mauritius
(c) Reports of international organisations
Bureau of Labour Statistics (BLS) International Trade Centre
25.4 Data processing and analysis The calculations and tabulations are done using Microsoft Excel.

25.5 Scope and coverage
Productivity indices are presently computed for
the whole economy the manufacturing sector the Export Processing Zone, broken down into textiles and non-textiles
25.6 Topics and data items
The following productivity indices and competitiveness indicators are calculated.
• Labour productivity • Capital productivity; capital-output and capital labour ratios • Multifactor productivity • Unit labour cost • Cost of selected inputs • Real earnings • Hourly compensation cost • Exchange rate movements • Evolution of market share
25.7 Outputs
Title
Periodicity
Time lag
First issue
Economic and Social Indicator on Productivity and Competitiveness
Bi-annual
6 months
1997
Digest of Productivity and Competitiveness Statistics
Annual
12 months
1998
25.8 Guidelines followed
The definitions of productivity and competitiveness indices follow those of the Bureau of Labour Statistics. In the case of capital consumption, guidelines of SNA 93 are followed. 25.9 Classification used The basic data used for computation of the indices were based on the NSIC 2 but as from 2001, a new series has been calculated using NSIC Rev.3.

25.10 Data availability The indices published date back to 1982 and are based on the SNA 68 and NSIC 2 classifications. As from year 2005, the indices for the total economy, the manufacturing and EPZ sectors have been calculated using year 2000 as base. Contact Person Ms. R. Soborun Statistician Central Statistics Office L.I.C. Centre John Kennedy Street Port Louis MAURITIUS.
Tel: (230) 212-2316, (230) 208-0781 Fax: (230) 211-4150 Email: [email protected]

26. ROAD ACCIDENTS
26.1 Historical background
Following the high increase in the number of vehicles, a statistical unit was set up in 1982 at the Traffic Management Unit (TMU) of the Ministry of Works to compile statistics related to road accidents. 26.2 Activities The unit is responsible mainly for the collection, editing, processing and analysis of data in connection with road accidents. 26.3 Sources of data
Accidents reported to the police are forwarded to the unit through a specially designed form: Road Accident Data form (PF178).
Returns submitted by Insurance Companies.
26.4 Scope and coverage Prior to August 2004 data covered all road accidents involving at least one vehicle. With the introduction of “Agreed Statement of Facts (ASOF)” in August 2004, only road accidents which involve injury and/or damage to property need to be reported to the police while the others are reported directly to the insurance companies. Hence, as from this date, road traffic accidents include data available both from the police department and the insurance companies. However, disaggregated data can be compiled only for those accidents reported to the police. However, as from August 2004 only accidents involving injury are taken into consideration. 26.5 Data processing Information are processed and tabulated in-house on stand alone PCs using the Microcomputer Accident Analysis Package (MAAP) which incorporates a digital mapping module. 26.6 Topics and data items
• road accidents by seriousness of injury • road fatality rate and index • number of accidents by type of vehicles
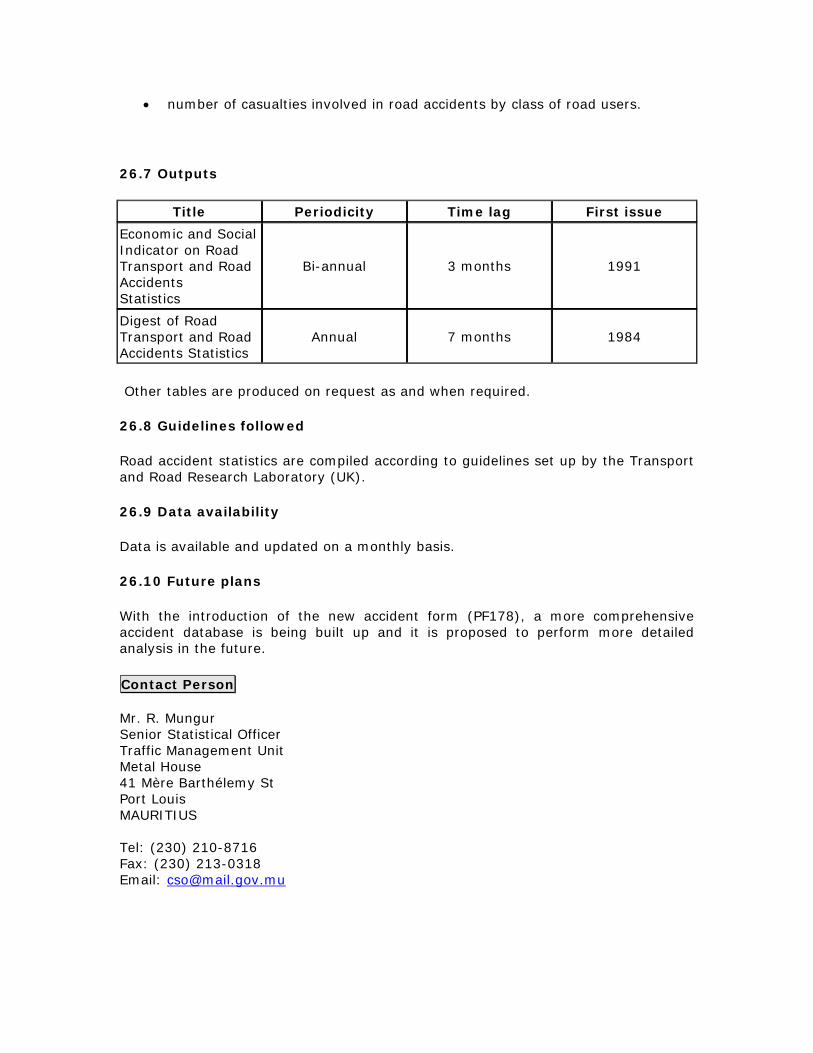
• number of casualties involved in road accidents by class of road users.
26.7 Outputs
Title Periodicity Time lag First issue Economic and Social Indicator on Road Transport and Road Accidents Statistics
Bi-annual 3 months 1991
Digest of Road Transport and Road Accidents Statistics
Annual 7 months 1984
Other tables are produced on request as and when required.
26.8 Guidelines followed
Road accident statistics are compiled according to guidelines set up by the Transport and Road Research Laboratory (UK).
26.9 Data availability
Data is available and updated on a monthly basis.
26.10 Future plans
With the introduction of the new accident form (PF178), a more comprehensive accident database is being built up and it is proposed to perform more detailed analysis in the future.
Contact Person Mr. R. Mungur Senior Statistical Officer Traffic Management Unit Metal House 41 Mère Barthélemy St Port Louis MAURITIUS Tel: (230) 210-8716 Fax: (230) 213-0318 Email: [email protected]

27. ROAD TRANSPORT
27.1 Historical background
Following the high increase in the number of vehicles, a statistical unit was setup in 1982 at the National Transport Authority to compile reliable and timely vehicle statistics.
27.2 Activities
• The collection, editing, processing and analysis of data in the road transport field.
• The compilation of statistics relating to the fleet of vehicles. • Bus operational statistics. • Computation of value added and capital formation on an annual and quarterly
basis for the land transport sector.
27.3 Sources of data
• Vehicles registration forms from the National Transport Authority (daily). • Data from Vehicles' Examination Centres of the NTA (weekly). • Vehicles Inspectorate units of the NTA (weekly).
27.4 Data processing
Data from the different sources are processed and tabulated in-house on stand alone PCs using Microsoft Excel.
27.5 Scope and coverage
All vehicles registered at the National Transport Authority.
27.6 Topics and data items
• Registration of new and second hand vehicles. • Vehicles put off the road • Distribution of vehicles by type and age. • Imports of vehicles' spare-parts.

27.7 Outputs
Title
Periodicity
Time lag
First issue
Economic and Social Indicator on Road Transport and Road Accidents Statistics
Bi-annual
3 months
1986
Digest of Road Transport and Road Accidents Statistics
Annual
7 months
1984
Other tables are produced on request as and when required.
27.8 Guidelines followed
Transport statistics are compiled according to the guidelines set up by the National Transport Authority.
27.9 Classifications used
The classification of vehicles follows the definition given in the Road Traffic Act of 1962.
27.10 Data availability
Data on fleet of vehicles is available as from 1972.
27.11 Future plans
The NTA has initiated the computerisation of its whole system of registration. This will reduce the time lag for the production of road transport statistics.
Contact Person
Mr. A. Poreema Senior Statistical Officer National Transport Authority MSI Building Cassis MAURITIUS Tel: (230) 202-2831 Fax: (230) 211-4150 Email: [email protected]
28. SOCIAL SECURITY
28.1 Historical Background
A Statistics Unit was set up at the Ministry of Social Security and National Solidarity in 1973. However, compilation of statistics related to Social Security dates back to the nineteen sixties. These statistics were published in the Annual Report of the Public Assistance Department of the Ministry of Labour and Social Security.
28.2 Activities
The Unit is responsible for the compilation, processing and dissemination of statistics on Social Security. It is mainly involved in preparing
• estimates on current and projected number of pensioners and amount paid to them by type of pension
• statistics on industrial injury for those workers covered by the National Pensions Scheme
• statistics on number of beneficiaries of Social Aid from government • statistics on residents of government-subsidised infirmaries and orphanages
28.3 Sources of data
Most of the data are obtained from the various branches of the Ministry on a monthly basis. Data on Social Aid are compiled from an annual survey that covers all the regional Social Security Offices in Mauritius and Rodrigues. Data on residents of government-subsidised infirmaries and orphanages are also collected from an annual survey of such institutions.
28.4 Scope and coverage
The statistics refer only to recipients of social assistance from the Ministry of Social Security and to persons covered under the National Pensions Scheme. Private pension schemes and the pension scheme for civil servants are not included. Statistics on work accidents cover reported cases only.
28.5 Topics and data items
Pension: type of pension, amount, mode of payment, age and sex of pensioner
Industrial Injury: Major activity, type of accident, nature of accident, duration of incapacity, material agency (i.e. physical tool, object, etc. associated with the injury), body location
Social Aid: contingency, amount, age and sex of beneficiary, district of residence

Residents of government-subsidised infirmaries and orphanages: Age, sex, type of disability/disease
28.6 Outputs
Title Periodicity Time lag
First issue
Economic and Social Indicator on Social Security Statistics
Annual 6 months 1998
Digest of Social Security Statistics
Annual 9 months 2002
28.7 Guidelines followed
Guidelines on the compilation of the statistics have been defined internally according to the Ministry's requirements, except for work accidents which are compiled according to ILO recommendations.
28.8 Classifications used
Prior to 2002, statistics on work accidents were compiled according to the International Standard Industrial Classification (ISIC 1968). Since 2002 the more recent National Standard Industry Classification (NSIC), based on ISIC rev. 3 is being used.
The classification used for disabilities was developed in-house to suit the needs of the Ministry.
28.9 Data availability
Some historical data series are available in the unit since 1960.
Contact Person Ms. H. Tse Ve Koon Senior Statistical Officer Ministry of Social Security, National Solidarity & Senior Citizen Welfare and Reform Institutions N.P.F Building Rose Hill MAURITIUS. Tel: (230) 465-4119, (230) 465-3454 Ext. 1159 Fax: (230) 465-4665 Email: [email protected]
29. TOURISM
29.1 Historical background
In the late seventies, the CSO set up a Unit at the Mauritius Government Tourist Office (MGTO) to produce relevant indicators to assist in monitoring the industry and in formulating policy. When the MGTO became a parastatal body under the name of Mauritius Tourism Development Authority in 1996, the Statistics Unit was transferred to the Ministry of Tourism.
Before the creation of that unit, tourism statistics were compiled by the Demography Unit of the CSO as part of statistics on international travel.
29.2 Activities
The main task of the Unit is to process information gathered from embarkation and disembarkation cards filled in by all incoming and outgoing passengers. The staff is particularly engaged in the following activities:
• Tabulating tourist arrivals by country of residence, nationality, purpose of visit, age, sex and length of stay.
• Calculation of room and bed occupancy rates. • Estimation of tourist nights. • Short term projections of tourist arrivals. • Tabulating departure of Mauritian residents by country visited. • Conducting and processing the biennial "Survey of Outgoing Tourists". • Calculating value added of the “Hotels and Restaurants Sector” at current and
constant prices. • Providing short term forecast of value added of “Hotels and Restaurants
Sector”.
29.3 Sources of data
The main source of data for the compilation of passenger traffic statistics is the Passport and Immigration Office which maintains a database of all passengers entering and leaving the country. The data are extracted from the embarkation/disembarkation cards filled in by all passengers. At the end of every month, passenger traffic for that particular month is downloaded on diskette from the computer system and supplied to the Statistics Unit.
Hotels provide data on accommodation capacity (rooms and beds), and occupancy rates on a monthly basis.
A survey of Outgoing Tourists is conducted every two years since 1984.
29.4 Scope and coverage
Prior to 1994, data on passenger traffic were compiled from a 10% sample of embarkation and disembarkation cards. As from January 1994, they are based on movements of all passengers, including those of cruise ships.
Tourism statistics cover all non-residents staying for more than 24 hours but less than a year, and not involved in any gainful occupation during their stay. However, data on excursionists, that is those who stay less than 24 hours in the country, are compiled and published separately.
The Survey of Outgoing Tourists covers a representative sample of tourists at the time of their departure. The objective of this survey is to obtain qualitative and quantitative information on tourists to supplement the recurrent statistics.
29.5 Data processing and analysis
Monthly tourism statistics are processed at the Unit on microcomputers using IMPS software. The processing involves several steps, namely editing, imputation of missing values and recoding.
The survey of outgoing tourists is also processed in-house with the support of the CISD, using IMPS.
29.6 Topics and data items
(a) Embarkation/disembarkation cards
The following information is gathered from the embarkation/disembarkation card: Date of travel, country of residence, nationality, age, sex, usual address, purpose of visit.
(b) Survey of Outgoing Tourists
The data collected relate mainly to expenditure pattern, purpose and frequency of visits, accommodation and rating of facilities.
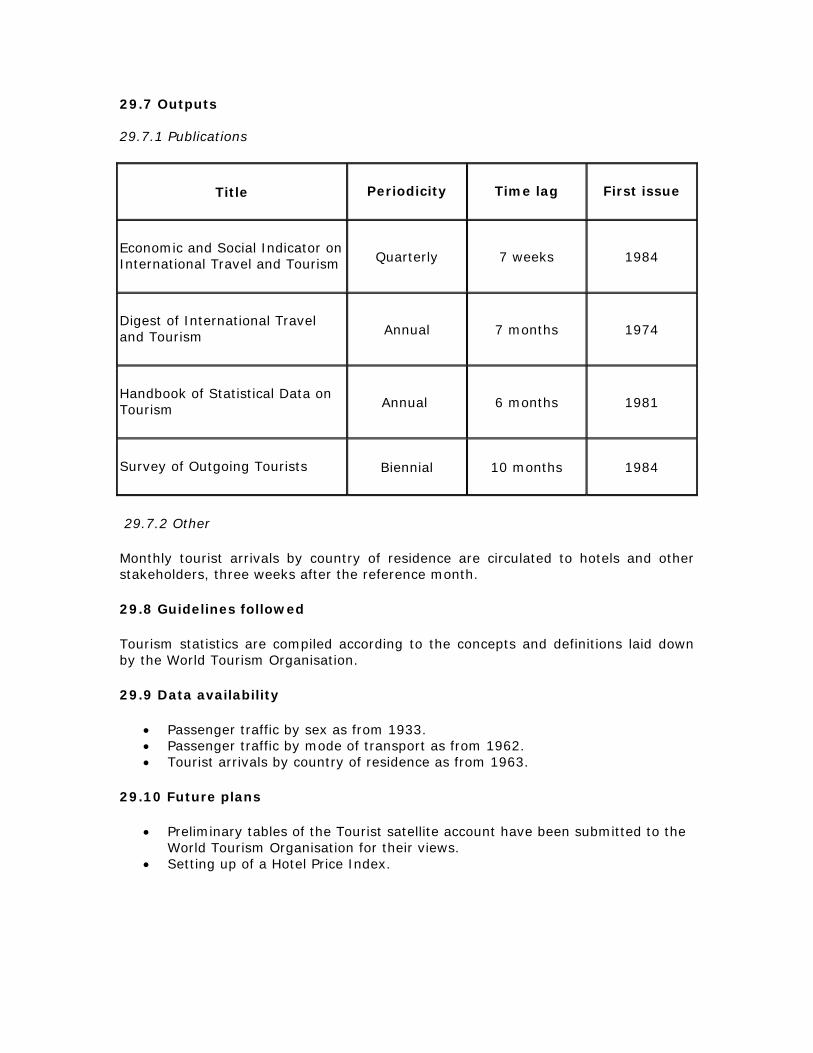
29.7 Outputs 29.7.1 Publications
Title
Periodicity
Time lag
First issue
Economic and Social Indicator on International Travel and Tourism
Quarterly 7 weeks 1984
Digest of International Travel and Tourism
Annual 7 months 1974
Handbook of Statistical Data on Tourism
Annual 6 months 1981
Survey of Outgoing Tourists
Biennial 10 months 1984
29.7.2 Other
Monthly tourist arrivals by country of residence are circulated to hotels and other stakeholders, three weeks after the reference month.
29.8 Guidelines followed
Tourism statistics are compiled according to the concepts and definitions laid down by the World Tourism Organisation.
29.9 Data availability
• Passenger traffic by sex as from 1933. • Passenger traffic by mode of transport as from 1962. • Tourist arrivals by country of residence as from 1963.
29.10 Future plans
• Preliminary tables of the Tourist satellite account have been submitted to the World Tourism Organisation for their views.
• Setting up of a Hotel Price Index.

Contact Person Ms. R. Moraby Statistician Ministry of Tourism Ken Lee Tower, 7th Floor Barracks Street Port Louis MAURITIUS Tel. (230) 210-9832 Fax: (230) 211-4150 Email: [email protected]
30. WOMEN AND CHILD WELFARE
30.1 Historical Background
A Statistics Unit was set up in the Ministry of Women's Rights in 1987 to provide sex-disaggregated data for the formulation of national plans and policies to promote greater equality and equity between men and women.
30.2 Activities
The main tasks of the Statistics Unit consist of
• Processing of monthly statistics returns from the Family Support Bureau of the Ministry.
• Processing of survey questionnaires relative to employment in the Civil Service and Public Institutions.
• Processing of data on home economics courses given by the Ministry.
• Processing of monthly returns on cases of physical assaults against women and children reported at hospitals.
• Processing and analysis of data from ad-hoc surveys conducted by the Ministry.
30.3 Sources of data
Most of the data are obtained from administrative records and survey questionnaires. Gender disaggregated statistics on employment in the Civil Service are obtained from questionnaires sent to ministries and public institutions.
30.4 Scope and coverage
The statistics on domestic violence and other problems relating to children and the family refer to reported cases at the Ministry.
30.5 Topics and data items
• Domestic violence: type of abuse, and sex of victim • Child abuse: type of abuse and sex of child • Employment in civil service and public institutions: sex, occupation and
ministry/department

30.6 Outputs
Statistics on women are published by the Ministry since 1989. The first report was entitled "Women in Figures". As from 2003, a more comprehensive report entitled “Statistics in Mauritius – A gender perspective" is available.
30.7 Guidelines followed
Guidelines on the compilation of the statistics have been defined internally according to the Ministry's requirements.
30.8 Classifications used
The classifications used were developed in-house to suit the needs of the Ministry.
Contact Person Ms. D. Beerachee Senior Statistical Officer Ministry of Women's Rights, Child Development & Family Welfare CKS Building Remy Ollier Street Port Louis MAURITIUS Tel: (230) 206-3800, (230) 206-3799 Fax: (230) 211-4150 Email: [email protected]
31. STATISTICS NOT COVERED BY CSO
31.1 Health Statistics
Health statistics are collected, compiled and published by the Ministry of Health and Quality of Life. An annual digest covering population and vital statistics, morbidity and mortality, health infrastructure, sanitation and food hygiene, etc. is published by the Ministry.
Contact Persons Mr. N. Jeeanody Chief Health Statistician Health Statistics Unit Ministry of Health and Quality of Life Atchia Building, Port Louis MAURITIUS Tel : (230) 210-0940, (230) 212-2085 Fax: (230) 210-4102 Email: [email protected] Mr. J. Sunkur Principal Demographer Ministry of Health & Quality of Life 3rd Floor Emmanuel Anquetil Building Port Louis MAURITIUS Tel : (230) 212-2536 Fax: (230) 212-2482 Email: [email protected]
31.2 Balance of Payments and Monetary Statistics
The Bank of Mauritius is responsible for the compilation of the balance of payments and monetary statistics. It also produces a wide range of money and banking statistics such as reserve money, monetary ratios, circulation of money, commercial banks' assets and liabilities, etc. All these statistics are published in the Monthly Bulletin and the Annual Report of the Bank.
Contact Person
Mr. H.O.Jankee Director of Research Bank of Mauritius Sir W. Newton Street Port Louis MAURITIUS Tel: (230) 202-3977 Fax: (230) 208-4638 Email: [email protected]
31.3 Fisheries statistics
Fisheries statistics are collected and compiled by the Albion Fisheries Research Centre (AFRC) of the Ministry of Fisheries. Data on marine resources, aquaculture, marine sciences, marine parks & reserves, and fisheries protection service are published in an annual report.
Contact Person
Mr. B. D. Rathacharan Divisional Scientific Officer Albion Fisheries Research Centre Albion MAURITIUS Tel : (230) 238-4100 Fax: (230) 238-4184 Email: [email protected]
31.4 Foodcrop production
The Agricultural Research and Extension Unit (AREU) collects data on food crop and publishes a monthly bulletin "Foodcrop Outlook", which contains information on: prevailing climatic conditions, irrigation status and water availability, area harvested and production, main economic crops, prevalence of pests and diseases, outlook and forecast of crops, wholesale and retail prices, etc.

Contact Person Mr. R. K .Ramnauth Biometrician Agricultural Research & Extension Unit 3rd Floor, Newry Complex Quatre Bornes MAURITIUS Tel: (230) 466-3885 Fax: (230) 464-8809 Email: [email protected]
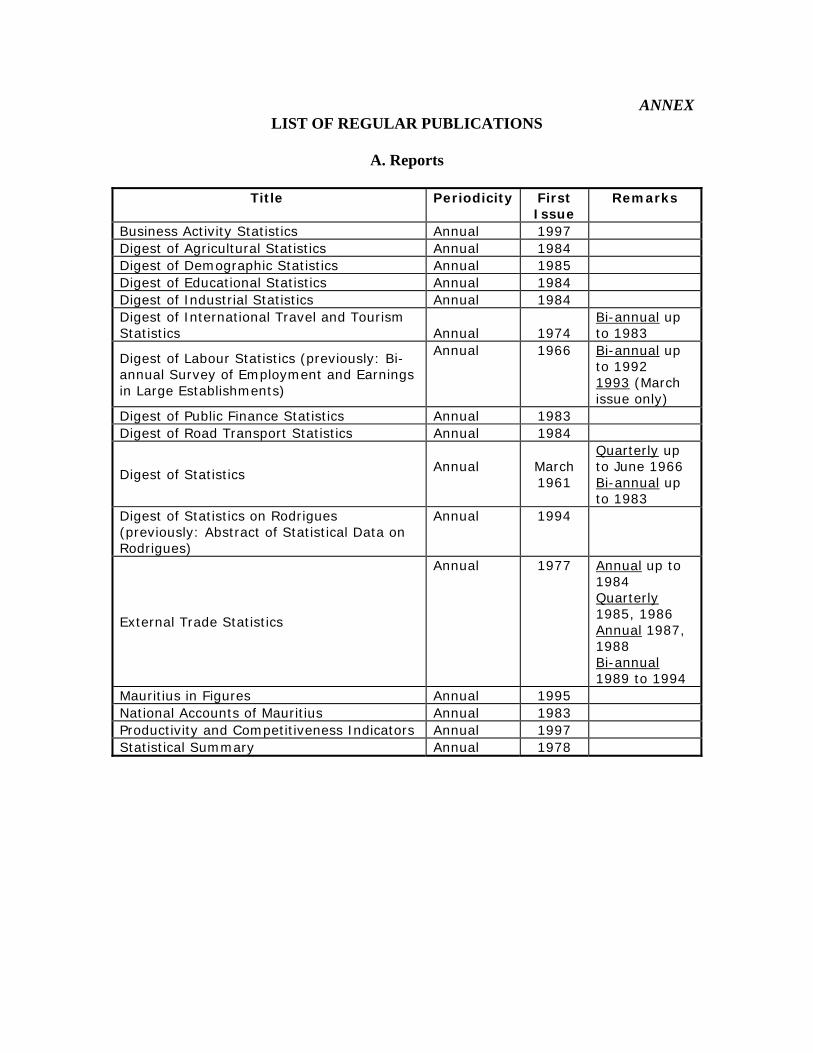
ANNEX LIST OF REGULAR PUBLICATIONS
A. Reports
Title Periodicity First
Issue Remarks
Business Activity Statistics Annual 1997 Digest of Agricultural Statistics Annual 1984 Digest of Demographic Statistics Annual 1985 Digest of Educational Statistics Annual 1984 Digest of Industrial Statistics Annual 1984 Digest of International Travel and Tourism Statistics
Annual
1974
Bi-annual up to 1983
Digest of Labour Statistics (previously: Bi-annual Survey of Employment and Earnings in Large Establishments)
Annual 1966 Bi-annual up to 1992 1993 (March issue only)
Digest of Public Finance Statistics Annual 1983 Digest of Road Transport Statistics Annual 1984
Digest of Statistics
Annual
March 1961
Quarterly up to June 1966 Bi-annual up to 1983
Digest of Statistics on Rodrigues (previously: Abstract of Statistical Data on Rodrigues)
Annual 1994
External Trade Statistics
Annual 1977 Annual up to 1984 Quarterly 1985, 1986 Annual 1987, 1988 Bi-annual 1989 to 1994
Mauritius in Figures Annual 1995 National Accounts of Mauritius Annual 1983 Productivity and Competitiveness Indicators Annual 1997 Statistical Summary Annual 1978

B. Economic and Social Indicators
Title Periodicity First Issue
Remarks
Agricultural and Fish Production Bi-annual Mar
1986
Business Activity Statistics Annual Feb 1999
Construction Price Index Quarterly Sep
1994
Consumer Price Index Quarterly Feb
1984
Continuous Multi-Purpose Household Survey - Labour Force, Employment and Unemployment
Quarterly Jul 2004
Data available in “Labour Force, Employment and Unemployment” prior to July 2004
Education Statistics Annual Jan
1992
Energy Statistics Annual Dec
1999
Export Price Index Quarterly Aug
1996
Export Processing Zone & Pioneer Status
Quarterly Apr 1985
External Trade Quarterly Feb
1984
International Travel and Tourism Quarterly March
1984
National Accounts Quarterly Jul 2003
Bi-Annual up to March 2003
Population and Vital Statistics Bi-annual
Mar 1984
Producer Price Index - Agriculture Quarterly Sep
1994
Producer Price Index - Manufacturing
Quarterly Sep 1994
Productivity and Competitiveness Annual Jul 1997
Road Transport and Accident Statistics Bi-annual Jul 1986
Social Security Statistics Annual Feb
1998
Survey of Employment and Earnings Annual Jan
1984
Wage Rate Index Annual Sep 1994