A geo-spatial data management system for potentially ...
13
Computers & Geosciences 32 (2006) 29–41 A geo-spatial data management system for potentially active volcanoes—GEOWARN project Radu C. Gogu a, , Volker J. Dietrich b , Bernhard Jenny a , Florian M. Schwandner c , Lorenz Hurni a a Institute of Cartography, Swiss Federal Institute of Technology, ETH-Ho¨nggerberg, 8093 Zurich, Switzerland b Institute of Mineralogy & Petrography, Swiss Federal Institute of Technology, 8092 Zurich, Switzerland c Department of Geological Sciences, Arizona State University , AZ 85287-1404, Tempe, USA Received 3 September 2004; received in revised form 6 April 2005; accepted 6 April 2005 Abstract Integrated studies of active volcanic systems for the purpose of long-term monitoring and forecast and short-term eruption prediction require large numbers of data-sets from various disciplines. A modern database concept has been developed for managing and analyzing multi-disciplinary volcanological data-sets. The GEOWARN project (choosing the ‘‘Kos–Yali–Nisyros–Tilos volcanic field, Greece’’ and the ‘‘Campi Flegrei, Italy’’ as test sites) is oriented toward potentially active volcanoes situated in regions of high geodynamic unrest. This article describes the volcanological database of the spatial and temporal data acquired within the GEOWARN project. As a first step, a spatial database embedded in a Geographic Information System (GIS) environment was created. Digital data of different spatial resolution, and time-series data collected at different intervals or periods, were unified in a common, four-dimensional representation of space and time. The database scheme comprises various information layers containing geographic data (e.g. seafloor and land digital elevation model, satellite imagery, anthropogenic structures, land-use), geophysical data (e.g. from active and passive seismicity, gravity, tomography, SAR interferometry, thermal imagery, differential GPS), geological data (e.g. lithology, structural geology, oceanography), and geochemical data (e.g. from hydrothermal fluid chemistry and diffuse degassing features). As a second step based on the presented database, spatial data analysis has been performed using custom-programmed interfaces that execute query scripts resulting in a graphical visualization of data. These query tools were designed and compiled following scenarios of known ‘‘behavior’’ patterns of dormant volcanoes and first candidate signs of potential unrest. The spatial database and query approach is intended to facilitate scientific research on volcanic processes and phenomena, and volcanic surveillance. r 2005 Elsevier Ltd. All rights reserved. Keywords: Spatial database; GIS; Volcanic hazards; Data modeling; Query tools 1. Introduction 1.1. The ‘‘GEOWARN’’ project The major aim of the European-funded project GEOWARN was the development of a multimedia- based geo-spatial warning system (a modular web-based ARTICLE IN PRESS www.elsevier.com/locate/cageo 0098-3004/$ - see front matter r 2005 Elsevier Ltd. All rights reserved. doi:10.1016/j.cageo.2005.04.004 Corresponding author. Tel.: +41 1 6333036; fax: +41 1 6333053. E-mail address: [email protected] (R.C. Gogu).
Transcript of A geo-spatial data management system for potentially ...

ARTICLE IN PRESS
0098-3004/$ - se
doi:10.1016/j.ca
�Correspondfax: +411 6333
E-mail addr
Computers & Geosciences 32 (2006) 29–41
www.elsevier.com/locate/cageo
A geo-spatial data management system for potentially activevolcanoes—GEOWARN project
Radu C. Gogua,�, Volker J. Dietrichb, Bernhard Jennya,Florian M. Schwandnerc, Lorenz Hurnia
aInstitute of Cartography, Swiss Federal Institute of Technology, ETH-Honggerberg, 8093 Zurich, SwitzerlandbInstitute of Mineralogy & Petrography, Swiss Federal Institute of Technology, 8092 Zurich, Switzerland
cDepartment of Geological Sciences, Arizona State University , AZ 85287-1404, Tempe, USA
Received 3 September 2004; received in revised form 6 April 2005; accepted 6 April 2005
Abstract
Integrated studies of active volcanic systems for the purpose of long-term monitoring and forecast and short-term
eruption prediction require large numbers of data-sets from various disciplines. A modern database concept has been
developed for managing and analyzing multi-disciplinary volcanological data-sets. The GEOWARN project (choosing
the ‘‘Kos–Yali–Nisyros–Tilos volcanic field, Greece’’ and the ‘‘Campi Flegrei, Italy’’ as test sites) is oriented toward
potentially active volcanoes situated in regions of high geodynamic unrest. This article describes the volcanological
database of the spatial and temporal data acquired within the GEOWARN project. As a first step, a spatial database
embedded in a Geographic Information System (GIS) environment was created. Digital data of different spatial
resolution, and time-series data collected at different intervals or periods, were unified in a common, four-dimensional
representation of space and time. The database scheme comprises various information layers containing geographic
data (e.g. seafloor and land digital elevation model, satellite imagery, anthropogenic structures, land-use), geophysical
data (e.g. from active and passive seismicity, gravity, tomography, SAR interferometry, thermal imagery, differential
GPS), geological data (e.g. lithology, structural geology, oceanography), and geochemical data (e.g. from hydrothermal
fluid chemistry and diffuse degassing features). As a second step based on the presented database, spatial data analysis
has been performed using custom-programmed interfaces that execute query scripts resulting in a graphical
visualization of data. These query tools were designed and compiled following scenarios of known ‘‘behavior’’ patterns
of dormant volcanoes and first candidate signs of potential unrest. The spatial database and query approach is intended
to facilitate scientific research on volcanic processes and phenomena, and volcanic surveillance.
r 2005 Elsevier Ltd. All rights reserved.
Keywords: Spatial database; GIS; Volcanic hazards; Data modeling; Query tools
e front matter r 2005 Elsevier Ltd. All rights reserve
geo.2005.04.004
ing author. Tel.: +411 6333036;
053.
ess: [email protected] (R.C. Gogu).
1. Introduction
1.1. The ‘‘GEOWARN’’ project
The major aim of the European-funded project
GEOWARN was the development of a multimedia-
based geo-spatial warning system (a modular web-based
d.

ARTICLE IN PRESSR.C. Gogu et al. / Computers & Geosciences 32 (2006) 29–4130
Atlas Information System) which comprises graphical
and numerical geo-spatial data, visualizations, derived
satellite images (e.g. infrared thermal imaging), real time
monitoring of surface movements (interferometric ana-
lysis), seismic activity, heat and gas fluxes and chemical
changes in fumarolic gases and hydrothermal waters.
The software system consists of a set of customized
components that facilitate analysis and visualization of
this huge amount of data. Integration of these para-
meters in a geospatial database has led to development
of modeling techniques that are suitable to detect
dynamic processes such as reactivation of a quiescent
volcano and the occurrence of earthquakes related to
fluid pressure changes in magmatic-hydrothermal sys-
tems. Deep crustal seismic soundings have provided a
regional volcano-tectonic and structural model derived
by tomographic processing. All relevant data were set up
in a Geographical Information System (GIS).
As is typical for volcanological research, the different
data sets have various spatial resolutions and are often
collected in diverse time periods. In our database,
however, they are unified in a common, four-dimen-
sional data representation in space and time. Despite
large differences in data acquired by different methods,
groups, and instruments, and over varying time scales,
the data-sets nevertheless keep a good degree of
accuracy.
During the three and a half year project, the proposed
multiparametric approach has been applied to Nisyros
(Greece) and to Campi Flegrei (Solfatara volcano,
Italy). The volcanological and geochemical differences
between the two areas proved the transferability to other
active volcanic systems.
Fig. 1. Nisyros Island and Kos–N
1.2. The volcanic field of Kos–Yali–Nisyros–Tilos
The volcanic field of Kos–Yali–Nisyros–Tilos is
situated in the Eastern Aegean Sea, part of the
Dodecanese archipelago near the Turkish coast
(Fig. 1). It belongs to the eastern limb of the Quaternary
South Aegean volcanic arc, spanning from Nisyros/Kos
via Santorini, Milos, into the Saronic Gulf (Aegina,
Poros, Methana, Crommyonia). Magmatic activity in
the current arc started about 10MA as a result of
northeastward-directed subduction of the African plate
underneath the Eurasian Aegean continental microplate.
The volcanic field of Kos–Nisyros constitutes the largest
volume of volcanic products in the Aegean Arc.
The unique situation of Nisyros island as a test site
can be based on the complexity of the volcanic and
related hazards and the increasing impact of tourism on
the island. The Nisyros volcano and its hydrothermal
craters are visited daily by hundreds of tourists (Fig. 2).
Although the last magmatic eruption on Nisyros dates
back at least 15,000 years, the present geodynamic
activity encompasses high seismic unrest and widespread
fumarolic activity. Violent earthquakes and steam blasts
accompanied the most recent hydrothermal eruptions in
1871–1873 and 1887, leaving large craters behind.
Mudflows and hydrothermal vapors rich in CO2 and
H2S were emitted from fracture zones that cut
the Nisyros caldera and extend north-northwest through
the vicinity of the village of Mandraki into the island
of Yali and toward Kos. In 1996 and 1997, seismic
activity started with earthquakes up to M 5.5 with
hypocenters down to 10 km depth, damaging 30 houses
in Mandraki.
isyros–Tilos volcanic area.

ARTICLE IN PRESS
Fig. 2. Stephanos crater, Nisyros caldera.
R.C. Gogu et al. / Computers & Geosciences 32 (2006) 29–41 31
Five different kinds of natural hazards are possible:
�
gas and steam hydrothermal eruptions within theNisyros crater field;
�
seismic activity due to the regional tectonic move-ments;
�
magmato-tectonic seismic activity related to mag-matic unrest in the crust;
�
a volcanic eruption;�
landslides and Tsunami hazards subsequent to earth-quakes, magmatic and volcanic activity.
2. The GEOWARN geo-spatial database concept
2.1. Data management
A well-organized database with accurate procedures
of data retrieval can provide the basis for reliable
interdisciplinary research in active volcanic environ-
ments. The purpose of developing a comprehensive
volcanic database concept was to integrate the main
data and information that volcanologists typically use
when investigating dormant volcanoes that may show
future unrest. The objectives for the final database were
(1) to provide an organized scheme for capturing,
storing, editing, and displaying geographically refer-
enced volcanological data and information, (2) to
process and analyze spatially distributed data, (3) to
support hazard and risk assessment, (4) to create various
thematic maps.
2.2. The geo-spatial database design
The GIS database developed in this study contains
large sets of volcanological data compilations, re-
grouped and structured following the Geodatabase
model (Zeiler, 1999), and based on the GEOWARN
researchers’ expertise on historical eruptive behavior of
dormant volcanoes.
The GEOWARN data types have been structured
accordingly and grouped into main information layers.
Different schemas of attribute data related to the
geographic representation (points, lines, polygons, raster
layers) were analyzed and optimized in order to meet the
following criteria:
�
Provision of a better representation of data toenhance optimal information retrieval and enable
designs of complex query and analysis scenarios;
�
Diminution of data redundancy;�
Establishment of a good platform for analysis andcorrelation for the highly heterogeneous data;
�
Support the data for the modular web-based atlasinformation system.
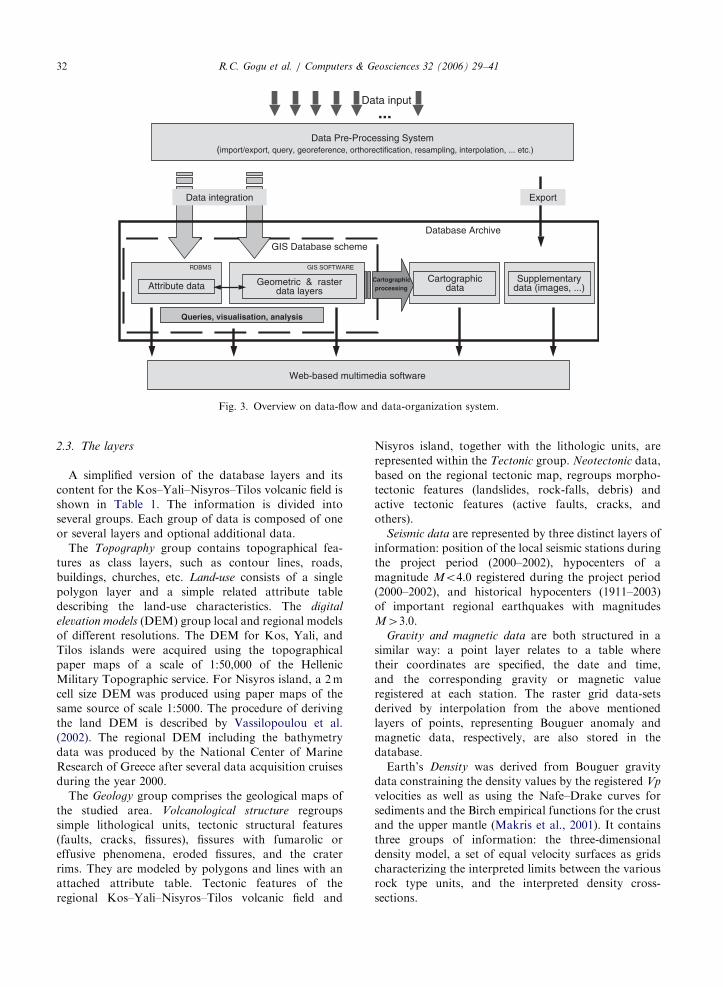
The general database archive composition is shown in
Fig. 3. Three main parts can be distinguished: attribute
data, geometric vector and raster data layers, and
cartographic data. These are complemented by supple-
mentary data consisting of descriptions, audiovisual
material, field orientation sketches, literature references,
links, and others.
ARTICLE IN PRESS
Data Pre-Processing System(import/export, query, georeference, orthorectification, resampling, interpolation, ... etc.)
...Data input
Supplementary data (images, ...)
Export Data integration
Attribute data
RDBMS
Geometric & raster data layers
GIS SOFTWARE
Cartographic data
GIS Database scheme
Cartographicprocessing
Queries, visualisation, analysis
Database Archive
Web-based multimedia software
Fig. 3. Overview on data-flow and data-organization system.
R.C. Gogu et al. / Computers & Geosciences 32 (2006) 29–4132
2.3. The layers
A simplified version of the database layers and its
content for the Kos–Yali–Nisyros–Tilos volcanic field is
shown in Table 1. The information is divided into
several groups. Each group of data is composed of one
or several layers and optional additional data.
The Topography group contains topographical fea-
tures as class layers, such as contour lines, roads,
buildings, churches, etc. Land-use consists of a single
polygon layer and a simple related attribute table
describing the land-use characteristics. The digital
elevation models (DEM) group local and regional models
of different resolutions. The DEM for Kos, Yali, and
Tilos islands were acquired using the topographical
paper maps of a scale of 1:50,000 of the Hellenic
Military Topographic service. For Nisyros island, a 2m
cell size DEM was produced using paper maps of the
same source of scale 1:5000. The procedure of deriving
the land DEM is described by Vassilopoulou et al.
(2002). The regional DEM including the bathymetry
data was produced by the National Center of Marine
Research of Greece after several data acquisition cruises
during the year 2000.
The Geology group comprises the geological maps of
the studied area. Volcanological structure regroups
simple lithological units, tectonic structural features
(faults, cracks, fissures), fissures with fumarolic or
effusive phenomena, eroded fissures, and the crater
rims. They are modeled by polygons and lines with an
attached attribute table. Tectonic features of the
regional Kos–Yali–Nisyros–Tilos volcanic field and
Nisyros island, together with the lithologic units, are
represented within the Tectonic group. Neotectonic data,
based on the regional tectonic map, regroups morpho-
tectonic features (landslides, rock-falls, debris) and
active tectonic features (active faults, cracks, and
others).
Seismic data are represented by three distinct layers of
information: position of the local seismic stations during
the project period (2000–2002), hypocenters of a
magnitude Mo4.0 registered during the project period
(2000–2002), and historical hypocenters (1911–2003)
of important regional earthquakes with magnitudes
M43:0.Gravity and magnetic data are both structured in a
similar way: a point layer relates to a table where
their coordinates are specified, the date and time,
and the corresponding gravity or magnetic value
registered at each station. The raster grid data-sets
derived by interpolation from the above mentioned
layers of points, representing Bouguer anomaly and
magnetic data, respectively, are also stored in the
database.
Earth’s Density was derived from Bouguer gravity
data constraining the density values by the registered Vp
velocities as well as using the Nafe–Drake curves for
sediments and the Birch empirical functions for the crust
and the upper mantle (Makris et al., 2001). It contains
three groups of information: the three-dimensional
density model, a set of equal velocity surfaces as grids
characterizing the interpreted limits between the various
rock type units, and the interpreted density cross-
sections.

ARTICLE IN PRESS
Table 1
Simplified version of database schema content for Nisyros–Kos–Tilos (Greece) volcanic area (main layers)
Group of data Characteristics represented Details
1 Topography Topographical map
2 Land-use The land-use map
3 Digital elevation
models
Digital elevation models—regional and local
4 Geology (Geology &
Volcanology)
Geological maps of the areas of interest
Sea floor geological map
Geological cross-sections
5 Volcanological
structure
Fumarolic fissures, flow structure features, crater rims
6 Tectonic Lithologic units, tectonic features
7 Neotectonic Morphotectonic features (landslides, rock-falls, debris), active tectonic features
(active fault, cracks, y)
8 Seismic Position of seismic stations
Regional hypocenters of Mo4.0 (link to seismic stations)
Historical hypocentres MX4:0
9 Gravity Location of the gravimetric stations+measurement points on land and sea
Grid of interpolated gravity
10 Density Three-dimensional voxel density cube—not in GIS (model output) ASCII file
Surfaces, delineating the rock types (equal velocity values) interpolated from the
model output
Cross-sections of density model
11 Magnetic Location of the magnetic stations+measurement points on land and sea
Grid of interpolated magnetic values
12 Velocity model Cross-sections of velocity model
13 Tomography Three-dimensional voxel tomography cube—not in GIS (model output) ASCII file
Surfaces, delineating rock types (equal velocity values)
Cross-sections of tomographic model
14 Technological data Ship tracks, shooting points, active seismic stations (land, sea)
15 Degassing process CO2 flux, heat flux, soil temperature—measured and processed
16 Geochemistry Geochemical measurement points (geothermal wells, springs, gas emissions, y)
17 GPS Location of the GPS stations—link to measured and computed displacements
18 Thermal Ground temperatures—points (used in thermal images calibration)
LANDSAT and ASTER thermal images and surface temperature differences derived
from LANDSAT
19 Interferometric Interferograms ERDAS
raster dataset
20 Satellite image Satellite image—orthorectified IKONOS—
1m resolution
21 Weather Weather parameters measurements
Geometric features and attribute table.
Point features and attribute scheme.
Point features and attribute table.
Line features and images for each cross-section.
Line features and attribute table.
Grids (raster data)—various resolutions.
Geometric features and attribute scheme.
R.C. Gogu et al. / Computers & Geosciences 32 (2006) 29–41 33
The seismic Velocity model is represented by various
cross-sections (images) linked to a layer of lines that
follow the surface trace directions of the cross-sections.
The tomographic data is represented within the group of
layers called Tomography. Even though it is not directly
accessed by the GIS software, the derived tomographic
three-dimensional model cube is also a part of the
database. Surfaces of equal velocity (horizontal and

ARTICLE IN PRESSR.C. Gogu et al. / Computers & Geosciences 32 (2006) 29–4134
vertical cross-sections) can automatically be derived as a
set of grids, for instance, representing the interpreted
limits between the various geological units (e.g. soft
sediments, magmatic rocks, etc.). Interpreted tomo-
graphic cross-sections are also represented as images,
linked to a layer of surface traces.
Technological data includes the seismic station loca-
tions on land and on the seafloor (ocean bottom
seismographs), as well as the shooting points and ship
tracks for the active seismicity experiments. This group
provides information about the geophysical campaigns
performed within the Kos–Yali–Nisyros–Tilos volcanic
field in 1997 and 2000 as part of the GEOWARN
project.
Degassing process refers to data resulting from the
study of diffuse degassing at the southern Lakki plain
(within the Nisyros caldera), and Stephanos hydother-
mal crater in particular. The main goals of the study of
diffuse degassing processes in hydrothermal areas are
both the mapping of the process and the computation of
the amounts of gas and energy released. The diffuse
degassing measurements at Stephanos crater were
performed during several field campaigns between 1997
and 2003. Each campaign consisted of the direct
measurement of CO2 flux by the accumulation chamber
method (Chiodini et al., 1998), heat flux (conducting
plate method (Geowarn, 2003)), and soil temperature in
about 80–100 temporary measuring stations regularly
arranged in a rectangular grid of 20m cell width.
Systematic CO2 flux and soil temperature measurements
covering the southern Lakki plain were performed
during 1997–2003. About 2900 measuring sites consis-
tently covered the area. A Sequential Gaussian simula-
tion was applied to soil flux data (gas and heat) and soil
temperature data, respectively (Brombach et al., 2001).
Modeling the degassing process affecting the Lakki
plain was performed in order to derive a detailed
map of CO2 soil degassing of this area. The resulting
grid was integrated into the spatial database. At
Stephanos crater, several grids were derived, each of
them corresponding to one measurement campaign
(nine campaigns during 1997–2003).
Geochemistry is a group of layers representing almost
all point features with time-dependent geochemical
information: fumaroles, springs, geothermal wells, and
wells. Each type of feature has its layer, and the point
features are linked to an attribute scheme. The attribute
scheme of each entity differs slightly from each other. In
Fig. 4, the scheme for geothermal springs is shown as an
example. Geothermal springs is the main table where the
scheme is linked to the geographical location of the
point in the GIS software. The relationships ‘‘one to
one’’ and ‘‘one to many’’ between the Geothermal springs
table and the connected tables are defined using the
same indicator. As shown in Fig. 4, the table Geothermal
springs contains information concerning the geographi-
cal position (coordinates), type of represented entity,
name (or official names), system of codes (used by
several experts in order to identify the entity), altitude,
locality (description in words), and remarks. The local
geology of a geochemical sampling site is described
within the Geology table. Note that rock chemistry is not
included in the Geochemistry group since it contains
data of static nature with respect to time scales of the
monitoring activities and is therefore included in the
Geology table. The Sample table is designated for
registering individual water or gas samples. The Para-
meters table contains time-dependent data series for
various physical parameters (temperature, pH, and
others) and chemical composition parameters (including
isotope data). The number of geochemical parameters is
relatively large compared to the physical ones due to
their extensive analytical data, although the number of
entries (samples) is smaller. Among the geochemical
parameters, gaseous samples and aqueous samples differ
slightly in terms of their list of parameters; similarly,
well parameters differ slightly from spring parameters.
GPS represents geodetic measurements using Global
Positioning System with horizontal (X, Y) and altitude
(Z) data. The main reference layer of points is made up
of GPS station locations from the first establishment of
the network (June 1997). Two tables are related to
this table, both following a ‘‘one to many’’ relationship.
The first one contains horizontal (X, Y) and altitude
measurements at various campaign dates, and the
second table contains horizontal, azimuthal and vertical
displacements between different campaigns. Related
estimates of horizontal and vertical standard deviations
of each set of values are attached as well.
The Thermal group contains three sets of raster grids
representing the thermal images acquired by the LAND-
SAT satellite system, the grids of surface temperature
differences between the satellite passes (derived from
LANDSAT 7 ETM), and the thermal images recorded
by the ASTER satellite system. Both sets of thermal
grids (LANDSAT and ASTER) were acquired at
different dates (day and night time), orthorectified, and
corrected for atmospheric influences. In addition, all
satellite thermal images were corrected by measuring
soil temperatures at specific points and various depths
(2, 4, 7, and 10 cm) at the time of the satellite overpass.
The images resulting from the application of inter-
ferometric synthetic aperture radar (InSAR) are part of
the Interferometric group. This technique was applied to
study the regional deformation of the island in conjunc-
tion with GPS measurements and morphological correc-
tions using the orthorectified DEM. Two interferograms
of Nisyros island are currently in the database. They
cover the 1996–1999 and the 1999–2000 time periods.
The satellite image layer contains a satellite image of
Nisyros island with 1m resolution. The image taken by
the IKONOS satellite was orthorectified using the before

ARTICLE IN PRESS
DICTIONARY OF PARAMETERS
Physical parameters:
- Temperature (C˚) - Conductivity (µS/cm) - pH - salinity (%) - alkalinity- TDS (total dissolved salts) (mg/l)
Chemical parameters: - Ca - Mg - Na - K - Cl - F - SiO2- NO3- SO4- H2O - CO2- SO2- HCl - HF - CH4- CO - H2S - H2- N2- NH3- Ar- O2- He
Isotopes:
- D (H2O) - dDH2O - H (H2O) - 3He - 4He - 20Ne - 22Ne - He/Ne - 18O (H2O) - d18OH2O - 16O (H2O) - 18O (CO2) - d18OCO2 - 16O (CO2) - 13C (CO2) - d13CCO2 - 12C (CO2) - 13C (CH4) - 12C (CH4) - 34S (H2S) - d34S - 32S (H2S)
SAMPLES
Number ID Sample Code Ref.obs.network Sampling date Sampling year Method D Flow rate (m3/s) Water treatment D Air temperature (C˚) Air pressure (mbar) Remarks
PARAMETERS
ID Sample
Parameter (ID-Param) D Measured value (units to be specified in Metadata files) Date (mm/dd/yy) Laboratory (ID-Labo or Field) Analyze method D Detection limit Remarks
1
GEOLOGY
Number Lithology (description) Top (m) Base (m) Member Formation, Level, Series, System, Era codes Sample (Y/N) Interpretation Bibliographic reference Remarks
SPRINGS (Point)
Number Type Identification codes Island (name of the island) X (WGS/UTM co-ordinates) Y (WGS/UTM co-ordinates) Z-Sol Contact person Address (in case of wells ..) Localisation (in words) Remarks
1
FLOWRATE
Number Date Value (m3/s) Remarks
m
m
m
m
Fig. 4. Simplified version of attribute data schema for Geothermal springs.
R.C. Gogu et al. / Computers & Geosciences 32 (2006) 29–41 35
mentioned 2m cell size DEM. The entire orthorectifica-
tion procedure has been described in Vassilopoulou
et al. (2002).
Meteorological data are embodied within the Weather
group. The only deployed weather station, represented
as a point, is linked to tables where time-dependent
data is registered. The collected weather parameters
are air temperature, humidity, atmospheric pressure,
wind speed, and a brief weather description. The
acquired data cover the GEOWARN project duration
(2000–2003).
2.4. Technical aspects: data types, coordinates, metadata,
and software
After the database schema has been developed and its
layers have been defined, it has to be optimized. A
thorough analysis of the existing, expected and incoming
data types and formats, as well as data quantity and
quality, is an important consideration to ensure an
optimal data representation in a volcanological data-
base.
To compare and correlate spatial data-sets, the entire
set of data for a particular volcanic field must use a
single coordinate system. In the case of the ‘‘GEO-
WARN early warning system’’, the national Hellenic
reference system (HGRS 87) was used for the pilot site
in Greece.
One concern in the database design was the inevitable
simplification of data-sets. This is necessary in order to
achieve maximum information retrieval, while attempting
not to lose data resolution or precision. The inclusion of
error estimations for some time-series data was thus
necessary to allow for the distinction between artifacts,
noise, and ‘‘real’’ deviations from background data trends
that may represent a change in subsurface processes.
A useful method for metadata generation is to follow
widely accepted standards. For the described data-sets,
we adopted the US Federal Geographic Committee’s
Content Standard for Digital Geospatial Metadata
(FGDC). The chosen GIS software offers tools to

ARTICLE IN PRESSR.C. Gogu et al. / Computers & Geosciences 32 (2006) 29–4136
comfortably handle metadata using this standard. This
standard was customized according to the individual
projects needs and requirements.
As a software solution, ArcGIS-Arc/InfoTM 8.1.
(Zeiler, 1999) embedding MS AccessTM (Microsoft)
was considered satisfactory for expert-level GIS
operability of the database. The database itself can
easily be transferred to other database systems (e.g.
OracleTM). MS Access was chosen simply for its wide
distribution and low cost. It soon appeared necessary to
combine the main GIS package (GIS expert software
and the access—Relational Database Management
System) with complementary software and to develop
new data exchange interfaces (Hurni et al., 2004).
This arises from the broad requirements of general
user skills, uses, and needs encountered in volcano
observatories.
3. Examples of visualization, and spatial analysis
Spatial analysis is feasible once the database is
established. The needs and knowledge of volcano
monitoring activities define the types of query, visualiza-
tion and data analysis tools required. Much of this
depends on the monitoring tasks and technical capabil-
ities of volcano observatories. However, personnel,
access, usage and knowledge base to design, program,
customize and operate query strategies and tools on
large relational databases in an GIS environment is to
date still a rare occurrence. GIS technology is still used
mainly to generate maps.
Fig. 5. Visual correlation between calculated hypocenters and inter
tomographic model.
3.1. Crustal structure and tomography
In the GEOWARN project, scientific query interfaces
were designed and implemented following different
query scenarios. These query scenarios are currently
used for deductions from the data sets and for the
purpose of visualization. For example, various analyses
of the DEM, of seismic data represented by the locations
of the hypocenters, and of the three-dimensional
tomography were done using the ArcSceneTM module
(ArcGISTM software package). As a result, the relation
between the calculated hypocenters and the tomographic
model of the underground has been generated (Fig. 5). It
gives an overview of the greater Yali–Nisyros volcanic
field represented by the DEM (view to north, Kos island
in the background), the subsurface crustal structure (iso-
velocity surfaces of unconsolidated volcanoclastic sedi-
ments, the deeper metamorphic rock formations, and
magmatic intrusive bodies), and the earthquake hypo-
centers registered during 2001 with a magnitude o4.
Clearly, both the tomographic results and the earth-
quake hypocenters testify geodynamic activity concen-
trated underneath Nisyros island.
Similar query interfaces allowing for data manipula-
tion, analysis and visualization are
�
pre
earthquake hypocenter queries in time and space
(3.2),
�
a grid analysis tool for diffuse soil degassing and heatflux data (3.3),
�
and query interfaces for analyzing geochemical data(3.4).
ted limits between various geological strata resulting from
ARTICLE IN PRESSR.C. Gogu et al. / Computers & Geosciences 32 (2006) 29–41 37
3.2. Earthquake hypocenters in time and space
A tool was developed for queries of earthquake
hypocenters in time and space. Used in the ArcSceneTM
module, it allows temporal and spatial (x, y, and depth)
dependent queries on point features. The tool is
specifically designed to assist the analysis of earthquake
hypocenters. However, it also allows 3D time-dependent
animations. The script operates in the background by
sequentially selecting and then displaying the points
using a customizable time-step (day, hour).
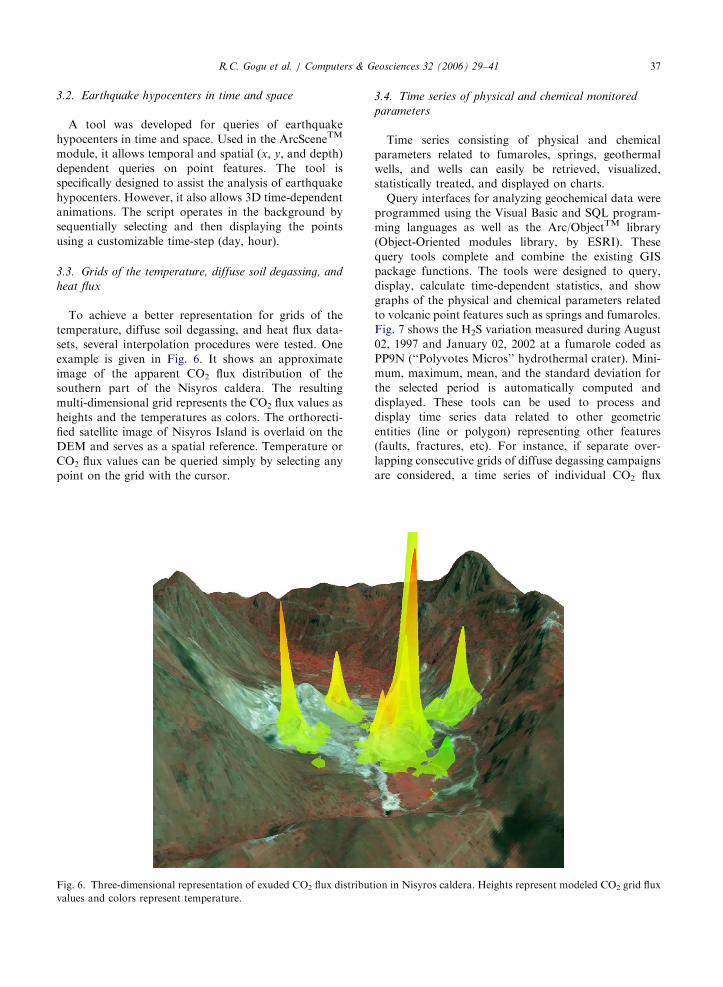
3.3. Grids of the temperature, diffuse soil degassing, and
heat flux
To achieve a better representation for grids of the
temperature, diffuse soil degassing, and heat flux data-
sets, several interpolation procedures were tested. One
example is given in Fig. 6. It shows an approximate
image of the apparent CO2 flux distribution of the
southern part of the Nisyros caldera. The resulting
multi-dimensional grid represents the CO2 flux values as
heights and the temperatures as colors. The orthorecti-
fied satellite image of Nisyros Island is overlaid on the
DEM and serves as a spatial reference. Temperature or
CO2 flux values can be queried simply by selecting any
point on the grid with the cursor.
Fig. 6. Three-dimensional representation of exuded CO2 flux distribut
values and colors represent temperature.
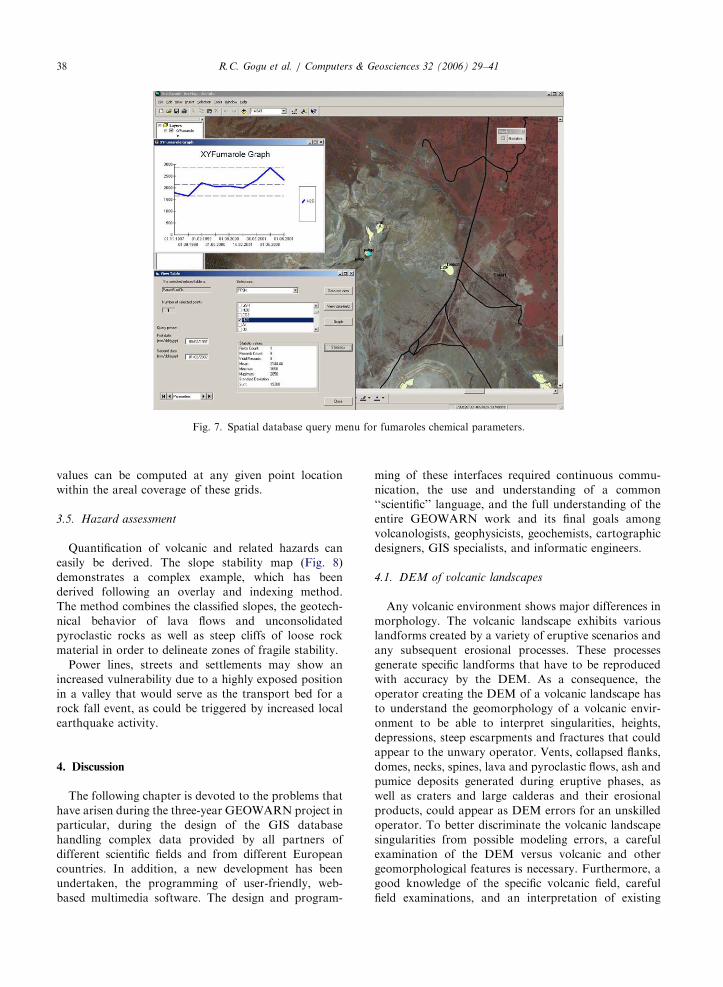
3.4. Time series of physical and chemical monitored
parameters
Time series consisting of physical and chemical
parameters related to fumaroles, springs, geothermal
wells, and wells can easily be retrieved, visualized,
statistically treated, and displayed on charts.
Query interfaces for analyzing geochemical data were
programmed using the Visual Basic and SQL program-
ming languages as well as the Arc/ObjectTM library
(Object-Oriented modules library, by ESRI). These
query tools complete and combine the existing GIS
package functions. The tools were designed to query,
display, calculate time-dependent statistics, and show
graphs of the physical and chemical parameters related
to volcanic point features such as springs and fumaroles.
Fig. 7 shows the H2S variation measured during August
02, 1997 and January 02, 2002 at a fumarole coded as
PP9N (‘‘Polyvotes Micros’’ hydrothermal crater). Mini-
mum, maximum, mean, and the standard deviation for
the selected period is automatically computed and
displayed. These tools can be used to process and
display time series data related to other geometric
entities (line or polygon) representing other features
(faults, fractures, etc). For instance, if separate over-
lapping consecutive grids of diffuse degassing campaigns
are considered, a time series of individual CO2 flux
ion in Nisyros caldera. Heights represent modeled CO2 grid flux
ARTICLE IN PRESS
Fig. 7. Spatial database query menu for fumaroles chemical parameters.
R.C. Gogu et al. / Computers & Geosciences 32 (2006) 29–4138
values can be computed at any given point location
within the areal coverage of these grids.
3.5. Hazard assessment
Quantification of volcanic and related hazards can
easily be derived. The slope stability map (Fig. 8)
demonstrates a complex example, which has been
derived following an overlay and indexing method.
The method combines the classified slopes, the geotech-
nical behavior of lava flows and unconsolidated
pyroclastic rocks as well as steep cliffs of loose rock
material in order to delineate zones of fragile stability.
Power lines, streets and settlements may show an
increased vulnerability due to a highly exposed position
in a valley that would serve as the transport bed for a
rock fall event, as could be triggered by increased local
earthquake activity.
4. Discussion
The following chapter is devoted to the problems that
have arisen during the three-year GEOWARN project in
particular, during the design of the GIS database
handling complex data provided by all partners of
different scientific fields and from different European
countries. In addition, a new development has been
undertaken, the programming of user-friendly, web-
based multimedia software. The design and program-
ming of these interfaces required continuous commu-
nication, the use and understanding of a common
‘‘scientific’’ language, and the full understanding of the
entire GEOWARN work and its final goals among
volcanologists, geophysicists, geochemists, cartographic
designers, GIS specialists, and informatic engineers.
4.1. DEM of volcanic landscapes
Any volcanic environment shows major differences in
morphology. The volcanic landscape exhibits various
landforms created by a variety of eruptive scenarios and
any subsequent erosional processes. These processes
generate specific landforms that have to be reproduced
with accuracy by the DEM. As a consequence, the
operator creating the DEM of a volcanic landscape has
to understand the geomorphology of a volcanic envir-
onment to be able to interpret singularities, heights,
depressions, steep escarpments and fractures that could
appear to the unwary operator. Vents, collapsed flanks,
domes, necks, spines, lava and pyroclastic flows, ash and
pumice deposits generated during eruptive phases, as
well as craters and large calderas and their erosional
products, could appear as DEM errors for an unskilled
operator. To better discriminate the volcanic landscape
singularities from possible modeling errors, a careful
examination of the DEM versus volcanic and other
geomorphological features is necessary. Furthermore, a
good knowledge of the specific volcanic field, careful
field examinations, and an interpretation of existing

ARTICLE IN PRESS
Fig. 8. Slope stability map of Nisyros island derived by performing an overlay and index method on spatial database (as a
combination of GIS based functions).
R.C. Gogu et al. / Computers & Geosciences 32 (2006) 29–41 39
geological maps are essential prior to the creation of a
DEM.
4.2. Data modeling
A data model represents a methodical approach to
classify information and their relationships. A geo-
graphic data model represents the real GIS world in
order to create maps, perform queries, and support
analysis. It is the basis for modeling the system behavior
describing how the various features of the landscape
interact with each other.
Within the GEOWARN project, it was necessary to
generate an appropriate way to explain data-modeling
issues to all scientific experts. Because of the myriad of
volcanological, geophysical, geodetic, and geochemical
monitoring procedures, this task helped in finding a
proper common language necessary for optimizing the
data representation.
Finding an optimal spatial and temporal database
representation for various phenomena is essential. The
solution to this task is not obvious, when dealing with
complex features like volcanic fumaroles or thermal
springs. Fumaroles, vents from which volcanic gases
(like sulfur vapor) escape, can occur along small cracks
or long fissures. At the land surface, they show a
frequent displacement in time, because soil fills some of
the vents while others open at the same time. Scientists
are sampling the fumaroles belonging to the same field
but coding differently various superficial soil holes.
Following their experience, they will identify easily the
samples belonging to the corresponding location.
Representing this within a spatial database needs a
clear understanding of the phenomena and of the field,
as well as the sampling procedures and measured
parameters of various research teams.
4.3. Visualization of seismic data and test tomographic
models
Data visualization allows surveying data quality and
avoids unfitting between data delivery and database
capture. To recognize data errors, data visualization has
to include time and spatial data query facilities. For data
related to the location of hypocenters of earthquakes, a
three-dimensional visualization within the GIS package
ARTICLE IN PRESSR.C. Gogu et al. / Computers & Geosciences 32 (2006) 29–4140
(ArcScene) offered a good understanding of the seismic
phenomena and avoided in several cases, error propaga-
tion. The visualization procedure enabled the three-
dimensional hypocentres to be observed from various
angles, simultaneously with the geology, tomography,
gravity, and magnetic models.
5. Conclusions
The GEOWARN GIS database offers capabilities for
data modeling as well as for other volcanic studies, such
as
�
Data verification and validation, essential for accurateand precise data representation. Using an advanced
database supported by GIS, these operations can be
done in a simple way. For example, anomalies in
chemical time-series data for fumaroles, springs, and
geothermal wells can be inspected on graphs as a
result of a query.
�
Automatic data treatment is required before input toany process-based model and for data to be stored
from continuous data streams. Because of the huge
amount of work required to prepare the data used by
various modeling procedures, a GIS-supported data-
base is absolutely essential.
�
Maps of various parameters can be generated. Paperand screen maps, as well as other graphical spatial
screen representations (e.g. four-dimensional-anima-
tions of data correlations) can be created starting
from existing point data using statistical procedures
(including geostatistics) supported by the GIS soft-
ware. Anomalies indicating unrest in volcanic beha-
vior can be detected using these maps.
�
Correlations among parameters can be detected anddisplayed using programmed interfaces or already
existing GIS software procedures. For instance,
geochemical parameters, lithology, morphotectonic
features, and hypocenters distribution can be com-
pared.
�
Using the entire set of spatial data and having thedescribed tools available ‘‘at a mouse click’’, the user
is able to have a complete view of the entire data-set.
The database described in this paper is an integral
part of the GEOWARN project, a pilot study of
geospatial data management of dormant volcanoes. It
still has certain limitations, which were considered in the
previous sections. Changes, updates, or further devel-
opments of the schema are expected to be incorporated
in the future. Furthermore, experts using only a
Relational Database Management System (RDBMS)
in the absence of a GIS tool can handle the attribute
data.
Starting from this schema, new developments have
been undertaken. One of them consists of web-based
cartographic multimedia software having GIS tools,
designed for spatio-temporal volcanological data analy-
sis (interactive maps, stations, and time-dependent data-
series; Hurni et al., 2004). This ‘‘GEOWARN software’’
accesses the described database.
6. Outlook
A comprehensive geo-spatial database concept for
data management of dormant volcanoes is still lacking
in the daily operations in many observatories. Such a
concept should be the very basis for any analysis and
visualization efforts that help observatory scientists to
extract the most out of their data in times of crisis, and
for scientific work for the purpose of expanding the
body of scientific process knowledge. Efforts are
currently under way by IAVCEI to accelerate the
process of implementing such improvements in indivi-
dual observatories (the ‘‘bottom-up’’ approach) by
creating a world-wide standard for a database structure
of volcanic unrest (Venezky et al., 2002).
The volcanological geo-spatial database presented
here gives volcanologists a modern and versatile
research tool. Query, visualization, and analysis tools
such as the ones presented here are useful for other
observatories. Furthermore, observatories facing a
volcanic crisis can easily store, share, visualize, correlate,
and analyze various sets of monitoring data in space and
time. GEOWARN represents an important step toward
more efficient integrated monitoring and hazard assess-
ment procedures for potentially active volcanoes.
Acknowledgments
The database design is the result of the input,
discussions and corrections by the GEOWARN con-
sortium (www.geowarn.org).
The work was supported by the Information Society
Technologies (IST) initiative within the European Commu-
nity 5th Framework Programme in the scope of the project
‘‘GEOWARN, Geo-spatial warning systems, Nisyros
volcano (Greece)’’, IST project number 1999-12310, as well
as by the Swiss Federal Office for Education and Science.
Particular thanks are given to Chris Newhall, US
Geological Survey and to Don Swanson, US Geological
Survey’s Hawaiian Volcano Observatory for their help-
ful technical reviews.
References
Brombach, T., Hunziker, J.C., Chiodini, G., Cardellini, C.,
2001. Soil diffuse degassing and thermal energy fluxes from
ARTICLE IN PRESSR.C. Gogu et al. / Computers & Geosciences 32 (2006) 29–41 41
the southern Lakki plain, Nisyros (Greece). Geophysical
Research Letters 28, 69–72.
Chiodini, G., Cioni, R., Guidi, M., Raco, B., Marini, L., 1998.
Soil CO2 flux measurements in volcanic and geothermal
areas. Applied Geochemistry 13, 543–552.
GEOWARN consortium, 2003. GEOWARN, Geo-spatial
Warning System—Synthesis Report. Athens (Greece) and
Zurich (Switzerland), 57pp. (http://www.geowarn.ethz.ch).
Hurni, L., Jenny, B., Terribilini, A., Freimark, H., Schwandner,
F.M., Gogu, R.C., Dietrich, V.J., 2004. GEOWARN: ein
Internet-basiertes multimedia-atlas-informationssystem fur
vulkanologische anwendungen. Kartographische Nachrich-
ten 54 (2), 67–72.
Makris, J., Papoulia, J., Papanikolaou, D., Stavrakakis, G.,
2001. Thinned continental crust below northern Evoikos
Gulf, central Greece, detected from deep seismic soundings.
Tectonophysics 341, 225–236.
Vassilopoulou, S., Hurni, L., Dietrich, V., Baltsavias, E.,
Pateraki, M., Lagios, E., Parcharidis, I., 2002. Orthophoto
generation using IKONOS imagery and high-resolution
DEM: a case study on volcanic hazard monitoring of
Nisyros Island (Greece). ISPRS Journal of Photogrammetry
& Remote Sensing 57, 24–38.
Venezky, D.Y., Malone, S.D., Newhall, C.G., 2002. WOVOdat:
a new tool for managing and accessing data of worldwide
volcanic unrest. EOS Transactions on AGU (Fall Meeting
Supplementary) 83 (47), F1501 (abstract V22C-08).
Zeiler, M., 1999. Modeling Our World—The ESRI Guide to
Geodatabase Design. Environmental Systems Research
Institute, Redlands, CA 195pp.