A Gendered Assessment of Highly Skilled...
26
POPULATION AND DEVELOPMENT REVIEW 35(2): 297–321 (JUNE 2009) 297 A Gendered Assessment of Highly Skilled Emigration FRÉDÉRIC DOCQUIER B. LINDSAY LOWELL ABDESLAM MARFOUK INTERNATIONAL MIGRATION IS a diverse phenomenon whose effects on source and destination countries continue to attract the attention of policymakers, scholars, and international agencies. Understanding and measuring the con- sequences for migrants, host-country residents, and those who remain behind is a demanding task. In particular, the impact of highly skilled migration on sending countries arises from a combination of direct and feedback effects that are difficult to quantify. Lacking comparable data, the literature on the consequences of highly skilled emigration has, until recently, remained es- sentially theoretical. 1 New data sets have now been developed permitting assessment of the magnitude of international migration of the highly skilled. Docquier and Marfouk (2006) (henceforth DM06) provided estimates of emigration stocks and rates by educational attainment for 195 source coun- tries in 2000 and 174 countries in 1990. This data set gave rise to a couple of variants (see Defoort 2008; Beine et al. 2007; Docquier and Bhargava 2006) and to a number of empirical studies on the determinants and consequences of highly skilled emigration. 2 One important extension that has received little attention in the lit- erature concerns the gender dimension of international migration. While a considerable literature has focused on male migration, less research has addressed female migration. 3 Women have long been viewed as dependents, moving as wives, mothers, or daughters of male migrants. This is ironic since the share of women in international migration has increased over the last several decades. According to the United Nations Population Division, women made up 46.8 percent of the stock of international migrants in 1960 and 49.6 percent in 2005 (see http://esa.un.org/migration). Today, women exceed men in migration flows to developed regions (their share in flows in- creased from 48.9 to 52.2 percent over the same period). 4 Fueling this trend PDR 35.2 Docquier-EPC-Xsp.indd 297 5/27/09 9:12:01 AM
Transcript of A Gendered Assessment of Highly Skilled...

POPULATION AND DEVELOPMENT REVIEW 35(2 ) : 297–321 ( JUNE 2009) 297
A Gendered Assessment of Highly Skilled Emigration
FRÉDÉRIC DOCQUIER
B. LINDSAY LOWELL
ABDESLAM MARFOUK
INTERNATIONAL MIGRATION IS a diverse phenomenon whose effects on source and destination countries continue to attract the attention of policymakers, scholars, and international agencies. Understanding and measuring the con-sequences for migrants, host-country residents, and those who remain behind is a demanding task. In particular, the impact of highly skilled migration on sending countries arises from a combination of direct and feedback effects that are difficult to quantify. Lacking comparable data, the literature on the consequences of highly skilled emigration has, until recently, remained es-sentially theoretical.1 New data sets have now been developed permitting assessment of the magnitude of international migration of the highly skilled. Docquier and Marfouk (2006) (henceforth DM06) provided estimates of emigration stocks and rates by educational attainment for 195 source coun-tries in 2000 and 174 countries in 1990. This data set gave rise to a couple of variants (see Defoort 2008; Beine et al. 2007; Docquier and Bhargava 2006) and to a number of empirical studies on the determinants and consequences of highly skilled emigration.2
One important extension that has received little attention in the lit-erature concerns the gender dimension of international migration. While a considerable literature has focused on male migration, less research has addressed female migration.3 Women have long been viewed as dependents, moving as wives, mothers, or daughters of male migrants. This is ironic since the share of women in international migration has increased over the last several decades. According to the United Nations Population Division, women made up 46.8 percent of the stock of international migrants in 1960 and 49.6 percent in 2005 (see http://esa.un.org/migration). Today, women exceed men in migration flows to developed regions (their share in flows in-creased from 48.9 to 52.2 percent over the same period).4 Fueling this trend
PDR 35.2 Docquier-EPC-Xsp.indd 297 5/27/09 9:12:01 AM

298 A G E N D E R E D A S S E S S M E N T O F H I G H L Y S K I L L E D E M I G R A T I O N
are such factors as the rise in women’s educational attainment, the increased demand for women’s labor in health care and the service sectors at large, and changes in attitudes toward female migration in many source countries. In 2004, 26.8 percent of women who received US employment-based visas were principal visa holders, while 34.7 percent of men who received such visas were dependents. Although family reunion programs admit many women in destination countries, women cannot be considered as solely companion migrants (Pearce 2006).
The increasing participation of women in international migration raises economic issues related to the gendered determinants and consequences of migration. The emigration of educated women is likely to affect sending countries in particular ways:
—First, a recent study by Beine et al. (2008) analyzes the impact of skilled emigration on human capital formation in developing countries. It shows that countries of origin may experience a “beneficial brain drain” or “brain gain” at low rates of emigration, because of the positive effect of skilled migration prospects on the return to human capital. When the emigration rate exceeds a threshold estimated at 20 percent, the origin country experiences a net loss of human capital.The net loss increases exponentially with the skilled emigration rate. And, since women in developing countries still face unequal access to tertiary education and highly skilled jobs, the emigration of educated women is likely to generate higher relative losses of human capital than the emigration of skilled males. Many studies report that women’s human capital is an even scarcer resource than men’s. Our estimates based on Barro and Lee’s human capital indicators (2001) reveal that the percentage of women aged 25+ worldwide with some post-secondary education rose from 7.3 to 9.8 percent between 1990 and 2000, while the percentage of men at comparable levels rose from 10.9 to 12.5. The portion of women aged 25+ with completed secondary education rose from 31.6 to 34.7 percent during the same period, while the portion of men rose from 45.4 to 46.8 percent. Although the gen-der gap decreased over time, women still lag far behind men. In addition, convergence of the sexes by these criteria is mainly evident in high-income countries, where recent generations of women are educated as highly as or more highly than young men. In contrast, in low-income countries in 2000, only 2.4 percent of women had post-secondary education, against 5.5 percent for men and the convergence is slow.
—Second, the links between women’s migration and human capital ac-cumulation are particularly critical for developing countries since women’s level of schooling is usually considered a fundamental ingredient for growth. Many studies demonstrate that women’s education is positively associated with investments in children’s education and thus has pronounced effects on the human capital of future generations (see World Bank 2007). Better-educated mothers are superior teachers in the home, as demonstrated by Behrman et al. (1999) for India. Hence, for a given investment in children,
PDR 35.2 Docquier-EPC-Xsp.indd 298 5/27/09 9:12:01 AM
F R É D É R I C D O C Q U I E R / B . L I N D S A Y L O W E L L / A B D E S L A M M A R F O U K 299
better-educated mothers raise children with higher levels of human capital (Haveman and Wolfe 1995; Summers 1992). One can also argue that educated women contribute more income to the household, which leads to greater investment in child schooling and lower fertility rates (see among others Basu 2002). Another argument is that mothers with high levels of education have greater command of resources within the household (higher bargaining power), which they choose to allocate to children at higher levels than do men (see Quisumbing 2003). Unsurprisingly, at the aggregate level, many studies have emphasized the role of female education in raising labor productivity and economic growth, suggesting that gender gaps in education are an impediment to economic development. (For examples, see Knowles et al. 2002, who use Barro and Lee’s human capital indicators; and Coulombe and Tremblay 2006, who rely on the International Adult Literacy Survey to create a standardized indicator of human capital.) These studies suggest that investment in women’s human capital is crucial in countries where the gender gap in education is high.5 Societies that fail to invest adequately in girls or that lose a high propor-tion of educated women through emigration may experience slower growth and reduced income. Alternatively, societies that experience a “brain gain” linked to emigration prospects could experience higher growth.
—Third, regarding the determinants of migration, some scholars argue that women and men do not respond to push and pull factors with the same intensity. Social networks are usually seen as more important for women, who rely more strongly on relatives and friends for help, information, pro-tection, and guidance at their destination. In addition, educated women are better able than uneducated women to escape from the sexual discrimination they must endure in many developing countries. Better-educated men stay in those countries because they do not face the same barriers to career advance-ment as women do, especially women in highly sexist societies.
—Finally, Morrison, Schiff, and Sjöblom (2007) show that the increas-ing participation of women in international migration affects future amounts of remittances, the size of diaspora externalities (e.g., network-based effects on trade, foreign direct investment, technology diffusion), and the structure of labor and other contributions in source countries. They find that as com-pared to male migrants, female migrants send remittances over longer time periods; send larger amounts to distant family members; and have different impacts on household expenditures at origin. Chant (1992), Curran and Rivero-Fuentes (2003), Collinson et al. (2003), and Vanwey (2004) show that, after controlling for households’ characteristics, women remit home at a higher rate than men.
Without a gendered assessment of highly skilled migration, it is impos-sible to conduct a complete analysis of these issues. In this article we quan-tify and characterize the gender composition of international migration by educational attainment. We build on the DM06 data set, update the data using new sources, standardize 1990 and 2000 categories, and introduce
PDR 35.2 Docquier-EPC-Xsp.indd 299 5/27/09 9:12:01 AM

300 A G E N D E R E D A S S E S S M E N T O F H I G H L Y S K I L L E D E M I G R A T I O N
a gender breakdown. We provide new data on stocks and rates of emigra-tion by level of schooling and gender. Our gross data reveal that the share of women in the highly skilled immigrant population increased in almost all OECD destination countries between 1990 and 2000. Consequently, for the vast majority of source regions, the growth rates of highly skilled female emigrants were greater than the growth rates for low-skilled women or highly skilled men. The evolution was particularly notable in the least developed countries. The increasing share of women in South-to-North skilled migra-tion flows mostly reflects gendered changes in levels of education. We show that the cross-country correlation between emigration stocks of women and men is extremely high (about 97 percent), with women’s numbers slightly below men’s. However, these skilled female migrants are drawn from a much smaller population of highly educated women. Hence, in relative terms, the correlation between men and women in rates (88 percent) is lower than in stocks. On average, highly skilled women’s emigration rate is 17 percent above men’s. This gender gap in the highly skilled migration rate is strongly correlated with the gender gap in educational attainment of the source popu-lation, reflecting unequal access to education.
Background
In the first concerted effort to provide comparable international data on migration rates by education level, Carrington and Detragiache (1998, 1999) used 1990 US census data and other OECD statistics on international migra-tion to construct estimates of emigration rates at three education levels for 61 developing countries (including 24 African countries). Adams (2003) used the same technique to compile estimates for 24 countries in 2000. Although Carrington and Detragiache’s study initiated new debates on skilled migra-tion, their estimates have a number of limitations. The two most important ones are: 1) they applied the education structure of the US immigration to immigration to other OECD countries; and 2) they estimated immigration to EU countries using OECD statistics reporting the number of immigrants for the major countries of emigration only, which led to underestimation of im-migration from countries with lesser rates of emigration.
Docquier and Marfouk (2006) standardized this work by providing a comprehensive data set on international migration to the OECD by education-al attainment. The construction of DM06 relied on three steps: 1) collection of census and register information on the structure of immigration to all OECD countries (this solves the problems noted for Carrington and Detragiache); (2) summation over source countries (this allows for the evaluation of the stock of immigrants from any given sending country to the OECD area by education level); and 3) comparison of the educational structure of emigrants to that of the population remaining at home (which allows for computing emigration rates by educational attainment in 1990 and 2000).
PDR 35.2 Docquier-EPC-Xsp.indd 300 5/27/09 9:12:01 AM
F R É D É R I C D O C Q U I E R / B . L I N D S A Y L O W E L L / A B D E S L A M M A R F O U K 301
The DM06 data rely on some assumptions that were relaxed in a couple of variants. Most of these variants required additional assumptions but largely confirmed the reliability of DM06 data in descriptive analysis and empirical regressions.
—First, with only two points in time, DM06 does not give a precise picture of the long-run trends in international migration. To remedy this problem, Defoort (2008) computes highly skilled emigration stocks and rates from 1975 to 2000 (one observation every five years). She uses the same methodology as in DM06 but focuses on the six major destination countries (the United States, Canada, Australia, Germany, Britain, and France). Her study shows that, at the world level or at the level of developing countries as a whole, the average emigration rate of highly skilled workers has been ex-tremely stable over the period. This suggests that the heterogeneity in highly skilled migration is mostly driven by the cross-sectional variability. This ob-servation reinforces the value of the DM06 cross-country data set based on a much more comprehensive set of destination countries.
—Second, counting all foreign-born individuals as immigrants indepen-dently of their age at arrival, DM06 does not account for whether education has been acquired in the home country or the host country. Controlling for the country of training can be important when dealing with such issues as the fiscal cost of skilled emigration. Beine, Docquier, and Rapoport (2007) use im-migrants’ age of entry as a proxy for where education has been acquired and propose alternative measures by defining emigrants as those who left their home country after age 22, 18, or 12 years. Data on age of entry are collected in a dozen OECD countries. For those countries for which such data cannot be obtained, Beine et al. estimate the age-of-entry structure using a gravity model (which takes into account distance between origin and destination countries, income gap between them, etc.). They find that these adjusted highly skilled emigration rates are highly correlated with rates reported in DM06.6
—Third, general emigration rates may hide critical occupational short-ages (e.g., among engineers, teachers, physicians, nurses, IT specialists, etc.). In poor countries shortages are particularly severe in the medical sector, where the number of physicians per 1,000 inhabitants is extremely low. Cle-mens and Pettersson (2006) and Docquier and Bhargava (2006) provide data on the emigration of health care workers. The correlation between medical emigration rates (as measured by Docquier and Bhargava) and DM06 general emigration rates amounts to 40 percent. This suggests that the aggregate rate of emigration computed for workers with post-secondary education may imperfectly capture the occupational structure of the brain drain.
The gender dimension of emigration has been largely undocumented. An exception is a study by Dumont, Martin, and Spielvogel (2007) that relies on a methodology similar to the one used here and analyzes emigration rates in 2000 by gender and educational level from some 75 countries. We use a slightly different definition of highly skilled migration (including all post-sec-
PDR 35.2 Docquier-EPC-Xsp.indd 301 5/27/09 9:12:02 AM

302 A G E N D E R E D A S S E S S M E N T O F H I G H L Y S K I L L E D E M I G R A T I O N
ondary educational levels, even those with one year of US college) and rely on plausible estimates of the educational structure of the adult population in countries where human capital indicators are missing. We provide emigration stocks and rates for 195 countries in 1990 and 2000. Our data set can be used to quantify the recent trend in women’s skilled migration and to analyze its causes and consequences for developing countries.
Methodology
This section describes the methodology used to compute emigration stocks and rates by educational attainment and gender for each source country in 1990 and 2000.
Emigration stocks
It is well documented that, with a few exceptions (such as Australia and New Zealand), statistics provided by source countries do not offer a realistic picture of emigration. When available, which is rare, statistics are incom-plete, imprecise, and give no information on emigrants’ level of education, gender, and country of destination. While detailed immigration data are not easy to collect on a homogeneous basis, information on emigration can only be captured by aggregating consistent immigration data collected in receiving countries, where information about the birth country, gender, and educa-tion of the native-born and immigrant populations is available from national censuses and registers (or samples of them). The receiving country j’s census usually identifies individuals on the basis of age, gender g, country of birth i, and skill level s. Our method consists in collecting (census or register) gender-disaggregated data from a large set of receiving countries, with the highest level of detail on birth countries and three levels of educational attainment: s = h for highly skilled, s = m for medium-skilled, and s = l for low-skilled. Let Mt g s
i j, ,, denote the stock of adults aged 25 years and older born in j, of gender
g, skill s, living in country j at time t. Table A.1 in the appendix describes our data sources. Aggregating these numbers over destination countries j gives the stock of emigrants from country i: M M
t g si
j t g si j
, , , ,,= Σ . This is the method
used in DM06, without gender breakdown. By focusing on census and register data, our methodology fails to cap-
ture illegal immigrants, for whom systematic statistics by education level and country of birth are not available,7 except in the United States. Demographic evidence indicates that most illegal residents in the United States are identi-fied in the census. However, other host countries provide no accurate data about the educational status of illegal migrants. Although there may be some instances of undocumented highly skilled migrants (such as Indians overstay-ing H-1B visas in the United States), it is widely believed that the majority of undocumented residents are low-skilled. Hence, we probably underestimate
PDR 35.2 Docquier-EPC-Xsp.indd 302 5/27/09 9:12:03 AM

F R É D É R I C D O C Q U I E R / B . L I N D S A Y L O W E L L / A B D E S L A M M A R F O U K 303
the number of low-skilled migrants. This limitation is not expected to distort our estimates of the migration rate of highly skilled workers.
In the following analysis, we rely on the same principles as in DM06 and turn our attention to the homogeneity and comparability of the data. This requires a couple of methodological choices:
—The term “source country” usually designates independent states. We distinguish 195 source countries: 190 UN member states (after aggregating North and South Korea), Holy See, Taiwan, Hong Kong, Macao, and Palestin-ian Territories.We aggregate North and South Korea, West and East Germany, and the Democratic Republic and the Republic of Yemen. We consider the same set of source countries in 1990 and 2000, although some of them had no legal existence in 1990 (before the break-up of the Soviet Union, the dissolution of Yugoslavia and Czechoslovakia, and the German and Yemen reunifications) or became independent after 1 January 1990 (Eritrea, East Timor, Namibia, Marshall Islands, Micronesia, Palau). In these cases, the 1990 estimated stock for each country of origin is obtained by multiplying the 1990 total value for the pre-secession state by the 2000 country share in the stock of immigrants (the share is gender- and skill-specific).
—The set of receiving countries is restricted to OECD member countries. We thus focus on the structure of “South-to-North” and “North-to-North” migration. The skill level of immigrants in non-OECD countries is expected to be very low, except in a few countries such as South Africa (1.3 million immigrants in 2000), the six member states of the Gulf Cooperation Council (total of 9.6 million immigrants in 2000 in Saudi Arabia, United Arab Emir-ates, Kuwait, Bahrain, Oman, and Qatar), some Eastern Asian countries (4 million immigrants in 2000 in Hong Kong and Singapore combined). Accord-ing to their census and survey data, about 17.5 percent of adult immigrants in these countries have tertiary-level education (17 percent in Bahrain, 17.2 percent in Saudi Arabia, 14 percent in Kuwait, 18.7 percent in South Africa). Considering that children constitute about 25 percent of the immigrant stock, we estimate the number of educated workers at 1.9 million in all of these countries combined. The number of educated immigrants in the rest of the non-OECD world lies between 1 million and 4 million (if the average propor-tion of educated immigrants among adults lies between 2.5 and 10 percent). This implies that by focusing on OECD countries, we should include a large fraction of worldwide educated migrants (about 90 percent). Nevertheless, we are aware that by disregarding non-OECD immigration countries, we probably underestimate the number of highly skilled emigrants from several developing countries (such as Egypt, Sudan, Jordan, Yemen, Pakistan, and Bangladesh in the neighborhood of the Gulf states; and from Botswana, Leso-tho, Namibia, Swaziland, and Zimbabwe). Incorporating data collected from selected non-OECD countries could refine the data set. To allow comparisons between 1990 and 2000, we consider the same 30 receiving countries in 1990 and 2000. Consequently, the Czech Republic, the Slovak Republic, Hungary,
PDR 35.2 Docquier-EPC-Xsp.indd 303 5/27/09 9:12:03 AM
304 A G E N D E R E D A S S E S S M E N T O F H I G H L Y S K I L L E D E M I G R A T I O N
Korea, Poland, and Mexico are considered as receiving countries in 1990 even though they were not yet members of the OECD.
—We consider only the adult population aged 25 and over. This ex-cludes students who temporarily emigrate to complete their education. In addition, this age restriction allows us to compare the numbers of migrants at various education levels with data on educational attainment in source countries. Because we have no systematic information on the age at entry, it is impossible to distinguish between immigrants who were educated at the time of their arrival and those who acquired education after they settled in the receiving country; for example, Mexican-born individuals who arrived in the United States at age five or ten years and graduated from US institutions of higher education are counted as highly skilled immigrants. As mentioned above, Beine et al. (2007) provided adjusted measures by age of entry and found a very high correlation with the unadjusted numbers.
—Migration is generally defined on the basis of the country of birth rather than citizenship.While citizenship characterizes the foreign population, the “foreign-born” concept better captures the decision to emigrate. Usually, the number of foreign-born individuals is much higher than the number of foreign-born naturalized citizens (twice as large in countries such as Hungary, the Netherlands, and Sweden).8 Another reason is that apart from changes in political boundaries the concept of country of birth is time-invariant (un-like citizenship, which changes with naturalization) and independent of the changes in policies regarding naturalization.9 The number of foreign-born persons can be obtained for a large majority of OECD countries, although in a limited number of cases the national census only gives immigrants’ citizenship (Germany, Hungary, Italy, Japan, and Korea).10 In these five cases, migrants are defined on the basis of their citizenship. The concept of foreign-born is not homogeneous across OECD countries. In most receiving countries, the foreign-born are individuals born abroad with foreign citizenship at birth.11 In a few countries (Australia, New Zealand, Belgium), foreign-born means “overseas-born,” that is, any individual born abroad.
—We distinguish three levels of education. Medium-skilled migrants are those with completed upper-secondary education. Low-skilled migrants have less than completed upper-secondary education, including those with only lower-secondary and primary education and those who did not go to school. Highly skilled migrants have post-secondary education.12 This group-ing is consistent with Barro and Lee’s human capital indicators (based on the 1976 International Standard Classification of Education, or ISCED). Some migrants did not report their education level. As in DM06, we classify these unknowns as low-skilled migrants.13 Educational categories are constructed on the basis of country-specific information and are consistent with human capital indicators available for all sending countries. A mapping between the country’s official classification and our ISCED groups is sometimes required to harmonize the data.14
PDR 35.2 Docquier-EPC-Xsp.indd 304 5/27/09 9:12:03 AM
F R É D É R I C D O C Q U I E R / B . L I N D S A Y L O W E L L / A B D E S L A M M A R F O U K 305
Emigration rates
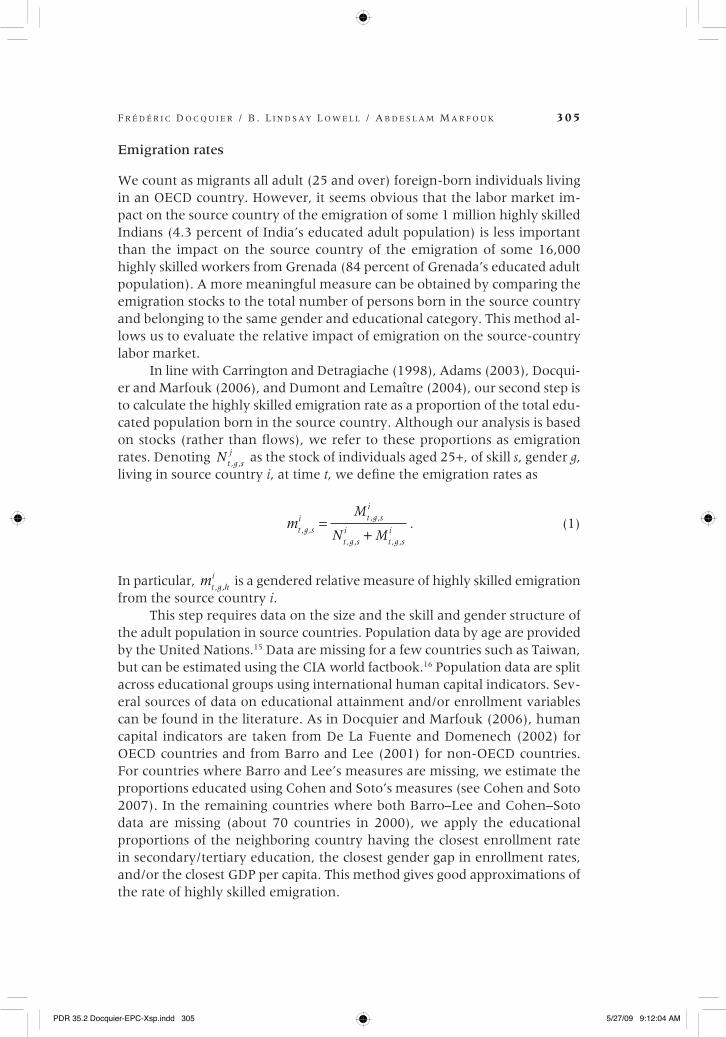
We count as migrants all adult (25 and over) foreign-born individuals living in an OECD country. However, it seems obvious that the labor market im-pact on the source country of the emigration of some 1 million highly skilled Indians (4.3 percent of India’s educated adult population) is less important than the impact on the source country of the emigration of some 16,000 highly skilled workers from Grenada (84 percent of Grenada’s educated adult population). A more meaningful measure can be obtained by comparing the emigration stocks to the total number of persons born in the source country and belonging to the same gender and educational category. This method al-lows us to evaluate the relative impact of emigration on the source-country labor market.
In line with Carrington and Detragiache (1998), Adams (2003), Docqui-er and Marfouk (2006), and Dumont and Lemaître (2004), our second step is to calculate the highly skilled emigration rate as a proportion of the total edu-cated population born in the source country. Although our analysis is based on stocks (rather than flows), we refer to these proportions as emigration rates. Denoting N
t g sj, ,
as the stock of individuals aged 25+, of skill s, gender g, living in source country i, at time t, we define the emigration rates as
mM
N Mt g si t g s
i
t g si
t g si, ,
, ,
, , , ,
=+
. (1)
In particular, mt g hi, ,
is a gendered relative measure of highly skilled emigration from the source country i.
This step requires data on the size and the skill and gender structure of the adult population in source countries. Population data by age are provided by the United Nations.15 Data are missing for a few countries such as Taiwan, but can be estimated using the CIA world factbook.16 Population data are split across educational groups using international human capital indicators. Sev-eral sources of data on educational attainment and/or enrollment variables can be found in the literature. As in Docquier and Marfouk (2006), human capital indicators are taken from De La Fuente and Domenech (2002) for OECD countries and from Barro and Lee (2001) for non-OECD countries. For countries where Barro and Lee’s measures are missing, we estimate the proportions educated using Cohen and Soto’s measures (see Cohen and Soto 2007). In the remaining countries where both Barro–Lee and Cohen–Soto data are missing (about 70 countries in 2000), we apply the educational proportions of the neighboring country having the closest enrollment rate in secondary/tertiary education, the closest gender gap in enrollment rates, and/or the closest GDP per capita. This method gives good approximations of the rate of highly skilled emigration.
PDR 35.2 Docquier-EPC-Xsp.indd 305 5/27/09 9:12:04 AM
306 A G E N D E R E D A S S E S S M E N T O F H I G H L Y S K I L L E D E M I G R A T I O N
Results
We describe the main results for migration stocks and rates by country group, identify the sending countries most affected by highly skilled emigration, and indicate the share of women in highly skilled migration.
Migration stocks
We record 41.7 million immigrants aged 25 and older in 1990 and 58.2 mil-lion in 2000 in the OECD area. According to our estimates, the average share of women in the OECD immigrant population increased from 50.6 percent to 50.9 percent between 1990 and 2000. These percentages (for adults 25 and over) are in line with figures from the UN Population Division (for all ages) reported for the OECD area (50.2 and 50.6 percent for these two years). At the country level, this share increased in 20 OECD countries and decreased in ten countries. In 2000, the national proportions of women in the adult immigrant population ranged from 41.8 percent in Iceland to 59.8 percent in Poland.
A first advantage of our data set is that it provides comparable statistics on the entry of highly skilled immigrants. Our estimates show that the aver-age share of women in the skilled immigrant population increased from 46.7 to 49.3 percent between 1990 and 2000. In 2000, country-specific shares range from 39.8 percent in Iceland to 56.4 in Poland.17 The share increased in 27 countries and decreased in only three (Portugal, Spain, and Belgium). Remarkable increases in female share were observed in the Czech Republic (+18.6 percentage points), Finland (+9.2), and Turkey (+9.1).
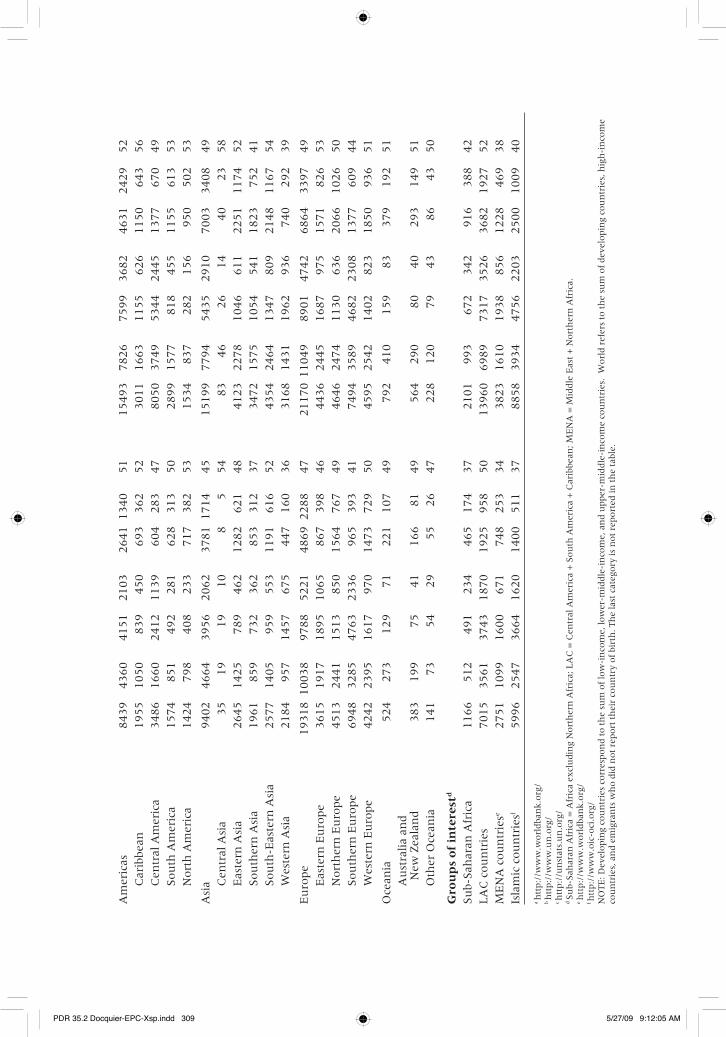
Our data set also distinguishes migrants by country of birth. This allows us to quantify and characterize the structure of emigration by educational level and gender. Table 1 gives the emigration stocks for 1990 and 2000. We distinguish total, low-skilled, and highly skilled emigration stocks; the medium-skilled can be easily obtained by subtraction. Although our data set reveals specific information by country of origin, here we report data by country group only. We consider income groups (following the World Bank classification), regional groups as defined in the UN classification, as well as groups of particular interest (sub-Saharan Africa, Latin America and the Ca-ribbean, Middle East and Northern Africa, and Islamic countries).
The proportions of women in highly skilled and low-skilled emigration are positively correlated (correlation rate of 0.57 in 2000). Women account for a large proportion of highly skilled emigrants from high-income countries (50.3 percent in 2000), lower-middle-income countries (51.5 percent), and small island developing states (54.4 percent). In contrast, their share is much lower in highly skilled emigration from low-income countries (42.3 percent), the least developed countries (41.8 percent), sub-Saharan Africa (42.4 per-cent), MENA (38.2 percent), and Islamic countries (40.4 percent).
PDR 35.2 Docquier-EPC-Xsp.indd 306 5/27/09 9:12:04 AM
F R É D É R I C D O C Q U I E R / B . L I N D S A Y L O W E L L / A B D E S L A M M A R F O U K 307
Between 1990 and 2000, the number of highly skilled women emigrants increased by 73 percent (from 5.8 to about 10.1 million). The rate of growth was much lower for low-skilled women (+22 percent). The number of skilled women emigrants increased 1.5-fold in low-income countries and more than 1.2-fold in the least developed and sub-Saharan African countries. In all regions except Middle Africa, the growth rate of the stock of female highly skilled emigrants was always greater than the rate for comparable males. At the regional level, major increases in female highly skilled emigration are observed in Central Asia (+412 percent), Western Africa (+177 percent), Southern Asia (+141 percent), Central America (+137 percent), and Southern Africa (+118 percent).
The increase in the emigration of highly skilled women is observed in every source region and is partly because women’s rise in schooling level was more rapid than men’s rise. At the world level, the female educated adult population increased by 68 percent (this growth rate reaches 105 percent for the least developed countries). In comparison, the male educated adult population increased by only 42 percent on average (71 percent for the least developed countries). Besides this supply effect, women’s increasing partici-pation in skilled emigration also reflects an increased demand for women’s labor in health care sectors and other services, the increased importance of family reunion programs, and cultural and social changes in attitudes toward female migration in many source countries.
Emigration rates
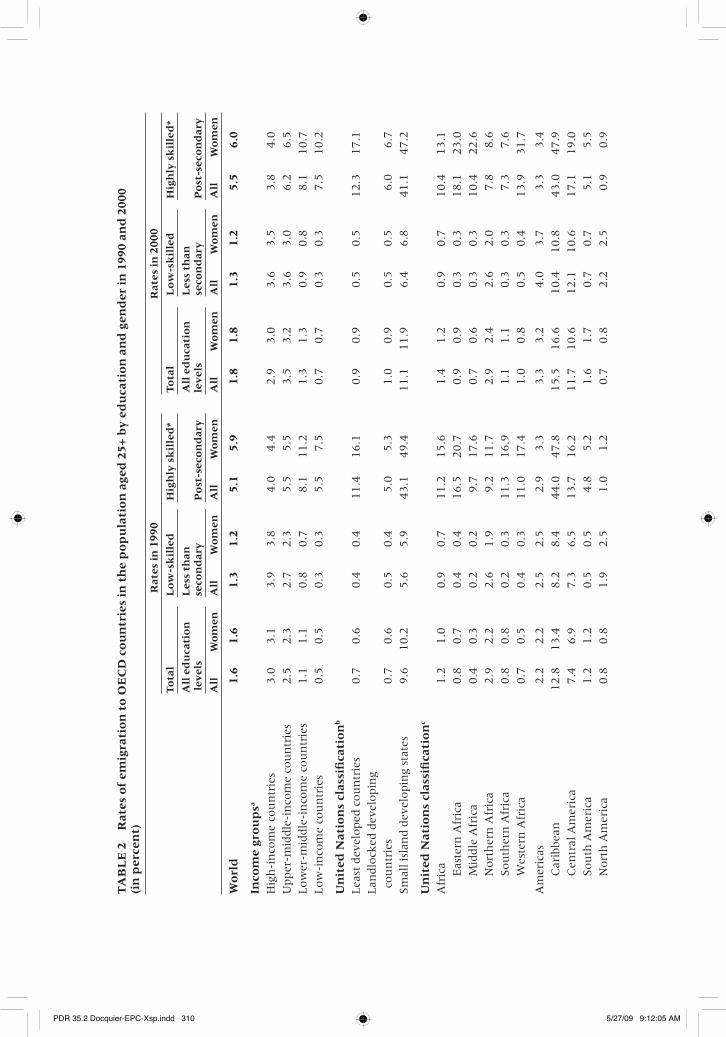
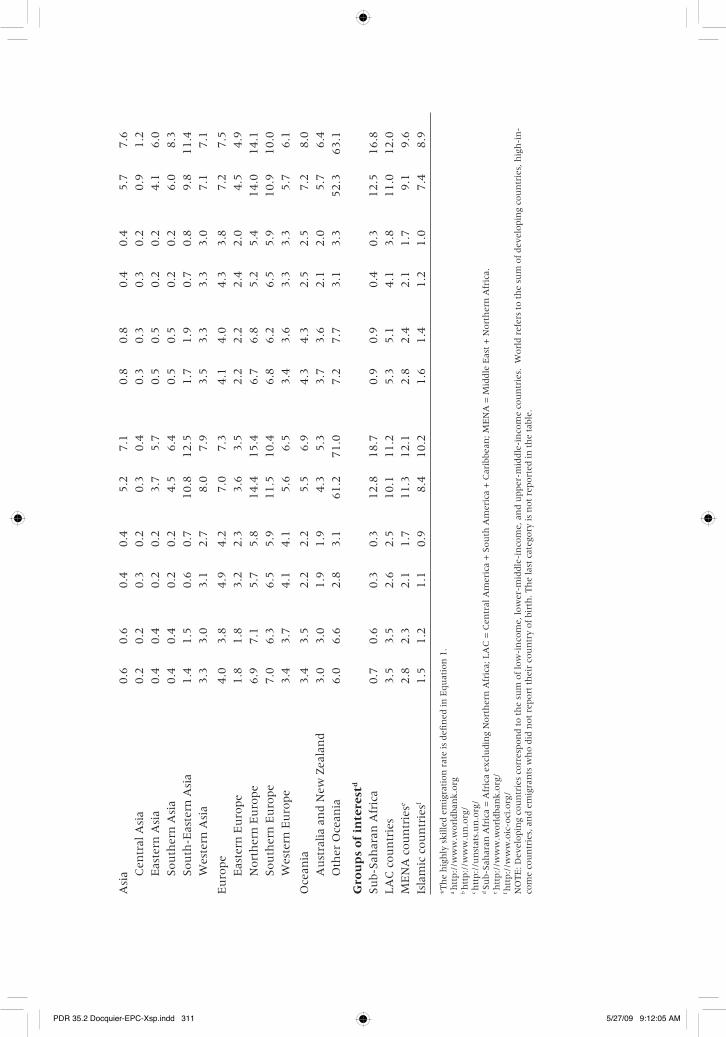
As pointed out above, a more meaningful measure of rates of highly skilled emigration can be obtained by comparing the emigration stocks to the total number of persons born in the source country and belonging to the same gender and educational category. Table 2 shows the emigration rates of low-skilled and highly skilled workers, as well as global emigration rates by country groups and region of origin in 1990 and 2000.18
In all regions, highly skilled emigration rates are much greater than low-skilled rates. The skill-related gap is particularly wide in poor countries, where the propensity to move among highly skilled workers is 10 to 20 times larger than among the low-skilled. The largest highly skilled emigration rates in 2000 are obtained in the Caribbean (43.0 percent) and Pacific islands (52.3 percent). Figures above 10 percent are also observed in Middle, Eastern, and Western Africa, Central America, and Northern and Southern Europe. On the whole, highly skilled emigration rates are high in poor regions with small countries.
At the world level, women and men exhibit nearly identical total emi-gration rates in the two periods (1.6 percent in 1990 and 1.8 percent in 2000). Women’s average emigration rates are, however, lower than men’s in the less developed countries, especially in Northern and sub-Saharan Africa. In contrast, highly skilled emigration rates are higher among women. In 2000,
PDR 35.2 Docquier-EPC-Xsp.indd 307 5/27/09 9:12:05 AM

TA
BL
E 1
S
tock
s o
f em
igra
nts
age
d 2
5+ w
ho
em
igra
ted
to
OE
CD
co
un
trie
s b
y e
du
cati
on
an
d g
end
er i
n 1
990
and
200
0 (i
n t
ho
usa
nd
s)
19
90
2000
T
ota
l
Lo
w-s
kil
led
H
igh
ly s
kil
led
To
tal
L
ow
-sk
ille
d
Hig
hly
sk
ille
d
A
ll e
du
cati
on
L
ess
than
All
ed
uca
tio
n
Les
s th
an
l
evel
s
seco
nd
ary
P
ost
-sec
on
dar
y
le
vel
s
seco
nd
ary
P
ost
-sec
on
dar
y
P
erce
nt
Per
cen
t
All
W
om
en
All
W
om
en
All
W
om
en
wo
men
A
ll
Wo
men
A
ll
Wo
men
A
ll
Wo
men
w
om
en
Wo
rld
41
706
2109
0 20
414
1052
3 12
501
5833
47
58
246
2962
3 25
068
1282
0 20
442
1007
0 49
Inco
me
gro
up
sa
Hig
h-i
nco
me
cou
ntr
ies
18046
9550
7991
4310
5749 2797
49
19717 1
041
5
69
36
3
71
7
79
11
3
97
7
50
Upper
-mid
dle
-in
com
e c
ou
ntr
ies
9125
4408
5433
2667
2027
913
45
15339
748
2
85
72
4
12
6
37
29
1
83
9
49
Low
er-m
iddle
-in
com
e c
ou
ntr
ies
9843
4945
4753
2409
3144 1505
48
15505
803
7
64
32
3
32
2
56
91
2
92
9
51
Low
-in
com
e co
un
trie
s 3507
1592
1565
793
1317
495
38
6445
3064
2
29
0
12
20
2
91
8
12
35
4
2
Un
ited
Nat
ion
s c
lass
ifica
tio
nb
Lea
st d
evel
oped
cou
ntr
ies
1354
606
714
350
412
153
37
2364
1127
1
04
9
54
2
81
4
34
0
42
Lan
dlo
cked
dev
elopin
g c
ou
ntr
ies
783
362
373
182
264
112
42
1333
652
5
11
2
64
5
24
2
41
4
6Sm
all i
slan
d d
evel
opin
g st
ates
2643
1411
1149
620
918
471
51
4123
2249
1
59
8
86
8
15
36
8
35
5
4
Un
ited
Nat
ion
s c
lass
ifica
tio
nc
Afr
ica
2837
1162
1717
723
724
260
36
4352
1918
2
13
6
96
7
13
73
5
56
4
0
Eas
tern
Afr
ica
516
248
212
115
205
81
40
812
411
2
34
1
36
3
46
1
52
4
4
Mid
dle
Afr
ica
103
43
42
20
38
13
34
214
99
8
8
47
7
4
28
3
7
Nort
her
n A
fric
a 1671
650
1226
489
259
87
33
2252
926
1
46
4
62
5
45
7
16
7
37
S
ou
ther
n A
fric
a 135
70
30
17
79
36
46
272
142
3
2
19
1
77
8
7
49
W
este
rn A
fric
a 412
151
208
82
143
44
30
803
341
3
18
1
41
3
19
1
22
3
8
PDR 35.2 Docquier-EPC-Xsp.indd 308 5/27/09 9:12:05 AM
Am
eric
as
8439
4360
4151
2103
2641 1340
51
15493
782
6
75
99
3
68
2
46
31
2
42
9
52
C
arib
bean
1955
1050
839
450
693
362
52
3011
1663
1
15
5
62
6
11
50
6
43
5
6
Cen
tral
Am
eric
a 3486
1660
2412
1139
604
283
47
8050
3749
5
34
4
24
45
1
37
7
67
0
49
S
ou
th A
mer
ica
1574
851
492
281
628
313
50
2899
1577
8
18
4
55
1
15
5
61
3
53
N
ort
h A
mer
ica
1424
798
408
233
717
382
53
1534
837
2
82
1
56
9
50
5
02
5
3
Asi
a 9402
4664
3956
2062
3781 1714
45
15199
779
4
54
35
2
91
0
70
03
3
40
8
49
C
entr
al A
sia
35
19
19
10
8
5
54
83
46
2
6
14
4
0
23
5
8
Eas
tern
Asi
a 2645
1425
789
462
1282
621
48
4123
2278
1
04
6
61
1
22
51
1
17
4
52
S
ou
ther
n A
sia
1961
859
732
362
853
312
37
3472
1575
1
05
4
54
1
18
23
7
52
4
1
Sou
th-E
aste
rn A
sia
2577
1405
959
553
1191
616
52
4354
2464
1
34
7
80
9
21
48
1
16
7
54
W
este
rn A
sia
2184
957
1457
675
447
160
36
3168
1431
1
96
2
93
6
74
0
29
2
39
Eu
rope
19318 10038
9788
5221
4869 2288
47
21170 1
104
9
89
01
4
74
2
68
64
3
39
7
49
E
aste
rn E
uro
pe
3615
1917
1895
1065
867
398
46
4436
2445
1
68
7
97
5
15
71
8
26
5
3
Nort
her
n E
uro
pe
4513
2441
1513
850
1564
767
49
4646
2474
1
13
0
63
6
20
66
1
02
6
50
S
ou
ther
n E
uro
pe
6948
3285
4763
2336
965
393
41
7494
3589
4
68
2
23
08
1
37
7
60
9
44
W
este
rn E
uro
pe
4242
2395
1617
970
1473
729
50
4595
2542
1
40
2
82
3
18
50
9
36
5
1
Oce
ania
524
273
129
71
221
107
49
792
410
1
59
8
3
37
9
19
2
51
A
ust
ralia
and
New
Zea
lan
d
383
199
75
41
166
81
49
564
290
8
0
40
2
93
1
49
5
1
Oth
er O
cean
ia
141
73
54
29
55
26
47
228
120
7
9
43
8
6
43
5
0
Gro
up
s o
f in
tere
std
Su
b-Sah
aran
Afr
ica
1166
512
491
234
465
174
37
2101
993
6
72
3
42
9
16
3
88
4
2LA
C c
ou
ntr
ies
7015
3561
3743
1870
1925
958
50
13960
698
9
73
17
3
52
6
36
82
1
92
7
52
ME
NA
cou
ntr
iese
2751
1099
1600
671
748
253
34
3823
1610
1
93
8
85
6
12
28
4
69
3
8Is
lam
ic c
ou
ntr
iesf
5996
2547
3664
1620
1400
511
37
8858
3934
4
75
6
22
03
2
50
0
10
09
4
0
a h
ttp:/
/ww
w.w
orl
dba
nk.o
rg/
b h
ttp:/
/ww
w.u
n.o
rg/
c h
ttp:/
/un
stat
s.u
n.o
rg/
d S
ub-
Sah
aran
Afr
ica
= A
fric
a ex
clu
din
g N
ort
her
n A
fric
a; L
AC
= C
entr
al A
mer
ica
+ S
ou
th A
mer
ica
+ C
arib
bean
; ME
NA
= M
iddle
Eas
t +
No
rth
ern
Afr
ica.
e h
ttp:/
/ww
w.w
orl
dba
nk.o
rg/
f h
ttp:/
/ww
w.o
ic-o
ci.o
rg/
NO
TE
: Dev
elopin
g co
un
trie
s co
rres
pon
d t
o t
he
sum
of
low
-in
com
e, lo
wer
-mid
dle
-in
com
e, a
nd u
pper
-mid
dle
-in
com
e co
un
trie
s. W
orl
d r
efer
s to
th
e su
m o
f d
evel
op
ing
cou
ntr
ies,
hig
h-i
nco
me
cou
ntr
ies,
an
d e
mig
ran
ts w
ho d
id n
ot
report
th
eir
cou
ntr
y of
birt
h. T
he
last
cat
egory
is n
ot
report
ed in
th
e ta
ble.
PDR 35.2 Docquier-EPC-Xsp.indd 309 5/27/09 9:12:05 AM
TA
BL
E 2
R
ates
of
emig
rati
on
to
OE
CD
co
un
trie
s in
th
e p
op
ula
tio
n a
ged
25+
by
ed
uca
tio
n a
nd
gen
der
in
199
0 an
d 2
000
(i
n p
erce
nt)
R
ates
in
199
0 R
ates
in
200
0
T
ota
l
Lo
w-s
kil
led
H
igh
ly s
kil
led
* T
ota
l
Lo
w-s
kil
led
H
igh
ly s
kil
led
*
A
ll e
du
cati
on
L
ess
than
A
ll e
du
cati
on
L
ess
than
lev
els
se
con
dar
y
Po
st-s
eco
nd
ary
le
vel
s
seco
nd
ary
P
ost
-sec
on
dar
y
A
ll
Wo
men
A
ll
Wo
men
A
ll
Wo
men
A
ll
Wo
men
A
ll
Wo
men
A
ll
Wo
men
Wo
rld
1.
6 1.
6 1.
3 1.
2 5.
1 5.
9 1.
8 1.
8 1.
3 1.
2 5.
5 6.
0
Inco
me
gro
up
sa
Hig
h-i
nco
me
cou
ntr
ies
3.0
3.1
3.9
3.8
4.0
4.4
2.9
3
.0
3.6
3
.5
3.8
4
.0U
pper
-mid
dle
-in
com
e co
un
trie
s 2.5
2.3
2.7
2.3
5.5
5.5
3.5
3
.2
3.6
3
.0
6.2
6
.5Low
er-m
iddle
-in
com
e co
un
trie
s 1.1
1.1
0.8
0.7
8.1
11.2
1.3
1
.3
0.9
0
.8
8.1
1
0.7
Low
-in
com
e co
un
trie
s 0.5
0.5
0.3
0.3
5.5
7.5
0.7
0
.7
0.3
0
.3
7.5
1
0.2
Un
ited
Nat
ion
s cl
assi
fica
tio
nb
Lea
st d
evel
oped
cou
ntr
ies
0.7
0.6
0.4
0.4
11.4
16.1
0.9
0
.9
0.5
0
.5
12
.3
17
.1Lan
dlo
cked
dev
elopin
g c
ou
ntr
ies
0.7
0.6
0.5
0.4
5.0
5.3
1.0
0
.9
0.5
0
.5
6.0
6
.7Sm
all i
slan
d d
evel
opin
g st
ates
9.6
10.2
5.6
5.9
43.1
49.4
11.1
1
1.9
6
.4
6.8
4
1.1
4
7.2
Un
ited
Nat
ion
s cl
assi
fica
tio
nc
Afr
ica
1.2
1.0
0.9
0.7
11.2
15.6
1.4
1
.2
0.9
0
.7
10
.4
13
.1
Eas
tern
Afr
ica
0.8
0.7
0.4
0.4
16.5
20.7
0.9
0
.9
0.3
0
.3
18
.1
23
.0
Mid
dle
Afr
ica
0.4
0.3
0.2
0.2
9.7
17.6
0.7
0
.6
0.3
0
.3
10
.4
22
.6
Nort
her
n A
fric
a 2.9
2.2
2.6
1.9
9.2
11.7
2.9
2
.4
2.6
2
.0
7.8
8
.6
Sou
ther
n A
fric
a 0.8
0.8
0.2
0.3
11.3
16.9
1.1
1
.1
0.3
0
.3
7.3
7
.6
Wes
tern
Afr
ica
0.7
0.5
0.4
0.3
11.0
17.4
1.0
0
.8
0.5
0
.4
13
.9
31
.7
Am
eric
as
2.2
2.2
2.5
2.5
2.9
3.3
3.3
3
.2
4.0
3
.7
3.3
3
.4
Car
ibbe
an
12.8
13.4
8.2
8.4
44.0
47.8
15.5
1
6.6
1
0.4
1
0.8
4
3.0
4
7.9
C
entr
al A
mer
ica
7.4
6.9
7.3
6.5
13.7
16.2
11.7
1
0.6
1
2.1
1
0.6
1
7.1
1
9.0
S
ou
th A
mer
ica
1.2
1.2
0.5
0.5
4.8
5.2
1.6
1
.7
0.7
0
.7
5.1
5
.5
Nort
h A
mer
ica
0.8
0.8
1.9
2.5
1.0
1.2
0.7
0
.8
2.2
2
.5
0.9
0
.9
PDR 35.2 Docquier-EPC-Xsp.indd 310 5/27/09 9:12:05 AM
Asi
a 0.6
0.6
0.4
0.4
5.2
7.1
0.8
0
.8
0.4
0
.4
5.7
7
.6
Cen
tral
Asi
a 0.2
0.2
0.3
0.2
0.3
0.4
0.3
0
.3
0.3
0
.2
0.9
1
.2
Eas
tern
Asi
a 0.4
0.4
0.2
0.2
3.7
5.7
0.5
0
.5
0.2
0
.2
4.1
6
.0
Sou
ther
n A
sia
0.4
0.4
0.2
0.2
4.5
6.4
0.5
0
.5
0.2
0
.2
6.0
8
.3
Sou
th-E
aste
rn A
sia
1.4
1.5
0.6
0.7
10.8
12.5
1.7
1
.9
0.7
0
.8
9.8
1
1.4
W
este
rn A
sia
3.3
3.0
3.1
2.7
8.0
7.9
3.5
3
.3
3.3
3
.0
7.1
7
.1
Eu
rop
e 4.0
3.8
4.9
4.2
7.0
7.3
4.1
4
.0
4.3
3
.8
7.2
7
.5
Eas
tern
Eu
rope
1.8
1.8
3.2
2.3
3.6
3.5
2.2
2
.2
2.4
2
.0
4.5
4
.9
Nort
her
n E
uro
pe
6.9
7.1
5.7
5.8
14.4
15.4
6.7
6
.8
5.2
5
.4
14
.0
14
.1
Sou
ther
n E
uro
pe
7.0
6.3
6.5
5.9
11.5
10.4
6.8
6
.2
6.5
5
.9
10
.9
10
.0
Wes
tern
Eu
rope
3.4
3.7
4.1
4.1
5.6
6.5
3.4
3
.6
3.3
3
.3
5.7
6
.1
Oce
ania
3.4
3.5
2.2
2.2
5.5
6.9
4.3
4
.3
2.5
2
.5
7.2
8
.0
Au
stra
lia
and N
ew Z
eala
nd
3.0
3.0
1.9
1.9
4.3
5.3
3.7
3
.6
2.1
2
.0
5.7
6
.4
Oth
er O
cean
ia
6.0
6.6
2.8
3.1
61.2
71.0
7.2
7
.7
3.1
3
.3
52
.3
63
.1
Gro
up
s o
f in
tere
std
Su
b-S
ahar
an A
fric
a 0.7
0.6
0.3
0.3
12.8
18.7
0.9
0
.9
0.4
0
.3
12
.5
16
.8LA
C c
ou
ntr
ies
3.5
3.5
2.6
2.5
10.1
11.2
5.3
5
.1
4.1
3
.8
11
.0
12
.0M
EN
A c
ou
ntr
iese
2.8
2.3
2.1
1.7
11.3
12.1
2.8
2
.4
2.1
1
.7
9.1
9
.6Is
lam
ic c
ou
ntr
iesf
1.5
1.2
1.1
0.9
8.4
10.2
1.6
1
.4
1.2
1
.0
7.4
8
.9
*Th
e h
igh
ly s
kille
d e
mig
rati
on
rat
e is
defi
ned
in E
qu
atio
n 1
. a h
ttp:/
/ww
w.w
orl
dba
nk.o
rg
b h
ttp:/
/ww
w.u
n.o
rg/
c h
ttp:/
/un
stat
s.u
n.o
rg/
d S
ub-
Sah
aran
Afr
ica
= A
fric
a ex
clu
din
g N
ort
her
n A
fric
a; L
AC
= C
entr
al A
mer
ica
+ S
ou
th A
mer
ica
+ C
arib
bean
; ME
NA
= M
iddle
Eas
t +
No
rth
ern
Afr
ica.
e h
ttp:/
/ww
w.w
orl
dba
nk.o
rg/
f h
ttp:/
/ww
w.o
ic-o
ci.o
rg/
NO
TE
: Dev
elopin
g co
un
trie
s co
rres
pon
d t
o t
he
sum
of
low
-in
com
e, lo
wer
-mid
dle
-in
com
e, a
nd u
pper
-mid
dle
-in
com
e co
un
trie
s. W
orl
d r
efer
s to
th
e su
m o
f d
evel
op
ing
cou
ntr
ies,
hig
h-i
n-
com
e co
un
trie
s, a
nd e
mig
ran
ts w
ho d
id n
ot
report
th
eir
cou
ntr
y of
birt
h. T
he
last
cat
egory
is n
ot
report
ed in
th
e ta
ble.
PDR 35.2 Docquier-EPC-Xsp.indd 311 5/27/09 9:12:05 AM
312 A G E N D E R E D A S S E S S M E N T O F H I G H L Y S K I L L E D E M I G R A T I O N
TABLE 3 Top 30 total and skilled emigration stocks and rates of individuals aged 25+ in 2000
Stock: All education levels Stock: Highly skilled
Percent Percent Country Total Women women Country Total Women women
Mexico 6,434 2,916 45.3 United Kingdom 1,478 707 47.8United Kingdom 2,990 1,547 51.7 Philippines 1,111 670 60.3Italy 2,337 1,094 46.8 India 1,034 444 42.9Germany 2,299 1,321 57.4 Mexico 949 448 47.2Turkey 1,942 887 45.7 Germany 937 490 52.4India 1,696 799 47.1 China 783 392 50.0Philippines 1,678 1,043 62.2 Korea 613 319 52.0China 1,676 888 53.0 Canada 523 279 53.3Vietnam 1,261 639 50.7 Vietnam 506 226 44.8Portugal 1,209 590 48.8 Poland 455 248 54.6Korea 1,205 681 56.5 United States 426 223 52.4Poland 1,122 630 56.1 Italy 395 162 41.1Morocco 1,067 450 42.2 Cuba 332 170 51.1Cuba 872 454 52.1 France 311 165 53.2Canada 854 480 56.2 Iran 303 122 40.1France 796 439 55.1 China, HongUkraine 748 439 58.7 Kong SAR 293 146 49.8Greece 714 332 46.6 Jamaica 287 178 62.1Spain 711 374 52.7 Japan 278 163 58.6Serbia and Taiwan 274 150 54.7 Montenegro 684 325 47.6 Russia 270 156 57.7Jamaica 681 388 57.0 Netherlands 255 112 44.1Ireland 680 368 54.0 Ukraine 249 137 54.9United States 680 357 52.6 Colombia 233 127 54.6El Salvador 665 336 50.6 Ireland 228 117 51.1Algeria 609 252 41.3 Pakistan 221 82 37.4Pakistan 582 253 43.4 New Zealand 175 86 49.5Dominican Turkey 175 64 36.5 Republic 579 334 57.7 South Africa 173 85 49.4Colombia 575 335 58.2 Peru 164 85 52.1Netherlands 571 278 48.6 Romania 163 81 49.6Russia 553 328 59.3
the average (weighted) female/male ratio of highly skilled emigration rates amounted to 1.2. Huge differences were observed in regions where women have poor access to education, such as Middle Africa, Eastern Asia, Southern Africa, and Western Africa. Women’s highly skilled emigration rate exceeds men’s in 81 percent of the cases (160 countries). Countries exhibiting the highest female/male ratios of emigration rates are sub-Saharan African coun-tries (such as Nigeria, Cameroon, São Tomé and Principe, the Democratic Republic of Congo) as well as Bangladesh and Thailand. In contrast, highly
PDR 35.2 Docquier-EPC-Xsp.indd 312 5/27/09 9:12:05 AM
F R É D É R I C D O C Q U I E R / B . L I N D S A Y L O W E L L / A B D E S L A M M A R F O U K 313
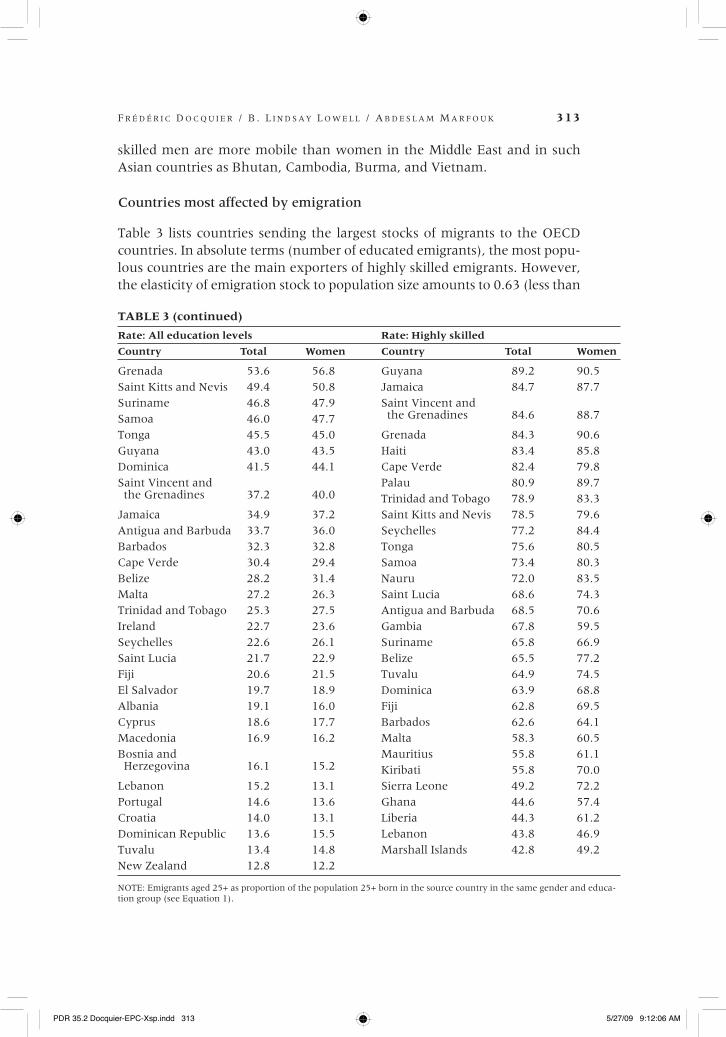
TABLE 3 (continued)
Rate: All education levels Rate: Highly skilled
Country Total Women Country Total Women
Grenada 53.6 56.8 Guyana 89.2 90.5Saint Kitts and Nevis 49.4 50.8 Jamaica 84.7 87.7Suriname 46.8 47.9 Saint Vincent and Samoa 46.0 47.7 the Grenadines 84.6 88.7
Tonga 45.5 45.0 Grenada 84.3 90.6Guyana 43.0 43.5 Haiti 83.4 85.8Dominica 41.5 44.1 Cape Verde 82.4 79.8Saint Vincent and Palau 80.9 89.7 the Grenadines 37.2 40.0 Trinidad and Tobago 78.9 83.3Jamaica 34.9 37.2 Saint Kitts and Nevis 78.5 79.6Antigua and Barbuda 33.7 36.0 Seychelles 77.2 84.4Barbados 32.3 32.8 Tonga 75.6 80.5Cape Verde 30.4 29.4 Samoa 73.4 80.3Belize 28.2 31.4 Nauru 72.0 83.5Malta 27.2 26.3 Saint Lucia 68.6 74.3Trinidad and Tobago 25.3 27.5 Antigua and Barbuda 68.5 70.6Ireland 22.7 23.6 Gambia 67.8 59.5Seychelles 22.6 26.1 Suriname 65.8 66.9Saint Lucia 21.7 22.9 Belize 65.5 77.2Fiji 20.6 21.5 Tuvalu 64.9 74.5El Salvador 19.7 18.9 Dominica 63.9 68.8Albania 19.1 16.0 Fiji 62.8 69.5Cyprus 18.6 17.7 Barbados 62.6 64.1Macedonia 16.9 16.2 Malta 58.3 60.5Bosnia and Mauritius 55.8 61.1 Herzegovina 16.1 15.2 Kiribati 55.8 70.0Lebanon 15.2 13.1 Sierra Leone 49.2 72.2Portugal 14.6 13.6 Ghana 44.6 57.4Croatia 14.0 13.1 Liberia 44.3 61.2Dominican Republic 13.6 15.5 Lebanon 43.8 46.9Tuvalu 13.4 14.8 Marshall Islands 42.8 49.2New Zealand 12.8 12.2
NOTE: Emigrants aged 25+ as proportion of the population 25+ born in the source country in the same gender and educa-tion group (see Equation 1).
skilled men are more mobile than women in the Middle East and in such Asian countries as Bhutan, Cambodia, Burma, and Vietnam.
Countries most affected by emigration
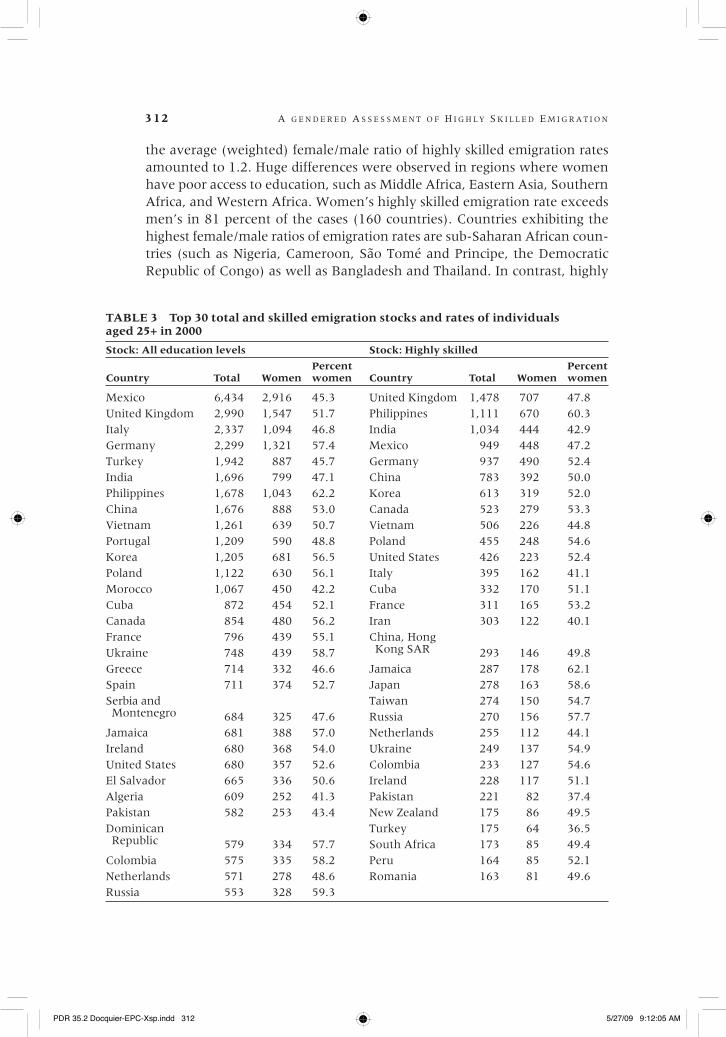
Table 3 lists countries sending the largest stocks of migrants to the OECD countries. In absolute terms (number of educated emigrants), the most popu-lous countries are the main exporters of highly skilled emigrants. However, the elasticity of emigration stock to population size amounts to 0.63 (less than
PDR 35.2 Docquier-EPC-Xsp.indd 313 5/27/09 9:12:06 AM
314 A G E N D E R E D A S S E S S M E N T O F H I G H L Y S K I L L E D E M I G R A T I O N
one), revealing that small countries are relatively more affected by emigration than large countries. The five largest diasporas (ages 25+ from all education categories) originate from Mexico (6.4 million), the United Kingdom (3.0 million), Italy (2.3 million), Germany (2.3 million), and Turkey (1.9 mil-lion). Eight other countries have diasporas exceeding 1 million: India, the Philippines, China, Vietnam, Portugal, Korea, Poland, and Morocco. In most of these countries, women’s share varies from 48 to 52 percent. However, women’s share is particularly high for the Philippines (62 percent), Germany (57), Korea, and Poland (both around 56 percent).
Focusing on highly skilled emigrants, the ranking unsurprisingly shows that rich countries with highly educated populations have better-educated diasporas. The elasticity of highly skilled emigration to population size at origin amounts to 0.66. The largest highly skilled diasporas originate from the United Kingdom (1.5 million), the Philippines (1.1 million), and India (1.0 million). Mexico and Germany send more than 0.9 million highly skilled natives abroad. Four other countries have highly skilled diasporas above 0.5 million: China, Korea, Canada, and Vietnam. In these top-30 countries, the share of women among highly skilled migrants is large in Jamaica (62 percent), the Philippines (60), as well as Japan, Russia, Ukraine, Poland, and Colombia.
The right-most panel of Table 3 shows the 30 countries with the largest highly skilled migration rates in 2000. Small islands lead the list. The emi-gration rate exceeds 80 percent in countries such as Guyana, Jamaica, St. Vincent, Grenada, Haiti, Cape Verde, and Palau. Only three of these top-30 countries have a population above 4 million. After eliminating small countries with fewer than 4 million inhabitants, about one-third of the most-affected countries are located in sub-Saharan Africa and seven are in Central America and the Caribbean. The highly skilled emigration rate in these 4 million plus population-size countries exceeds 30 percent in nine countries, including five in sub-Saharan Africa.
Gender gap in highly skilled migration
Figures 1 and 2 compare stocks and rates of highly skilled migration by gen-der. Figure 1 shows that the correlation between males and females in stocks is extremely high (97 percent). This is mainly due to an important size effect in international migration stocks: large countries send larger numbers of both men and women abroad than small countries. On average, the number of highly skilled female migrants is slightly lower than the number of highly skilled males. About 61 percent of developing countries (and only 48 percent of developed countries) send more male than female skilled migrants.
As we argued above, a more meaningful measure of the gender gap can be obtained by controlling for the total number of persons born in the source country who belong to the same gender and educational category (in this case focusing on highly skilled emigration rates). Figure 2 reveals that the correla-
PDR 35.2 Docquier-EPC-Xsp.indd 314 5/27/09 9:12:06 AM

F R É D É R I C D O C Q U I E R / B . L I N D S A Y L O W E L L / A B D E S L A M M A R F O U K 315
log(WE) = 0.9873.log(ME)R2 = 0.9705
2
4
6
8
10
12
14
2 4 6 8 10 12 14
FIGURE 1 Stocks of highly skilled emigrants in 195 countries in 2000: Correlation between women and men
Wo
men
’s e
mig
rati
on
: lo
gari
thm
of
stock
(W
E)
Men’s emigration (ME): logarithm of stock
0
10
20
30
40
50
60
70
80
90
100
0 10 20 30 40 50 60 70 80 90 100
WE = 1.1783.MER2 = 0.88
Wo
men
’s e
mig
rati
on
(W
E),
per
cen
t
Men’s emigration (ME), percent
FIGURE 2 Rates of emigration in 195 countries in 2000: Correlation between women and men
PDR 35.2 Docquier-EPC-Xsp.indd 315 5/27/09 9:12:07 AM
316 A G E N D E R E D A S S E S S M E N T O F H I G H L Y S K I L L E D E M I G R A T I O N
tion between gendered rates (88 percent) is lower than between gendered stocks (97 percent) and that women’s highly skilled emigration rate is on aver-age 17 percent above men’s. This confirms the results presented in Docquier, Lohest, and Marfouk (2007), who provide a simple multiplicative decompo-sition of the highly skilled emigration rate into two components: degree of openness of sending countries (as measured by the average of educational categories or total emigration rate) and the schooling gap (as measured by the education level of emigrants compared with the native-born population).
Conclusion
Women’s essential contributions to economic development have been duly noted, but their unique roles in international migration have received attention only more recently. In its World Survey on the Role of Women in Development, the United Nations stated that a gender perspective is essential to understanding migration and development.19 The report states that a dearth of data has made it difficult to evaluate the full implications of female migration. This article presented data based on information relating to 195 countries to improve un-derstanding of the role of women in highly skilled international migration.
We built on the DM06 data set, updated the statistics using new sources, standardized 1990 and 2000 categories, and introduced a breakdown by gen-der. We provided revised stocks and rates of emigration by level of schooling and gender. Although our data set would benefit from extensions (e.g., adding points in time and accounting for migration to non-OECD destination coun-tries), it can be used to illustrate the recent trend in women’s highly skilled emigration, as well as to analyze its causes and consequences for developing countries.
Our gross data reveal that the share of women in the highly skilled immigrant population increased in almost all OECD destination countries between 1990 and 2000. Consequently, for the vast majority of source re-gions, the growth rates of highly skilled women emigrants have exceeded the growth rates for low-skilled women or highly skilled men. This evolution is particularly pronounced in the least developed countries. The increased par-ticipation of women in South-to-North emigration partly reflects gendered changes in the supply of education. On average, women’s highly skilled emigration rate is 17 percent above men’s. Our database makes it possible to investigate the causal links between these variables and to analyze the con-sequences and determinants of women’s skilled migration.
Appendix
In countries where population registers are used (mainly the Scandinavian countries), data are based on the whole population. In countries where census data are used, statistics are based either on the whole population (e.g., Australia, New Zealand, Bel-
PDR 35.2 Docquier-EPC-Xsp.indd 316 5/27/09 9:12:07 AM
F R É D É R I C D O C Q U I E R / B . L I N D S A Y L O W E L L / A B D E S L A M M A R F O U K 317
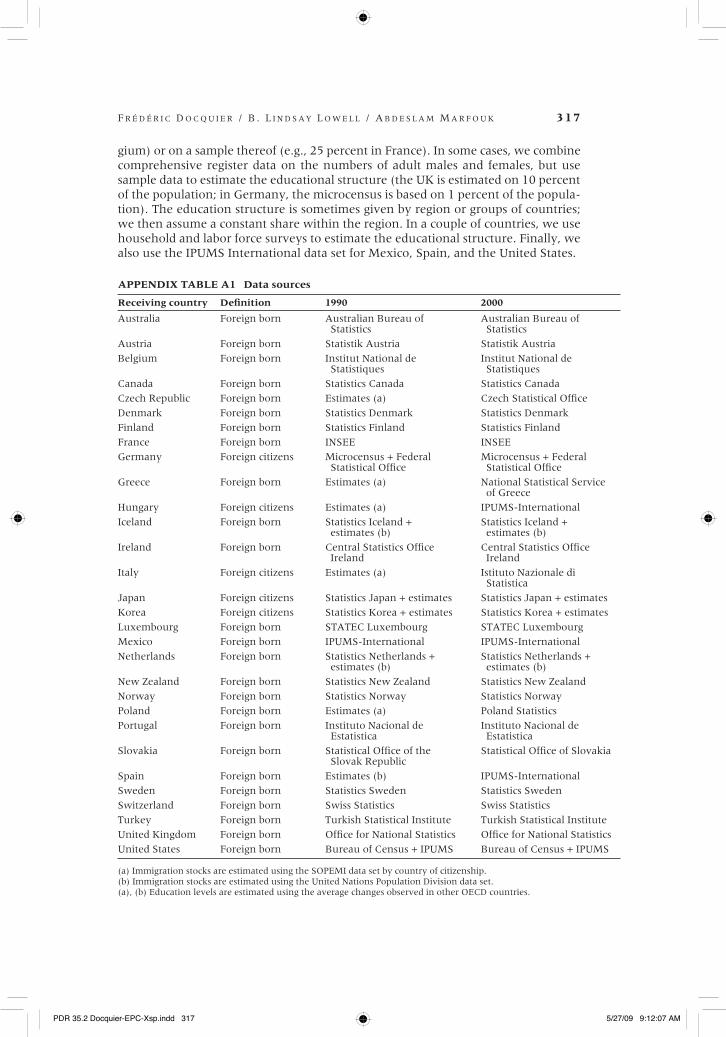
gium) or on a sample thereof (e.g., 25 percent in France). In some cases, we combine comprehensive register data on the numbers of adult males and females, but use sample data to estimate the educational structure (the UK is estimated on 10 percent of the population; in Germany, the microcensus is based on 1 percent of the popula-tion). The education structure is sometimes given by region or groups of countries; we then assume a constant share within the region. In a couple of countries, we use household and labor force surveys to estimate the educational structure. Finally, we also use the IPUMS International data set for Mexico, Spain, and the United States.
APPENDIX TABLE A1 Data sources
Receiving country Definition 1990 2000
Australia Foreign born Australian Bureau of Australian Bureau of Statistics Statistics
Austria Foreign born Statistik Austria Statistik Austria
Belgium Foreign born Institut National de Institut National de Statistiques Statistiques
Canada Foreign born Statistics Canada Statistics Canada
Czech Republic Foreign born Estimates (a) Czech Statistical Office
Denmark Foreign born Statistics Denmark Statistics Denmark
Finland Foreign born Statistics Finland Statistics Finland
France Foreign born INSEE INSEE
Germany Foreign citizens Microcensus + Federal Microcensus + Federal Statistical Office Statistical Office
Greece Foreign born Estimates (a) National Statistical Service of Greece
Hungary Foreign citizens Estimates (a) IPUMS-International
Iceland Foreign born Statistics Iceland + Statistics Iceland + estimates (b) estimates (b)
Ireland Foreign born Central Statistics Office Central Statistics Office Ireland Ireland
Italy Foreign citizens Estimates (a) Istituto Nazionale di Statistica
Japan Foreign citizens Statistics Japan + estimates Statistics Japan + estimates
Korea Foreign citizens Statistics Korea + estimates Statistics Korea + estimates
Luxembourg Foreign born STATEC Luxembourg STATEC Luxembourg
Mexico Foreign born IPUMS-International IPUMS-International
Netherlands Foreign born Statistics Netherlands + Statistics Netherlands + estimates (b) estimates (b)
New Zealand Foreign born Statistics New Zealand Statistics New Zealand
Norway Foreign born Statistics Norway Statistics Norway
Poland Foreign born Estimates (a) Poland Statistics
Portugal Foreign born Instituto Nacional de Instituto Nacional de Estatistica Estatistica
Slovakia Foreign born Statistical Office of the Statistical Office of Slovakia Slovak Republic
Spain Foreign born Estimates (b) IPUMS-International
Sweden Foreign born Statistics Sweden Statistics Sweden
Switzerland Foreign born Swiss Statistics Swiss Statistics
Turkey Foreign born Turkish Statistical Institute Turkish Statistical Institute
United Kingdom Foreign born Office for National Statistics Office for National Statistics
United States Foreign born Bureau of Census + IPUMS Bureau of Census + IPUMS
(a) Immigration stocks are estimated using the SOPEMI data set by country of citizenship. (b) Immigration stocks are estimated using the United Nations Population Division data set. (a), (b) Education levels are estimated using the average changes observed in other OECD countries.
PDR 35.2 Docquier-EPC-Xsp.indd 317 5/27/09 9:12:07 AM

318 A G E N D E R E D A S S E S S M E N T O F H I G H L Y S K I L L E D E M I G R A T I O N
Notes
This article is part of the World Bank’s re-search program on the international migra-tion of women, initiated in December 2005. The research benefited from the financial support of the World Bank (Contract PO. 7620076). The first author also acknowl-edges support from the Belgian Federal Government (P6/07 Economic Policy and Finance in the Global Economy Equilibrium Analysis and Social Evaluation) and from the Marie Curie research training network TOM (Transnationality of Migrants). We thank Caglar Ozden and Maurice Schiff for their comments, as well as Daniel Reyes and Mirja Sjoblom for their help.
1 See Commander et al. (2004) and Docquier and Rapoport (2009) for literature surveys.
2 See Docquier et al. (2007), Beine et al. (2008), Checchi et al. (2007), Kugler and Rapoport (2007), Nimii and Ozden (2006), Javorcik et al. (2006), Grogger and Hanson (2008), Easterly and Nyarko (2005).
3 The “non-economic” literature on the migration of women (mainly based on case studies) has increased since the early 1990s. See, among others, Buijs (1993), Hondagneu-Sotelo (1994), United Nations (1994), Zlotnik (1990, 1995), Sweetman (1998), Cerrutti and Massey (2001), Morrison et al. (2007)
4 In developing countries, the share of women has been relatively stable over time.
5 In the same vein, Klasen (1999) and Dollar and Gatti (1999) demonstrated in cross-country regressions that gender in-equality is a significant constraint on growth, a result confirmed by Blackden et al. (2006) in the case of sub-Saharan Africa.
6 Regressing corrected rates on uncor-rected rates gives an R2 of 0.978, 0.990, and 0.997 for emigrants leaving at ages 22, 18, and 12 years.
7 Hatton and Williamson (2002) es-timate that illegal immigrants residing in OECD countries represent 10 to 15 percent of the total immigrant stock.
8 By contrast, in other OECD countries with restricted access to citizenship (such as Japan, Korea, and Switzerland), the foreign-
born population is substantial (about 20 percent in Switzerland).
9 OECD statistics indicate that 14.4 mil-lion foreign-born individuals were natural-ized between 1991 and 2000. Countries with particularly high numbers of acquisitions of citizenship are the United States (5.6 mil-lion), Germany (2.2 million), Canada (1.6 million), and Australia and France (1.1 mil-lion each).
10 See column 2 in Appendix Table A1.
11 For example, the US Census Bureau considers as natives persons born in the United States, Puerto Rico, or US island ar-eas, or persons born abroad to a US citizen parent or parents (see Malone et al. 2003). France and Denmark use a similar approach. Statistics Netherlands defines first-generation immigrants as persons who are born abroad and have at least one parent who was also born abroad (Alders 2001).
12 In the United States, this includes persons with at least one year of college.
13 Country-level data reveal that the occupational structure of persons with un-known level of education is very similar to the occupational structure of low-skilled workers (and substantially different from that of highly skilled workers). See Debuis-son et al. (2004) on data for Belgium.
14 For example, Australian data mix information about the highest degree and the number of years of schooling.
15 See «http://esa.un.org/unpp».
16 See «http://www.cia.gov/cia/publica tions/factbook».
17 The share of women in the highly skilled immigrant population amounts to 50 percent in the United Kingdom, 50 in the United States, 48 in Canada, 47 in France, and 45 in Germany.
18 Our cross-country results are very similar to those described in Docquier and Marfouk (2006). The correlation between the 1990 and 2000 skilled emigration rates is 94 percent.
19 See United Nations (2006).
PDR 35.2 Docquier-EPC-Xsp.indd 318 5/27/09 9:12:08 AM
F R É D É R I C D O C Q U I E R / B . L I N D S A Y L O W E L L / A B D E S L A M M A R F O U K 319
References
Adams, R. 2003. “International migration, remittances and the brain drain: A study of 24 labor-exporting countries,” World Bank Policy Research Working Paper, no. 2972.
Alders, M. 2001. “Classification of the population with foreign background in the Netherlands,” Statistics Netherlands, paper for the conference “The Measure and Mismeasure of Popu-lations: The Statistical Use of Ethnic and Racial Categories in Multicultural Societies,” CERI-INED, Paris, 17–18 December.
Barro, R. J. and J. W. Lee 2001. “International data on educational attainment: Updates and implications,” Oxford Economic Papers 53: 541–563.
Basu, A.M. 2002. Why does education lead to lower fertility? A critical review of some of the possibilities,” World Development 30(10): 1779–1790.
Behrman, J. R., A. D. Foster, M. R. Rosenzweig, and P. Vashishtha. 1999. “Women’s schooling, home teaching, and economic growth,” Journal of Political Economy 107(4): 682–714.
Beine, M., F. Docquier, and H. Rapoport. 2007. “Measuring international skilled migration: A new database controlling for age of entry,” World Bank Economic Review 21: 249–254.
———. 2008. “Brain drain and human capital formation in developing countries: Winners and losers,” Economic Journal 118(4): 631–652.
Blackden, M., S. Canagarajah, S. Klase, and D. Lawson. 2006. “Gender and growth in sub-Saharan Africa,” UNU-WIDER Research Paper no. 2006-37.
Buijs, G. (ed.). 1993. Migrant Women: Crossing Boundaries and Changing Identities. Oxford: Berg Publishers.
Carrington, W. J. and E. Detragiache. 1998. “How big is the brain drain?,” IMF Working paper WP/98/102.
———. 1999. “How extensive is the brain drain?,” Finance and Development, June: 46–49. Cerrutti, M. and D. S. Massey. 2001. “On the auspices of female migration from Mexico to the
United States,” Demography 38(2): 187–200. Checchi, D., G. De Simone, and R. Faini. 2007. “Skilled migration, FDI and human capital
investment,” IZA Discussion Paper 2795. Chant, S. 1992. Gender and Migration in Developing Countries. New York: Belhaven Press. Clemens, M. A. and G. Pettersson. 2006. “A new database of health professional emigration
from Africa,” Working Paper 95, Center for Global Development. Cohen, D. and M. Soto. 2007. “Growth and human capital: Good data, good results,” Journal
of Economic Growth 12(1): 51–76. Collinson, M., S. Tollman, K. Kahn, and S. Clark. 2003. “Highly prevalent circular migration:
Households, mobility and economic status in rural South Africa,” paper presented at the Conference on Migration in Comparative Perspective, Johannesburg, South Africa, 4–7 June.
Commander, S., M. Kangasniemi, and L. A.Winters. 2004. “The brain drain: A review of theory and facts,” Brussels Economic Review 47(1), Special Issue on Skilled Migration: 29–44.
Coulombe, S. and J-F. Tremblay. 2006. “Literacy and growth,” Topics in Macroeconomics 6(2): article 4.
Curran, S. R. and E. Rivero-Fuentes. 2003. “Engendering migrant networks: The case of Mexi-can migration,” Demography 40: 289–307.
Debuisson, M., F. Docquier, A. Noury, and M. Nantcho. 2004. “Immigration and aging in the Belgian regions,” Brussels Economic Review 47(1), Special issue on Skilled Migration: 138–158.
Defoort, C. 2008. “Long-term trends in international migration: An analysis of the six main receiving countries,” Population-E 63(2): 285–318.
De la Fuente, A. and R. Domenech. 2002. “Human capital in growth regressions: How much difference does data quality make? An update and further results,” CEPR Discussion Paper no. 3587.
Docquier, F. and A. Bhargava. 2006. “Medical brain drain: A new panel data set on physicians’ emigration rates (1991–2004),” Report, World Bank, Washington DC.
PDR 35.2 Docquier-EPC-Xsp.indd 319 5/27/09 9:12:08 AM

320 A G E N D E R E D A S S E S S M E N T O F H I G H L Y S K I L L E D E M I G R A T I O N
Docquier, F., O. Lohest, and A. Marfouk. 2007. “Brain drain in developing countries,” World Bank Economic Review 21: 193– 218.
Docquier, F. and A. Marfouk. 2006. “International migration by educational attainment (1990–2000),” in C. Ozden and M. Schiff (eds.). International Migration, Remittances and Development. New York: Palgrave Macmillan.
Docquier, F. and H. Rapoport. 2009. “Skilled migration: The perspective of sending countries,” in J. Bhagwati and G. Hanson (eds.), Skilled Immigration Today: Prospects, Problems, and Policies. Oxford University Press.
Dollar, D. and R. Gatti. 1999. “Gender inequality, income and growth: Are good times good for women?,” Policy Research Report on Gender and Development, Working Paper Series no. 1, World Bank.
Dumont, J. C. and G. Lemaître. 2004. “Counting immigrants and expatriates in OECD coun-tries: A new perspective,” OECD. mimeo.
Dumont, J. C., J. P. Martin, and G. Spielvogel. 2007. “Women on the move: The neglected gender dimension of the brain drain,” IZA Discussion Paper no. 2920.
Easterly, W. and Y. Nyarko. 2005. “Is the brain drain good for Africa?,” New York University, mimeo.
Grogger, J. and G. H. Hanson. 2008. “Income maximization and the sorting of emigrants across destinations,” paper presented at the Conference on Migration and Development, Lille, France, 26–28 June.
Haveman, R. and B. Wolfe 1995. “The determinants of children’s attainments—A review of methods and findings,” Journal of Economic Literature 33(4): 1829–1878.
Hatton, T. J. and J. G. Williamson. 2002. “What fundamentals drive world migration?,” NBER Working Paper no. 9159.
Hondagneu-Sotelo, P. 1994. Gendered Transitions: Mexican Experiences of Immigration. Berkeley: University of California Press.
Javorcik, B. S., C. Ozden, M. Spatareanu, and C. Neagu. 2006. “Migrant networks and foreign direct investment,” Policy Research Working Paper no. WPS 4046, World Bank.
Klasen, S. 1999. “Does gender inequality reduce growth and development? Evidence from cross-country regressions,” Policy Research Report on Gender and Development, Work-ing Paper Series no.7, World Bank.
Knowles, S., P. K. Lorgelly, and P. D. Owen. 2002. “Are educational gender gaps a brake on economic development? Some cross-country empirical evidence,” Oxford Economic Papers 54(1): 118–149.
Kugler, M. and H. Rapoport. 2007. “International labour and capital flows: Substitutes or complements?,” Economics Letters 92(2): 155–162.
Malone, N., K. F. Baluja, J. M. Costanzo, and C. J. Davis. 2003. “The foreign-born population: 2000,” Census 2000 brief, C2KBR-34, U.S. Census Bureau.
Morrison, A. R., M. Schiff, and M. Sjöblom. 2007. The International Migration of Women. Palgrave Macmillan.
Nimii, Y. and C. Ozden. 2006. “Migration remittances and the brain drain: Causes and link-ages,” World Bank (mimeo).
Pearce, S. C. 2006. “Immigrants women in the United States: A demographic portrait,” Special report, Immigration Policy Center, Summer.
Quisumbing, A. 2003. Household Decisions, Gender and Development: A Synthesis of Recent Research. Baltimore: John Hopkins University Press for the International Food Policy Research Institute.
Summers, L. H. 1992. “Investing in all the people,” Pakistan Development Review 31(4): 367–406.
Sweetman, C. 1998. “Gender and migration,” Oxfam Focus on Gender. UK: Oxfam. United Nations. 1994. The Migration of Women: Methodological Issues in the Measurement and Analysis
of Internal and International Migrants. Santo Domingo, Dominican Republic: United Na-tions International Research and Training Institute for the Advancement of Women (INSTRAW).
PDR 35.2 Docquier-EPC-Xsp.indd 320 5/27/09 9:12:08 AM
F R É D É R I C D O C Q U I E R / B . L I N D S A Y L O W E L L / A B D E S L A M M A R F O U K 321
———. 2006. World Survey on the Role of Women in Development: Women and International Migration, Department of Economic and Social Affairs. New York: United Nations.
Vanwey, J. L. K. 2004. “Altruistic and contractual remittances between male and female mi-grants and households in rural Thailand,” Demography 41(4): 739–756.
World Bank. 2007. “Confronting the challenges of gender equality and fragile states,” Global Monitoring Report. Washington: The World Bank.
Zlotnik, H. 1990. “International migration policies and the status of female migrants,” Interna-tional Migration Review 24(2): 372–381.
———. 1995. “The south-to-north migration of women,” International Migration Review 29(1): 229–254.
PDR 35.2 Docquier-EPC-Xsp.indd 321 5/27/09 9:12:08 AM

A Gendered Assessment of Highly Skilled Emigration
FRÉDÉRIC DOCQUIER
B. LINDSAY LOWELL
ABDESLAM MARFOUK
Although women form a large and increasing proportion of international migrants, wom-en’s mobility has generally been overlooked in the literature. Quantifying and character-izing female migration should lead to a better understanding of the forces that shape inter-national migration. We build an original data set providing gender-disaggregated indicators of international migration by educational attainment for 195 source countries in 1990 and 2000. We find that women represent an increasing share of the immigration stock in the OECD countries and they exhibit higher skilled emigration rates than men.
FRÉDÉRIC DOCQUIER is Research Associate, National Fund for Scientific Research, and Professor of Economics, IRES, Université Catholique de Louvain.
B. LINDSAY LOWELL is Director of Policy Studies, Institute for the Study of International Migration, Georgetown University.
ABDESLAM MARFOUK is Researcher, Université Libre de Bruxelles.
PDR 35.2 Docquier-EPC-Xsp.indd 322 5/27/09 9:12:09 AM


![]Global Migration of the Highly Skilled](https://static.fdocuments.net/doc/165x107/5695d1931a28ab9b029714fb/global-migration-of-the-highly-skilled.jpg)