A Fistful of Dollars: Lobbying and the Financial rio 2010/2010-05-26_Tressel. · PDF...
41
A Fistful of Dollars: Lobbying and the Financial Crisis † Deniz Igan, Prachi Mishra, and Thierry Tressel Research Department, IMF ‡ May 06, 2010 Abstract Has lobbying by financial institutions contributed to the financial crisis? This paper uses detailed information on financial institutions’ lobbying and mortgage lending activities to answer this question. We find that lobbying was associated with more risk-taking during 2000-07 and with worse outcomes in 2008. In particular, lenders lobbying more intensively on issues related to mortgage lending and securitization (i) originated mortgages with higher loan-to-income ratios, (ii) securitized a faster growing proportion of their loans, and (iii) had faster growing originations of mortgages. Moreover, delinquency rates in 2008 were higher in areas where lobbying lenders’ mortgage lending grew faster. These lenders also experienced negative abnormal stock returns during the rescue of Bear Stearns and the collapse of Lehman Brothers, but positive abnormal returns when the bailout was announced. Finally, we find a higher bailout probability for lobbying lenders. These findings suggest that lending by politically active lenders played a role in accumulation of risks and thus contributed to the financial crisis. JEL Classification Numbers: G21, P16 Keywords: Lobbying, Financial Crises, Mortgage Lending † We would like to thank the participants at the IMF Research Brown Bag Seminar, 2009 NBER Summer Institute, Center for Analytical Finance (Indian School of Business) 2009 Summer Research Conference in Finance, World Bank Macroeconomics Seminar, De Nederlandsche Bank 12 th Annual Research Conference, Wharton/FIRS/JFI Workshop on the Financial Crisis, IMF 10 th Jacques Polak Annual Research Conference, Toulouse School of Economics Conference on the Political Economy of the Financial Crisis, University of Maryland, and 2010 NBER Political Economy Program Meeting for useful discussions and suggestions. Sumit Aneja, Mattia Landoni, and Lisa Kolovich provided excellent research assistance. Deniz Igan: [email protected] ; Prachi Mishra: [email protected] ; Thierry Tressel: [email protected]. ‡ The views expressed here are those of the authors and do not necessarily represent those of the IMF or IMF policy.
Transcript of A Fistful of Dollars: Lobbying and the Financial rio 2010/2010-05-26_Tressel. · PDF...

A Fistful of Dollars:
Lobbying and the Financial Crisis†
Deniz Igan, Prachi Mishra, and Thierry Tressel Research Department, IMF‡
May 06, 2010
Abstract
Has lobbying by financial institutions contributed to the financial crisis? This paper uses detailed information on financial institutions’ lobbying and mortgage lending activities to answer this question. We find that lobbying was associated with more risk-taking during 2000-07 and with worse outcomes in 2008. In particular, lenders lobbying more intensively on issues related to mortgage lending and securitization (i) originated mortgages with higher loan-to-income ratios, (ii) securitized a faster growing proportion of their loans, and (iii) had faster growing originations of mortgages. Moreover, delinquency rates in 2008 were higher in areas where lobbying lenders’ mortgage lending grew faster. These lenders also experienced negative abnormal stock returns during the rescue of Bear Stearns and the collapse of Lehman Brothers, but positive abnormal returns when the bailout was announced. Finally, we find a higher bailout probability for lobbying lenders. These findings suggest that lending by politically active lenders played a role in accumulation of risks and thus contributed to the financial crisis. JEL Classification Numbers: G21, P16 Keywords: Lobbying, Financial Crises, Mortgage Lending
† We would like to thank the participants at the IMF Research Brown Bag Seminar, 2009 NBER Summer Institute, Center for Analytical Finance (Indian School of Business) 2009 Summer Research Conference in Finance, World Bank Macroeconomics Seminar, De Nederlandsche Bank 12th Annual Research Conference, Wharton/FIRS/JFI Workshop on the Financial Crisis, IMF 10th Jacques Polak Annual Research Conference, Toulouse School of Economics Conference on the Political Economy of the Financial Crisis, University of Maryland, and 2010 NBER Political Economy Program Meeting for useful discussions and suggestions. Sumit Aneja, Mattia Landoni, and Lisa Kolovich provided excellent research assistance. Deniz Igan: [email protected]; Prachi Mishra: [email protected]; Thierry Tressel: [email protected].
‡ The views expressed here are those of the authors and do not necessarily represent those of the IMF or IMF policy.
2
I. INTRODUCTION
On December 31, 2007, the Wall Street Journal reported that Ameriquest Mortgage and
Countrywide Financial, two of the largest mortgage lenders in the U.S., spent respectively
$20.5 million and $8.7 million in political donations, campaign contributions, and lobbying
activities from 2002 through 2006.1 The sought outcome, according to the article, was the
defeat of anti-predatory lending legislation that could have mitigated reckless lending
practices and the consequent rise in delinquencies. Such anecdotal evidence suggests that the
political influence of the financial industry contributed to the 2007 mortgage crisis, which, in
the fall of 2008, generalized in the worst bout of financial instability since the Great
Depression.2 In spite of the importance of these claims, formal analysis of the political
economy factors underlying the crisis has so far remained scant.
This paper asks whether lobbying lenders behaved differently from non-lobbying lenders in
the 2000-07 period and how they performed in 2008. To the best of our knowledge, this is
the first study that examines empirically the relationship between lobbying by financial
institutions and mortgage lending in the U.S. We construct a unique dataset combining
information on mortgage lending activities and lobbying at the federal level. By going
through individual lobbying reports, we identify all federal bills targeted by the financial
industry lobbying, and focus on the lobbying specifically aimed at rules and regulations of
consumer protection in mortgage lending, underwriting standards, and securities laws
(henceforth, the “specific issues”).3
1 Simpson, Glenn, 2008, “Lender Lobbying Blitz Abetted Mortgage Mess,” The Wall Street Journal, December 31; available at http://online.wsj.com/public/article_print/SB119906606162358773.html. See also the Financial Times front page coverage of the Center for Public Integrity study linking subprime originators (a large share of which are now bankrupt) to lobbying efforts to prevent tighter regulations of the subprime market (May 06, 2009, “U.S. banks spent $370 million to fight rules”, May 06, 2009, available at: http://www.ft.com/cfms/s/0/a299a06e-3a9f-11de-8a2d-00144feabdc0.html?nclick_check=1).
2 For a detailed account of the subprime mortgage crisis, see Gorton (2008a, b) and Diamond and Rajan (2009).
3 A sample lobbying report, shown in the appendix Table A2, filed by Bear Stearns and Co. to the Senate‘s Office of Public Records (SOPR) documents that the company lobbied to change regulations related to mortgage lending standards for the period January-June 2007.
3
First, we analyze the relationship between lobbying and ex-ante characteristics of loans
originated. We focus on three measures of mortgage lending: loan-to-income ratio (which
we consider as a proxy for lending standards), proportion of loans sold (negatively correlated
with the quality of loans originated) and mortgage loan growth rates (positively correlated
with risk-taking).4 Controlling for unobserved lender and area characteristics as well as
changes over time in the macroeconomic and local lender and borrower conditions, we find
that lenders that lobbied more intensively (i) originated mortgages with higher loan-to-
income ratios (LIR), (ii) securitized a faster growing proportion of loans originated; and (iii)
had faster growing mortgage loan portfolios.
Next, we analyze measures of ex-post performance of lobbying lenders. In particular, we
explore whether, at the Metropolitan Statistical Area (MSA) level, delinquency rates – an
indicator of loan performance - were linked to the expansion of lobbying lenders’ mortgage
lending. We find that faster relative growth of mortgage loans by lobbying lenders during
2000-06 was associated with higher delinquency rates in 2008. We also carry out an event
study during key episodes of the financial crisis to assess whether the stocks of lobbying
lenders performed differently from those of other financial institutions. We find that
lobbying lenders experienced negative abnormal stock returns at the time of the failures of
Bear Stearns and Lehman Brothers, but positive abnormal returns around the announcement
of the bailout program. Finally, we examine the determinants of how bailout funds were
distributed and find that being a lobbying lender was associated with a higher probability of
being a recipient of these funds.
We perform a number of tests to establish robustness of the results. First, we control for
lender, MSA, and time fixed effects as well as various lender-MSA-time-varying controls.
Second, we conduct falsification tests by exploiting information about lobbying on financial
issues that are unrelated to mortgage lending and securitization. Next, we adopt a difference-
in-difference strategy to test whether the characteristics of mortgage loans originated by 4 Securitization may weaken monitoring incentives leading to lower-quality loans, hence increasing risk in the financial system. This is why increasing recourse to securitization may be a sign of riskier loan origination. For an analysis of the correlation between fast credit growth and risk, see Dell’Ariccia and Marquez (2006).

4
lobbying lenders responded differently to the introduction of anti-predatory lending laws at
the state level, than those originated by other lenders. Finally, we adopt an instrumental
variable strategy using as instrument the distance between the headquarters of the financial
institution and Washington, D.C., which is exogenous and proxies for the cost of lobbying.
(Details on these are in Section V.)
Our findings indicate that lobbying was associated ex ante with more risk-taking and ex post
with worse performance. This is consistent with some lenders being more likely to benefit
from lax regulation: these lenders lobbied more aggressively; the ensuing lax regulatory
environment allowed them to engage in riskier lending; and such lending exposed them,
directly or indirectly, to worse outcomes during the crisis. Interestingly, the market
anticipated lobbying lenders to benefit more from the bailout, and they indeed did, perhaps
because they were hit harder by the crisis and/or because they had closer connections to
policymakers.
Why are some lenders more likely to benefit from lax regulation? These lenders, for
example, may be specialized in catering to riskier borrowers. Or, they may be overoptimistic
and may have honestly underestimated the likelihood of an adverse shock. Then, these
lenders may have lobbied to signal their private information to the policymaker and prevent
tighter regulation that would otherwise have restricted profitable lending opportunities. If
lobbying lenders are specialized or overoptimistic, their motive for lobbying is consistent
with information-based theories. Alternatively, some lenders may have distorted incentives
and might have lobbied to create a regulatory environment that allows them to exploit short-
term gains at the cost of long-term profits. An extreme view could be that certain lenders
engaged in specialized rent-seeking and lobbied to increase their chances of preferential
treatment, e.g., a lower probability of scrutiny by bank supervisors or even a higher
probability of being bailed out in the event of a financial crisis.5 If lobbying lenders are
short-termist or lobby to increase their chances of preferential treatment, the motive for
lobbying involves moral hazard elements and seems to fit better with theories of rent seeking.
5 See Acemoglu (2009) for a similar argument on how financial industry sets its own rules.

5
Overall, our findings suggest that the political influence of the financial industry played a
role in the accumulation of risks, and hence, contributed to the financial crisis.6 But, it is
hard to distinguish whether it was information-revealing or rent-seeking that drove lobbying
by the financial industry. There is evidence suggesting that lobbying was not motivated
solely by information dissemination. Still, the findings fall short of firmly establishing the
existence of rent-seeking motives.
The rest of the paper is organized as follows. Section II discusses the related literature.
Section III provides some background for the empirical specifications. Section IV describes
the dataset. Section V presents the results and Section VI concludes.
II. RELATED LITERATURE
Lobbying is broadly defined as a legal activity aiming at changing existing rules or policies
or procuring individual benefits. Private benefits could materialize in the form of preferential
access to credit, bailout guarantees, privileged access to licenses, or procurement contracts
(Fisman, 2001, Johnson and Mitton, 2003, and Faccio and Parsley, 2006). Building upon the
private-interest theories of regulation (Stigler, 1971), research on lobbying has developed
into two broad strands: studies that focus on the relationship between lobbying activities and
specific policies (see, for instance, Grossman and Helpman, 1994, Goldberg and Maggi,
1999, and Ludema, Mayda, and Mishra, 2009, for the case of trade policy, Facchini, Mayda
and Mishra, 2008, for the case of immigration policy, Kroszner and Stratmann, 1998, and
Kroszner and Strahan, 1999, for financial services) and those that aim to explore the
consequences of lobbying on firm-specific economic outcomes (see, for example, Bertrand et
al., 2004, and Claessens et al., 2008). Issues specific to banking and finance have been
studied by, among others, Khwaja and Mian (2005), who find that in Pakistan politically-
connected firms obtain exclusive loans from public banks and have much higher default
rates; Raddatz and Braun (2009), who present evidence suggesting that politicians provide
for beneficial regulation in exchange for a non-executive position at a bank in the future,
6 See Johnson (2009) for a similar view.

6
consistent with a capture-type private interest story; and Faccio (2006), who shows that
political connections increase firm value. Our study, focusing on lobbying and lending
behavior, fits more closely in the second strand.
Our paper is also related to the emerging literature on the current crisis. While this literature
has characterized the relaxation of lending standards and its link to increasing defaults in
mortgage markets, evidence on the role of political economy factors remain scarce.7 Igan
and Landoni (2008) study the relationship between anti-predatory lending laws and campaign
contributions and show that contributions increase after a law comes into effect. Mian, Sufi
and Trebbi (forthcoming) focus on the consequences of financial crisis showing that
constituent and special interests theories explain voting on key bills in 2008. In contrast to
these papers, we study the role of political economy factors in shaping lending behavior
during the credit boom and the impact on loan outcomes during the crisis.
III. BACKGROUND
Certain firm characteristics may drive both the decision to lobby and lending behavior.
Examples of such characteristics include screening technology, underwriting and
securitization techniques, specialization of the lender, or the capacity to acquire private
information regarding future states of the world. Given such characteristics, certain lenders
would make riskier loans, and also have more to gain from a relaxation of the regulatory
rules that limit risk-taking. In order to ensure that the regulatory environment
remains/becomes lax, these lenders would lobby more intensively against tighter rules and
regulations so that they can continue/start making risky loans. Consider a simple example
where lender i has a comparative advantage due to a lower cost of securitizing loans. In that
case, any regulation that reduces restrictions on securitization activities may generate higher
gains for lender i compared to other lenders with higher costs. Hence, the benefits from
7 For instance, Mayer, Pence and Sherlund (2009) show that no-documentation, no down-payment loans represented a large share of rapidly-growing subprime lending between 2001 and 2006. Mian and Sufi (2009) find that the expansion in subprime lending is highly correlated with the increase in securitization, a finding consistent with distorted incentives. Dell’Ariccia, Igan, and Laeven (2008) provide evidence that areas in which lenders relaxed loan standards more also experienced larger increases in subprime delinquency rates.

7
lobbying for such regulations would be higher for lender i . Lender i would therefore lobby
more than other lenders at time t , even if other lenders may free-ride and also benefit (but to
a lesser extent) from lax regulations because of higher gains that accrue to him from
lobbying.8 If lobbying efforts are successful and the rules are not tightened, this would allow
lender i to engage in riskier lending in period 1+t and in subsequent periods. Although the
new rules would apply to all lenders, lender i has a comparative advantage, which enables
him to take more risks under these rules compared to other lenders. Moreover, given their
risky portfolios, lender i would be more likely to experience worse loan outcomes and
experience higher losses, if hit by adverse shocks.
For example, Citigroup lobbied intensively against H.R. 1051 -- Predatory Lending
Consumer Protection Act of 2001 (spending a total of $3 million over January-June 2002 on
this and other issues related to mortgage and securities markets), which aimed to put tighter
restrictions on lenders (see Appendix for more details on the bill), and this was never signed
into law. Indeed, during 1999-2006, 93 percent of all the bills promoting tighter regulation
were never signed into law. Importantly, two key pieces of legislation to promote lax
lending in mortgage markets - American Homeownership and Economic Opportunity Act of
2000, and American Dream Downpayment Act of 2003 - were in fact signed into law.
The lax regulatory environment that emerged allowed lenders to engage in riskier lending
during 2000-07; and end up with worse outcomes during the crisis. To illustrate with an
example, the Wall Street Journal on December 31st, 2007 reported
“Data from federal and state campaign-finance records, Internal Revenue Service filings, and the National Institute on Money in State Politics show that from 2002 through 2006, Ameriquest, its executives and their spouses and business associates donated at least $20.5 million to state and federal political groups. […] Ameriquest became a player in the business of lending to low-income homeowners. The company persuaded many homeowners to take cash out of their houses by refinancing them for larger amounts than their existing
8 For example, among the top twenty lenders lobbying on specific issues, six were also among the top ten underwriters of collateralized debt obligations during 2005-08 (“Vampire squished”, The Economist, April 24 2010).

8
mortgages. […] Home loans made by Ameriquest and other subprime lenders are defaulting now in large numbers.”
This mechanism implies that one would observe lobbying in period t to be associated with
riskier lending behavior in period t+1. The empirical specifications discussed below are
based on this mechanism.
Once the financial crisis hit and the government was forced to intervene, the factors that
determined who would be bailed out included, e.g., how badly the financial institution was
hurt, how systematically important it was, how healthy the balance sheets were, and perhaps
how well connected the institution was to the politicians. For instance, the Wall Street
Journal on January 23rd, 2009 reported
“Troubled OneUnited Bank in Boston didn't look much like a candidate for aid from the Treasury Department's bank bailout fund last fall. […] Nonetheless, in December OneUnited got a $12 million injection from the Treasury's Troubled Asset Relief Program, or TARP. One apparent factor: the intercession of Rep. Barney Frank, the powerful head of the House Financial Services Committee. […] Some powerful politicians have used their leverage to try to direct federal millions toward banks in their home states. "It's totally arbitrary," says South Carolina Gov. Mark Sanford. "If you've got the right lobbyist and the right representative connected to Washington or the right ties to Washington, you get the golden tap on the shoulder".”
The channels highlighted in such anecdotes suggest that one is likely to observe an empirical
association between lobbying and ex-post performance as well as the likelihood of bailout in
2008. This motivates our empirical analysis of outcomes during the crisis.
IV. DATA DESCRIPTION
A. Mortgage Lending
Mortgage lenders are required to provide detailed information on the applications they
receive and the loans they originate under the Home Mortgage Disclosure Act (HMDA).
Enacted by Congress in 1975, HMDA data covers a broad set of depository and non-
depository financial institutions. Comparisons of the total amount of loan originations in the
HMDA and industry sources indicate that around 90 percent of the mortgage lending activity

9
is covered in this database. Our coverage of HMDA data is from 1999 to 2007 to match the
lobbying database. We collapse the data to MSA-lender level with 378 MSAs and almost
9000 lenders. Then, we construct our variables of interest: loan-to-income ratio at
origination, loan securitization rates, mortgage loan growth rate, and the extent of activity by
lobbying lenders at the MSA level.
B. Lobbying
Lobbyists in the U.S. - often organized in special interest groups - can legally influence the
policy formation process through two main channels. First, they can offer campaign finance
contributions, in particular through political action committees (PACs). These activities have
received a fair amount of attention in the literature.9 Second, they are allowed to carry out
lobbying activities in the executive and legislative branches of the federal government.
These lobbying activities, albeit accounting for the bulk of politically-targeted expenditures,
have in contrast received scant attention in the literature. Individual companies and
organizations have been required to provide a substantial amount of information on their
lobbying activities starting with the introduction of the Lobbying Disclosure Act of 1995.
Since 1996, all lobbyists (intermediaries who lobby on behalf of companies and
organizations) have to file semi-annual reports to the Secretary of the Senate’s Office of
Public Records (SOPR), listing the name of each client (firm), the total income they have
received from each of them, and specific lobbying issues. In parallel, all firms with in-house
lobbying departments are required to file similar reports stating the total dollar amount they
have spent (either in-house or in payments to external lobbyists). Legislation requires the
disclosure not only of the dollar amounts actually received/spent, but also of the issues for
which lobbying is carried out. Thus, unlike PAC contributions, lobbying expenditures of
companies can be associated with very specific, targeted policy areas. Such detailed
information is reported by roughly 9000 companies, around 600 of which are in the finance,
insurance and real estate (FIRE) industry.
9 See, for instance, Snyder (1990), Goldberg and Maggi (1999), Gawande and Bandyopadhyay (2000).

10
C. Other Data
We supplement the information from the lobbying and HMDA databases with MSA-level
and state-level data on economic and social indicators such as income, unemployment,
population, and house price appreciation.10 We also obtain data on delinquent loans from
LoanPerformance, a private data company. The stock price return is computed using data
from Compustat. The information on the enactment of anti-predatory lending laws is from
Bostic et al (2008).11 Finally, the data on the 2008 bailout program is based on original
records provided by the Treasury through the Office of Financial Stability.12
D. Construction of the Dataset
Matching Lobbying Firms to Lenders
The matching of the lobbying and HMDA databases is a tedious task. We use an algorithm
that finds common words in lender names to narrow down the potential matches in HMDA
of lenders in the lobbying database and then go through these one by one to determine the
right match. We examine meticulously the corporate structure of the firms in the lobbying
database and that may be a match to a HMDA lender based on our algorithm (see Appendix
for more details). We create four lobbying identifiers reflecting several types of matches: (i)
exact matches; (ii) matches to parent firm; (iii) matches to affiliated firms; and (iv) matches
to subsidiaries. The lobbying variables used in the regressions combine these four variables.
We also consider lobbying expenditures by associations. The list of member firms for each
association in the lobbying database is compiled by going on each association’s website. A
portion of the associations’ lobbying expenditures is assigned to each member firm based on
the share of its own spending in the total of all members.
10 Data sources include the Bureau of Economic Analysis (BEA), the Bureau of Labor Statistics (BLS), the Census Bureau, and the Office of Federal Housing Enterprise Oversight (OFHEO).
11 North Carolina was the first state to pass an anti-predatory lending law in 1999 and other states followed suit. By 2007, all but six states have some form of anti-predatory lending law in place.
12 The data can be downloaded from http://bailout.propublica.org/main/list/index.

11
Identifying Lobbying Activity Targeted to the Mortgage Market
Our analysis distinguishes between lobbying activities that are related to mortgage-market-
specific issues from other lobbying activities. We first concentrate only on issues related to
the five general issues of interest (accounting, banking, bankruptcy, housing, and financial
institutions) and then gather information on the specific issues, which are typically acts
proposed at the House or the Senate, that were listed by the lobbyists as the main issue for
the lobbying activity.13 Then, we go through these specific issues one by one and determine
whether an issue can be directly linked to restrictions on mortgage market lending. For
example, H.R. 1163 of 2003 (Predatory Mortgage Lending Practices Reduction Act) and
H.R. 4471 of 2005 (Fair and Responsible Lending Act), regulating high-cost mortgages, are
bills that we deem to be relevant to the mortgage market. On the other hand, H.R. 2201 of
2005 (Consumer Debt Prevention and Education Act) and the Sarbanes-Oxley Act of 2002,
although in general related to financial services, do not include any provisions directly
related to mortgage lending and are not classified as mortgage-market-specific issues.
After classifying all listed issues, we calculate lobbying expenditures on specific issues by
splitting the total amount spent evenly across issues. To be more precise, we first divide the
total lobbying expenditure by the number of all general issues and multiply by the number of
general issues selected. Then, we divide this by the total number of specific issues listed
under the five general issues and multiply by the number of specific issues of interest.14 In
order to illustrate the construction of the final lobbying variable, suppose firm A spends
$300, and lobbies on 3 general issues (banking and housing – general issues of interest -- and
trade – not a general issue of interest); it lists 2 specific issues under banking and housing
(H.R. 1163, which is a relevant specific issue and H.R. 2201, which is not relevant). In this
example, the final lobbying expenditure variable is calculated as ((300/3)*2)/2)*1=$100.
13 ‘General issue area codes’ are provided by the SOPR and listed in line 15 of the lobbying reports while the ‘specific lobbying issues’ are listed in line 16. See Appendix for more details on what the reports look like and a full list of general issues as well as that of specific issues selected for the analysis.
14 For robustness, we adopt an alternative splitting approach that distributes expenditures using as weights the proportion of reports that mention the specific issues of interest. The results remain the same.

12
E. Summary Statistics
As shown in Table 1, between 1999 and 2006, interest groups have spent on average about
$4.2 billion per political cycle on targeted political activity, which includes PAC campaign
contributions and lobbying expenditures. Lobbying expenditures represent by far the bulk of
all interest groups’ money spent on targeted political activity (close to 90 percent).
Expenditures by FIRE companies constitute roughly 15 percent of overall lobbying
expenditures in any election cycle. Approximately 10 percent of all firms that lobbied during
this time period were associated with FIRE. Moreover, the lobbying intensity for FIRE
increased at a much faster pace relative to the average lobbying intensity over 1999–2006
(Figure 1). Similar inspection of the HMDA database reveals time trends indicating higher
LIR and increased recourse to securitization (Figure 2).
Our matching process ends up matching around 250 firms in the lobbying database to one or
more lenders in the HMDA database, corresponding to roughly 40 percent of FIRE firms that
lobby. In the final MSA-lender-year level dataset, lenders that lobby on specific issues
comprise around 11 percent of the observations. Lobbying was performed by the lender
itself in 25 percent of these observations and by the parent financial institution, affiliated
firms, and subsidiaries in 65, 23, and 5 percent respectively. This suggests that it was mainly
the parent firms, which are likely to be large, national financial institutions or holding
groups, that lobbied on specific issues relevant for their subsidiaries. In terms of magnitudes,
the matched lenders spent in total roughly half a billion dollars for lobbying on specific
issues during 1999-2006. Lobbying expenditures by lenders’ associations during the same
period remained comparatively small (8 percent of total spent).
As shown in Figure 3, lobbying lenders (i) tend to be larger either by assets or market share,
(ii) less likely to be HUD-regulated, (iii) more likely to be subprime, and (iv) cater to richer
borrowers. In terms of measures of lending, they had (i) slightly higher LIRs (ii) lower
tendency to securitize, and (iii) faster growing loan portfolios. In addition, lobbying lenders

13
were significantly more likely to be bailed out.15 In the following section, we examine these
relationships rigorously. Summary statistics on the variables used in the empirical analysis
are shown in Table 2.
V. EMPIRICAL ANALYSIS
This section presents the empirical specifications and regression results, based on the
mechanisms discussed in Section III. First, we analyze the relationship between lobbying
and the ex-ante characteristics of loans originated (the loan-to-income ratio; the proportion of
loans sold; the growth rate of loans originated). Second, we explore the relationship between
lobbying and ex-post outcomes (delinquency rates; stock returns during the crisis; likelihood
of being bailed-out).
A. Empirical Analysis of Loan-to-Income Ratio
We estimate the following panel equation:
imttmtmimtiimt vvZly εππλβα ++++⋅+⋅+= * (1)
where imty is a measure of loan characteristics for lender i , in MSA m during year t . il is a
dummy for lenders that lobby the federal government on specific issues.16 imtZ denotes a set
of control variables at the lender-MSA level. mv and tπ denote a set of MSA and year fixed
effects respectively. tmv π* captures the effect of all MSA-time varying factors on loan
characteristics, which are constant across lenders. MSA fixed effects control for any time-
invariant MSA level omitted variable, which could be correlated with lobbying and also
affect loan characteristics. In addition, the interaction between MSA and year effects, allows
us to capture any time-varying MSA characteristics. Time effects control for global shocks
15 Sixteen of the twenty lenders that spent the most on lobbying between 2000 and 2006 received funds provided by the government under the TARP. In total, lenders that lobbied on specific issues received almost 60 percent of the funds allocated.
16 Recall from Section IV that lobbying activities are reported at the lender level and do not vary across MSAs.

14
affecting all lenders and areas equally. The parameter of interest is β , which captures
average differences in mortgage loan characteristics between lenders that lobby and lenders
that do not lobby.17
Our main variable capturing ex-ante characteristics is the loan-to-income ratio (LIR)
averaged at the lender-MSA level. This measure is a simplified version of a commonly used
indicator, debt-to-income ratio, to determine whether a borrower can afford a mortgage loan.
Lenders usually require that mortgage payments cannot exceed a certain proportion of the
applicant’s income.18 As the maximum proportion allowed increases, the burden of servicing
the loan becomes harder and the default probability potentially increases. We compute the
LIR as a proxy for such limits required by the lender and interpret increases in this ratio that
are not explained by lender, location characteristics or by time fixed effects as a loosening in
lending standards.
Table 3 presents the regression results of the LIR of originated loans on a dummy variable
for lenders lobbying on specific issues. The coefficient on this dummy variable is positive
and statistically significant at the 1 percent level in all the specifications, establishing that
mortgage loans originated by lenders lobbying on specific issues have higher LIR on
average. This finding remains unaffected when controlling for observable MSA and lender-
MSA characteristics (Column (2)). Lender-MSA level control variables ensure that the
estimated coefficient on the dummy for lobbying lenders does not reflect characteristics such
as the size of the lender (proxied by log of assets), the market power of the lender in a
particular MSA (proxied by its market share), or other factors proxying for observable and
unobservable characteristics of a lender’s pool of applicants such as (i) whether the lender
focuses on community development mortgages or has a brokerage-type business model
(proxied by a dummy for HUD-regulated lenders), (ii) whether the lender specializes in
17 Free-riding problems may bias the estimated coefficient if lenders also benefit from lobbying activities of others. However, the bias will be small if the externality is common to all other lenders, as the average effect of the externality will be absorbed by year fixed effects (or by MSA-year fixed effects if the externality to other lenders depends on the MSAs in which a lender is active).
18 See, for instance, Sirota (2003).

15
subprime lending, and (iii) the average income of applicants of loans originated by the lender
in a particular MSA. Moreover, the size of the coefficient increases as control variables are
added to the regression suggesting that omitted variables at the MSA level and at the lender-
MSA level may have resulted in attenuation bias.
Adding MSA, year, and MSA-year fixed effects does not affect the magnitude or the
significance of the estimated coefficients (Columns (4) and (5)). This set of fixed effects
confirm that our results do not reflect unobserved, either time-invariant or time-varying MSA
characteristics, or time effects common to all MSAs. Importantly, MSA-year interactions in
column (5) guarantee that the estimated effect is not biased due to, for example, the average
quality of the borrower pool at the MSA level. If the relationship between lobbying and loan
characteristics reflected mainly a specialization of lenders, we should expect the estimated
coefficient to become smaller and insignificant when we include controls for lender
characteristics such as whether she is regulated by the HUD or is classified as a subprime
lender by the HUD. We find, on the contrary, that the estimated coefficient becomes larger.
This evidence casts some doubt that lender specialization could be the explanation for the
difference in loan characteristics between lobbying lenders and other lenders.
The magnitude of the difference in LIR between lobbying lenders and other lenders is not
trivial. The estimated coefficient of 0.15 in Column (5) implies that the average LIR of
mortgages originated is about 0.15 points higher for lobbying lenders than for other lenders.
This is about 8 percent of the average LIR of 1.97 in the complete sample.
The estimated relationship between LIR and the lobbying decision may reflect a general
propensity to lobby, e.g., in order to gain access to policymakers to get private benefits,
rather than a desire to influence specific rules. Then, we would expect to obtain a similar
result for lenders that lobby on financial sector issues that are unrelated to mortgage markets.
To carry out this falsification exercise, we create a dummy variable for lenders lobbying on
issues that are not related to mortgage lending and securitization, e.g., consumer credit and
security of personal information, financial services other than mortgage lending, anti-money
laundering (henceforth, the “other issues”). We repeat our preferred specification presented
in Column (5), Table 3 by adding the new dummy. Column (6) displays the results. We find
16
that the dummy for lobbying on specific issues has a positive and significant coefficient
while the dummy for lobbying on other issues has a negative and significant sign. This
suggests that the desire to influence specific rules was one of the drivers of lobbying efforts.
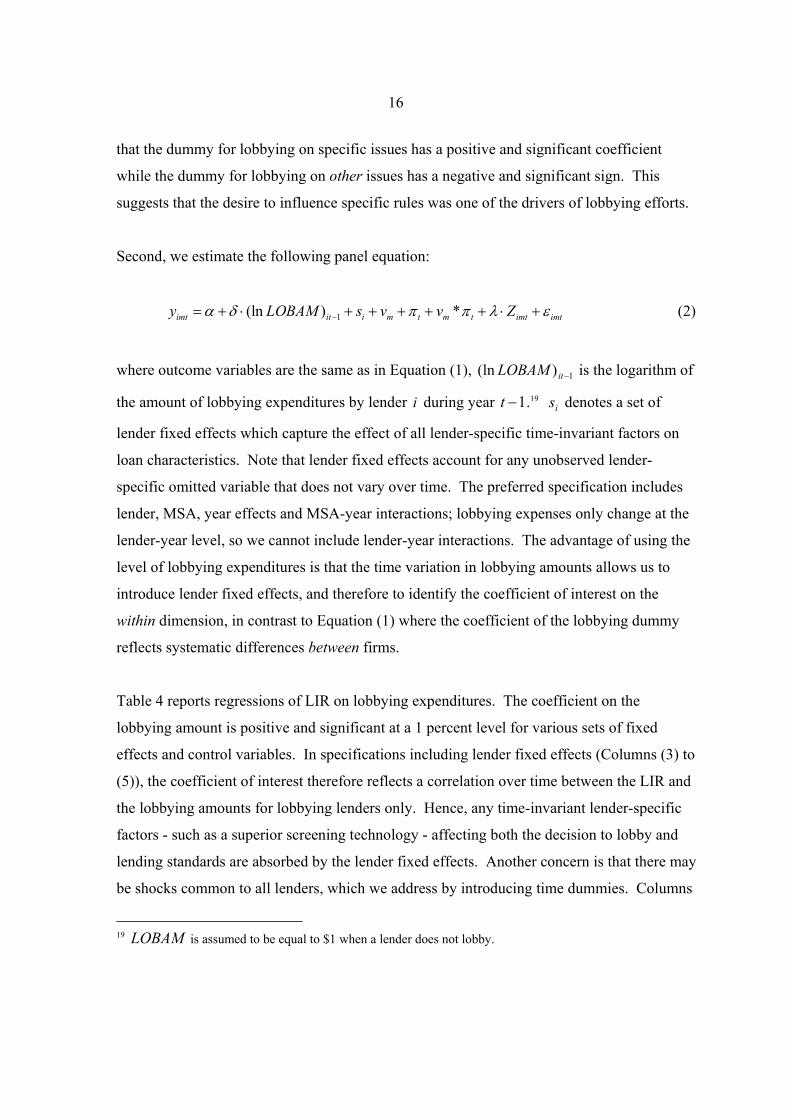
Second, we estimate the following panel equation:
1(ln ) *imt it i m t m t imt imty LOBAM s v v Zα δ π π λ ε−= + ⋅ + + + + + ⋅ + (2)
where outcome variables are the same as in Equation (1), 1)(ln −itLOBAM is the logarithm of
the amount of lobbying expenditures by lender i during year 1−t .19 is denotes a set of
lender fixed effects which capture the effect of all lender-specific time-invariant factors on
loan characteristics. Note that lender fixed effects account for any unobserved lender-
specific omitted variable that does not vary over time. The preferred specification includes
lender, MSA, year effects and MSA-year interactions; lobbying expenses only change at the
lender-year level, so we cannot include lender-year interactions. The advantage of using the
level of lobbying expenditures is that the time variation in lobbying amounts allows us to
introduce lender fixed effects, and therefore to identify the coefficient of interest on the
within dimension, in contrast to Equation (1) where the coefficient of the lobbying dummy
reflects systematic differences between firms.
Table 4 reports regressions of LIR on lobbying expenditures. The coefficient on the
lobbying amount is positive and significant at a 1 percent level for various sets of fixed
effects and control variables. In specifications including lender fixed effects (Columns (3) to
(5)), the coefficient of interest therefore reflects a correlation over time between the LIR and
the lobbying amounts for lobbying lenders only. Hence, any time-invariant lender-specific
factors - such as a superior screening technology - affecting both the decision to lobby and
lending standards are absorbed by the lender fixed effects. Another concern is that there may
be shocks common to all lenders, which we address by introducing time dummies. Columns
19 LOBAM is assumed to be equal to $1 when a lender does not lobby.

17
(2) to (5) show that the coefficient remains significant. Furthermore, Columns (4) and (5)
include MSA-year interactions controlling for time-varying local conditions faced by
lenders.20 The range of estimated coefficient suggests that a one standard deviation rise in
lobbying expenditures is associated with a 0.02-0.11 points rise in LIR. This constitutes 1-5
percent of the average LIR of 1.97 in the complete sample.21
B. Difference-in-Difference Estimations using State-Level Laws
We make use of difference-in-difference estimations exploiting across-state variation in
lending laws to uncover whether the existence of anti-predatory lending laws at the state
level have differential effects on the mortgage lending behavior of lenders that lobby relative
to those that do not lobby.22, 23 The hypothesis is that lobbying lenders were originating
riskier loans than other lenders in the absence of anti-predatory lending laws. Therefore,
when a law comes into effect at the state level they tighten their loan terms more than other
lenders to meet the minimum legal requirements. In one sense, this is a mirror image of the
relationship between lobbying and lending we explored in the earlier subsections: when
tighter federal regulations fail to pass or lax federal regulation comes to effect, lobbying
lenders increase LIR more; here, when tighter state regulation comes into effect, we expect
lobbying lenders to decrease LIR more.
20 We conduct further robustness tests for: (i) clustering at MSA level, (ii) exclusion of outliers, (iii) alternative split of total expenditures into specific and non-specific issues based on share of reports, (iv) alternative measure of lobbying expenditures, scaled by the importance of the regulations for which the firm lobbies, giving more weight to lobbying for bills that appear more often in the lobbying reports, (v) using lobbying expenditures scaled by assets, and (vi) taking into account lobbying expenditures by bankers’ associations. The main result that more lobbying is associated with higher LIR remains unaltered (see Table A4 in the Appendix).
21 For a 10 percent increase in LOBAM , the outcome variable changes by 1.0*)/ln(*ln* 211 δδδ ≈== −−− imtimtimtimt LOBAMLOBAMLOBAMddy .
22 Keys et al. (2009) use a similar identification strategy based on state lending laws in their analysis of securitization and monitoring incentives.
23 A potential concern is that state lending legislation efforts may be affected by the financial industry’s overall lobbying activities, however, lobbying at the federal level is less likely to influence any individual state’s decision to pass a law. Moreover, what we are interested in is the differential response of lobbying versus non-lobbying lenders to the regulatory changes once a law comes into effect rather than the causal effect of the law.

18
We estimate the following difference-in-difference panel equation:
1 1. (ln ) (ln )imt st it it st mt imt
i m t imt
y APL LOBAM LOBAM APL X Zs v
α β δ φ γ λπ ε
− −= + + ⋅ + ⋅ ⋅ + ⋅ + ⋅
+ + + +(3)
stAPL is a dummy equal to 1 if there exists an anti-predatory lending law in state s , where
MSA m is located, at time t .24 mtX denotes a set of MSA-year varying controls.
As shown in Table 5, the coefficient on the interaction term between the dummy for an anti-
predatory lending law and lobbying intensity is negative and significant at the 1 percent level
in Columns (2)-(4). This result is consistent with the hypothesis that lobbying lenders, at the
margin, raise their lending standards more than other lenders when anti-predatory lending
laws are in place. This implies that these laws happened to be more binding for lobbying
lenders and that, before the law came into place, lobbying lenders were more likely to have
engaged in risky lending practices.
The result is robust to including lender, MSA and year fixed effects, and when we control for
MSA-time, lender-time or lender-MSA-time level observable characteristics. In addition, the
overall effect of an anti-predatory lending law being in place, evaluated at the average
lobbying expenditures in the sample, is (ln ) 0LOBAMβ φ+ ⋅ < . This suggests that LIR is
lower in MSAs that belong to states with anti-predatory lending laws in place.
C. Evidence on Lobbying and Securitization and Mortgage Credit Growth
In addition to LIR, we use as two other dependent variables that provide additional
information on lending practices: (i) the proportion of mortgages securitized and (ii) the
annual growth rate in the amount of loans originated. Recourse to securitization has been
shown to weaken monitoring incentives; hence, a higher proportion of securitized loans can
24 In some cases, a single MSA contains areas in several states. Then we assume that the MSA has a law in place if any one of the states does.

19
be associated with lower credit standards (see Keys et al, 2009, for evidence that
securitization leads to less monitoring and worse loan performance). Next, fast expansion of
credit could be associated with lower lending standards for several reasons. First, if there are
constraints on training and employing loan officers, increased number of applications will
lead to less time and expertise allocated to each application to assess their quality (see Berger
and Udell, 2004). Second, in a booming economy, increasing collateral values will increase
creditworthiness of intrinsically bad borrowers and, when collateral values drop during the
bust, these borrowers are more likely to default (see Kiyotaki and Moore, 1997). Third,
competitive pressures might force lenders to loosen lending standards and extend loans to
marginal borrowers in order to preserve their market shares.
Table 6 (Columns (1) and (2)) shows that the proportion of mortgage loans securitized is
positively correlated with lobbying expenditures within lenders. Hence, securitization
increased faster over time for lobbying lenders than for other lenders. The result is robust to
the inclusion of lender, MSA and year fixed effects and MSA-year interactions. Moreover,
Columns (3) and (4) show that lobbying is also positively correlated with the growth of
mortgage lending. This result is significant at the 1 percent level, suggesting that lobbying
lenders, through faster expansion of their mortgage loan portfolios, tend to lend more
aggressively.
D. Mortgage Lending by Lobbying Lenders and Delinquency Rates
We relate delinquency rates in 2008 in a given area (recall from Section IV that our data on
delinquency rates are at the MSA level) to the growth of lobbying lenders’ market share
during 2000-06. Our explanatory variable measures the expansion of mortgage loans by
lobbying lenders relative to the expansion of such loans by all lenders during the period of
interest. Specifically, we estimate the following cross-sectional empirical model:
mmmmm ZXgmshdr εηµθα +⋅+⋅+⋅+=2008, (4)

20
where 2008,mdr is the MSA level delinquency rate as of 2008, mgmsh is the average annual
growth rate of the total market share of lobbying lenders in the MSA over 2000-06, mX is a
set of MSA characteristics and mZ is a set of mortgage loan characteristics and lender
characteristics averaged at the MSA level. The coefficient of interest θ captures the partial
correlation between delinquency rates and the growth rate of mortgage lending by lobbying
lenders relative to non-lobbying competitors.
Regression results reported in Table 7 show that delinquency rates in 2008 were significantly
higher in MSAs in which mortgage lending by lobbying lenders has expanded relatively
faster than mortgage lending by other lenders. This result is robust to the inclusion of
various MSA-level characteristics, including characteristics of the mortgage market such as
the share of subprime loans and the number of lenders (Column (1)). These control variables
ensure that the correlation does not reflect the fact that lobbying lenders may have expanded
faster in areas that ex post suffered more from the decline in house prices, or that had a
higher proportion of risky borrowers, or that were affected more by the economic downturn.
The exclusion of states in which the housing boom-bust cycle was more severe (Arizona,
California, Florida, and Nevada) ensures that mortgage market outcomes of these four states
are not driving the results (Column (2)). The estimated effect is economically significant: a
one standard deviation increase in the relative growth of mortgage loans of lobbying lenders
is associated with almost a 1.5 percentage point increase in the delinquency rate.
We perform two tests to address concerns that, even if we included many control variables,
omitted factors could still be driving the correlation between delinquency rates and the
expansion of lobbying lenders. First, as in the analysis of loan characteristics at origination,
we make use of a falsification test to show that the expansion of mortgage lending by
lobbying firms does not merely reflect lender characteristics that may be correlated with a
general propensity to lobby. Indeed, we find no statistically significant relationship between
delinquency rates and the relative expansion of mortgage lending by lenders that lobbied on
other issues (Column (3), Table 7).

21
Second, we develop an instrumental variable strategy. As a first instrument, we consider the
combined 1998 market share in the MSA of lenders who lobbied on specific issues, in which
each lender’s initial market share is weighted by the distance between each lender’s
headquarters and Washington, D.C. This instrument is valid if (i) the initial presence of a
lender in a MSA is predetermined and is not correlated with lending conditions that prevailed
in this MSA in the following years; (ii) the distance between a lender’s headquarters and
Washington, D.C. – a proxy for certain costs of lobbying – is uncorrelated with lending
conditions in any specific MSA. The correlation between this instrument and the
endogenous variable is negative (first stage results are available upon request), potentially
because a smaller initial market share coupled with low cost of lobbying results in faster
subsequent growth of lobbying lenders in that area. We consider a second instrument
defined in a similar way (initial market share weighted by the distance variable), but using
instead the initial market share of lenders lobbying on other issues. The sign of the
correlation between this instrument and the endogenous variable is positive possibly because,
in MSAs in which these other lenders have a larger initial presence, lenders lobbying on
specific issues may intensify their lobbying and lending activities and gain market share even
more when these other lenders have a higher cost of lobbying and a high initial market share.
Regression results confirm the conclusions of our OLS estimations (Column (4), Table 7).
When instrumenting the variable of interest, the coefficient increases significantly,
suggesting that there might be an attenuation bias in the OLS estimates. Moreover, the
Hansen J test does not reject the validity of the instruments. Furthermore, to allay concerns
of weak instrument bias, we also make use of the LIML estimator known to be more robust
to weak instrument bias and confirm the 2SLS results (Column (5), Table 7). All in all, the
evidence is suggestive of a causal relationship between the expansion of mortgage lending by
lobbying institutions and subsequent delinquency rates.
E. Stock Price Returns during the Crisis
Following the methodology developed in recent studies assessing the value of political
connections (Fisman, 2001; Faccio, 2005; and Fisman et al., 2006), we perform an event
study around the major events of the financial crisis and ask whether lenders that lobbied on

22
specific issues experienced abnormal stock market returns during the month the event took
place.25 We consider the following empirical specification:
ie i i iR l Xα β γ ε= + ⋅ + ⋅ + (5)
where ieR is the ex-dividend monthly return on firm i ’s stock over the event period e , il is a
dummy for financial institutions that lobby on specific issues during 1999-2006, iX is a set
of control variables, and iε is a residual.26 We use the market- and risk-adjusted return
defined as the stock return adjusted for the predicted return based on the CAPM.27 If
lobbying was systematically related to risk-taking and the quality of loans made, then we
would expect lobbying lenders to have lower abnormal returns during negative events and
higher abnormal returns during positive events.
We consider three major events of the crisis, namely, the collapse of two key investment
banks (negative events) and the government’s ultimate response to the turmoil in the
financial system (a positive event). The event dates are: (i) March 11-16, 2008 (JP Morgan
acquired Bear Stearns after Fed provides $30 billion in non-recourse funding; Fed expanded
liquidity provision), (ii) September 15-16, 2008 (Lehman Brothers filed for bankruptcy while
AIG was bailed out), and (iii) October, 14, 2008, when the bailout program was announced.
25 There exists a key difference with the approach of these papers that quantify the value of political connections. They conduct the event study around periods of news under the assumption that these news a priori specifically affect politically connected firms only, while other firms should not be directly impacted, and confirm the initial hypothesis. In our case, however, all firms are a priori potentially affected by the market news, but we show that the effect of news on market value varies systematically across financial intermediaries according to lobbying behavior in a direction that is consistent with our hypothesis.
26 Monthly stock returns are computed from the end of the previous month to the end of the month considered.
27 The market- and risk-adjusted return is defined as: itieie KRreturnAbnormal −=_ where
mtiiit RbaK ⋅+= where ia and ib are firm-specific coefficients estimated over 2007-08, and mtR is the market return (proxied by the return on the stock market index of banks in the S&P500). The results presented in this section are robust if we consider (i) simple stock return or (ii) the mean-adjusted return, defined as the stock return of firm i adjusted for its mean over 2007-08.

23
Regression results are reported in Table 8. Our analysis indicates that lenders that lobbied on
specific issues experienced negative abnormal returns during the collapse of key financial
institutions suggesting that these lenders were significantly more exposed, directly or
indirectly, to bad mortgage loans. Finally, lobbying lenders experienced positive abnormal
returns during the announcement of the TARP potentially implying that the market
anticipated lobbying lenders to be more connected to the policymakers and have higher
chances of benefiting from the bail out. Note that the estimated coefficient on the lobbying
dummy does not merely reflect the effect of a specialization of the lender considered (as
proxied by the subprime dummy or by total mortgage loans originated in proportion to total
assets). We also control for the size and exposure to mortgages of the lender as a proxy for
size, but find no significant effect on abnormal stock returns.
The coefficient of interest is statistically significant at conventional levels for all three events.
Moreover, the estimated effects are very large. Lobbying financial institutions lost on
average 21 percent during the 2008 events. The differential loss of value is even more
impressive during the Lehman failure: a 37 percent additional loss of value when returns are
adjusted for the market correlation. The results suggest that these financial institutions were
significantly more exposed to bad mortgage loans than other financial institutions. However,
these institutions gained 27 percent when TARP was announced.
F. Lobbying and Bailout
In this section, we examine whether the likelihood of getting bailed out in 2008 is correlated
with lobbying in 2000-06. We estimate the following regression specification:
iiii XLOBBYBailout εµβα ++⋅++= −062000,2008, (6)
where 2008,iBailout is a dummy that is 1 if the lender got funds under TARP or the amount of
TARP funds received by lender (in logs). 062000, −iLOBBY is either a dummy equal to 1 if the
lender lobbied on specific issues in any year between 2000-06 or the sum of lobbying
expenditures during 2000-06. The specification controls for a number of lender level
characteristics which include proxies for their size, proxies for specialization (whether they
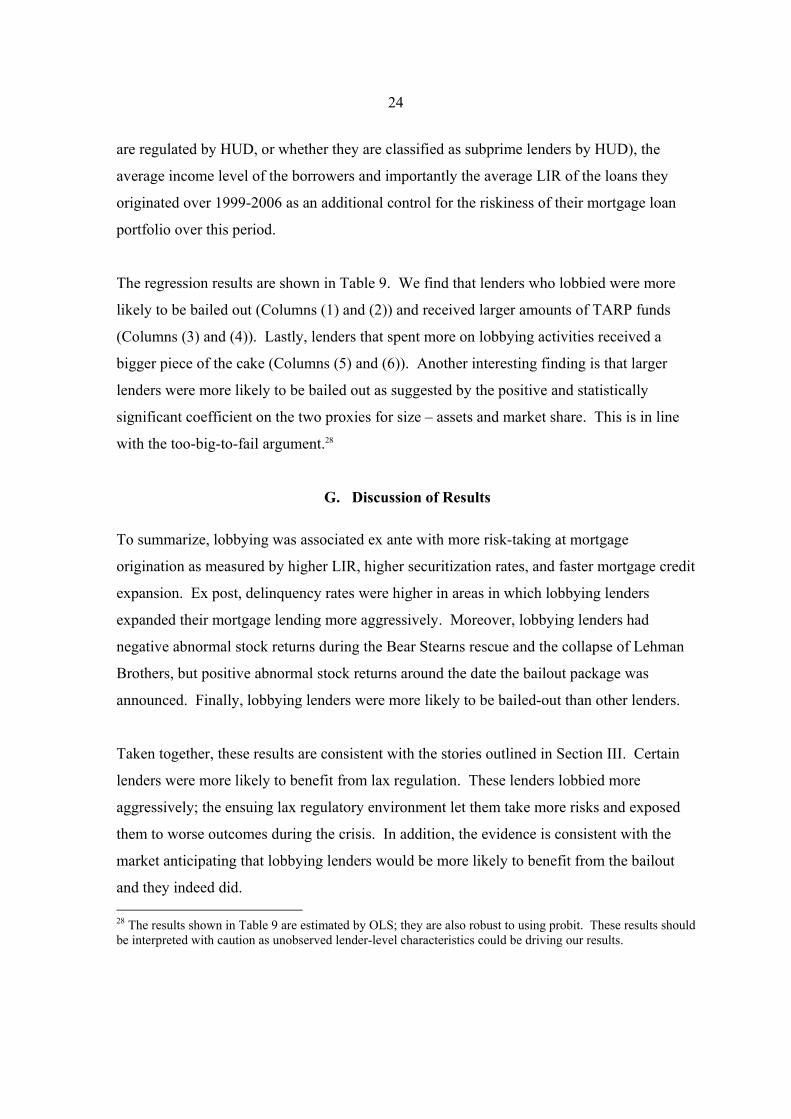
24
are regulated by HUD, or whether they are classified as subprime lenders by HUD), the
average income level of the borrowers and importantly the average LIR of the loans they
originated over 1999-2006 as an additional control for the riskiness of their mortgage loan
portfolio over this period.
The regression results are shown in Table 9. We find that lenders who lobbied were more
likely to be bailed out (Columns (1) and (2)) and received larger amounts of TARP funds
(Columns (3) and (4)). Lastly, lenders that spent more on lobbying activities received a
bigger piece of the cake (Columns (5) and (6)). Another interesting finding is that larger
lenders were more likely to be bailed out as suggested by the positive and statistically
significant coefficient on the two proxies for size – assets and market share. This is in line
with the too-big-to-fail argument.28
G. Discussion of Results
To summarize, lobbying was associated ex ante with more risk-taking at mortgage
origination as measured by higher LIR, higher securitization rates, and faster mortgage credit
expansion. Ex post, delinquency rates were higher in areas in which lobbying lenders
expanded their mortgage lending more aggressively. Moreover, lobbying lenders had
negative abnormal stock returns during the Bear Stearns rescue and the collapse of Lehman
Brothers, but positive abnormal stock returns around the date the bailout package was
announced. Finally, lobbying lenders were more likely to be bailed-out than other lenders.
Taken together, these results are consistent with the stories outlined in Section III. Certain
lenders were more likely to benefit from lax regulation. These lenders lobbied more
aggressively; the ensuing lax regulatory environment let them take more risks and exposed
them to worse outcomes during the crisis. In addition, the evidence is consistent with the
market anticipating that lobbying lenders would be more likely to benefit from the bailout
and they indeed did. 28 The results shown in Table 9 are estimated by OLS; they are also robust to using probit. These results should be interpreted with caution as unobserved lender-level characteristics could be driving our results.

25
There may be several characteristics that determine whether lenders are more likely to
benefit from lax regulation. First, these lenders may be specialized, e.g., in catering to
borrowers with lower income levels or in areas with higher average property prices. They
may lobby to signal their information on special lending opportunities, thereby preventing
tighter regulation that would otherwise limit growth in their particular segments. In the
empirical analysis, we include explicit controls, e.g., whether the lender is subprime or is
regulated by HUD, size of the lender (which may be another proxy for specialization if
specialized lenders are smaller), and the average income level of borrowers, to capture
certain kinds of specialization effects. The coefficient on lobbying variable remains
significant, so the results are not much likely to be driven by lenders specialized along these
dimensions (although they may still be driven by specialization along other dimensions).
Second, certain lenders may be overoptimistic and may have underestimated the likelihood
of an adverse event affecting the mortgage market more than other financial intermediaries
did.29 Owing to a genuine and systematic underestimation of default probabilities,
overoptimistic lenders might have lobbied to inform the policymaker of the “true” state of the
world and prevent a tightening of lending laws. Then, they may have taken more risks ex
ante and had higher exposures to bad loans ex post. Interestingly, we find that the difference
in LIR of originated loans between lobbying lenders and other lenders was even larger during
2005-07, implying that lobbying lenders relaxed their lending standards more during this
period (see Column (7) of Table A4 in the Appendix). It is not clear why lobbying lenders
would have become even more overoptimistic during the years when signs of stress in the
housing market were becoming visible. Moreover, one would expect that if lobbying lenders
were genuinely expecting better prospects for mortgage loans, they would have securitized at
a slower pace in order to keep these loans in their balance sheets rather than shift risks,
contrary to what we find in the data.
29 For example, rating agencies and sponsors severely underestimated the probability of default and loss given default when assigning ratings to mortgage-backed securities (Calomiris, 2008).

26
Third, certain lenders may have a greater desire or ability to exploit high short-term gains
associated with riskier lending strategies. These lenders lobby to prevent a tightening of
lending laws that may reduce the benefits associated with short-termist strategies
emphasizing short-term gains over long-term profit maximization. Short-termism can lead to
moral hazard and result in more risk-taking ex ante and worse performance ex post.30
A more cynical alternative story could be that certain lenders lobby the policymaker to
increase their chances of preferential treatment, e.g., a lower probability of scrutiny by bank
supervisors or a higher probability of being bailed out in the event of a financial crisis. This
in turn could lead to moral hazard and induce lenders to originate loans that would appear
riskier ex ante.31 Assuming all else equal, these loans would have a higher probability of
default ex post. On the one hand, lobbying on any issue should establish connectedness,
increase chances of getting preferential treatment and enhance incentives to take more risk.
However, as discussed above (Table 3), lobbying on other issues was not significantly
associated with risk-taking, which weakens the case for such motives for lobbying. On the
other hand, there is evidence that large lenders were the ones lobbying more aggressively and
ultimately getting bailed out with a higher probability. These suggest that lobbying might
have been driven in part by too-big-to-fail concerns and, in turn, by expectations of
preferential treatment.
It is empirically extremely difficult to pin down the most likely motivation for the financial
industry’s lobbying during our sample period. Ultimately, we do not know the exact
activities on which lobbying expenditures are spent. If lobbying lenders are specialized or
overoptimistic, their motive for lobbying appears to be consistent with information-based
theories, which assert that lobbying firms have better information than the policymakers and
30 Short-termism in executive compensation is explored theoretically by, among others, Bolton, Scheinkman and Xiong (2006), while empirical evidence on whether distorted incentives contribute to excessive risk-taking is mixed (Agarwal and Wang, 2009; Cheng, Hong, and Scheinkman, 2009; Fahlenbrach and Stulz, 2009). In policy circles, flaws in compensation contracts have become a key issue since the crisis (see, for instance, a speech by the Fed Chairman Bernanke at http://www.federalreserve.gov/newsevents/speech/bernanke20091023a.htm ).
31 See Tressel and Verdier (2009) for a model of regulatory forbearance of banks emphasizing this moral hazard channel.

27
partly reveal their information by endogenously choosing their lobbying effort (Potters and
van Winden, 1992; Lohmann, 1995; Grossman and Helpman, 2001). If lobbying lenders are
short-termist or lobby to increase the chances of preferential treatment, their motive for
lobbying seems to fit better with theories of rent seeking, where lobbying firms compete for
influence over a policy by strategically choosing their contribution to politicians (Bernheim
and Whinston, 1986; Grossman and Helpman, 1994).
While we cannot firmly tell apart alternative theories of information dissemination and rent
seeking, we can try to distinguish the channels through which lobbying was associated with
lending: relaxation of rules or earning preferential treatment. Specifically, lenders differ in
their capacity or willingness to take risks: some lenders are the risky type and are more likely
to benefit from (i) relaxation of lending rules, and (ii) discretion of regulators favoring them
over others, e.g., less supervision or perceived insurance against adverse outcomes. These
risky lenders lobby more and they take more risk (i) if lobbying efforts are successful and the
lending rules remain/become lax, and (ii) if they are under less scrutiny or have insurance.
To what extent ex-ante risk-taking by lobbying lenders is explained by changes in
regulations, that benefits many lenders (free riding), or by anticipation/realization of firm-
specific favors? We do a simple test which can help us quantify the relative magnitudes of
these two channels. First, taking LIR in 1999 (after purging the MSA effects) as an indicator
of initial risk bearing, we label the lenders in the top quartile as the risky type. Let be the difference in the LIR during 2000-07 (after purging the MSA and year
effects) of the risky type between the lobbying and non-lobbying lenders. Since the lenders
we are comparing are the same type and, hence, benefit the same way from the same rules,
we do not expect to observe any difference in risk-taking due to the effect of lobbying on
lending rules. Therefore, any difference can be attributed to expectation/realization of firm-
specific benefits associated with lobbying. Similarly, let be the difference in the
LIR during 2000-07 (after purging the MSA and year effects) of non-lobbying lenders
between the risky and less-risky types. With relaxation of rules, non-lobbying risky lenders
free-ride and increase their LIR while the less-risky types do not have the capacity to take as
much risk. So, any difference can be attributed to free-riding.

28
In the end, we compare and to evaluate the relative magnitudes of the
two channels. We find that both differences are positive and statistically significant at the 1
percent level. Moreover, they are roughly the same magnitude with = 0.14 and
= 0.16 (7 and 8 percent of the sample average LIR, respectively). Consequently,
the association we establish between lobbying and lending in our sample period appears to be
driven equally by both channels: changes in rules and preferential treatment.
VI. CONCLUSION
This paper studies the relationship between lobbying by financial institutions and mortgage
lending during 2000-07. To the best of our knowledge, this is the first study documenting
how lobbying may have contributed to the accumulation of risks leading the way to the
current financial crisis. We carefully construct a database at the lender level combining
information on loan characteristics and lobbying expenditures on laws and regulations related
to mortgage lending and securitization. We show that lenders that lobby more intensively on
these specific issues engaged in riskier lending practices ex ante, suffered from worse
outcomes ex post, and benefited more from the bailout program.
While pinning down precisely the motivation for lobbying is difficult, our analysis suggests
that the political influence of the financial industry contributed to the financial crisis by
allowing risk accumulation. Therefore, it provides some support to the view that the
prevention of future crises might require a closer monitoring of lobbying activities by the
financial industry and weakening of their political influence. However, the precise policy
response would depend on the true motivation for lobbying. Specialized rent-seeking for
preferential treatment such as bailouts would require curtailing lobbying as a socially non-
optimal outcome. Distorted incentives due to short-termism linking risky lending and
lobbying would require public intervention in the design of executive compensation. If,
however, lenders lobbied mainly to inform the policymaker and promote innovation,
lobbying would remain a socially beneficial channel to facilitate informed decision making.

29
References Acemoglu, D., 2009, “The Crisis of 2008: Structural Lessons for and from Economics”, mimeo, MIT. Agarwal, S. and F. H. Wang, 2009,” Perverse Incentives at the Banks? - Evidence from a Natural Experiment”, mimeo, Federal Reserve Bank of Chicago. Berger, A. and G. Udell, 2004, “The Institutional Memory Hypothesis and the Procyclicality
of Bank Lending Behavior,” Journal of Financial Intermediation 13, 458–95. Bernheim, B. D. and M. D. Whinston, 1986, “Menu Auctions, Resource Allocation, and
Economic Influence,” Quarterly Journal of Economics 101(1), 1-31. Bertrand, M., F. Kramarz, A. Schoar, and D. Thesmar, 2004, “Politically Connected CEOs
and Corporate Outcomes: Evidence from France,” mimeo, University of Chicago. Bolton, P., J. Scheinkman, and W. Xiong, 2006, “Executive Compensation and Short-termist
Behaviour in Speculative Markets”, Review of Economic Studies 73, 577–610. Bostic R., K. Engel, P. McCoy, A. Pennington-Cross, and S. Wachter, 2008, “State and Local Anti-predatory Lending Laws: The Effect of Legal Enforcement Mechanisms”, Journal of Economics and Business 60, 47–66. Calomiris, C., 2009, “The Subprime Turmoil: What’s Old, What’s New, and What’s Next”, Journal of Structured Finance 15 (1), 6-52. Cheng, I.-H., H. Hong, and J. Scheinkman, 2009, “Yesterday’s Heroes: Compensation and
Creative Risk-Taking”, mimeo, Princeton University. Claessens, S., E. Feijen, and L. Laeven, 2008, “Political Connections and Preferential Access
to Finance: The Role of Campaign Contributions”, Journal of Financial Economics 88 (3), 554-80.
Dell’Ariccia, G. and R. Marquez, 2006, “Lending Booms and Lending Standards”, Journal
of Finance 61 (5), 2511 – 46. Dell’Ariccia, G., D. Igan, and L. Laeven, 2008, “Credit Booms and Lending Standards:
Evidence from the Subprime Mortgage Market”, CEPR Discussion Papers No. 6683. Diamond, D.W. and R. Rajan, 2009, “The Credit Crisis: Conjectures about Causes and
Remedies”, NBER Working Paper No. 14739. Facchini, G., A. M. Mayda, and P. Mishra, 2008, “Do Interest Groups Affect Immigration
Policy?”, CEPR Working Paper No. 6898.

30
Faccio, M., 2006, “Politically Connected Firms”, American Economic Review 96 (1), 369-86. Faccio, M. and D. C. Parsley, 2007, “Sudden Deaths: Taking Stock of Geographic Ties”,
mimeo, Vanderbilt University. Fahlenbrach, R. and R. M. Stulz, 2009, “ Bank CEO Incentives and the Credit Crisis”, NBER
Working Paper 15212. Fisman, R., 2001, “Estimating the Value of Political Connections”, American Economic
Review 91, 1095-102. Fisman, D., R. Fisman, J. Galef, and R. Khurana, 2006, “The Cheney Effect: Valuing Political Connections in America”, mimeo. Gerardi, K., A. Lehnert, S. M. Sherland, and P. S. Willen, 2009, “Making Sense of the Subprime Crisis”, Public Policy Discussion Paper 09-1, Federal Reserve Bank of Boston. Goldberg, P. K. and G. Maggi, 1999, “Protection for Sale: An Empirical Investigation”, American Economic Review 89 (5), 1135-55. Gorton, G., 2008a, “The Panic of 2007,” Proceedings of the 2008 Jackson Hole Conference, “Maintaining Stability in a Changing Financial System,” Federal Reserve Bank of Kansas City. Gorton, G., 2008b, “The Subprime Panic”, NBER Working Paper 14398. Grossman, G. M. and E. Helpman, 1994, “Protection for Sale”, American Economic Re- view 84, 833-50. Grossman, G. and E. Helpman. 2001. Special Interest Politics. Cambridge, MA: The MIT
Press. Harstad, B. and J. Svensson, 2008, “From Corruption to Lobbying and Economic Growth”, mimeo, Kellogg School of Management. Igan, D. and M. Landoni, 2008, “To Regulate or Not to Regulate”, mimeo, IMF. Johnson, S., 2009, “The Quiet Coup,” The Atlantic, May; available at
http://www.theatlantic.com/doc/200905/imf-advice. Johnson, S. and T. Mitton, 2003, “Cronyism and Capital Controls: Evidence from Malaysia,”
Journal of Financial Economics 67, 351-382.

31
Khwaja, A. and A. Mian, 2005, “Do Lenders Favor Politically Connected Firms? Rent Provision in an Emerging Financial Market”, Quarterly Journal of Economics 120 (4).
Kiyotaki, N. and J. Moore, 1997, “Credit Cycles,” Journal of Political Economy 105, 211–
48. Kroszner, R. and P. Strahan, 1999, “What Drives Deregulation? Economics and Politics of
the Relaxation of Bank Branching Restrictions”, Quarterly Journal of Economics 114 (4), 1437-67.
Kroszner, R. and T. Stratmann, 1998, “Interest-Group Competition of Congress: Theory and
Evidence from Financial Services’ Political Action Committees”, American Economic Review 88 (5), 1163-87.
Ludema, R., A. M. Mayda, and P. Mishra, 2009, “Protection for Free: An Analysis of U.S.
Tariff Exemptions”, mimeo. Mayer, C., K. Pence, and S. M. Sherlund, 2009, “The Rise in Mortgage Default”, Journal of
Economic Perspectives 23 (1), 27-50. Mian, A. and A. Sufi, 2009, “The Consequences of Mortgage Credit Expansion: Evidence
from the U.S. Mortgage Default Crisis”, Quarterly Journal of Economics. Mian, A., A. Sufi, and F. Trebbi, forthcoming, “The Political Economy of the U.S. Mortgage
Default Crisis,” American Economic Review. Potters, J. and F. Van Winden, 1992, “Lobbying and Asymmetric Information,” Public
Choice 74, 269-92. Stigler, G., 1971, “The Theory of Economic Regulation”, Bell Journal of Economics and
Management Science, II, 3-21. Sirota, D., 2003, Essentials of Real Estate Finance, Dearborn Financial Publishing, Chicago. Tressel, T. and T. Verdier, 2008, “Financial Globalization and the Governance of Financial Intermediaries”, forthcoming, Journal of the European Economic Association.

32
Table 1. Targeted Political Activity Campaign Contributions and Lobbying Expenditures
(millions of dollars) Election cycle 1999-2000 2001-02 2003-04 2005-06 Contributions from PACs 326 348 461 509 Overall lobbying expenditure 2,972 3,348 4,081 4,747
Of which expenditure by finance, insurance, and real estate industry (FIRE) 437 478 645 720
Share of FIRE in overall lobbying (in percent) 14.7 14.3 15.8 15.2 Total targeted political activity 3,298 3,696 4,542 5,256 Source: Center for Responsive Politics.
90
95
100
105
110
115
120
125
130
135
1999 2000 2001 2002 2003 2004 2005 2006
Inde
x nu
mbe
r: 1
999=
100
Figure 1. Evolution of lobbying lntensity (expenditures per firm) over time
Finance, Insurance and Real Estate Industry
Average lobbying intensity

33
0
0.5
1
1.5
2
2.5
0.5
0.55
0.6
0.65
0.7
0.75
0.8
2000 2001 2002 2003 2004 2005 2006 2007
Figure 2. Lending Standards and Securitization
Percent of Loans Sold (LHS axis)
Loan-to-income ratio(RHS axis)
0
20
40
60
80
100
120
140
160
180
Assets (in logs) Market share of lender
Regulator is HUD
Lender is subprime
Average income of app
(in logs)
Loan‐to‐income ratio
Proportion of loans sold
Growth in loans (in percent)
Bailout
Lenders that lobby on specific issues 1999‐2006 (index=100)
Lenders that do not lobby on specific issues
Figure 3. Difference between lobbying and non-lobbying lenders

34
Observations Mean MedianStd. DeviationVariables that vary at the lender-MSA-year levelLoan-to-income ratio 648,938 2.00 1.94 0.92Proportion of loans sold 648,938 0.71 1.00 0.41Growth in amount of loans originated (in percent) 428,379 2.02 0.08 63.12Market share of lender 648,938 0.01 0.00 0.02Average income of loan applicants (in logs) 648,938 6.60 6.31 2.09Lenders that lobby on specific issuesLoan-to-income ratio 73,374 2.02 1.98 0.70Proportion of loans sold 73,374 0.63 0.80 0.38Growth in amount of loans originated (in percent) 56,504 3.80 0.12 143.63Market share of lender 73,374 0.01 0.00 0.03Average income of loan applicants (in logs) 73,374 7.65 7.49 2.38Lenders that do not lobby on specific issuesLoan-to-income ratio 575,564 2.00 1.93 0.95Proportion of loans sold 575,564 0.71 1.00 0.41Growth in amount of loans originated (in percent) 371,875 1.75 0.07 38.13Market share of lender 575,564 0.00 0.00 0.01Average income of loan applicants (in logs) 575,564 6.47 6.18 2.01Variables that vary at the lender-year levelDummy=1 if lender lobbies on specific issues 648,938 0.11 0.00 0.32Dummy=1 if lender lobbies only on other issues 648,938 0.08 0.00 0.27Lobbying expenditures on specific issues (in logs) 648,938 0.76 0.00 2.78Assets (in logs) 648,938 12.20 10.34 3.55Dummy=1 if regulator is HUD 648,938 0.57 1.00 0.50Dummy=1 if lender is subprime 648,938 0.22 0.00 0.41Lenders that lobby on specific issuesAssets (in logs) 73,374 14.65 16.76 4.31Dummy=1 if regulator is HUD 73,374 0.37 0.00 0.48Dummy=1 if lender is subprime 73,374 0.30 0.00 0.46Lenders that do not lobby on specific issuesAssets (in logs) 575,564 11.89 10.34 3.31Dummy=1 if regulator is HUD 575,564 0.59 1.00 0.49Dummy=1 if lender is subprime 575,564 0.21 0.00 0.41Variables that vary at the MSA-year levelAverage income (in '000) 648,938 31.72 30.61 7.29GDP growth 648,938 0.05 0.05 0.03Self-employment rate 584,237 0.04 0.04 0.03Unemployment rate 648,084 0.05 0.05 0.02Population (in logs) 648,938 13.30 13.00 1.39House price appreciation 646,366 0.07 0.05 0.07Number of competing lenders (in logs) 648,938 5.49 5.48 0.47Number of loan applications (in logs) 648,938 9.91 9.78 1.30Delinquency rate in 2008 648,938 0.17 0.16 0.05Share of subprime loans in total loans 648,938 0.10 0.09 0.04Share of hispanics in population 512,547 0.21 0.12 0.26Share of college graduates in population 512,547 0.23 0.22 0.07
Table 2. Summary Statistics

35
(1) (2) (3) (4) (5) (6)
Dummy=1 if lender lobbies on specific issues 0.016*** 0.144*** 0.075*** 0.138*** 0.145*** 0.142***[0.005] [0.004] [0.004] [0.004] [0.004] [0.004]
Dummy=1 if lender lobbies only on other issues -0.017***[0.005]
Average income 0.024*** 0.028***[0.000] [0.001]
GDP growth rate -1.168*** -1.094***[0.042] [0.052]
Self-employment rate 1.509*** -0.274*[0.050] [0.157]
Unemployment rate 2.649*** -1.652***[0.082] [0.181]
Population (in logs) -0.080*** -0.478***[0.003] [0.054]
House price appreciation 1.533*** 0.119***[0.025] [0.032]
Number of competing lenders (in logs) 0.268*** 0.255***[0.008] [0.015]
Number of loan applications (in logs) 0.045*** 0.178***[0.004] [0.009]
Assets (in logs) 0.008*** 0.011*** 0.009*** 0.010***[0.001] [0.001] [0.001] [0.001]
Dummy=1 if regulator is HUD 0.236*** 0.213*** 0.212*** 0.213***[0.004] [0.004] [0.004] [0.004]
Dummy=1 if lender is subprime -0.014*** -0.007** 0.000 -0.002[0.003] [0.003] [0.003] [0.003]
Market share of lender 3.636*** 3.869*** 4.109*** 4.101***[0.112] [0.106] [0.104] [0.104]
Average income of loan applicants (in logs) -0.052*** -0.058*** -0.063*** -0.062***[0.001] [0.001] [0.001] [0.001]
Number of observations 648,938 581,105 648,938 581,105 648,938 648,938R-squared 0.00 0.10 0.14 0.16 0.18 0.18
MSA fixed effects No No Yes Yes Yes YesYear fixed effects No No Yes Yes Yes YesMSA*year fixed effects No No No No Yes Yes
Table 3. Lobbying and Loan-to-Income Ratio
Dependent variable: Loan-to-income ratio at (lender, MSA, year) level
The regressions are run on the lender-MSA-year panel from 1999-2007. The dummy for lobbying on specific issues is equal to 1 if the lender lobbies for those issues in any year during 1999-2006. Lobbying on specific issues refers to lobbying on bills and regulations related to mortgage lending and securitization. Average income, GDP growth rate, self-employment rate, unemployment rate, population, house price appreciation, number of competing lenders, and number of loan applications vary at the MSA-year level. Assets and dummies for HUD regulation and subprime vary at the lender-year level. Market share of lender and average income of loan applicants are calculated for each lender separately in each MSA using the loan applications and originations by the lender in a particular MSA in a given year. Standard errors denoted in parentheses are clustered at the lender-MSA level. ***, ** and * represent statistical significance at 1, 5 and 10 percent, respectively.

36
(1) (2) (3) (4) (5)
Lobbying expenditures on specific issues (in logs), lagged 0.007*** 0.009*** 0.003*** 0.003*** 0.002***[0.000] [0.000] [0.001] [0.001] [0.001]
Assets (in logs) 0.006***[0.000]
Market share of lender 3.017***[0.090]
Average income of loan applicants (in logs) -0.031***[0.001]
Number of observations 406,035 406,035 406,035 406,035 406,035R-squared 0.00 0.17 0.10 0.12 0.12
MSA fixed effects No Yes Yes Yes YesYear fixed effects No Yes Yes Yes YesLender fixed effects No No Yes Yes YesMSA*year fixed effects No No No Yes Yes
Dependent variable: Loan-to-income ratio at (lender, MSA, year) level
Table 4. Lobbying Expenditures and Loan-to-Income Ratio
The regressions are run on the lender-MSA-year panel from 2000-07. Lobbying on specific issues refers to lobbying on bills and regulations related to mortgage lending and securitization. Assets vary at the lender-year level only. Market share of lender and average income of loan applicants are calculated for each lender separately in each MSA using the loan applications and originations by the lender in a particular MSA in a given year. Standard errors denoted in parentheses are clustered at the lender-MSA level. ***, ** and * represent statistical significance at 1, 5 and 10 percent, respectively.

37
(1) (2) (3) (4)
Dummy=1 if anti-predatory lending law in (MSA, year) 0.166*** 0.015*** 0.006 0.006[0.004] [0.005] [0.005] [0.005]
Lobbying expenditures on specific issues (in logs), lagged 0.007*** 0.009*** 0.008*** 0.007***[0.001] [0.001] [0.001] [0.001]
Lobbying expenditures on specific issues (in logs), lagged*Lending law -0.001 -0.007*** -0.006*** -0.005***[0.001] [0.002] [0.002] [0.001]
Average income 0.028*** 0.028***[0.002] [0.002]
GDP growth rate -0.959*** -0.952***[0.053] [0.053]
Self-employment rate -0.128 -0.104[0.165] [0.164]
Unemployment rate -2.222*** -2.251***[0.255] [0.252]
Population (in logs) -0.540*** -0.560***[0.063] [0.062]
House price appreciation 0.086** 0.095***[0.035] [0.034]
Number of competing lenders (in logs) 0.186*** 0.188***[0.016] [0.015]
Number of loan applications (in logs) 0.102*** 0.126***[0.010] [0.010]
Assets (in logs) 0.008***[0.000]
Market share of lender 2.751***[0.092]
Average income of loan applicants (in logs) -0.029***[0.001]
Number of observations 406,035 406,035 355,656 355,656R-squared 0.01 0.10 0.10 0.10
Lender fixed effects No No Yes YesLender*year fixed effects No No No NoMSA fixed effects No Yes Yes YesYear fixed effects No Yes Yes Yes
Table 5. Lobbying and Loan-to-Income Ratio: Difference-in-Difference
Dependent variable: Loan-to-income ratio at (lender, MSA, year) level
The regressions are run on the lender-MSA-year panel from 2000-07. Information on the enactment of state-level anti-predatory lending laws is from Bostic et al (2008). Lobbying on specific issues refers to lobbying on bills and regulations related to mortgage lending and securitization. Average income, GDP growth rate, self-employment rate, unemployment rate, population, house price appreciation, number of competing lenders, and number of loan applications vary at the MSA-year level. Assets vary at the lender-year level. Market share of lender and average income of loan applicants are calculated for each lender separately in each MSA using the loan applications and originations by the lender in a particular MSA in a given year. Standard errors denoted in parentheses are clustered at the lender-MSA level. ***, ** and * represent statistical significance at 1, 5 and 10 percent, respectively.

38
Dependent variable at (lender, MSA, year) level →
(1) (2) (3) (4)
Lobbying expenditures on specific issues (in logs), lagged 0.007*** 0.007*** 0.318** 0.321***[0.000] [0.000] [0.130] [0.118]
Assets (in logs) -0.000** -0.113**[0.000] [0.047]
Market share of lender 0.216*** -27.736**[0.026] [12.114]
Average income of loan applicants (in logs) 0.002*** 0.740***[0.000] [0.079]
Number of observations 406,035 406,035 406,996 385,701R-squared 0.01 0.01 0.00 0.00
MSA fixed effects Yes Yes Yes YesYear fixed effects Yes Yes Yes YesLender fixed effects Yes Yes Yes YesMSA*year fixed effects Yes Yes Yes Yes
The regressions are run on the lender-MSA-year panel from 2000-07. Lobbying on specific issues refers to lobbying on bills and regulations related to mortgage lending and securitization. Assets vary at the lender-year level. Market share of lender and average income of loan applicants are calculated for each lender separately in each MSA using the loan applications and originations by the lender in a particular MSA in a given year. Standard errors denoted in parentheses are clustered at the lender-MSA level. ***, ** and * represent statistical significance at 1, 5 and 10 percent, respectively.
Table 6. Lobbying Expenditures, Proportion of Loans Sold, and Credit Growth
Dependent variable: Alternative measures for loan-to-income ratio

39
(1) (2) (3) (4) (5)
excl. CA, FL, NV &
AZ IV: 2SLS IV: LIML
Growth in market share of lenders lobbying on specific issues 0.718*** 0.662*** 0.734*** 2.052** 2.064**(average 2000-06) [0.152] [0.147] [0.158] [0.816] [0.825]
Growth in market share of lenders lobbying on other issues -0.022(average 2000-06) [0.059]
Average income 0.002*** 0.002*** 0.002*** 0.002*** 0.002***[0.001] [0.001] [0.001] [0.001] [0.001]
GDP growth rate -0.897*** -1.057*** -0.887*** -0.710*** -0.708***[0.197] [0.187] [0.200] [0.258] [0.260]
Self-employment rate -0.102 -0.208** -0.097 -0.023 -0.023[0.069] [0.094] [0.071] [0.095] [0.096]
Unemployment rate 0.066 0.211 0.071 0.319 0.321[0.164] [0.291] [0.161] [0.230] [0.232]
Population (in logs) -0.017*** -0.011** -0.017*** -0.014*** -0.014***[0.004] [0.004] [0.004] [0.005] [0.005]
House price appreciation -0.032*** -0.065*** -0.032*** -0.027*** -0.027***[0.007] [0.009] [0.007] [0.007] [0.007]
Number of competing lenders (in logs) 0.053*** 0.037*** 0.052*** 0.048*** 0.048***[0.009] [0.010] [0.010] [0.011] [0.011]
Number of loan applications (in logs) 0.005 0.004 0.005 0.004 0.004[0.006] [0.007] [0.006] [0.007] [0.007]
Share of subprime loans in total loans 0.668*** 0.576*** 0.668*** 0.711*** 0.711***[0.084] [0.093] [0.085] [0.095] [0.095]
Share of hispanics in population -0.032*** -0.029** -0.032*** -0.031*** -0.031***[0.009] [0.011] [0.009] [0.009] [0.009]
Share of college graduates in population 0.002 0.062 0.004 0.032 0.032[0.040] [0.046] [0.041] [0.046] [0.046]
F-test of excluded instruments 9.63 9.63
Observations 305 253 305 305 305R-squared 0.53 0.61 0.53 0.34 0.33Hansen's J stat (p value) 0.744 0.745
Table 7. Lending by Lobbying Lenders and Delinquency Rates
Dependent variable: Delinquency rate in 2008 at MSA level
The regressions are run on the MSA cross-section. Lobbying on specific issues refers to lobbying on bills and regulations related to mortgage lending and securitization. Average income, GDP growth rate, self-employment rate, unemployment rate, population, number of competing lenders, number of loan applications, share of subprime loans, share of hispanics, and share of college graduates are averages over 2000-06 for each MSA. House price appreciation is the cumulative change in house prices from 2000 to 2006. In columns (4) and (5), growth in market share of lenders lobbying on specific issues is instrumented by the initial market share of lenders lobbying on specific issues weighted by the distance of headquarters to DC (in logs) and the initial market share of lenders lobbying on unrelated issues weighted by the distance of headquarters to DC (in logs). ***, ** and * represent statistical significance at 1, 5 and 10 percent, respectively. Robust standard errors are in brackets.

40
(1) (2) (3)
Market Event
Bear Stearns and Lehman
failures Lehman failureBailout
announcement
Dummy=1 if lender lobbies on specific issues -0.207** -0.365** 0.301***[0.090] [0.175] [0.106]
Dummy=1 if regulator is HUD -0.044 -0.091 -0.18[0.106] [0.204] [0.143]
Dummy=1 if lender is subprime 0.210** 0.373** -0.105[0.096] [0.185] [0.122]
Assets (in logs) -0.017 -0.033 0.018[0.014] [0.026] [0.018]
Mortgage loans originated / assets 0.0000 -0.0001 -0.0003**[0.000] [0.000] [0.000]
Number of observations 92 45 45R-squared 0.14 0.22 0.37
Table 8. Lobbying and Abnormal Stock Returns
Dependent variable: Market- and risk-adjusted return at lender level
Market- and risk-adjusted return is the stock price return over the month of the event, adjusted for the predicted return based on a CAPM where the market portfolio is proxied by the stock price index of financial institutions in the S&P500. Market events around which market- and risk-adjusted returns are analyzed are (1) March 11-16, 2008: JP Morgan acquired Bear Stearns after Fed provided $30 billion in non-recourse funding), (2) September 15-16, 2008: Lehman Brothers filed for bankruptcy and the authorities stepped in to rescue AIG), and (3) October 14, 2008: Troubled Asset Relief Program (TARP) making $700 billion available for asset purchases was announced. The dummy for lobbying on specific issues is equal to 1 if the lender lobbies for those issues in any year during 1999-2006. Lobbying on specific issues refers to lobbying on bills and regulations related to mortgage lending and securitization. The HUD and subprime dummies are equal to one if the lender was HUD regulated or subprime respectively in any year during 1999-2007. Assets and mortgage loans to assets are for the year 2006. Event fixed effects are included in column (1). ***, ** and * represent statistical significance at 1, 5 and 10 percent, respectively. Robust standard errors are in brackets.
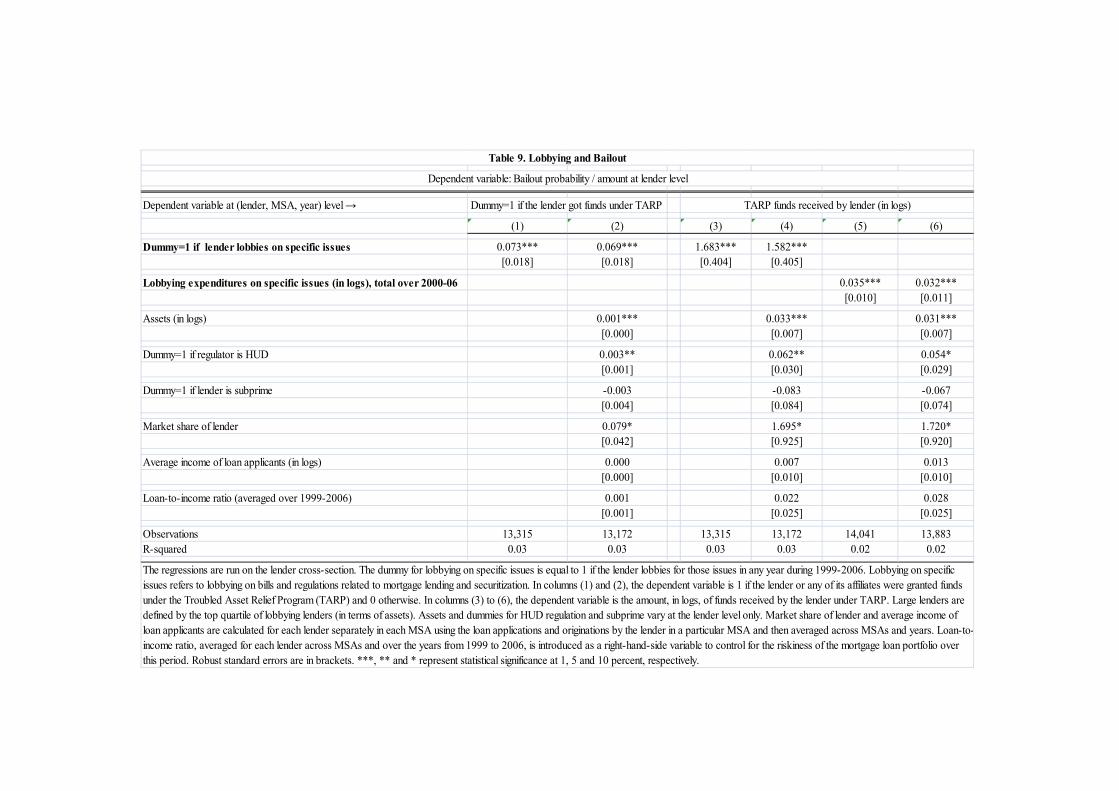
Dependent variable at (lender, MSA, year) level →
(1) (2) (3) (4) (5) (6)
Dummy=1 if lender lobbies on specific issues 0.073*** 0.069*** 1.683*** 1.582***[0.018] [0.018] [0.404] [0.405]
Lobbying expenditures on specific issues (in logs), total over 2000-06 0.035*** 0.032***[0.010] [0.011]
Assets (in logs) 0.001*** 0.033*** 0.031***[0.000] [0.007] [0.007]
Dummy=1 if regulator is HUD 0.003** 0.062** 0.054*[0.001] [0.030] [0.029]
Dummy=1 if lender is subprime -0.003 -0.083 -0.067[0.004] [0.084] [0.074]
Market share of lender 0.079* 1.695* 1.720*[0.042] [0.925] [0.920]
Average income of loan applicants (in logs) 0.000 0.007 0.013[0.000] [0.010] [0.010]
Loan-to-income ratio (averaged over 1999-2006) 0.001 0.022 0.028[0.001] [0.025] [0.025]
Observations 13,315 13,172 13,315 13,172 14,041 13,883R-squared 0.03 0.03 0.03 0.03 0.02 0.02
The regressions are run on the lender cross-section. The dummy for lobbying on specific issues is equal to 1 if the lender lobbies for those issues in any year during 1999-2006. Lobbying on specific issues refers to lobbying on bills and regulations related to mortgage lending and securitization. In columns (1) and (2), the dependent variable is 1 if the lender or any of its affiliates were granted funds under the Troubled Asset Relief Program (TARP) and 0 otherwise. In columns (3) to (6), the dependent variable is the amount, in logs, of funds received by the lender under TARP. Large lenders are defined by the top quartile of lobbying lenders (in terms of assets). Assets and dummies for HUD regulation and subprime vary at the lender level only. Market share of lender and average income of loan applicants are calculated for each lender separately in each MSA using the loan applications and originations by the lender in a particular MSA and then averaged across MSAs and years. Loan-to-income ratio, averaged for each lender across MSAs and over the years from 1999 to 2006, is introduced as a right-hand-side variable to control for the riskiness of the mortgage loan portfolio over this period. Robust standard errors are in brackets. ***, ** and * represent statistical significance at 1, 5 and 10 percent, respectively.
Dependent variable: Bailout probability / amount at lender level
Table 9. Lobbying and Bailout
Dummy=1 if the lender got funds under TARP TARP funds received by lender (in logs)