
A Fidelity Investments Webinar Writing Covered Calls
26
BROKERAGE: OPTIONS A Fidelity Investments Webinar Writing Covered Calls
Transcript of A Fidelity Investments Webinar Writing Covered Calls

BROKERAGE: OPTIONS
A Fidelity Investments Webinar
Writing Covered Calls

2
BROKERAGE: OPTIONS
Understand Covered Call
Strategy
Manage Your Covered Call Strategy Choose a
Strike Price
Choose an Expiration
Agenda

Understand Covered Call Strategy
4
BROKERAGE: OPTIONS
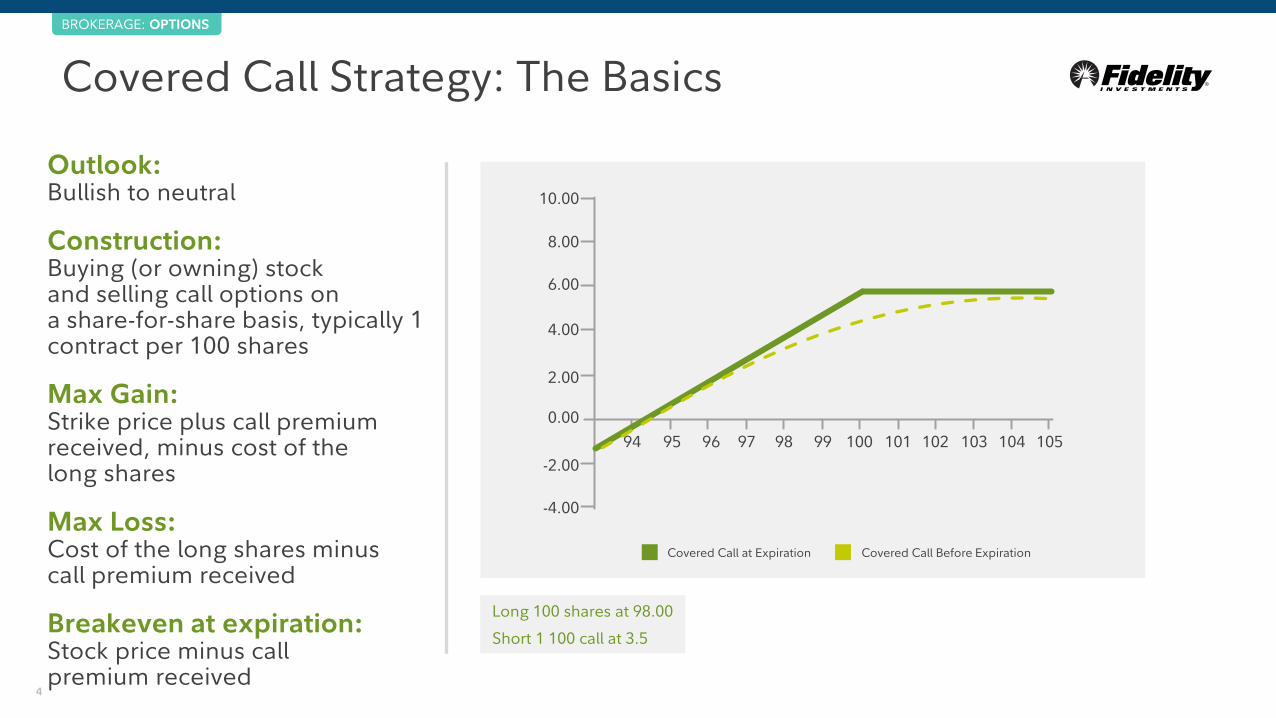
Covered Call Strategy: The Basics
Outlook:Bullish to neutral
Construction:Buying (or owning) stock and selling call options ona share-for-share basis, typically 1 contract per 100 shares
Max Gain:Strike price plus call premium received, minus cost of the long shares
Max Loss:Cost of the long shares minus call premium received
Breakeven at expiration:Stock price minus call premium received
Long 100 shares at 98.00
Short 1 100 call at 3.5
10.00
8.00
6.00
4.00
2.00
0.00
-2.00
-4.00
94 95 96 97 98 99 100 101 102 103 104 105
Covered Call at Expiration Covered Call Before Expiration

5
BROKERAGE: OPTIONS
Help Generate Income• Take in premium on bullish-to-neutral outlook• Enhance returns on a security not expected to
move in the short term
Sell Stock• Can be used as an exit strategy for a long
position
Manage a Long Stock Position• Reduce cost basis / breakeven• Reduce delta exposure• Generate positive returns in a sideways market
Why Sell Covered Calls?

6
BROKERAGE: OPTIONS
Get to Know the Greeks
What are the risks?
• The underlying price moves down• Increase in realized volatility• Not applicable• Increase in implied volatility
The Greeks (at time of trade)
• Delta - rate of change (+)• Gamma - rate of change of delta (-)• Theta- time decay (+)• Vega - volatility (-)
Trader’s View:Understand the risks of early assignment to your personal situation –
upcoming dividends and tax considerations are often mistakenly overlooked when writing covered calls.

Choose a Strike Price

8
BROKERAGE: OPTIONS
Evaluate Exposure to Underlying Security
Evaluate how the short call will affect exposure
ITM92.5 CALL
• Delta = 75• Net Delta (1 lot) = 25 share exposure
(100 - 75)
ATM97.5 CALL
• Delta = 52• Net Delta (1 lot) = 48 share exposure
(100 - 52)
OTM105 CALL
• Delta = 18• Net Delta (1 lot) = 82 share exposure
(100 - 18)
Screenshots are for illustrative purposes only.
9
BROKERAGE: OPTIONS
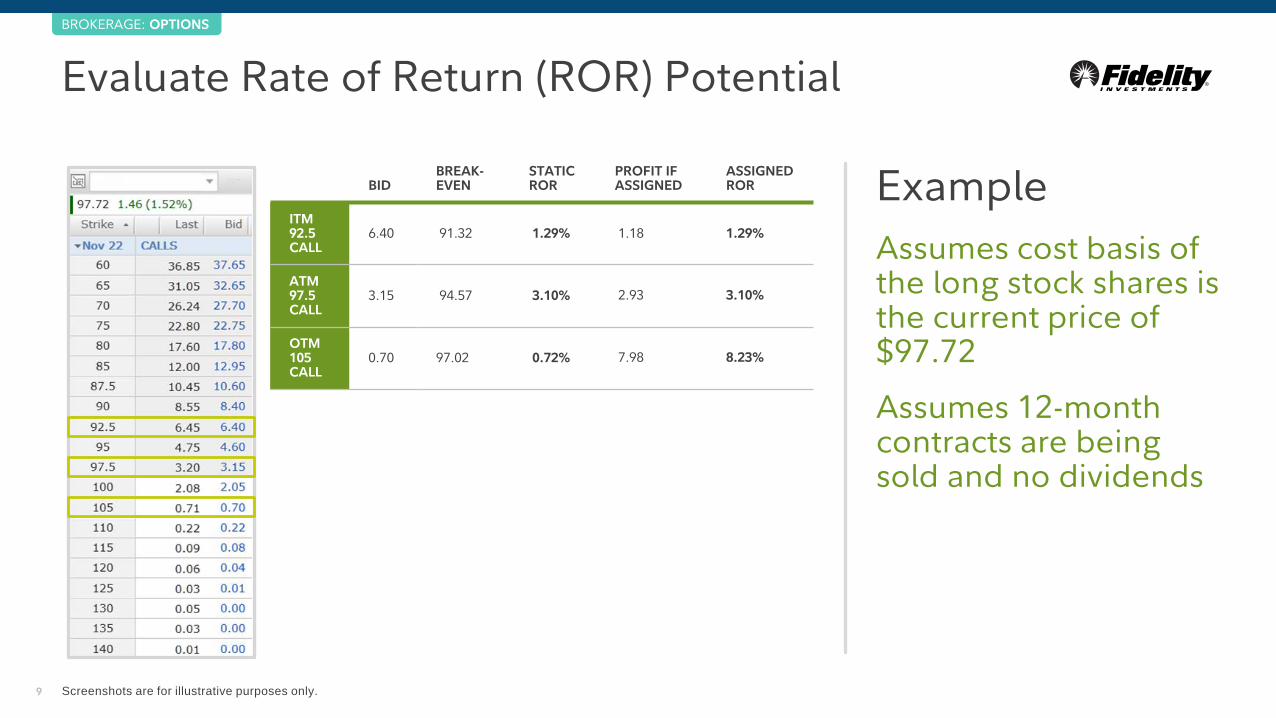
Evaluate Rate of Return (ROR) Potential
ExampleAssumes cost basis of the long stock shares is the current price of $97.72
Assumes 12-month contracts are being sold and no dividends
BIDBREAK-EVEN
STATIC ROR
PROFIT IF ASSIGNED
ASSIGNED ROR
ITM 92.5 CALL
6.40 91.32 1.29% 1.18 1.29%
ATM 97.5 CALL
3.15 94.57 3.10% 2.93 3.10%
OTM 105 CALL
0.70 97.02 0.72% 7.98 8.23%
Screenshots are for illustrative purposes only.

10
BROKERAGE: OPTIONS
Evaluate Key Resistance Levels
Identify price points where the security has had trouble breaking through
Use slow moving averages as a resistance level
Screenshots are for illustrative purposes only.

11
BROKERAGE: OPTIONS
Selecting Strikes with Probability Analysis
There is a 16.29% statistical probability that XYZ will be above $109.25 on 6/22/2020.
Because the risk of assignment is to the upside, by selling a 16% probability option, a trader is expecting less than a 1 standard deviation move in the underlying.
Screenshots are for illustrative purposes only.

12
BROKERAGE: OPTIONS
Using Delta for Probability Analysis
Using delta to evaluate the probability of ITM at expiration
ITM92.5 CALL
• Probability of being ITM at expiration is approximately 75%
• Bid: 6.40
ATM97.5 CALL
• Probability of being ITM at expiration is approximately 52%
• Bid: 3.15
OTM105 CALL
• Probability of being ITM at expiration is approximately 18%
• Bid: 0.70
Screenshots are for illustrative purposes only.

13
BROKERAGE: OPTIONS
Consider Trade Goals and Objective
In the Money (ITM)• Method of selling the stock• Higher premium received• More conservative (less
bullish)• Most downside protection• Higher probability of being
assigned
At the Money (ATM)• Most exposure to time decay• Most time value• Highest gamma risk• Approximately 50%
probability of being assigned
Out of the Money (OTM)• Income generation with
upside potential• Lower premium received • Lower up-front downside
protection• Lower probability of being
assigned• More aggressive (more
bullish)• Highest potential return
Choose anExpiration

15
BROKERAGE: OPTIONS
Consider Time Decay
Time decay typically accelerates as expiration comes closer, meaning shorter-term options have the highest time decay.
120Days
90Days
60Days
30Days
0Days
ATMContract
ITM/OTMContract
Op
tions
Pri
ce
Time to Expiration
Nonlinear Time Decay in Options Prices
Screenshots are for illustrative purposes only.
16
BROKERAGE: OPTIONS
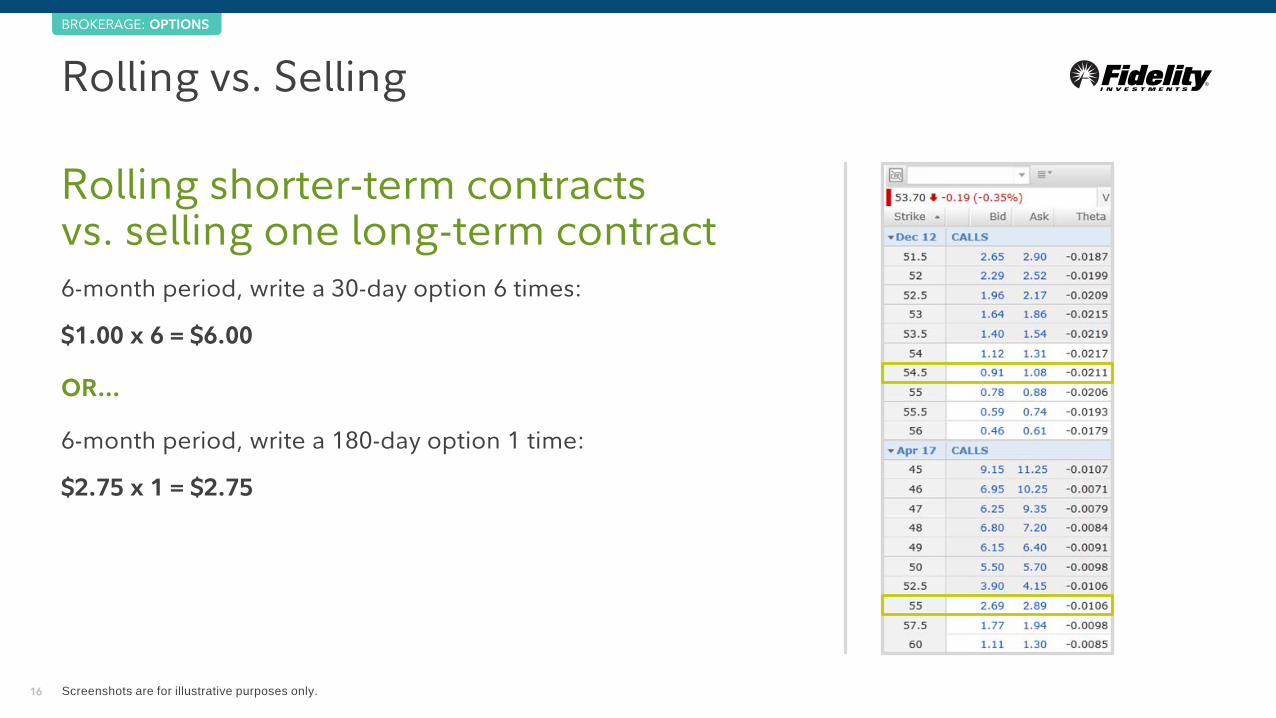
Rolling vs. Selling
Rolling shorter-term contracts vs. selling one long-term contract6-month period, write a 30-day option 6 times:
$1.00 x 6 = $6.00
OR…
6-month period, write a 180-day option 1 time:
$2.75 x 1 = $2.75
Screenshots are for illustrative purposes only.

17
BROKERAGE: OPTIONS
Consider the Trade in Light of the Outlook
Longer-Term Expiration• More up-front premium• More downside protection• Low exposure to time decay• Lower gamma risk• Higher probability of being ITM
at expiry• Less aggressive (less bullish)
Shorter-Term Expiration• Most exposure to time decay• Highest gamma risk• Higher return potential by
continually rolling (all else equal)• Higher probability of early
assignment• More commissions incurred• More aggressive (more bullish)

Manage Your Covered Call Strategy

19
BROKERAGE: OPTIONS
Three Ways to Manage Any Strategy
1
Leave the strategy alone• Let the covered
call(s) expire• Allow assignment
2 3
Close the strategy• Unwind: Sell
the shares; buy to close the covered call(s)
Adjust the strategy• Close the call(s);
keep the long shares
• Roll out: Keep the same strike, up or down
20
BROKERAGE: OPTIONS
Screenshots are for illustrative purposes only.
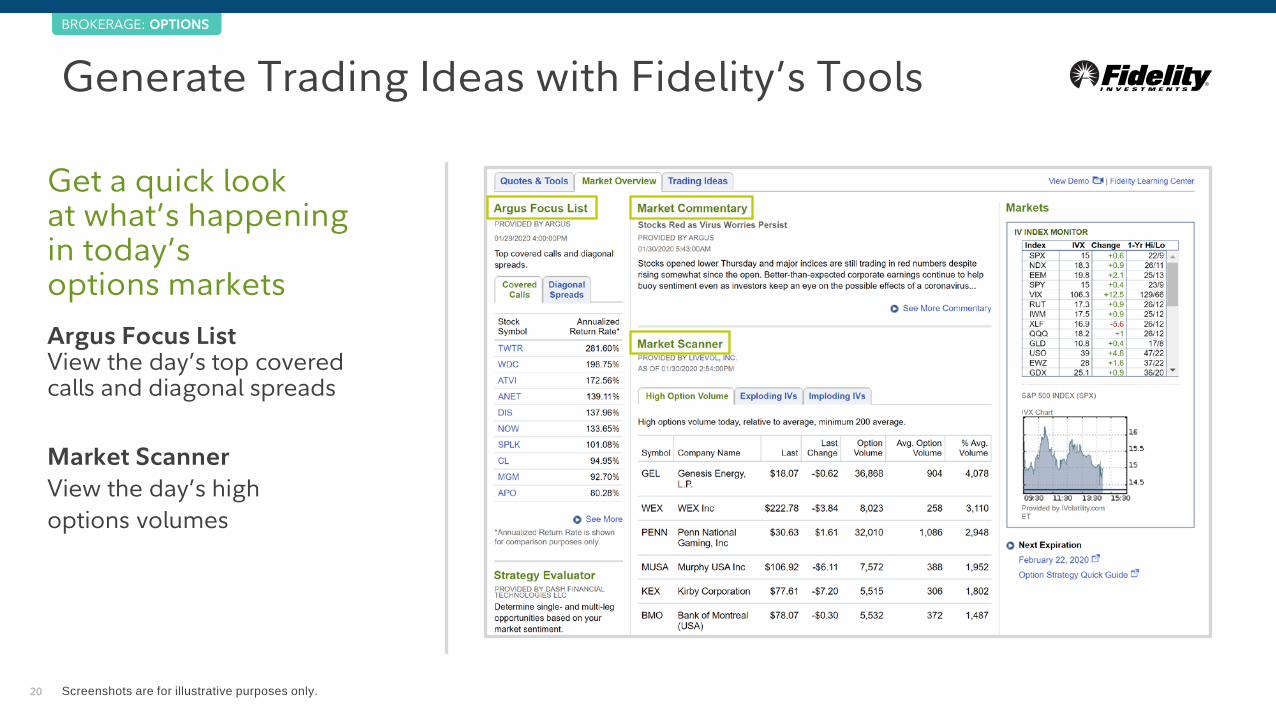
Get a quick look at what’s happening in today’s options marketsArgus Focus ListView the day’s top covered calls and diagonal spreads
Market ScannerView the day’s high options volumes
Generate Trading Ideas with Fidelity’s Tools
21
BROKERAGE: OPTIONS
Screenshots are for illustrative purposes only.
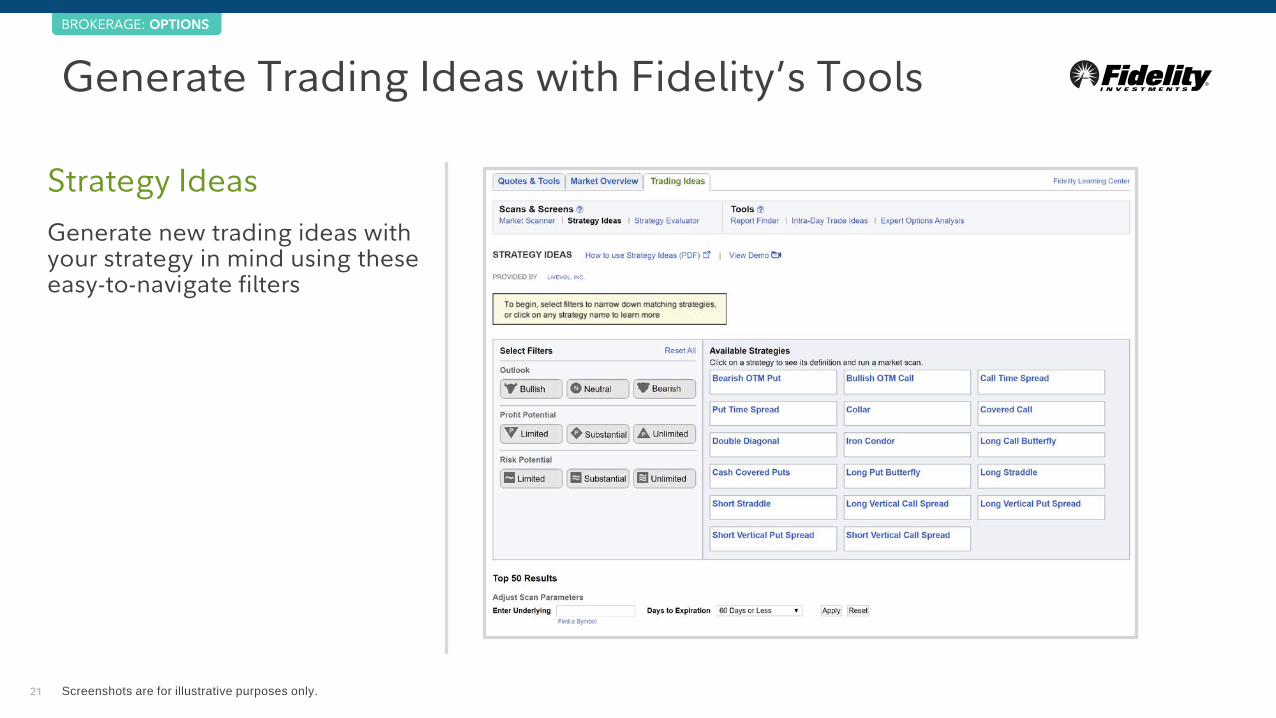
Strategy IdeasGenerate new trading ideas with your strategy in mind using these easy-to-navigate filters
Generate Trading Ideas with Fidelity’s Tools

22
BROKERAGE: OPTIONS
Screenshots are for illustrative purposes only.
Intraday Trading Ideas Explore intraday trading ideas generated from current market conditions (by Argus Research)
Generate Trading Ideas with Fidelity’s Tools

23
BROKERAGE: OPTIONS
Key Takeaways
• Use covered call strategies to:‐ Help generate income‐ Sell a long stock position‐ Manage a long stock position
• Identify your trade goals and objective to help choose the appropriate strike and expiration.
• Consider trade-offs during the strike and expiration selection process. Consider the premium being received vs. the risk being taken.
• To manage risk, look at the strategy to determine if it makes sense today and in the future forward–don’t get distracted by the past.
• Don’t blindly roll strategies without considering why you’re doing it, especially for covered call strategies. Rolling is simply closing one trade and opening a brand new one.

24
Visit the Fidelity Learning Center
Learn more about options
Read: Access the Options Strategy Guide
Watch: Check out videos that cover options basics
Attend: Register for monthly webinars

25
ThankYou For more information, please visit
Fidelity.com > News & Research > Options
Questions? Contact a Fidelity representative at 877-907-4429
Please join us for our upcoming webinars

26
BROKERAGE: OPTIONS
Important Information
A covered call writer forgoes participation in any increase in the stock price above the call exercise price, and continues to bear the downside risk of stock ownership if the stock price decreases more than the premium received.
Charts, screenshots, company stock symbols and examples contained in this module are for illustrative purposes only.
Options trading entails significant risk and is not appropriate for all investors. Certain complex options strategies carry additional risk. Before trading options, contact Fidelity Investments by calling 800-544-5115 to receive a copy of Characteristics and Risks of Standardized Options. Supporting documentation for any claims, if applicable, will be furnished upon request.
Greeks are mathematical calculations used to determine the effect of various factors on options.
There are additional costs associated with option strategies that call for multiple purchases and sales of options, such as spreads, straddles, and collars, as compared with a single option trade.
© 2020 FMR LLC. All rights reserved.
Fidelity Brokerage Services, Member NYSE, SIPC, 900 Salem Street, Smithfield, RI 02917
937693.1.1


![TOYOTA MOTOR SALES - Fidelity Investments · FIDELITY INVESTMENTS Fidelity Viewpoints® Webcast: January 29, 2013 Transcript eReview #: 640768.1.0 Page 1 [Operator] Good day everyone](https://static.fdocuments.net/doc/165x107/5bfc04b109d3f2b5178c97ce/toyota-motor-sales-fidelity-investments-fidelity-investments-fidelity-viewpoints.jpg)

