Understanding Bitcoin - Fidelity Investments
12
Commentary About bitcoin: Prospects, prospectors, and portfolio managers Among many portfolio managers, bitcoin seems to be gaining legitimacy as an asset class. But the digital-asset space is rather technical, and the learning curve can be very steep. Getting on board with bitcoin takes serious commitment. I intend this paper as a brief plain-English primer, but also to assess, in a meaningful way, the value proposition of bitcoin as it relates to asset allocation. Of course, what follows pertains to my own learning and, thus, represents just one opinion among many. I’ll also mention that bitcoin has many competitors, and not just in the private sphere: The relatively new acronym CBDC expands back into “central bank digital currency,” and its exploration as a government-issued (or controlled) legal tender extends to Russia, China, Japan, and even the United States. My focus here, though, is on bitcoin as the first and inarguably most successful digital currency to date. This status, of course, is subject to change, which poses some non-quantifiable risk to bitcoin. In progressing from novice to initiate, I still view bitcoin through the lens of a global macro strategist. Cryptocurrency has many dimensions, and I am gratified that the path to understanding such a futuristic asset cuts a wide swath through market history. Understanding Bitcoin Does bitcoin belong in asset allocation considerations? KEY TAKEAWAYS • Among an increasing number of investors and portfolio managers, bitcoin is considered a legitimate and distinct asset class. • Bitcoin, by design, is a finite asset, with both a unique supply and a unique demand dimension, and as its network increases, bitcoin’s value and durability could increase even faster. • Seen as a form of “digital gold,” bitcoin may act as a stable store of value and potentially offer protection against inflation—and even hyperinflation. • Bitcoin, however, faces risks from volatility, competitors, substitutes, regulation, and other factors; further, bitcoin may not be an appropriate or prudent diversifier for all portfolios. • In my view, some investors may wish to consider bitcoin, alongside other alternatives, as one component of the bond side of a 60/40 stock/bond portfolio. Jurrien Timmer Director of Global Macro Fidelity Global Asset Allocation
Transcript of Understanding Bitcoin - Fidelity Investments

Commentary
About bitcoin: Prospects, prospectors, and portfolio managersAmong many portfolio managers, bitcoin seems to be gaining legitimacy as an asset class. But the digital-asset space is rather technical, and the learning curve can be very steep. Getting on board with bitcoin takes serious commitment. I intend this paper as a brief plain-English primer, but also to assess, in a meaningful way, the value proposition of bitcoin as it relates to asset allocation. Of course, what follows pertains to my own learning and, thus, represents just one opinion among many.
I’ll also mention that bitcoin has many competitors, and not just in the private sphere: The relatively new acronym CBDC expands back into “central bank digital currency,” and its exploration as a government-issued (or controlled) legal tender extends to Russia, China, Japan, and even the United States. My focus here, though, is on bitcoin as the first and inarguably most successful digital currency to date. This status, of course, is subject to change, which poses some non-quantifiable risk to bitcoin.
In progressing from novice to initiate, I still view bitcoin through the lens of a global macro strategist. Cryptocurrency has many dimensions, and I am gratified that the path to understanding such a futuristic asset cuts a wide swath through market history.
Understanding Bitcoin Does bitcoin belong in asset allocation considerations?
KEY TAKEAWAYS
• Among an increasing number of investors and portfolio managers, bitcoin is considered a legitimate and distinct asset class.
• Bitcoin, by design, is a finite asset, with both a unique supply and a unique demand dimension, and as its network increases, bitcoin’s value and durability could increase even faster.
• Seen as a form of “digital gold,” bitcoin may act as a stable store of value and potentially offer protection against inflation—and even hyperinflation.
• Bitcoin, however, faces risks from volatility, competitors, substitutes, regulation, and other factors; further, bitcoin may not be an appropriate or prudent diversifier for all portfolios.
• In my view, some investors may wish to consider bitcoin, alongside other alternatives, as one component of the bond side of a 60/40 stock/bond portfolio.
Jurrien TimmerDirector of Global Macro Fidelity Global Asset Allocation

Understanding Bitcoin | 2
We can start by asking: What is bitcoin (BTC)?1 Is it an asset class? Should we invest in it? If so, what is bitcoin worth? Is it digital gold—or digital tulip bulbs? For most investors, it comes down to these few questions.
Price axiomatically resides at the intersection of supply and demand, and as I see it, bitcoin has both a unique supply and a unique demand dimension. Let’s start with the former.
A scarce asset
The first so-called cryptocurrency—bitcoin—emerged in 2009, the brainchild of a mysterious individual (or group) using the name Satoshi Nakamoto. One of bitcoin’s key features was a built-in scarcity factor: Total supply is limited to no more than 21 million bitcoins, and as more get mined (computationally created), the incentive to mine more goes down. Miners (electronic auditors) receive a reward—fresh bitcoins—for each new block of ledger data generated, accepted, and added to the chain of bitcoin transactions. This reward undergoes a “halving” every 210,000 blocks, or roughly every four years (Exhibit 1). As of May 2020, the reward was down to 6.25 bitcoins (roughly $200,000 as of this writing, but the bitcoin price is nothing if not volatile). This creates an asymptotic supply curve and, therefore, scarcity.
Source: Coinmetrics; daily data, 2009–2020.
EXHIBIT 1: Growth in bitcoin supply is flattening.
Bitcoin Annual Issuance and Aggregate Supply
Today, about 18.6 million of the total 21 million bitcoins have been created, but it still will take many more years (120, give or take) before the mines are depleted.
BTC S2F
This declining supply-growth curve is what makes bitcoin a scarce asset—unlike, say, fiat money, which it seems to me central banks are prepared to print ad infinitum. We will return to this in a moment, but let’s look first at the bitcoin Stock-to-Flow (S2F) pricing model. S2F is a popular valuation approach among bitcoin’s most vocal proponents. The model simply measures the number of years (flow) needed to replace the current supply (stock). A high S2F is deemed bullish, as it indicates scarcity, and vice versa.
A web search for “bitcoin stock to flow” will inevitably call up papers written by the model’s architect, a pseudonymous Dutch institutional investor operating under the Twitter handle @100trillionUSD. These papers lay out a complex regression analysis that projects ever-higher prices driven by ever-slowing (indeed, finite) supply growth. The math is complicated, but fortunately it’s not needed to get a sense of the mechanics. All we really need is to flip the incremental supply curve upside down and regress it against price (Exhibit 2).
BTC Supply (Total) BTC Issuance (Annual)
100,000
1,000,000
10,000,000
2010 2012 2014 2016 2018
3,507,0502,675,690
1,374,209
668,569
458,635
2020
18,575,615
Source: Coinmetrics; daily data, 2010–2020.
EXHIBIT 2: “Supply and demand” is usually the answer.
Bitcoin Stock and Flow
Inflation Price ($)
BTC Inflation Rate (Annual) BTC Price
100
10
1 100,000
1,000
10
0
2012 2014 2016 20182010 2020

Understanding Bitcoin | 3
So, under the law of supply, higher prices elicit higher quantities, all else equal; that is, price drives supply. The inverse, on the other hand, tells us how changes (here, restrictions) in quantity affect price. Exhibit 3 (above) shows a fairly tight fit between the inverse supply curve and the bitcoin price. Now, regressing (curve fitting) two lines that appear corelated presents many pitfalls, and our industry is littered with perfect regressions that fell apart as soon as they went from in-sample (historical) to real-time data.
Further—and I cannot stress this enough—past performance is no guarantee of future results. Plus, these are just models: Who knows what really lies ahead for bitcoin?
With these warnings in mind, the chart above shows the two simple regression models I created for this exercise. Each one takes the historical and future supply growth and regresses it against price. The incremental supply of bitcoins is known well in advance, so this allows us to project future prices using the S2F model.
My first iteration takes the entire history of bitcoin (2010–2020) and regresses it against its price. This model extrapolates the future supply curve, applies the S2F model, and voilà! Price projections.
No fancy multivariate models here, just a simple power-regression function. (I say again: These are projections, not promises, purely hypothetical and merely mathematical.)
Wary of the aforementioned theory-to-practice peril, I built a second model that uses historical data only up through 2016, and then compared its projections with actual data from the years thereafter. Fortunately, my second iteration comes up with similar projections as the first, which gives me some comfort that the BTC S2F approach may be on to something.
And the S2F model’s price projections are eye-popping. The model predicted the price of one bitcoin at $24k this year (done!) and $463k in 2025. One can see why bitcoiners are so excited.
But like any model, the BTC S2F approach has its limitations. Aside from the obvious dangers of curve-fitting two data streams and assuming that one causes the other (“correlation is not causation”), the S2F model is limited because it assumes that price is entirely a function of supply.
Where is the demand side of this equation? Think back to 2017 when bitcoin first reached $20k—exactly in line with the model—only to collapse down to $3k before eventually crawling back. What happened? Again, price lies at the intersection of demand and supply, and without the demand side kicking in, it doesn’t really matter how scarce the supply is. Thus, I see S2F as a one-dimensional model in that regard.
Metcalfe’s Law
Fortunately for bitcoin, an entire demand-side dynamic is at work—one described by Metcalfe’s Law. In its simplest form, Metcalfe’s Law holds that, as the number of its users grows linearly, a network’s value (or, by inference, the bitcoin price) grows geometrically. In other words, bitcoin’s utility (value) should grow much faster than does its network of buyers, sellers, exchanges, ATMs, and participating retailers—at this time including, directly or indirectly, AT&T, Wikimedia Foundation (donations), the Dallas Mavericks, a few insurers, many banks, and countless small businesses.
Past performance is no guarantee of future results. Price scale is logarithmic. Source: Bloomberg Finance L.P., Fidelity Investments; annual data, 2010–2020.
EXHIBIT 3: Is the BTC S2F on to something?
Bitcoin Annual Supply Growth Versus Price
Price Growth Rate
Growth in Supply Price
1
256
64
16
4
1
1,000
1,000,000
ActualModel
Annual Supply Growth
Price
$1
$100
$10K
116256
$1M
2010 2015 2020 2025
Model (2010–2020)Model (2010–2016)
$462,669

Understanding Bitcoin | 4
We can get a practical sense of Metcalfe’s Law by reviewing growth curves, also known as S-curves: flatter at each end, steeper in the middle. We see them everywhere, from mobile-phone penetration rates to broadband subscriptions to internet usage (Exhibit 4). On a linear scale, these indeed look like an S, but on a log scale the data describes a bending curve that starts out exponential and then turns asymptotic— flat—as the penetration rate approaches 100%.
Exhibit 4 charts the raw number of worldwide mobile-phone subscribers overlaid against the raw number of bitcoin addresses. The S-curve on the left is set to a linear scale; the one on the right, to a log scale.
Penetration rates are not a perfect analogy to the growing number of bitcoin digital addresses. For instance, some of the increase in network activity may be running through existing wallets (e.g., PayPal), and a single user can self-custody multiple addresses (in a “hardware wallet,” perhaps). But despite certain limits to what we can infer, this may be the best we have at this point.
With the caveat that we are comparing two different data series, it appears the bitcoin growth curve may still be in its early, exponential phase—and could remain so for a number of years. That suggests to me that the demand side of the equation also could continue to grow exponentially.
Source: Worldbank, Coinmetrics; annual data.
EXHIBIT 4: Metcalfe’s Law may offer some S-curve perspective.
Growth Patterns of Bitcoin and Mobile Phone Accounts
Mobile Phone Subscribers Worldwide (Thousands)Subscribers/Addresses (B)9
0
5
Subscribers/Addresses (M)10,000
0.01
100
1
Years
8,196
23
0 10 20 30 40Years
0 10 20 30 40
BTC Addresses (Balance ≥ $1)
Thus the bullish case for bitcoin: Price is at the intersection of supply and demand, and demand is growing exponentially while supply (per BTC S2F) approaches its limit. Bitcoin can act as a store of value because of its scarcity, but it’s also an integral part of a technological revolution (blockchain encryption) with potentially explosive demand growth.
Gold and bitcoin as a store of value
Gold has a long and well-nigh undisputed history as a store of value and source of protection against inflation (Exhibit 5). Part of gold’s historical stability derived from its status. Gold was used as money long before King Croesus coined it, and gold served as the backbone of global commerce for millennia. As for us, the United States has been on and off a gold standard since its founding: Gold was money here until 1944, then it became the reserve asset backing our money. But since 1971, after then-President Richard Nixon abandoned the Bretton Woods agreements—and even the pretense of a gold standard—we have been living in a “fiat money” era, with gold reserves making up less and less of the world’s monetary system.2 In 1970, the ratio of global reserve assets (money) to reserve gold stood at roughly 2-to-1; currently, the ratio is more like 10-to-1.
Gold Price
1200 1400 1600 1800 2000
10,000
London PM Fix UK Inflation
0
100
1,000
10
1
0
100
1,000
10
1
UK Inflation (Cumulative)
Source: Worldbank, Coinmetrics; annual data.
EXHIBIT 5: It’s not “the gold standard” for nothing.
Gold as an Inflation Hedge, 1200–2020

Understanding Bitcoin | 5
This divergence has widened sharply in recent years. Starting with the global financial crisis of 2007–08, world central banks began expanding their balance sheets at an unprecedented pace, and then accelerated mightily in 2020 to offset some of the economic effects of the COVID-19 pandemic. Recent measures put the Federal Reserve’s balance sheet at roughly 35% of GDP—far ahead of the previous spikes following the Civil War and World War II. The monetary base, at roughly 24% of GDP as of December 2020, also stands at its highest level in U.S. history.
So, in this fiat era we have less gold backing up the monetary system at a time when money is being printed at breathtaking speed. For some, this has made gold more appealing as an asset class, and lately bitcoin has joined the conversation as, potentially, a form of digital gold.
Which is better, then: gold or bitcoin? Like gold, bitcoin is scarce, but unlike gold, bitcoin cannot be touched, seen, or felt. Moreover, bitcoin is a brand-new asset that may be at risk of future regulation; indeed, both the U.S. Treasury and the IRS have been paying more attention lately. Uncertainty regarding policy-driven restrictions could affect demand. Trusting that something conceptual and unproven can compete with a tangible rarity treasured for millennia takes somewhat of a leap of faith, in my view.
But bitcoin may have a unique advantage over gold: Bitcoin supply, by design, is finite. The left-hand chart of Exhibit 6, below, shows gold’s supply curve (i.e., cumulative global gold production since 1970) versus bitcoin’s supply curve. We know that bitcoin’s supply growth is flattening. Note how the production of gold has been quite steady throughout the years: No asymptote here!
The right-hand chart shows my S2F calculation for each asset, or how long it takes to replace existing supply. The stock-to-flow for gold has been fairly stable at around 60 years, meaning it would take about 60 years of production to replace the current stock. In other words, gold is scarce but not getting any scarcer.
BTC Supply (Millions) Gold Production, Cumulative (Tonnes) Gold S2F BTC S2F
20,000 0
30
60
90
120
1970 1995 2020 1970 1995 20204
16
320,000
200,975
20 75
53
6759
42
59
120
80,000
64
Right-hand chart: Dotted line represents a forward projection of the bitcoin stock-to-flow calculation. Source: Bloomberg Financial, L.P., Global Financial Data, Fidelity Investments; annual data, 1970–2020.
EXHIBIT 6: Bitcoin and gold have (at least) one major difference.
Gold and Bitcoin Production over Time

Understanding Bitcoin | 6
At 42 years, bitcoin’s S2F is lower, but it is rising rapidly and likely will draw abreast of gold in a few years. So, according to the S2F model, bitcoin will eventually be much scarcer than gold. One could think of it as a more convex form of gold.
Valuation
This raises the issue of valuation. Neither gold nor bitcoin produces a yield, making them impossible to value via traditional discounted cash flow models.
Fortunately, global bond yields are close to zero, with Bloomberg reporting some $18 trillion of negative-yielding debt around the world (as of December 2020). We see it even here in the United States: The Federal Reserve has been reporting a cycle of negative short- and medium-term real rates since mid-2019. Thus, the opportunity cost of holding a zero-yielding asset is much lower now than when bond yields were positive. This is not a “detail” but rather a major takeaway: Gold and bitcoin are competitive to bonds at today’s low levels of interest rates. In a 60/40 stock/bond world, gold and bitcoin are poised, in my view, as potential disruptors to the 40 side of the allocation—but not so much to the 60. More on this later.
Thinking about the relative size of various asset categories: The market value of investable financial assets (stocks, bonds) is around $160 trillion (as of December 2020); the value of all above-ground gold bullion is estimated at $11 trillion; and the market value of bitcoin exceeds $800 billion (as of February 15, 2021). Although bitcoin is catching up fast, as of now it remains only a fraction of gold’s value.
I should reiterate that, so far, bitcoin has proven highly volatile. While the models I am using may indicate a rising bitcoin price over time, I expect the ride to be rather bumpy, even dismaying at times. Bitcoin’s volatility could have a consequential impact on a portfolio’s short-term results. Past performance is no guarantee of future results.
Given the foregoing—supply, demand, growth—how should gold and bitcoin be valued relative to one another, and relative to financial assets in general? My sense is that no one knows with any certainty, but I think both the gold bulls and the bitcoin bulls would surely say, “More than it is now.” To better understand the relative valuation dynamic, we will look first at equities over time and under special circumstances, and then add bonds and gold.
Equities as an inflation hedge
Equities historically have offered an effective hedge against inflation. We can see this most plainly by examining periods of hyperinflation. Brazil in the 1980s and ‘90s comes to mind and, of course, Weimar Germany.

Understanding Bitcoin | 7
At the start of 1919, one U.S. dollar could purchase nine German papiermarks; by November 1923, that same dollar could purchase 4.2 trillion marks. Charting these changes shows both German CPI and the German stock market heading essentially to infinity (Exhibit 7, right side), which in context means that stocks offered a measure of inflation protection. But with the mark losing all value, highly priced German shares didn’t go very far in other currencies. And this is where gold comes in as perhaps the ultimate store of value during a hyperinflationary episode.
Germany abandoned the gold standard in 1914, but following its defeat in World War I, the country was forced to make reparations in gold-backed currency. The left-hand section of Exhibit 7 shows the German stock market priced in its fiat currency, i.e., paper marks (blue), and also priced in money backed by gold (green). Whereas the German stock market of the early 1920s soared in nominal terms, the real experience for most investors was one of substantial loss. This disparity highlights that, against inflation, equities have been a good hedge, but against hyperinflation, the yellow metal has proven even better.
But what about during more normal conditions, i.e., most of the time? Here, equities have a distinct advantage over gold: the magic of compounding—the reinvestment of cashflows. With gold (or bitcoin) there is simply nothing to compound, whereas equity returns can compound incrementally, with the potential, over time, to produce dramatic results.
0
1
100
10,000
1,000,000
100,000,000
10,000,000,000
1,000,000,000,000
0
1
100
10,000
1,000,000
100,000,000
10,000,000,000
1,000,000,000,000
10,000,000,000,000
Germany Reichsamt General Index-Paper MarksGermany Reichsamt General Index-Gold Marks
1870 1895 1920 1945
1,910,511,272,727
0.05
1870 1895 1920 1945
Germany Consumer Price Index Inflation RateGermany CDAX Composite Index (Paper Marks)
Source: Bloomberg Financial, L.P., Global Financial Data, Fidelity Investments; annual data, 1970–2020.
EXHIBIT 7: Gold was a safe haven in Weimar Germany.
German Papiermarks (Fiat Currency) Versus Goldmarks
Understanding Bitcoin | 8
Asset classes over time
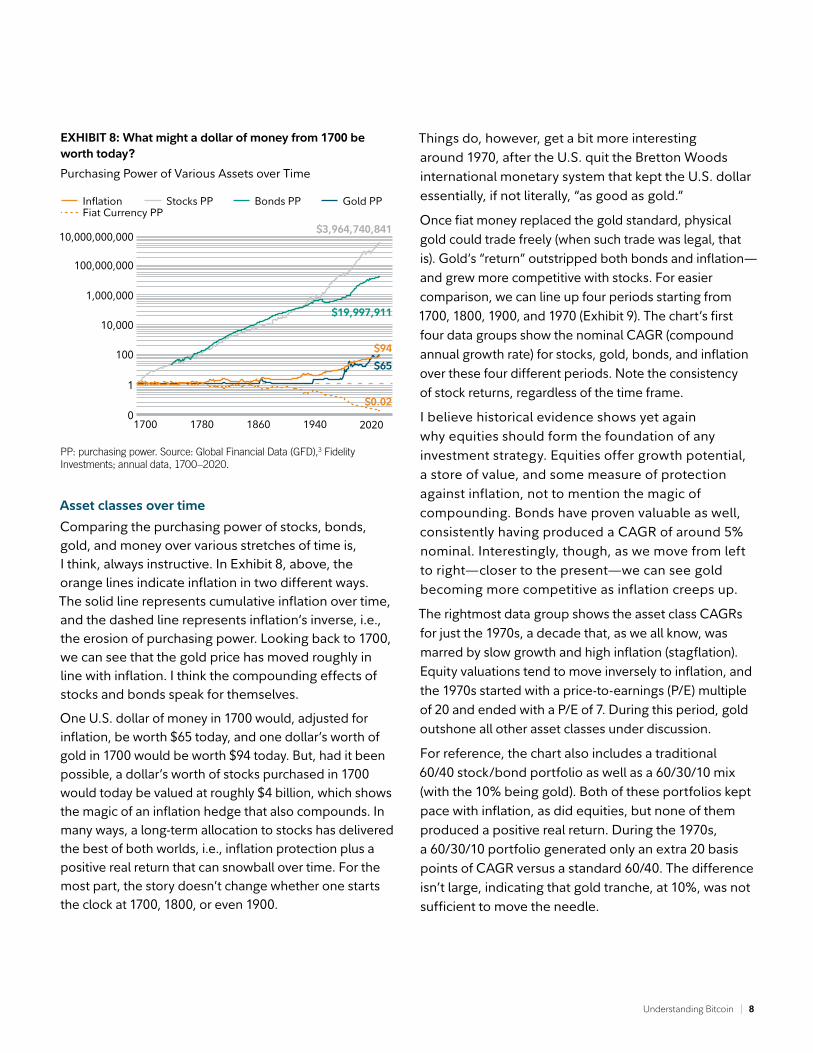
Comparing the purchasing power of stocks, bonds, gold, and money over various stretches of time is, I think, always instructive. In Exhibit 8, above, the orange lines indicate inflation in two different ways. The solid line represents cumulative inflation over time, and the dashed line represents inflation’s inverse, i.e., the erosion of purchasing power. Looking back to 1700, we can see that the gold price has moved roughly in line with inflation. I think the compounding effects of stocks and bonds speak for themselves.
One U.S. dollar of money in 1700 would, adjusted for inflation, be worth $65 today, and one dollar’s worth of gold in 1700 would be worth $94 today. But, had it been possible, a dollar’s worth of stocks purchased in 1700 would today be valued at roughly $4 billion, which shows the magic of an inflation hedge that also compounds. In many ways, a long-term allocation to stocks has delivered the best of both worlds, i.e., inflation protection plus a positive real return that can snowball over time. For the most part, the story doesn’t change whether one starts the clock at 1700, 1800, or even 1900.
Gold PPInflationFiat Currency PP
Stocks PP Bonds PP
1700 1780 1860 19400
1
100
10,000
1,000,000
100,000,000
10,000,000,000
2020
$0.02
$65
$94
$19,997,911
$3,964,740,841
PP: purchasing power. Source: Global Financial Data (GFD),3 Fidelity Investments; annual data, 1700–2020.
EXHIBIT 8: What might a dollar of money from 1700 be worth today?
Purchasing Power of Various Assets over Time
Things do, however, get a bit more interesting around 1970, after the U.S. quit the Bretton Woods international monetary system that kept the U.S. dollar essentially, if not literally, “as good as gold.”
Once fiat money replaced the gold standard, physical gold could trade freely (when such trade was legal, that is). Gold’s “return” outstripped both bonds and inflation—and grew more competitive with stocks. For easier comparison, we can line up four periods starting from 1700, 1800, 1900, and 1970 (Exhibit 9). The chart’s first four data groups show the nominal CAGR (compound annual growth rate) for stocks, gold, bonds, and inflation over these four different periods. Note the consistency of stock returns, regardless of the time frame.
I believe historical evidence shows yet again why equities should form the foundation of any investment strategy. Equities offer growth potential, a store of value, and some measure of protection against inflation, not to mention the magic of compounding. Bonds have proven valuable as well, consistently having produced a CAGR of around 5% nominal. Interestingly, though, as we move from left to right—closer to the present—we can see gold becoming more competitive as inflation creeps up.
The rightmost data group shows the asset class CAGRs for just the 1970s, a decade that, as we all know, was marred by slow growth and high inflation (stagflation). Equity valuations tend to move inversely to inflation, and the 1970s started with a price-to-earnings (P/E) multiple of 20 and ended with a P/E of 7. During this period, gold outshone all other asset classes under discussion.
For reference, the chart also includes a traditional 60/40 stock/bond portfolio as well as a 60/30/10 mix (with the 10% being gold). Both of these portfolios kept pace with inflation, as did equities, but none of them produced a positive real return. During the 1970s, a 60/30/10 portfolio generated only an extra 20 basis points of CAGR versus a standard 60/40. The difference isn’t large, indicating that gold tranche, at 10%, was not sufficient to move the needle.

Understanding Bitcoin | 9
Of course, whether the present era of fiat money will meet with inflation or a crashing dollar remains to be seen. After all, Japan has been down this path already—yet the Japanese economy has experienced essentially zero inflation and the yen remains a stable currency (Exhibit 10).
The Bank of Japan (BoJ) has gone much further than the U.S. Federal Reserve, with the BoJ balance sheet at 128% of GDP (the Fed is at a mere 36%). Since 2008, Japan’s debt-to-GDP ratio has risen about 100 percentage points, all of which was monetized by its central bank, yet its five-year annualized inflation rate has not budged and the yen has not collapsed.
1700–2020 1800–2020 1900–2020 1970–2020 1970–1980
CAGR
0%
10%
20%
30%
Bonds Inflation 60/30/10 60/40Stocks Gold
Source: Bloomberg Finance L.P., Global Financial Data, Fidelity Investments; annual data, 1700–2020.
EXHIBIT 9: Which assets have delivered the best investment returns over different time horizons?
Asset Class Returns for Various Horizons
-
0%-1%
1%
3%2%
4%
6%5%
7%8%
Inflation (5-Year CAGR)
1983 1993 2003 2013 1983 1993 2003 2013
5%
20%
80%
320%
-2.0% 50
100
150
0.0%
2.0%0.03%0.32%
10-Year JGBDeposit Rate Labor Force Growth
Govt Debt/GDP Public & Private Debt/GDPBoJ Assets/GDP Monetary Base/GDP
Japan Real E�ective Exchange Rate
JGB: Japanese government bond. Source: Bloomberg Finance L.P., Haver Analytics, Fidelity Investments; quarterly data, 1983–2020.
EXHIBIT 10: Even amid massive efforts, inflation is not a given.
Vital Statistics: Japan

Understanding Bitcoin | 10
One of the lessons here may be that, during normal times, investors may want to limit that portion of their portfolios dedicated to inflation hedges (like gold), given the high opportunity cost of reduced investment in assets that compound over time. One should want to be long, but not irresponsibly so.
But when conditions go extreme—meaning high inflation or hyperinflation—no matter how big one’s hedge is, it will seem not nearly enough, at least in my experience. At such times, we might wish we had been “irresponsibly” long. This dilemma, investors have always faced. We cannot predict the future with any certainty.
Conclusions
After dipping heavily into some of the data, what are the takeaways?
In my view, bitcoin has gone mainstream, already considered a legitimate asset class by more and more investors. I think bitcoin has both a compelling supply dynamic (S2F) and demand dynamic (Metcalfe’s Law). At close to $900 billion, bitcoin is still just a fraction of gold’s total global value of roughly $11 trillion, not to mention total global financial assets of $160 trillion.
With interest rates close to zero—or negative—and central banks printing money like there’s no tomorrow, is it any wonder that bitcoin seems to be having its day? The global monetary debasement story has a new protagonist, as well as fresh catalyst, in the form of COVID stimulus.
As far as I can see, the current economic situation need not end in tears. The Japan riddle is an important counterargument to consider when using monetary debasement to argue the case for owning either gold or digital assets (or both).
Either way, bitcoin is gaining credibility, and as a digital analog of gold but with greater convexity, my guess is that bitcoin will, over time, take more market share from gold.
Before the days of fiat money—when the price of gold was mostly fixed—gold was money and little more (exclusive of jewelry, medicine, electronics, and other commercial uses). Without the ability to compound, gold did not stand a chance against equities except during periods of high inflation or, more so, hyperinflation. But that changed during the 1970s when the gold price was allowed to float freely and reflect monetary conditions around the world. Whereas in the old days bonds beat gold 2-to-1, since 1970, gold and bonds have been neck-and-neck in terms of returns.
Which brings me to the 60/40 paradigm. If gold is now competitive with bonds, and bond yields are near zero (or negative), could it make sense to replace some of a portfolio’s nominal bond exposure with gold and assets that behave like gold? Many have already done so, whether via inflation-protected Treasuries, low-duration bank loans, or commodities—and opportunity cost of such a shift has become less and less. In my view, the only question may be, how much?
If bitcoin is a legitimate store of value, is scarcer than gold, and comes complete with a potentially exponential demand dynamic, then is it now worth considering for inclusion in a portfolio (at some prudent level and at least alongside other alternatives, such as real estate, commodities, and certain index-linked securities)? Despite the many risks discussed—including such factors as volatility, competitors, and policy intervention—for some the answer may well be “yes,” at least insofar as that “yes” applies only to components on the 40 side of 60/40. For those investors, the question of bitcoin may no longer be “whether” but “how much?”

Understanding Bitcoin | 11
Endnotes1 CoinDesk, creator of the first price reference (2013)—Bitcoin Price Index—puts it this way: “Bitcoin was the first cryptocurrency to successfully record transactions on a secure, decentralized blockchain-based network. Launched in early 2009 by its pseudonymous creator Satoshi Nakamoto, Bitcoin is the largest cryptocurrency measured by market capitalization and amount of data stored on its blockchain. ... Only approximately 21 million bitcoins will ever be created. New coins are minted every 10 minutes by bitcoin miners who help to maintain the network by adding new transaction data to the blockchain.” Bitcoin.org, originally registered and owned by bitcoin’s first two developers, has this to say: “Bitcoin is a consensus network that enables a new payment system and a completely digital money. It is the first decentralized peer-to-peer payment network that is powered by its users with no central authority or middlemen. From a user perspective, Bitcoin is pretty much like cash for the internet. Bitcoin can also be seen as the most prominent triple-entry bookkeeping system in existence.” For more information, see fidelitydigitalassets.com.2 The United States, in its early days, entertained various gold standards but in 1900 fixed the price of a dollar at “twenty-five and eight-tenths grains of gold nine-tenths fine.” This set the gold price at $20.67 per troy ounce (480 grains). The Gold Reserve Act of 1933 revoked the gold standard and nationalized gold ownership; subsequently, Congress raised the statutory gold price to $35 per ounce (an early form of quantitative easing). From 1946 to 1971, the Bretton Woods agreements kept 44 major countries’ external exchange rates to within 1% of the U.S. gold price. But since 1971, after Richard Nixon effectively abandoned the Bretton Woods gold standard, the United States has issued only fiat money, with currency backed by “the full faith and credit” of its issuing authority alone. 3 Global Financial Data (GFD) has used proprietary research on global stock markets and individual securities to create the most extensive set of total return series for stocks, bonds, bills and commodities for all major countries. GFD’s extensive historical database on hundreds of sovereign bonds has been used to create bond indices that begin in 1700. GFD data also has been used to create commodity indices that follow the path of energy, agricultural and non-agricultural commodities over the past millennium.
Information provided in this document is for informational and educational purposes only. To the extent any investment information in this material is deemed to be a recommendation, it is not meant to be impartial investment advice or advice in a fiduciary capacity and is not intended to be used as a primary basis for you or your client’s investment decisions. Fidelity and its representatives may have a conflict of interest in the products or services mentioned in this material because they have a financial interest in them, and receive compensation, directly or indirectly, in connection with the management, distribution, and/or servicing of these products or services, including Fidelity funds, certain third-party funds and products, and certain investment services.
The stocks mentioned here are not necessarily holdings invested in by FMR LLC. References to specific companies should not be construed as a recommendation or investment advice. The statements and opinions are subject to change at any time, based on market and other conditions.
Information presented herein is for discussion and illustrative purposes only and is not a recommendation or an offer or a solicitation to buy or sell any securities. Views expressed are as of February 2021, based on the informa tion available at that time, and may change based on market and other conditions. Unless otherwise noted, the opinions provided are those of the author and not necessarily those of Fidelity Investments or its affiliates. Fidelity does not assume any duty to update any of the information.
Third parties mentioned are independent entities and not affiliated with Fidelity Investments.
Investment decisions should be based on an individual’s own goals, time horizon, and tolerance for risk. Nothing in this content should be considered to be legal or tax advice, and you are encouraged to consult your own lawyer, accountant, or other advisor before making any financial decision.
Stock markets are volatile and can fluctuate significantly in response to company, industry, political, regulatory, market, or economic developments. Foreign markets can be more volatile than U.S. markets due to increased risks of adverse issuer, political, market, or economic developments, all of which are magnified in emerging markets. These risks are particularly significant for investments that focus on a single country or region.
Digital assets are speculative and highly volatile, can become illiquid at any time, and are for investors with a high risk tolerance. Investors in digital assets could lose the entire value of their investment.
Investing involves risk, including risk of loss.
Past performance and dividend rates are historical and do not guarantee future results.
Diversification and asset allocation do not ensure a profit or guarantee against loss.
All indices are unmanaged. You cannot invest directly in an index.
The Chartered Financial Analyst (CFA) designation is offered by the CFA Institute. To obtain the CFA charter, candidates must pass three exams demonstrating their competence, integrity, and extensive knowledge in accounting, ethical and professional standards, economics, portfolio management, and security analysis, and must also have at least four years of qualifying work experience, among other requirements. CFA® and Chartered Financial Analyst® are registered trademarks owned by CFA Institute.
Third-party marks are the property of their respective owners; all other marks are the property of FMR LLC.
This material is for educational purposes only and is not an offer for any security or digital asset. This material may be distributed through the following businesses: Fidelity InstitutionalSM provides investment products through Fidelity Distributors Company LLC; clearing, custody, or other brokerage services through National Financial Services LLC or Fidelity Brokerage Services LLC (Members NYSE, SIPC); and institutional advisory services through Fidelity Institutional Wealth Adviser LLC.
Personal and workplace investment products are provided by Fidelity Brokerage Services LLC, Member NYSE, SIPC.
Institutional asset management is provided by FIAM LLC and Fidelity Institutional Asset Management Trust Company.
Fidelity Digital Asset Services, LLC, is a New York State-chartered, limited liability trust company (NMLS ID 1773897).
© 2021 FMR LLC. All rights reserved.
964586.1.1 1.9901337.101
AuthorJurrien TimmerDirector of Global Macro Fidelity Global Asset Allocation Division
He specializes in global macro strategy and tactical asset allocation. He joined Fidelity in 1995 as a technical research analyst.
Fidelity Thought Leadership Director David Risgin, CFA, provided editorial direction for this article.