TTI Fiber Optic Training Solutions Advanced Fiber Optic Test & Measurement.
A fiber optic probe design to measure depth-
limited optical properties in-vivo with Low-
coherence Enhanced Backscattering (LEBS)
Spectroscopy
Nikhil N. Mutyal, Andrew Radosevich, Bradley Gould,
Jeremy D. Rogers, Andrew Gomes, Vladimir Turzhitsky, and Vadim Backman*
1Department of Biomedical Engineering, Northwestern University, 2145 Sheridan Road, Evanston IL 60208, USA
Abstract: Low-coherence enhanced backscattering (LEBS) spectroscopy is
an angular resolved backscattering technique that is sensitive to sub-
diffusion light transport length scales in which information about scattering
phase function is preserved. Our group has shown the ability to measure the
spatial backscattering impulse response function along with depth-selective
optical properties in tissue ex-vivo using LEBS. Here we report the design
and implementation of a lens-free fiber optic LEBS probe capable of
providing depth-limited measurements of the reduced scattering coefficient
in-vivo. Experimental measurements combined with Monte Carlo
simulation of scattering phantoms consisting of polystyrene microspheres in
water are used to validate the performance of the probe. Additionally,
depth-limited capabilities are demonstrated using Monte Carlo modeling
and experimental measurements from a two-layered phantom.
©2012 Optical Society of America
OCIS codes: (170.6510) Spectroscopy, tissue diagnostics; (290.1350) Backscattering,
(060.2310) Fiber optics.
References and links
1. G. A. Wagnières, W. M. Star, and B. C. Wilson, “In vivo fluorescence spectroscopy and imaging for oncological
applications,” Photochem. Photobiol. 68(5), 603–632 (1998).
2. A. Richter, K. Yang, F. Richter, H. T. Lynch, and M. Lipkin, “Morphological and morphometric measurements
in colorectal mucosa of subjects at increased risk for colonic neoplasia,” Cancer Lett. 74(1-2), 65–68 (1993).
3. C. Booth, G. Brady, and C. S. Potten, “Crowd control in the crypt,” Nat. Med. 8(12), 1360–1361 (2002).
4. R. Barer and S. Joseph, “Refractometry of living cells,” J. Microscop. Sci. s3–95, 399–423 (1954).
5. J. D. Rogers, I. R. Capoğlu, and V. Backman, “Nonscalar elastic light scattering from continuous random media
in the Born approximation,” Opt. Lett. 34(12), 1891–1893 (2009).
6. V. Turzhitsky, A. J. Radosevich, J. D. Rogers, N. N. Mutyal, and V. Backman, “Measurement of optical
scattering properties with low-coherence enhanced backscattering spectroscopy,” J. Biomed. Opt. 16(6), 067007
(2011).
7. H. K. Roy, V. Turzhitsky, Y. Kim, M. J. Goldberg, P. Watson, J. D. Rogers, A. J. Gomes, A. Kromine, R. E.
Brand, M. Jameel, A. Bogovejic, P. Pradhan, and V. Backman, “Association between rectal optical signatures
and colonic neoplasia: potential applications for screening,” Cancer Res. 69(10), 4476–4483 (2009).
8. B. Yu, H. Fu, T. Bydlon, J. E. Bender, and N. Ramanujam, “Diffuse reflectance spectroscopy with a self-
calibrating fiber optic probe,” Opt. Lett. 33(16), 1783–1785 (2008).
9. T. Papaioannou, N. W. Preyer, Q. Fang, A. Brightwell, M. Carnohan, G. Cottone, R. Ross, L. R. Jones, and L.
Marcu, “Effects of fiber-optic probe design and probe-to-target distance on diffuse reflectance measurements of
turbid media: an experimental and computational study at 337 nm,” Appl. Opt. 43(14), 2846–2860 (2004).
10. R. A. Schwarz, D. Arifler, S. K. Chang, I. Pavlova, I. A. Hussain, V. Mack, B. Knight, R. Richards-Kortum, and
A. M. Gillenwater, “Ball lens coupled fiber-optic probe for depth-resolved spectroscopy of epithelial tissue,”
Opt. Lett. 30(10), 1159–1161 (2005).
11. A. Amelink, H. J. C. M. Sterenborg, M. P. L. Bard, and S. A. Burgers, “In vivo measurement of the local optical
properties of tissue by use of differential path-length spectroscopy,” Opt. Lett. 29(10), 1087–1089 (2004).
#169818 - $15.00 USD Received 6 Jun 2012; revised 3 Aug 2012; accepted 6 Aug 2012; published 13 Aug 2012(C) 2012 OSA 27 August 2012 / Vol. 20, No. 18 / OPTICS EXPRESS 19643
12. A. Dhar, K. S. Johnson, M. R. Novelli, S. G. Bown, I. J. Bigio, L. B. Lovat, and S. L. Bloom, “Elastic scattering
spectroscopy for the diagnosis of colonic lesions: initial results of a novel optical biopsy technique,”
Gastrointest. Endosc. 63(2), 257–261 (2006).
13. S. P. Lin, L. Wang, S. L. Jacques, and F. K. Tittel, “Measurement of tissue optical properties by the use of
oblique-incidence optical fiber reflectometry,” Appl. Opt. 36(1), 136–143 (1997).
14. V. Turzhitsky, N. N. Mutyal, A. J. Radosevich, and V. Backman, “Multiple scattering model for the penetration
depth of low-coherence enhanced backscattering,” J. Biomed. Opt. 16(9), 097006 (2011).
15. J. D. Rogers, V. Stoyneva, V. Turzhitsky, N. N. Mutyal, P. Pradhan, I. R. Çapoğlu, and V. Backman, “Alternate
formulation of enhanced backscattering as phase conjugation and diffraction: derivation and experimental
observation,” Opt. Express 19(13), 11922–11931 (2011).
16. J. D. Rogers, V. Stoyneva, V. Turzhitsky, N. Mutyal, and Y. Ji, H. K. Roy, and V. Backman, “Polarized
enhanced backscattering spectroscopy for characterization of biological tissues at sub-diffusion length- scales,”
IEEE J. Sel. Top. Quantum Electron. (to be published).
17. Y. L. Kim, Y. Liu, V. M. Turzhitsky, R. K. Wali, H. K. Roy, and V. Backman, “Depth-resolved low-coherence
enhanced backscattering,” Opt. Lett. 30(7), 741–743 (2005).
18. V. Turzhitsky, J. D. Rogers, N. N. Mutyal, H. K. Roy, and V. Backman, “Characterization of light transport in
scattering media at sub-diffusion length scales with Low-coherence Enhanced Backscattering,” IEEE J. Sel. Top.
Quantum Electron. 16(3), 619–626 (2010).
19. J. C. Ramella-Roman, S. A. Prahl, and S. L. Jacques, “Three Monte Carlo programs of polarized light transport
into scattering media: part II,” Opt. Express 13(25), 10392–10405 (2005).
1. Introduction
Optical spectroscopy is a promising technique for the minimally invasive detection of cancers
and precancers [1]. The onset of precancer induces several structural changes in the mucosal
morphology [2,3] that result in changes in mass density distribution. According to the
Gladstone-Dale eq. (n (Refractive Index) = nwater + αρ), where ρ (g/ml) is the concentration
of tissue solids (primarily macromolecules) and refractive index increment α ~0.17 to 0.2
ml/g. Thus, changes in the spatial distribution of mass density are directly related to changes
in the distribution of refractive index [4]. As a result, these changes in tissue morphology can
be readily measured by analyzing the backscattering signal [5]. The statistics (and their
alteration in disease) of the spatial distribution of density and the corresponding refractive
index can be parameterized by three quantities: 1) the variance of the spatial variations of
refractive index ∆n2; 2) the correlation length of refractive index variation lc; and 3) the shape
of the correlation function m [5]. These changes in physical properties lead to alterations in
the macroscopic light scattering properties of tissue (e.g. reduced scattering coefficient µs*
and anisotropy coefficient g) [5–7]. Most precancerous structural changes take place in the
top mucosal layer, which causes changes in the light scattering properties of that layer [2,3].
A modality which restricts the depth of interrogation photons to this layer maximizes the
sensitivity of the measured optical properties to alterations in disease and provides an optimal
diagnostic capability. Hence the measurement of depth-limited optical properties serves as a
tool to characterize the structure of any material, and can be diagnostically significant for
tissue measurements.
Many techniques such as Diffuse Reflectance Spectroscopy [8–10], Differential Path
Length Spectroscopy [11], Elastic Light Scattering Spectroscopy [12], and Oblique-Incidence
Optical Fiber Re⟩ectometry [13] provide an excellent ability to measure depth-
resolved/limited optical properties of tissue in-vivo (µs,µa). Our group has recently developed
Low-Coherence Enhanced Backscattering (LEBS) spectroscopy, which has the additional
advantages of sensitivity to sub-diffusion light transport length scales for which information
about scattering phase function is preserved along with depth-limited interrogation
(superficial depths) [5,6,14]. Enhanced backscattering (EBS) is a result of the constructive
interference between photons traveling time-reversed paths in a turbid medium. The EBS
phenomenon manifests itself as an enhancement of scattered light intensity in the backward
direction with respect to the incident light. The shape of an EBS peak as a function of angle is
sensitive to µs* and the shape of the phase function [6]. Using an LEBS benchtop system, we
have demonstrated that low spatial coherence illumination (coherence length LSC <<ls*, ls* =
#169818 - $15.00 USD Received 6 Jun 2012; revised 3 Aug 2012; accepted 6 Aug 2012; published 13 Aug 2012(C) 2012 OSA 27 August 2012 / Vol. 20, No. 18 / OPTICS EXPRESS 19644
1/ µs* - light transport mean free path ~1 mm) facilitates the detection and quantification of
this effect in tissue [6,7]. Depth selectivity is achieved by selecting LSC, which acts as a spatial
filter limiting the radial displacement of photons that interfere to form the LEBS peak (a
smaller LSC rejects the signal from deeper tissue, resulting in a shorter average penetration
depth) [14]. In our recent publications we have shown that ex-vivo measurement of optical
properties by LEBS in rectal mucosal biopsies were able to predict the risk of future neoplasia
elsewhere in the colon with 90% accuracy (area under ROC curve) [7]. However, the
benchtop system can only be used for ex-vivo measurements due to its large size (Fig. 1);
hence there is a need to develop a fiber optic probe for in-vivo use.
In this manuscript the design, development, and implementation of a lens-free fiber optic
probe capable of depth-limited measurements of the reduced scattering coefficient of tissue
in-vivo is described. The manuscript is organized in the following way: section two describes
the LEBS ex-vivo observation and the process behind the conversion of the ex-vivo system to
an in-vivo probe. Section three outlines the principles of the observation of LEBS with a fiber
optic probe. Section four describes the design and implementation of the fiber optic LEBS
probe, while section five demonstrates the measurement of the LEBS signal and verification
with phantom and Monte Carlo simulations. Section six demonstrates depth selectivity of
measurement with two-layered phantoms and MC simulations, and section seven discusses
the novelty and limitation of the fiber optic probe, followed by the conclusion in section
eight.
2. LEBS ex-vivo experimental observation
The LEBS intensity peak defined by Eq. (1) is the Fourier transform of the spatial
backscattering impulse-response function (P(r)) multiplied by the spatial coherence function
(C(r)) [6].
( ) [ ( ). ( )]LEBSI FT P r C r=θ (1)
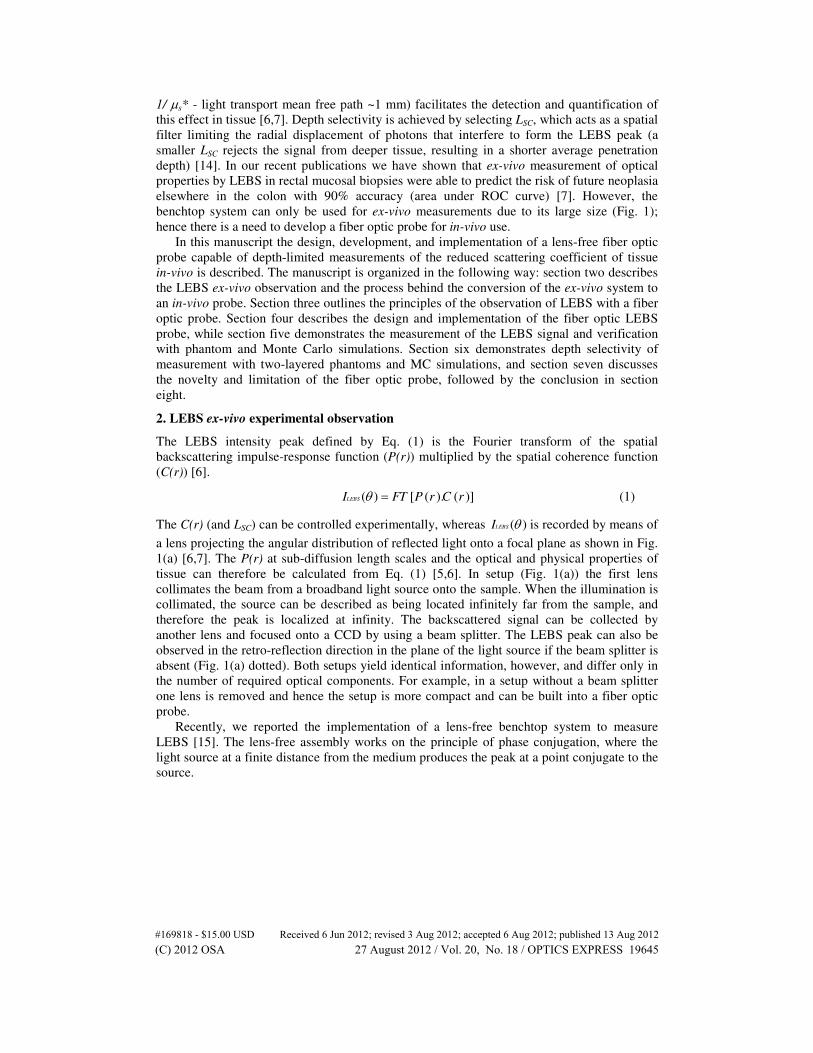
The C(r) (and LSC) can be controlled experimentally, whereas ( )LEBSI θ is recorded by means of
a lens projecting the angular distribution of reflected light onto a focal plane as shown in Fig.
1(a) [6,7]. The P(r) at sub-diffusion length scales and the optical and physical properties of
tissue can therefore be calculated from Eq. (1) [5,6]. In setup (Fig. 1(a)) the first lens
collimates the beam from a broadband light source onto the sample. When the illumination is
collimated, the source can be described as being located infinitely far from the sample, and
therefore the peak is localized at infinity. The backscattered signal can be collected by
another lens and focused onto a CCD by using a beam splitter. The LEBS peak can also be
observed in the retro-reflection direction in the plane of the light source if the beam splitter is
absent (Fig. 1(a) dotted). Both setups yield identical information, however, and differ only in
the number of required optical components. For example, in a setup without a beam splitter
one lens is removed and hence the setup is more compact and can be built into a fiber optic
probe.
Recently, we reported the implementation of a lens-free benchtop system to measure
LEBS [15]. The lens-free assembly works on the principle of phase conjugation, where the
light source at a finite distance from the medium produces the peak at a point conjugate to the
source.
#169818 - $15.00 USD Received 6 Jun 2012; revised 3 Aug 2012; accepted 6 Aug 2012; published 13 Aug 2012(C) 2012 OSA 27 August 2012 / Vol. 20, No. 18 / OPTICS EXPRESS 19645
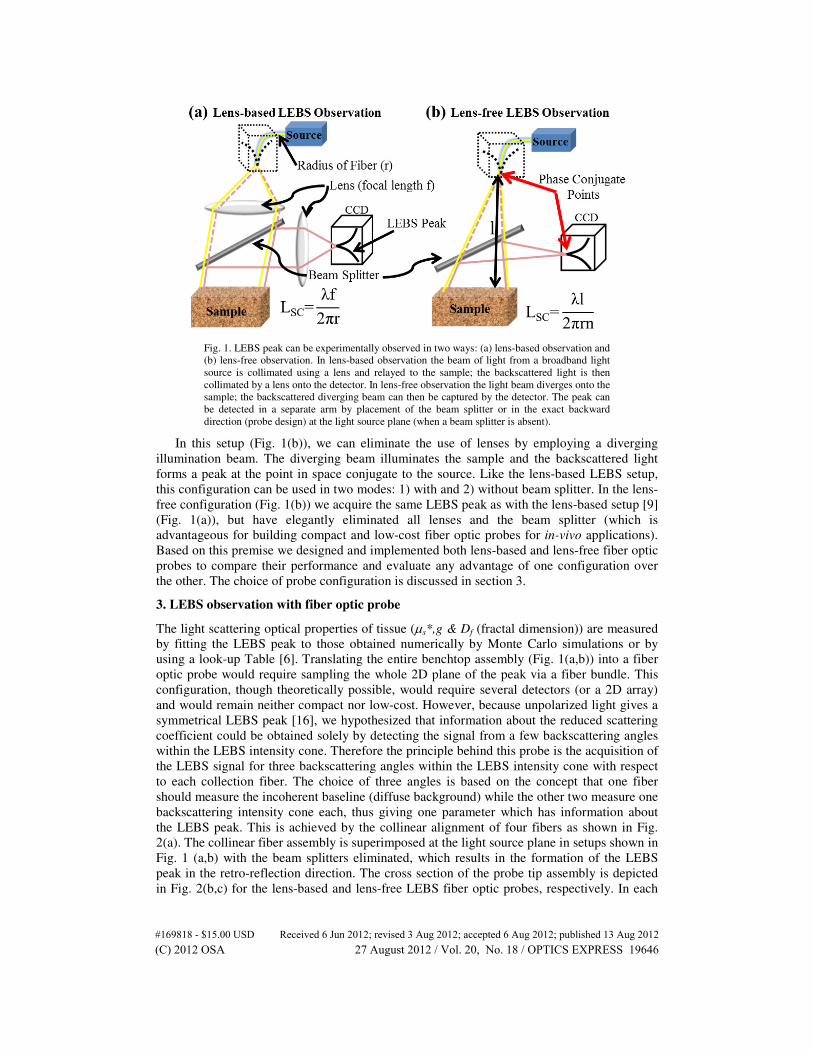
Fig. 1. LEBS peak can be experimentally observed in two ways: (a) lens-based observation and
(b) lens-free observation. In lens-based observation the beam of light from a broadband light
source is collimated using a lens and relayed to the sample; the backscattered light is then
collimated by a lens onto the detector. In lens-free observation the light beam diverges onto the
sample; the backscattered diverging beam can then be captured by the detector. The peak can
be detected in a separate arm by placement of the beam splitter or in the exact backward
direction (probe design) at the light source plane (when a beam splitter is absent).
In this setup (Fig. 1(b)), we can eliminate the use of lenses by employing a diverging
illumination beam. The diverging beam illuminates the sample and the backscattered light
forms a peak at the point in space conjugate to the source. Like the lens-based LEBS setup,
this configuration can be used in two modes: 1) with and 2) without beam splitter. In the lens-
free configuration (Fig. 1(b)) we acquire the same LEBS peak as with the lens-based setup [9]
(Fig. 1(a)), but have elegantly eliminated all lenses and the beam splitter (which is
advantageous for building compact and low-cost fiber optic probes for in-vivo applications).
Based on this premise we designed and implemented both lens-based and lens-free fiber optic
probes to compare their performance and evaluate any advantage of one configuration over
the other. The choice of probe configuration is discussed in section 3.
3. LEBS observation with fiber optic probe
The light scattering optical properties of tissue (µs*,g & Df (fractal dimension)) are measured
by fitting the LEBS peak to those obtained numerically by Monte Carlo simulations or by
using a look-up Table [6]. Translating the entire benchtop assembly (Fig. 1(a,b)) into a fiber
optic probe would require sampling the whole 2D plane of the peak via a fiber bundle. This
configuration, though theoretically possible, would require several detectors (or a 2D array)
and would remain neither compact nor low-cost. However, because unpolarized light gives a
symmetrical LEBS peak [16], we hypothesized that information about the reduced scattering
coefficient could be obtained solely by detecting the signal from a few backscattering angles
within the LEBS intensity cone. Therefore the principle behind this probe is the acquisition of
the LEBS signal for three backscattering angles within the LEBS intensity cone with respect
to each collection fiber. The choice of three angles is based on the concept that one fiber
should measure the incoherent baseline (diffuse background) while the other two measure one
backscattering intensity cone each, thus giving one parameter which has information about
the LEBS peak. This is achieved by the collinear alignment of four fibers as shown in Fig.
2(a). The collinear fiber assembly is superimposed at the light source plane in setups shown in
Fig. 1 (a,b) with the beam splitters eliminated, which results in the formation of the LEBS
peak in the retro-reflection direction. The cross section of the probe tip assembly is depicted
in Fig. 2(b,c) for the lens-based and lens-free LEBS fiber optic probes, respectively. In each
#169818 - $15.00 USD Received 6 Jun 2012; revised 3 Aug 2012; accepted 6 Aug 2012; published 13 Aug 2012(C) 2012 OSA 27 August 2012 / Vol. 20, No. 18 / OPTICS EXPRESS 19646
setup, channel Z is connected to the broadband light source. The LEBS peak forms at the
plane of the illumination fiber (dotted line Fig. 2(b and 2c) and is detected by the fiber array
(A’,A & B) placed collinearly to it. Channels A & A’ sample 0.6 ± 0.24 degrees on either side
of the peak (red dots depicted in Fig. 2(b and 2c)). Channel B samples 1.18 ± 0.24 degrees,
which is approximately the incoherent baseline. Thus, the three LEBS intensities from the
backscattering angles in the 2D peak are mapped onto the spectrometer to give the intensity
profile in 1D (red dots in Fig. 2b and 2c). The intensities collected by Channels A, A’& B are
defined by Eqs. (2) and (3)
, ( ) (0.6 , 0.6 , 0.6 ),) (A A DiffuseI E I′ Θ = ± ° = Θ = ± ° + Θ = ± °λ λ λ (2)
1.18 , 1.18 ,( ) ( )B DiffuseI IΘ = ° = Θ = °λ λ (3)
where IDiffuse(Θ, λ) is the diffuse intensity and E(Θ, λ) is the LEBS interference signal
denoting a rise above the diffuse baseline (IDiffuse) both for certain collection angles Θ. Also
since
0.6 , ~ 1.18 ,( ) ( )Diffuse DiffuseI IΘ = ± ° Θ = °λ λ (4)
The LEBS signal (E - rise above diffuse baseline at Θ = ± 0.6°) can be obtained by the
subtraction of Eq. (3) from Eq. (2) as given in Eq. (5)
,0.6 , 0.6 , 1.1( ) ( ) ( )8 ,A A BE I I′Θ = ± ° = Θ = ± ° − Θ = °λ λ λ (5)
Fig. 2. In order to convert the 2D ex-vivo system (Fig. 1) to an in-vivo probe, the beam splitter
is removed and the peak is detected in retro-reflective direction at the light source plane. The
detectors are the fibers in array (Fig. 3 (b). A, A’&B) surrounding the light source fiber (Z)
which collect several backscattering angle cones. (b&c) shows the lens-based and lens-free
version of the probe assembly.
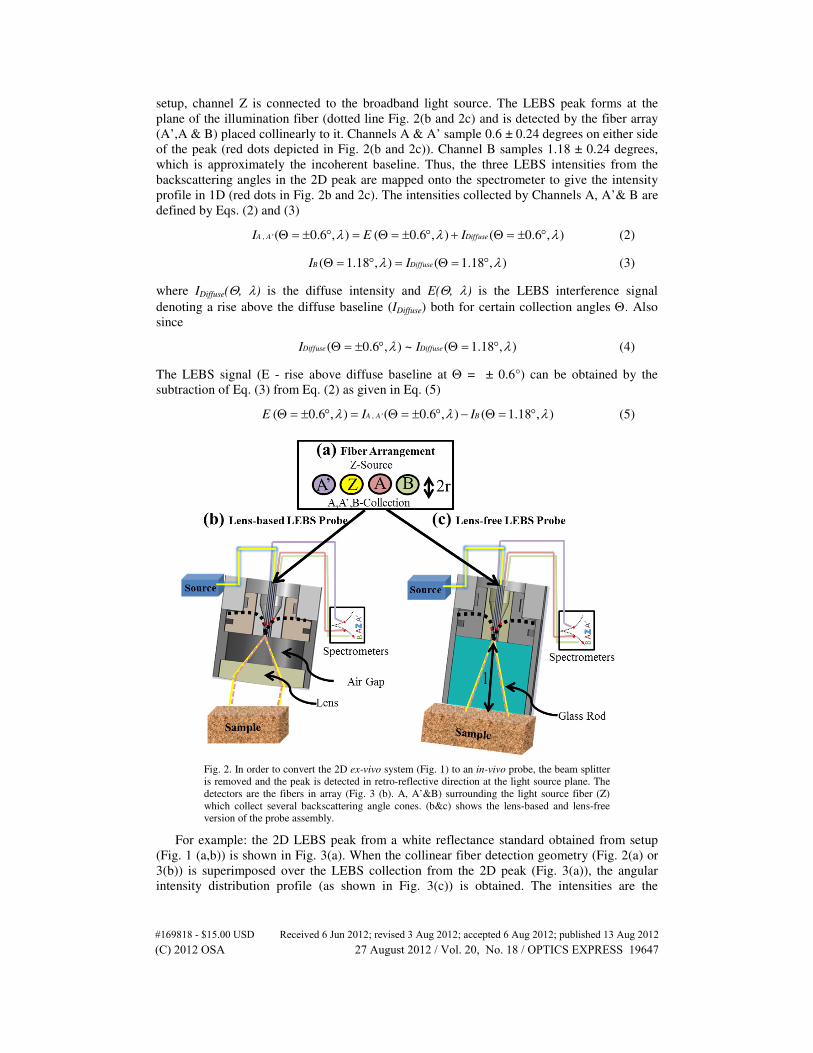
For example: the 2D LEBS peak from a white reflectance standard obtained from setup
(Fig. 1 (a,b)) is shown in Fig. 3(a). When the collinear fiber detection geometry (Fig. 2(a) or
3(b)) is superimposed over the LEBS collection from the 2D peak (Fig. 3(a)), the angular
intensity distribution profile (as shown in Fig. 3(c)) is obtained. The intensities are the
#169818 - $15.00 USD Received 6 Jun 2012; revised 3 Aug 2012; accepted 6 Aug 2012; published 13 Aug 2012(C) 2012 OSA 27 August 2012 / Vol. 20, No. 18 / OPTICS EXPRESS 19647
specific LEBS backscattering cone intensities captured by the probe collection fibers at
particular angles. While Fig. 3(c) shows each collection fiber in 2D, the actual intensity
captured through the probe is an average of all pixels. Note that the probe does not collect a
signal through channel Z, as it is connected to the light source. Thus the principle of
measuring LEBS via a fiber optic probe is based on capturing three intensity values as
represented in Fig. 3(c), instead of the whole 2D peak as was the case in ex-vivo LEBS
observation (Fig. 3(a)).
Fig. 3. (a) 2D LEBS peak is shown for white reflectance standard with LSC 27µm at 680nm
which is obtained from LEBS ex-vivo system. (b) The front end of the probe is shown, with
fiber Z used as illumination and the other three (A’, A & B) used as collection. (c) Once the
fiber geometry is superimposed on the LEBS 2D peak, the shown profile is obtained
The LEBS peak is formed due to the interference of time-reversed photons above the
incoherent (diffuse) baseline as given by Eq. (2) and (3) and represented in Fig. 3(a). We have
shown that LEBS intensity at each angle on the LEBS peak is sensitive to various optical
properties and represents a particular penetration depth [17]. The 2D ex-vivo experimental
setup collects the entire peak. The probe design collects backscattering intensity angles at ±
0.6 ± 0.24 (A&A’) and 1.18 ± 0.24 (B) degrees (Eq. (2), (3), and (5)), and we hypothesize
that this information would be sufficient to experimentally measure the depth-limited reduced
scattering coefficient for diagnostics in-vivo. To verify this, we modeled the LEBS signal
intensities collected via probe geometry with the Mie Monte Carlo (Mie MC) simulation
developed by our group [18]. A slab of a medium composed of polystyrene beads in water
was used. The code collected only small-angle backscattered rays from 0° to 10° most
suitable for modeling backscattering, and the Mie phase function was used in MC to obtain
the probability distribution of backscattered light (P(r)). The 2D LEBS peaks were obtained
by numerically computing the Fourier transform of P(r)*C(r) from Eq. (1). The average
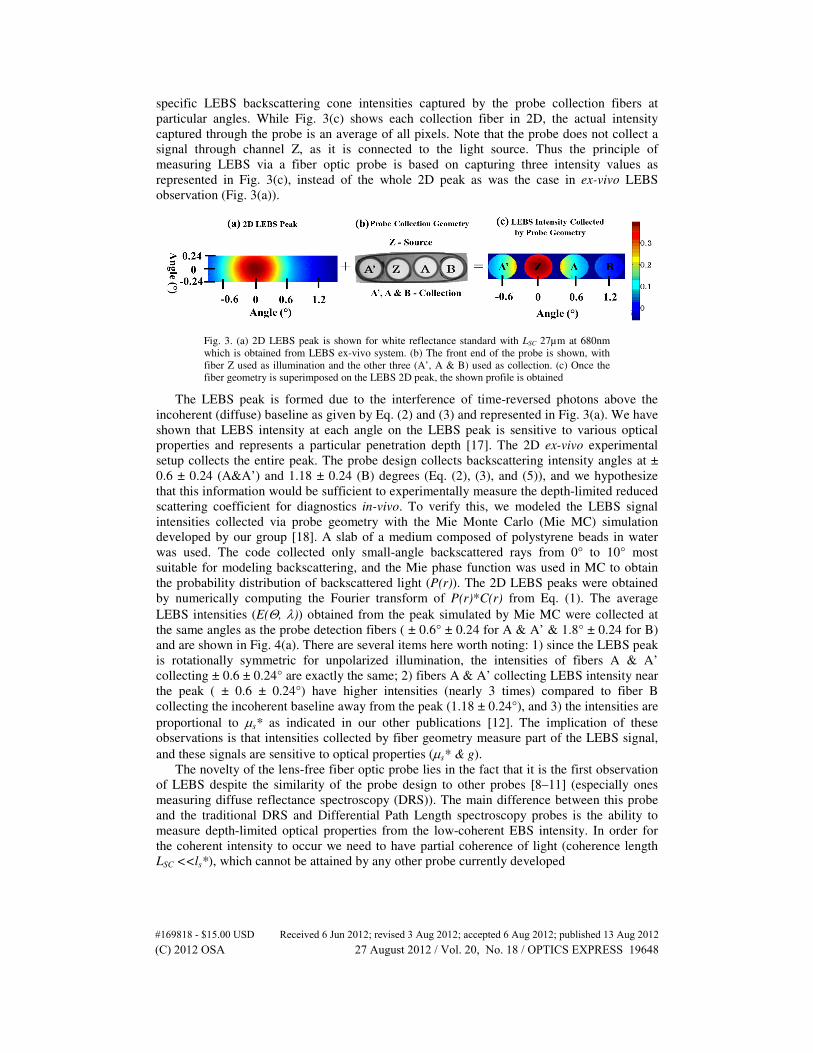
LEBS intensities (E(Θ, λ)) obtained from the peak simulated by Mie MC were collected at
the same angles as the probe detection fibers ( ± 0.6° ± 0.24 for A & A’ & 1.8° ± 0.24 for B)
and are shown in Fig. 4(a). There are several items here worth noting: 1) since the LEBS peak
is rotationally symmetric for unpolarized illumination, the intensities of fibers A & A’
collecting ± 0.6 ± 0.24° are exactly the same; 2) fibers A & A’ collecting LEBS intensity near
the peak ( ± 0.6 ± 0.24°) have higher intensities (nearly 3 times) compared to fiber B
collecting the incoherent baseline away from the peak (1.18 ± 0.24°), and 3) the intensities are
proportional to µs* as indicated in our other publications [12]. The implication of these
observations is that intensities collected by fiber geometry measure part of the LEBS signal,
and these signals are sensitive to optical properties (µs* & g).
The novelty of the lens-free fiber optic probe lies in the fact that it is the first observation
of LEBS despite the similarity of the probe design to other probes [8–11] (especially ones
measuring diffuse reflectance spectroscopy (DRS)). The main difference between this probe
and the traditional DRS and Differential Path Length spectroscopy probes is the ability to
measure depth-limited optical properties from the low-coherent EBS intensity. In order for
the coherent intensity to occur we need to have partial coherence of light (coherence length
LSC <<ls*), which cannot be attained by any other probe currently developed
#169818 - $15.00 USD Received 6 Jun 2012; revised 3 Aug 2012; accepted 6 Aug 2012; published 13 Aug 2012(C) 2012 OSA 27 August 2012 / Vol. 20, No. 18 / OPTICS EXPRESS 19648
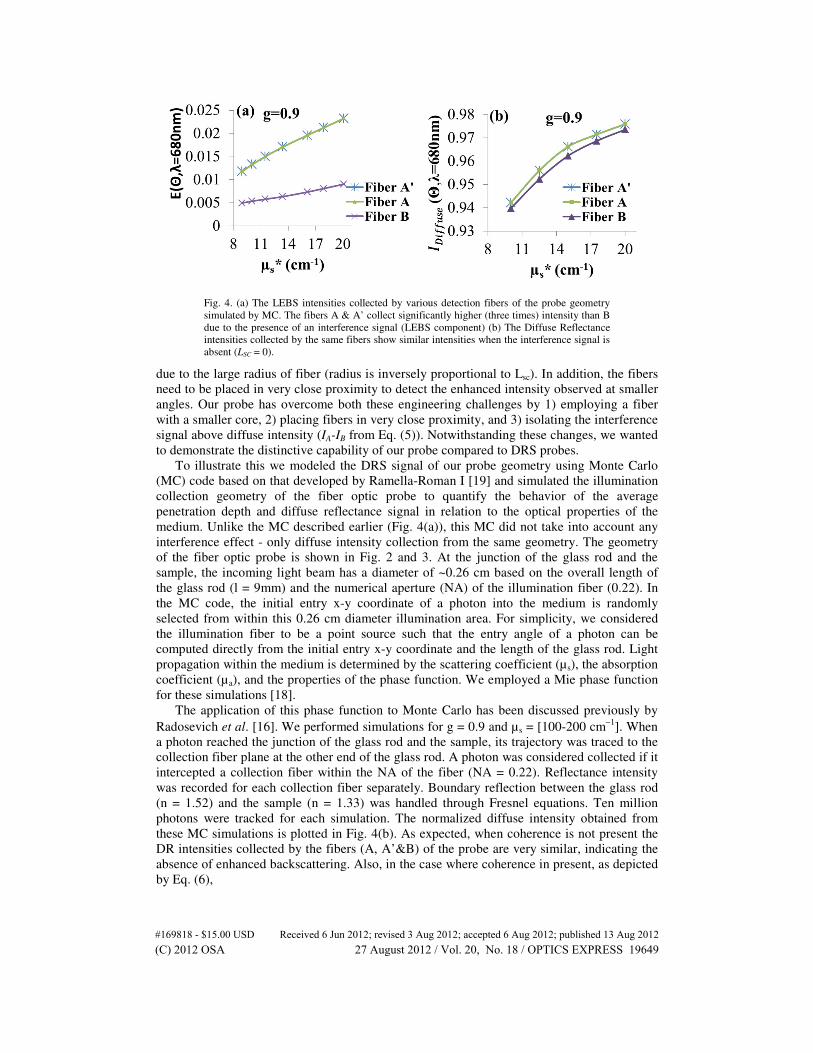
Fig. 4. (a) The LEBS intensities collected by various detection fibers of the probe geometry
simulated by MC. The fibers A & A’ collect significantly higher (three times) intensity than B
due to the presence of an interference signal (LEBS component) (b) The Diffuse Reflectance
intensities collected by the same fibers show similar intensities when the interference signal is
absent (LSC = 0).
due to the large radius of fiber (radius is inversely proportional to Lsc). In addition, the fibers
need to be placed in very close proximity to detect the enhanced intensity observed at smaller
angles. Our probe has overcome both these engineering challenges by 1) employing a fiber
with a smaller core, 2) placing fibers in very close proximity, and 3) isolating the interference
signal above diffuse intensity (IA-IB from Eq. (5)). Notwithstanding these changes, we wanted
to demonstrate the distinctive capability of our probe compared to DRS probes.
To illustrate this we modeled the DRS signal of our probe geometry using Monte Carlo
(MC) code based on that developed by Ramella-Roman I [19] and simulated the illumination
collection geometry of the fiber optic probe to quantify the behavior of the average
penetration depth and diffuse reflectance signal in relation to the optical properties of the
medium. Unlike the MC described earlier (Fig. 4(a)), this MC did not take into account any
interference effect - only diffuse intensity collection from the same geometry. The geometry
of the fiber optic probe is shown in Fig. 2 and 3. At the junction of the glass rod and the
sample, the incoming light beam has a diameter of ~0.26 cm based on the overall length of
the glass rod (l = 9mm) and the numerical aperture (NA) of the illumination fiber (0.22). In
the MC code, the initial entry x-y coordinate of a photon into the medium is randomly
selected from within this 0.26 cm diameter illumination area. For simplicity, we considered
the illumination fiber to be a point source such that the entry angle of a photon can be
computed directly from the initial entry x-y coordinate and the length of the glass rod. Light
propagation within the medium is determined by the scattering coefficient (µs), the absorption
coefficient (µa), and the properties of the phase function. We employed a Mie phase function
for these simulations [18].
The application of this phase function to Monte Carlo has been discussed previously by
Radosevich et al. [16]. We performed simulations for g = 0.9 and µs = [100-200 cm−1
]. When
a photon reached the junction of the glass rod and the sample, its trajectory was traced to the
collection fiber plane at the other end of the glass rod. A photon was considered collected if it
intercepted a collection fiber within the NA of the fiber (NA = 0.22). Reflectance intensity
was recorded for each collection fiber separately. Boundary reflection between the glass rod
(n = 1.52) and the sample (n = 1.33) was handled through Fresnel equations. Ten million
photons were tracked for each simulation. The normalized diffuse intensity obtained from
these MC simulations is plotted in Fig. 4(b). As expected, when coherence is not present the
DR intensities collected by the fibers (A, A’&B) of the probe are very similar, indicating the
absence of enhanced backscattering. Also, in the case where coherence in present, as depicted
by Eq. (6),
#169818 - $15.00 USD Received 6 Jun 2012; revised 3 Aug 2012; accepted 6 Aug 2012; published 13 Aug 2012(C) 2012 OSA 27 August 2012 / Vol. 20, No. 18 / OPTICS EXPRESS 19649
0.6 ,
40.6
( )
( ), 1.1( )8 ,Diffuse Diffuse
E
I I
Θ = ± °>
Θ = ± ° − Θ = °
λλ λ
(6)
the dominant signal is that of enhanced backscattering. This demonstrates that probes which
do not have a condition for finite spatial coherence do not detect enhanced signals (as is
detected by our probe geometry (Eqs. (5) and (6)), thus indicating the novelty of design.
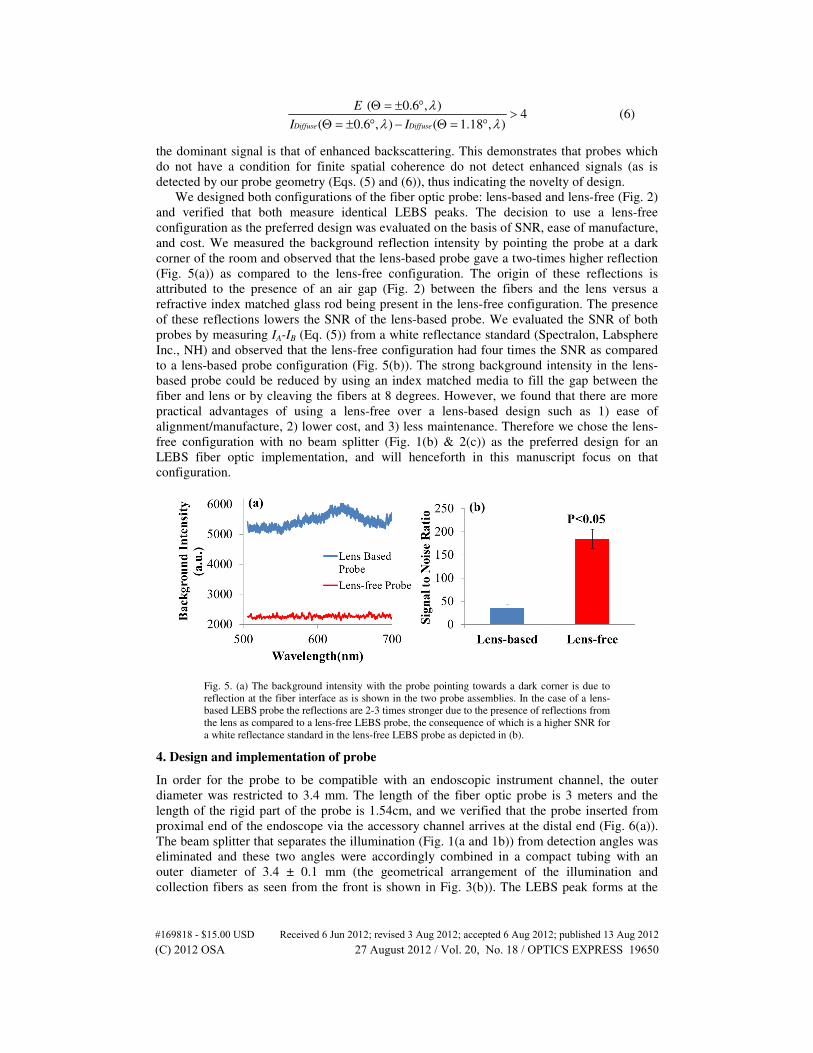
We designed both configurations of the fiber optic probe: lens-based and lens-free (Fig. 2)
and verified that both measure identical LEBS peaks. The decision to use a lens-free
configuration as the preferred design was evaluated on the basis of SNR, ease of manufacture,
and cost. We measured the background reflection intensity by pointing the probe at a dark
corner of the room and observed that the lens-based probe gave a two-times higher reflection
(Fig. 5(a)) as compared to the lens-free configuration. The origin of these reflections is
attributed to the presence of an air gap (Fig. 2) between the fibers and the lens versus a
refractive index matched glass rod being present in the lens-free configuration. The presence
of these reflections lowers the SNR of the lens-based probe. We evaluated the SNR of both
probes by measuring IA-IB (Eq. (5)) from a white reflectance standard (Spectralon, Labsphere
Inc., NH) and observed that the lens-free configuration had four times the SNR as compared
to a lens-based probe configuration (Fig. 5(b)). The strong background intensity in the lens-
based probe could be reduced by using an index matched media to fill the gap between the
fiber and lens or by cleaving the fibers at 8 degrees. However, we found that there are more
practical advantages of using a lens-free over a lens-based design such as 1) ease of
alignment/manufacture, 2) lower cost, and 3) less maintenance. Therefore we chose the lens-
free configuration with no beam splitter (Fig. 1(b) & 2(c)) as the preferred design for an
LEBS fiber optic implementation, and will henceforth in this manuscript focus on that
configuration.
Fig. 5. (a) The background intensity with the probe pointing towards a dark corner is due to
reflection at the fiber interface as is shown in the two probe assemblies. In the case of a lens-
based LEBS probe the reflections are 2-3 times stronger due to the presence of reflections from
the lens as compared to a lens-free LEBS probe, the consequence of which is a higher SNR for
a white reflectance standard in the lens-free LEBS probe as depicted in (b).
4. Design and implementation of probe
In order for the probe to be compatible with an endoscopic instrument channel, the outer
diameter was restricted to 3.4 mm. The length of the fiber optic probe is 3 meters and the
length of the rigid part of the probe is 1.54cm, and we verified that the probe inserted from
proximal end of the endoscope via the accessory channel arrives at the distal end (Fig. 6(a)).
The beam splitter that separates the illumination (Fig. 1(a and 1b)) from detection angles was
eliminated and these two angles were accordingly combined in a compact tubing with an
outer diameter of 3.4 ± 0.1 mm (the geometrical arrangement of the illumination and
collection fibers as seen from the front is shown in Fig. 3(b)). The LEBS peak forms at the
#169818 - $15.00 USD Received 6 Jun 2012; revised 3 Aug 2012; accepted 6 Aug 2012; published 13 Aug 2012(C) 2012 OSA 27 August 2012 / Vol. 20, No. 18 / OPTICS EXPRESS 19650
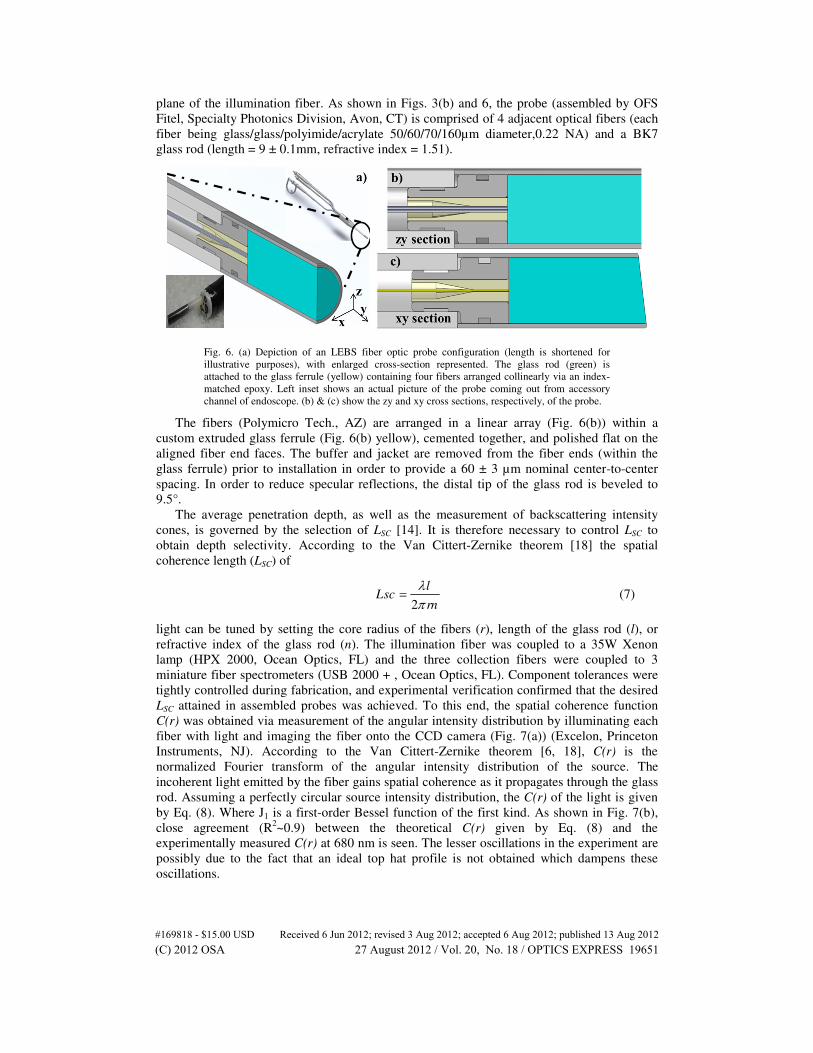
plane of the illumination fiber. As shown in Figs. 3(b) and 6, the probe (assembled by OFS
Fitel, Specialty Photonics Division, Avon, CT) is comprised of 4 adjacent optical fibers (each
fiber being glass/glass/polyimide/acrylate 50/60/70/160µm diameter,0.22 NA) and a BK7
glass rod (length = 9 ± 0.1mm, refractive index = 1.51).
Fig. 6. (a) Depiction of an LEBS fiber optic probe configuration (length is shortened for
illustrative purposes), with enlarged cross-section represented. The glass rod (green) is
attached to the glass ferrule (yellow) containing four fibers arranged collinearly via an index-
matched epoxy. Left inset shows an actual picture of the probe coming out from accessory
channel of endoscope. (b) & (c) show the zy and xy cross sections, respectively, of the probe.
The fibers (Polymicro Tech., AZ) are arranged in a linear array (Fig. 6(b)) within a
custom extruded glass ferrule (Fig. 6(b) yellow), cemented together, and polished flat on the
aligned fiber end faces. The buffer and jacket are removed from the fiber ends (within the
glass ferrule) prior to installation in order to provide a 60 ± 3 µm nominal center-to-center
spacing. In order to reduce specular reflections, the distal tip of the glass rod is beveled to
9.5°.
The average penetration depth, as well as the measurement of backscattering intensity
cones, is governed by the selection of LSC [14]. It is therefore necessary to control LSC to
obtain depth selectivity. According to the Van Cittert-Zernike theorem [18] the spatial
coherence length (LSC) of
2
lLsc
rn=
λπ
(7)
light can be tuned by setting the core radius of the fibers (r), length of the glass rod (l), or
refractive index of the glass rod (n). The illumination fiber was coupled to a 35W Xenon
lamp (HPX 2000, Ocean Optics, FL) and the three collection fibers were coupled to 3
miniature fiber spectrometers (USB 2000 + , Ocean Optics, FL). Component tolerances were
tightly controlled during fabrication, and experimental verification confirmed that the desired
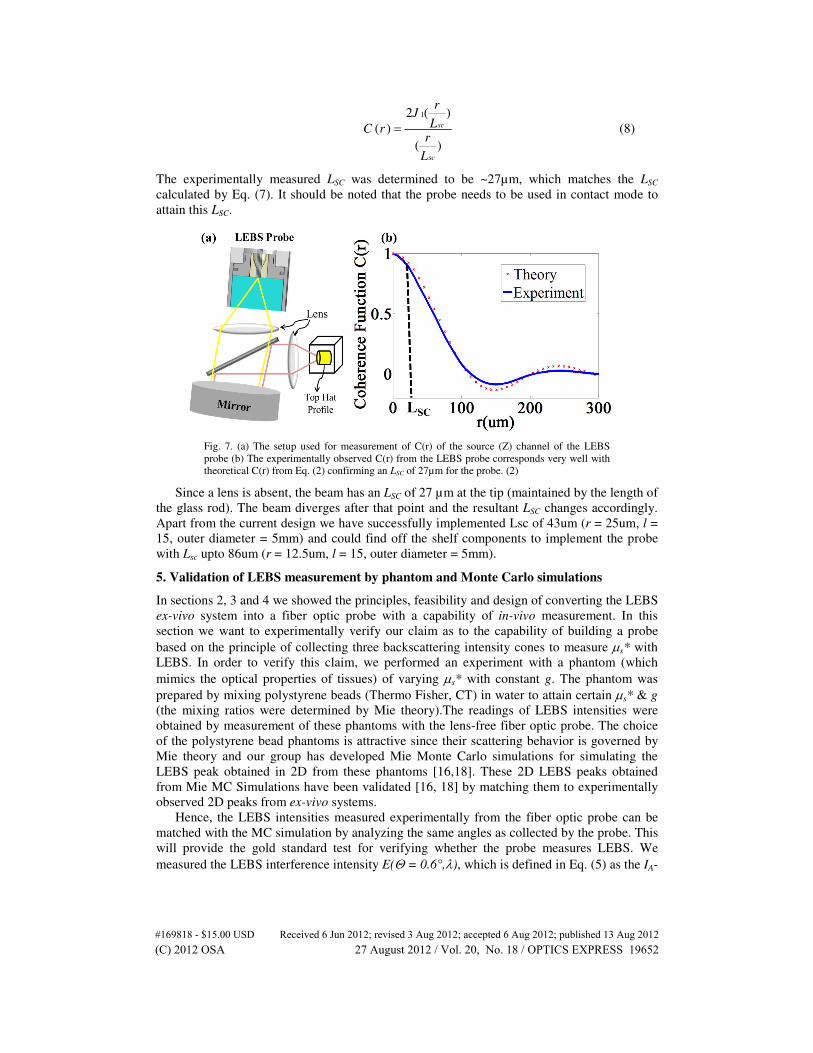
LSC attained in assembled probes was achieved. To this end, the spatial coherence function
C(r) was obtained via measurement of the angular intensity distribution by illuminating each
fiber with light and imaging the fiber onto the CCD camera (Fig. 7(a)) (Excelon, Princeton
Instruments, NJ). According to the Van Cittert-Zernike theorem [6, 18], C(r) is the
normalized Fourier transform of the angular intensity distribution of the source. The
incoherent light emitted by the fiber gains spatial coherence as it propagates through the glass
rod. Assuming a perfectly circular source intensity distribution, the C(r) of the light is given
by Eq. (8). Where J1 is a first-order Bessel function of the first kind. As shown in Fig. 7(b),
close agreement (R2~0.9) between the theoretical C(r) given by Eq. (8) and the
experimentally measured C(r) at 680 nm is seen. The lesser oscillations in the experiment are
possibly due to the fact that an ideal top hat profile is not obtained which dampens these
oscillations.
#169818 - $15.00 USD Received 6 Jun 2012; revised 3 Aug 2012; accepted 6 Aug 2012; published 13 Aug 2012(C) 2012 OSA 27 August 2012 / Vol. 20, No. 18 / OPTICS EXPRESS 19651
12 ( )
( )
( )
sc
sc
rJ
LC rr
L
= (8)
The experimentally measured LSC was determined to be ~27µm, which matches the LSC
calculated by Eq. (7). It should be noted that the probe needs to be used in contact mode to
attain this LSC.
Fig. 7. (a) The setup used for measurement of C(r) of the source (Z) channel of the LEBS
probe (b) The experimentally observed C(r) from the LEBS probe corresponds very well with
theoretical C(r) from Eq. (2) confirming an LSC of 27µm for the probe. (2)
Since a lens is absent, the beam has an LSC of 27 µm at the tip (maintained by the length of
the glass rod). The beam diverges after that point and the resultant LSC changes accordingly.
Apart from the current design we have successfully implemented Lsc of 43um (r = 25um, l =
15, outer diameter = 5mm) and could find off the shelf components to implement the probe
with Lsc upto 86um (r = 12.5um, l = 15, outer diameter = 5mm).
5. Validation of LEBS measurement by phantom and Monte Carlo simulations
In sections 2, 3 and 4 we showed the principles, feasibility and design of converting the LEBS
ex-vivo system into a fiber optic probe with a capability of in-vivo measurement. In this
section we want to experimentally verify our claim as to the capability of building a probe
based on the principle of collecting three backscattering intensity cones to measure µs* with
LEBS. In order to verify this claim, we performed an experiment with a phantom (which
mimics the optical properties of tissues) of varying µs* with constant g. The phantom was
prepared by mixing polystyrene beads (Thermo Fisher, CT) in water to attain certain µs* & g
(the mixing ratios were determined by Mie theory).The readings of LEBS intensities were
obtained by measurement of these phantoms with the lens-free fiber optic probe. The choice
of the polystyrene bead phantoms is attractive since their scattering behavior is governed by
Mie theory and our group has developed Mie Monte Carlo simulations for simulating the
LEBS peak obtained in 2D from these phantoms [16,18]. These 2D LEBS peaks obtained
from Mie MC Simulations have been validated [16, 18] by matching them to experimentally
observed 2D peaks from ex-vivo systems.
Hence, the LEBS intensities measured experimentally from the fiber optic probe can be
matched with the MC simulation by analyzing the same angles as collected by the probe. This
will provide the gold standard test for verifying whether the probe measures LEBS. We
measured the LEBS interference intensity E(Θ = 0.6°,λ), which is defined in Eq. (5) as the IA-
#169818 - $15.00 USD Received 6 Jun 2012; revised 3 Aug 2012; accepted 6 Aug 2012; published 13 Aug 2012(C) 2012 OSA 27 August 2012 / Vol. 20, No. 18 / OPTICS EXPRESS 19652
IB (obtained after background subtraction and normalization by a spectralon reflectance
standard with >98% reflectance).
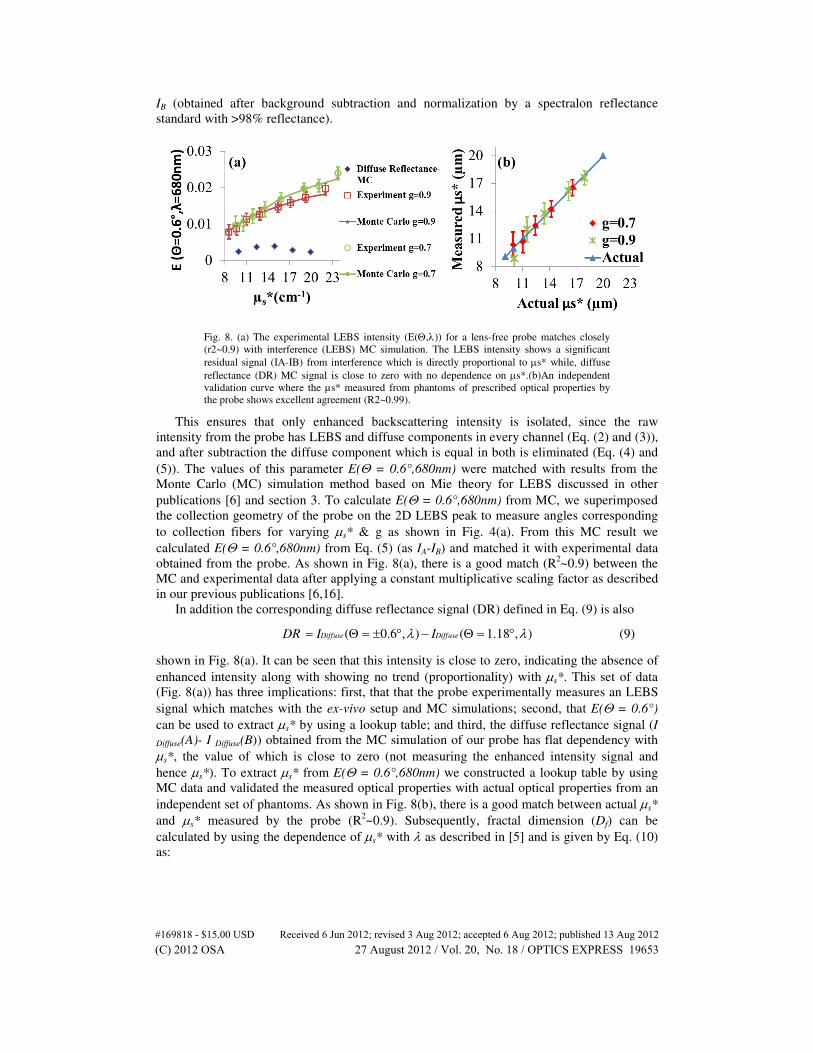
Fig. 8. (a) The experimental LEBS intensity (E(Θ,λ)) for a lens-free probe matches closely
(r2~0.9) with interference (LEBS) MC simulation. The LEBS intensity shows a significant
residual signal (IA-IB) from interference which is directly proportional to µs* while, diffuse
reflectance (DR) MC signal is close to zero with no dependence on µs*.(b)An independent
validation curve where the µs* measured from phantoms of prescribed optical properties by
the probe shows excellent agreement (R2~0.99).
This ensures that only enhanced backscattering intensity is isolated, since the raw
intensity from the probe has LEBS and diffuse components in every channel (Eq. (2) and (3)),
and after subtraction the diffuse component which is equal in both is eliminated (Eq. (4) and
(5)). The values of this parameter E(Θ = 0.6°,680nm) were matched with results from the
Monte Carlo (MC) simulation method based on Mie theory for LEBS discussed in other
publications [6] and section 3. To calculate E(Θ = 0.6°,680nm) from MC, we superimposed
the collection geometry of the probe on the 2D LEBS peak to measure angles corresponding
to collection fibers for varying µs* & g as shown in Fig. 4(a). From this MC result we
calculated E(Θ = 0.6°,680nm) from Eq. (5) (as IA-IB) and matched it with experimental data
obtained from the probe. As shown in Fig. 8(a), there is a good match (R2~0.9) between the
MC and experimental data after applying a constant multiplicative scaling factor as described
in our previous publications [6,16].
In addition the corresponding diffuse reflectance signal (DR) defined in Eq. (9) is also
( )0.6 , 8 )1( 1. ,Diffuse DiffuseDR I I= Θ = ± ° − Θ = °λ λ (9)
shown in Fig. 8(a). It can be seen that this intensity is close to zero, indicating the absence of
enhanced intensity along with showing no trend (proportionality) with µs*. This set of data
(Fig. 8(a)) has three implications: first, that that the probe experimentally measures an LEBS
signal which matches with the ex-vivo setup and MC simulations; second, that E(Θ = 0.6°)
can be used to extract µs* by using a lookup table; and third, the diffuse reflectance signal (I
Diffuse(A)- I Diffuse(B)) obtained from the MC simulation of our probe has flat dependency with
µs*, the value of which is close to zero (not measuring the enhanced intensity signal and
hence µs*). To extract µs* from E(Θ = 0.6°,680nm) we constructed a lookup table by using
MC data and validated the measured optical properties with actual optical properties from an
independent set of phantoms. As shown in Fig. 8(b), there is a good match between actual µs*
and µs* measured by the probe (R2~0.9). Subsequently, fractal dimension (Df) can be
calculated by using the dependence of µs* with λ as described in [5] and is given by Eq. (10)
as:
#169818 - $15.00 USD Received 6 Jun 2012; revised 3 Aug 2012; accepted 6 Aug 2012; published 13 Aug 2012(C) 2012 OSA 27 August 2012 / Vol. 20, No. 18 / OPTICS EXPRESS 19653
0.6 ,
*0.4 1.5( )
(4
0.6 ,f
dE cD
d E c
Θ = ° ∗= +
∗ Θ = °
λ λλ λ
(10)
where, λc is the central (average) wavelength.
6. Demonstration of depth-limited measurement
Although in previous sections we have shown the ability of the LEBS probe to accurately
measure scattering optical properties, it is also important to achieve depth selectivity, as the
location of abnormal tissue in precancer is limited to the topmost mucosal layer. For example,
it is known that epithelial cells which are located at the bottom of the colon crypt can
accumulate mutations over a period of years and thus are the initiating cells in colon
carcinogenesis [3]. It is therefore crucial to have the ability to optimally probe these changes
with a depth-limited measurement. Depth selectivity is an inherent advantage of LEBS, since
the LEBS peak is obtained by combining the EBS measurements with low spatial coherence
and broadband illumination. In our previous studies [14], we showed that low spatial
coherence illumination (Lsc <ls<<ls*) behaves as a spatial filter that rejects longer path
lengths. Therefore, the penetration depth of LEBS photons can be limited by restricting the
spatial coherence length of illumination, Lsc.
The depth dependence of the LEBS enhancement for the 2D peak has been well
characterized [14] and can be easily applied to probe geometry. We wanted to verify and
characterize the dependency of optical scattering properties measured by the probe with an
average penetration depth. For a given optical property, a saturation curve C(T)
( ) ( )
T
o
C T p Z dZ= ∫ (11)
(where p(Z) is the probability that light returns from depth Z was constructed for E(Θ =
0.6°,680nm) by limiting the maximum depth from which rays were reflected (by modifying
the thickness of medium via post-processing of MC data) [14]. The normalized derivative
(p(Z) = dC/dT) of the saturation curve yielded the probability distribution as a function of
depth, p(Z). The average penetration depth (PDavg) was then calculated according to the first
moment [14]:
( )avgPD zp Z dz= ∫ (12)
Empirically, the average penetration depth (Eq. (12)) can be represented in closed form as:
1( ) ( *)b bavg
SCPD a L ls
−= (13)
Where:
0 1 2
2
0 1
2
(1 )b
a a a g a g
b b b g
= + +
= + − (14)
The term a and the power b depend on the anisotropy factor g (as described by Eq. (14)). The
constants are a0 = 0.54, a1 = −0.11, a2 = −0.23, b0 = 0.79, b1 = 0.24, and b2 = 0.75. The
expressions in Eq. (13) and values of the coefficients are obtained empirically by fitting with
Monte Carlo simulations. For tissue g~0.9 (which yields a = 0.26 & b = 0.84), the resultant
average penetration depth for the probe is 116µm (with ls* = 800). As shown in Eq. (13), the
average penetration depth of the probe is directly proportional to LSC and can be limited (by
modifying probe geometry) to the required range based on the application. We validated the
accuracy of the equation for a range of ls* and g relevant to a tissue regime by comparing the
#169818 - $15.00 USD Received 6 Jun 2012; revised 3 Aug 2012; accepted 6 Aug 2012; published 13 Aug 2012(C) 2012 OSA 27 August 2012 / Vol. 20, No. 18 / OPTICS EXPRESS 19654
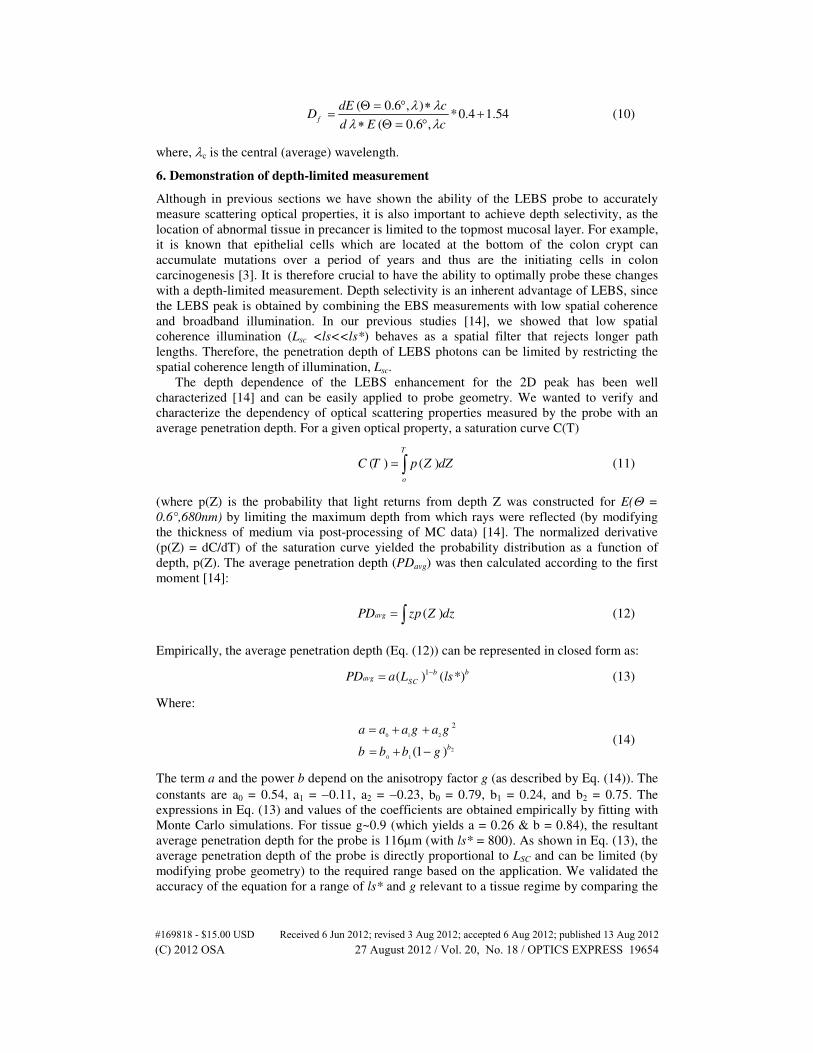
values of average penetration depth obtained from the equation with MC simulations at LSC =
27 µm. As shown in Fig. 9, good agreement (R2~0.99) is achieved between the two
suggesting the validity of the derived equation.
Fig. 9. The validity of Eq. (13) is verified by comparing the average penetration depth (LSC =
27 µm) with the simulation using Mie theory phase function [14]. Good agreement (R2~0.99)
is achieved between both indicating validity of the equation.
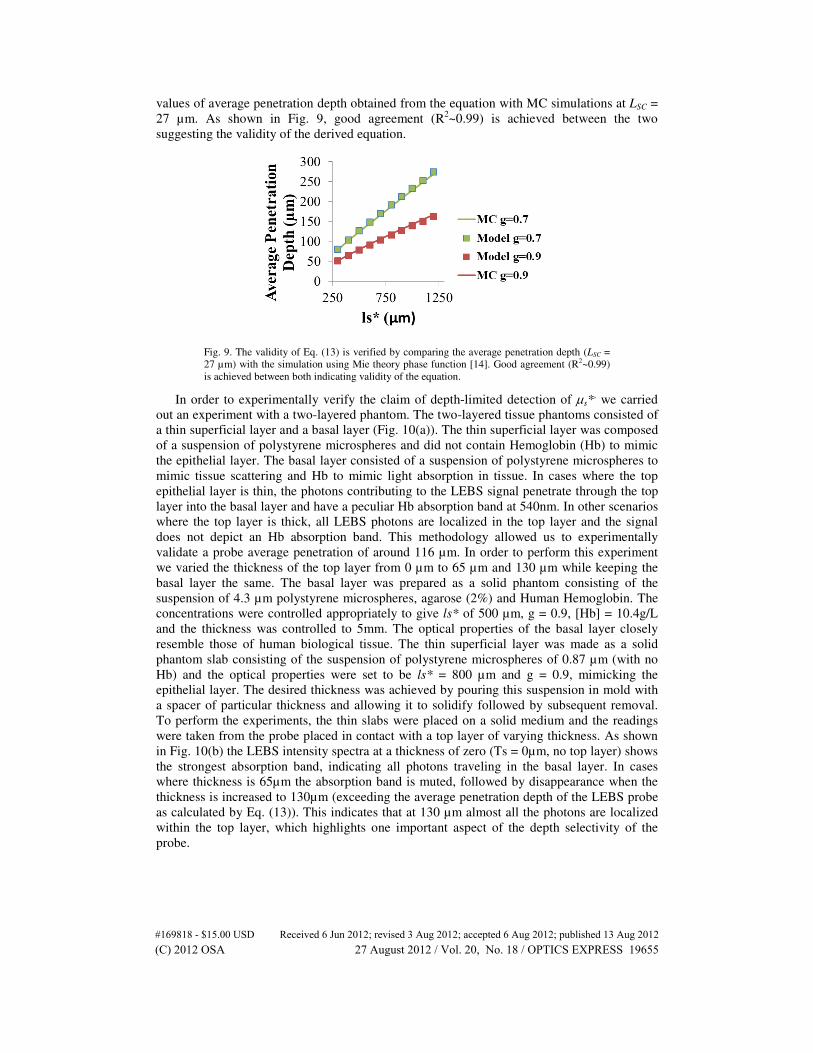
In order to experimentally verify the claim of depth-limited detection of µs*, we carried
out an experiment with a two-layered phantom. The two-layered tissue phantoms consisted of
a thin superficial layer and a basal layer (Fig. 10(a)). The thin superficial layer was composed
of a suspension of polystyrene microspheres and did not contain Hemoglobin (Hb) to mimic
the epithelial layer. The basal layer consisted of a suspension of polystyrene microspheres to
mimic tissue scattering and Hb to mimic light absorption in tissue. In cases where the top
epithelial layer is thin, the photons contributing to the LEBS signal penetrate through the top
layer into the basal layer and have a peculiar Hb absorption band at 540nm. In other scenarios
where the top layer is thick, all LEBS photons are localized in the top layer and the signal
does not depict an Hb absorption band. This methodology allowed us to experimentally
validate a probe average penetration of around 116 µm. In order to perform this experiment
we varied the thickness of the top layer from 0 µm to 65 µm and 130 µm while keeping the
basal layer the same. The basal layer was prepared as a solid phantom consisting of the
suspension of 4.3 µm polystyrene microspheres, agarose (2%) and Human Hemoglobin. The
concentrations were controlled appropriately to give ls* of 500 µm, g = 0.9, [Hb] = 10.4g/L
and the thickness was controlled to 5mm. The optical properties of the basal layer closely
resemble those of human biological tissue. The thin superficial layer was made as a solid
phantom slab consisting of the suspension of polystyrene microspheres of 0.87 µm (with no
Hb) and the optical properties were set to be ls* = 800 µm and g = 0.9, mimicking the
epithelial layer. The desired thickness was achieved by pouring this suspension in mold with
a spacer of particular thickness and allowing it to solidify followed by subsequent removal.
To perform the experiments, the thin slabs were placed on a solid medium and the readings
were taken from the probe placed in contact with a top layer of varying thickness. As shown
in Fig. 10(b) the LEBS intensity spectra at a thickness of zero (Ts = 0µm, no top layer) shows
the strongest absorption band, indicating all photons traveling in the basal layer. In cases
where thickness is 65µm the absorption band is muted, followed by disappearance when the
thickness is increased to 130µm (exceeding the average penetration depth of the LEBS probe
as calculated by Eq. (13)). This indicates that at 130 µm almost all the photons are localized
within the top layer, which highlights one important aspect of the depth selectivity of the
probe.
#169818 - $15.00 USD Received 6 Jun 2012; revised 3 Aug 2012; accepted 6 Aug 2012; published 13 Aug 2012(C) 2012 OSA 27 August 2012 / Vol. 20, No. 18 / OPTICS EXPRESS 19655
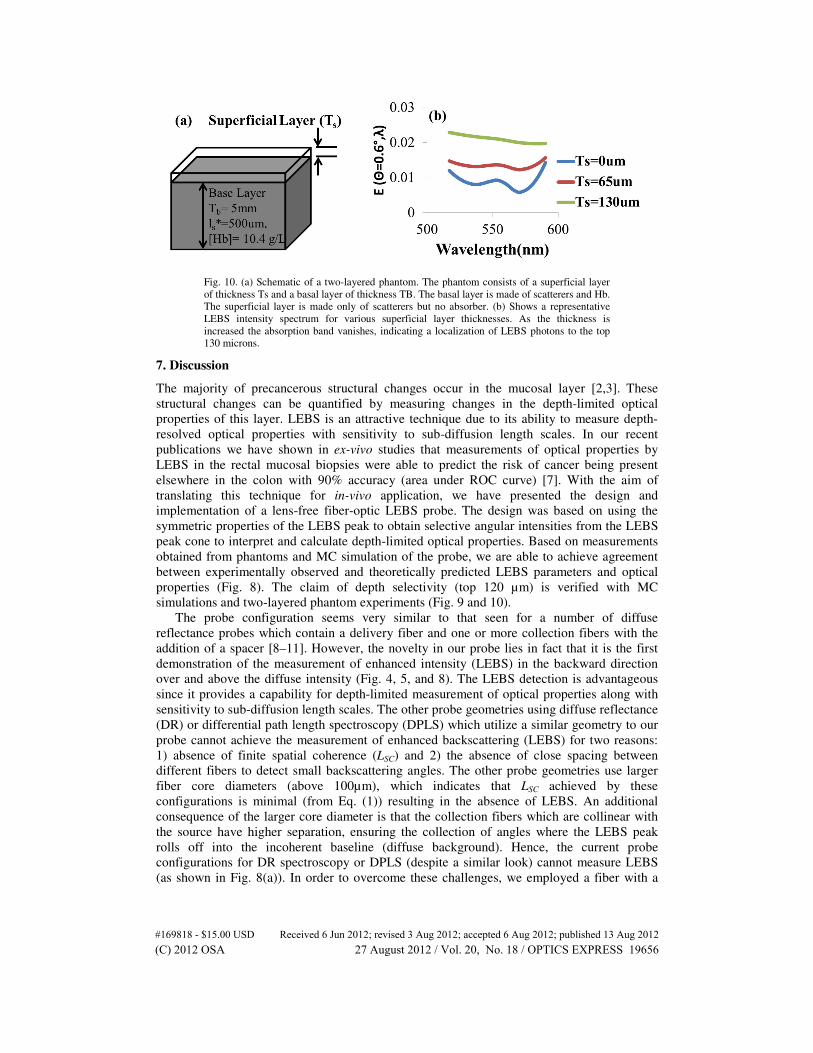
Fig. 10. (a) Schematic of a two-layered phantom. The phantom consists of a superficial layer
of thickness Ts and a basal layer of thickness TB. The basal layer is made of scatterers and Hb.
The superficial layer is made only of scatterers but no absorber. (b) Shows a representative
LEBS intensity spectrum for various superficial layer thicknesses. As the thickness is
increased the absorption band vanishes, indicating a localization of LEBS photons to the top
130 microns.
7. Discussion
The majority of precancerous structural changes occur in the mucosal layer [2,3]. These
structural changes can be quantified by measuring changes in the depth-limited optical
properties of this layer. LEBS is an attractive technique due to its ability to measure depth-
resolved optical properties with sensitivity to sub-diffusion length scales. In our recent
publications we have shown in ex-vivo studies that measurements of optical properties by
LEBS in the rectal mucosal biopsies were able to predict the risk of cancer being present
elsewhere in the colon with 90% accuracy (area under ROC curve) [7]. With the aim of
translating this technique for in-vivo application, we have presented the design and
implementation of a lens-free fiber-optic LEBS probe. The design was based on using the
symmetric properties of the LEBS peak to obtain selective angular intensities from the LEBS
peak cone to interpret and calculate depth-limited optical properties. Based on measurements
obtained from phantoms and MC simulation of the probe, we are able to achieve agreement
between experimentally observed and theoretically predicted LEBS parameters and optical
properties (Fig. 8). The claim of depth selectivity (top 120 µm) is verified with MC
simulations and two-layered phantom experiments (Fig. 9 and 10).
The probe configuration seems very similar to that seen for a number of diffuse
reflectance probes which contain a delivery fiber and one or more collection fibers with the
addition of a spacer [8–11]. However, the novelty in our probe lies in fact that it is the first
demonstration of the measurement of enhanced intensity (LEBS) in the backward direction
over and above the diffuse intensity (Fig. 4, 5, and 8). The LEBS detection is advantageous
since it provides a capability for depth-limited measurement of optical properties along with
sensitivity to sub-diffusion length scales. The other probe geometries using diffuse reflectance
(DR) or differential path length spectroscopy (DPLS) which utilize a similar geometry to our
probe cannot achieve the measurement of enhanced backscattering (LEBS) for two reasons:
1) absence of finite spatial coherence (LSC) and 2) the absence of close spacing between
different fibers to detect small backscattering angles. The other probe geometries use larger
fiber core diameters (above 100µm), which indicates that LSC achieved by these
configurations is minimal (from Eq. (1)) resulting in the absence of LEBS. An additional
consequence of the larger core diameter is that the collection fibers which are collinear with
the source have higher separation, ensuring the collection of angles where the LEBS peak
rolls off into the incoherent baseline (diffuse background). Hence, the current probe
configurations for DR spectroscopy or DPLS (despite a similar look) cannot measure LEBS
(as shown in Fig. 8(a)). In order to overcome these challenges, we employed a fiber with a
#169818 - $15.00 USD Received 6 Jun 2012; revised 3 Aug 2012; accepted 6 Aug 2012; published 13 Aug 2012(C) 2012 OSA 27 August 2012 / Vol. 20, No. 18 / OPTICS EXPRESS 19656
core diameter of 50µm and developed a process using a custom fabricated glass ferrule, and
stripped the fiber buffer jacket to ensure inter-fiber separation of ~60 µm. This ensured that
we met the conditions required for the observation of LEBS (finite LSC) and with fibers at
close angles
Conversion of any ex-vivo optical modality to an in-vivo fiber optic probe involves several
considerations and tradeoffs, and may involve some loss of information. In our case we
desired the probe to be easy to manufacture in large quantities, inexpensive, and to provide
depth-limited information about optical properties of the tissue. In a conventional ex-vivo
LEBS setup we measure four LEBS parameters (Enhancement (rise of peak above baseline at
Θ = 0°), FWHM (full width at half maximum of the peak), spectral slope (Enhancement as a
function of wavelength) and fractal dimension (Df)) from which we obtain optical properties
(µs*, g & Df) and physical properties (∆n2, lc, Df) via lookup Table [6]. In the case of the lens-
free fiber optic probe we had to make compromises due to issues with size, feasibility of
implementation in-vivo, number of detectors, cost etc., and hence could not measure some of
the parameters except for µs*(demonstrated in Fig. 8) and Df (Eq. (10)).Therefore, with the
current configuration of the probe, we were only able to measure two (µs* & Df) out of three
optical properties (µs*, g & Df) which are measured by the ex-vivo system (Fig. 1(a & b)). The
reduction of the 2D LEBS peak to three discrete pixels does represent a major loss of
information as compared to the full 2D peak, but as demonstrated we only lose information
about one optical property (g) with this implementation. Thus, although the P(r) obtained
from the ex-vivo LEBS system has sensitivity to sub-diffusion light transport length scales for
which information about scattering phase function is preserved, this is not realized in the
current probe configuration. The sensitivity and measurement of g can only be achieved by
either the collection of one more scattering angle (preferably a Z source fiber with beam
splitter), sampling the peak with a more closely spaced fiber/2D array, or by making
assumptions about phase function. We are currently working on implementing this capability
in the second generation of this probe. However, the other two parameters µs* & Df can be
reliably extracted as demonstrated here. It is also to be noted that once the probe is assembled
the LSC (and subsequent average penetration depth) is fixed and cannot be changed. In the
case of the ex-vivo LEBS system, LSC can be changed online resulting in the ability for depth-
resolved measurement. However, we plan to carry out ex-vivo biopsy studies of every
relevant organ with the ex-vivo system with varying LSC to determine the LSC that gives the
best diagnostic differentiation, and then use that LSC to build a fiber optic probe for in-vivo
use, hence avoiding the limitations we face due to these shortcomings.
8. Conclusion
In summary, we demonstrate the ability to perform depth-limited measurements of reduced
scattering coefficient and fractal dimension with a simple fiber optic probe using LEBS. The
novelty of the probe research is demonstrated by the first observation of LEBS with a
specially engineered lens-free fiber optic probe. The probe is based on the simple concept of
discretizing a 2D LEBS peak into a few backscattering angles and then collecting these
specific LEBS intensity cones to calculate the optical scattering properties. Depth selectivity
is obtained by tuning LSC and is demonstrated with two-layer phantoms and MC simulations.
We believe this probe will find applications in material characterization, cancer screening,
etc. Further studies in animals and humans are being performed to validate this claim.
Acknowledgment
This work supported by NIH R01CA128641, R01EB003682, R01CA156186 and NSF
CBET-0937987 grants. NNM thanks Benjamin Keane for excellent document preparation.
#169818 - $15.00 USD Received 6 Jun 2012; revised 3 Aug 2012; accepted 6 Aug 2012; published 13 Aug 2012(C) 2012 OSA 27 August 2012 / Vol. 20, No. 18 / OPTICS EXPRESS 19657