A COMPARISON OF THREE OPPORTUNITIES TO RESPOND …
119
A COMPARISON OF THREE OPPORTUNITIES TO RESPOND STRATEGIES ACROSS STUDENTS WITH EMOTIONAL AND BEHAVIORAL DISORDERS IN HIGH SCHOOL CLASSROOMS ______________________________________________________________________ A Dissertation Presented to The Faculty of the Graduate School At the University of Missouri _______________________________________________________________________ In Partial Fulfillment Of the Requirements for the Degree Doctor of Philosophy ____________________________________________________________________ By: REESHA MAYLENE ADAMSON Dr. Timothy J. Lewis, Dissertation Supervisor MAY 2013
Transcript of A COMPARISON OF THREE OPPORTUNITIES TO RESPOND …
A COMPARISON OF THREE OPPORTUNITIES TO RESPOND STRATEGIES
ACROSS STUDENTS WITH EMOTIONAL AND BEHAVIORAL DISORDERS IN
HIGH SCHOOL CLASSROOMS
______________________________________________________________________
A Dissertation
Presented to
The Faculty of the Graduate School
At the University of Missouri
_______________________________________________________________________
In Partial Fulfillment
Of the Requirements for the Degree
Doctor of Philosophy
____________________________________________________________________
By:
REESHA MAYLENE ADAMSON
Dr. Timothy J. Lewis, Dissertation Supervisor
MAY 2013
The undersigned, appointed by the Dean of the Graduate School,
have examined the dissertation entitled
A COMPARISON OF THREE OPPORTUNITIES TO RESPOND STRATEGIES
ACROSS STUDENTS WITH EMOTIONAL AND BEHAVIOR DISORDER IN HIGH
SCHOOL CLASSROOMS
Presented by Reesha Maylene Adamson
A candidate for the degree of
Doctor of Philosophy
And hereby certify that, in their opinion, it is worthy of acceptance.
___________________________________________________________
Dr. Timothy J. Lewis
___________________________________________________________
Dr. Janine Stichter
___________________________________________________________
Dr. Mike Pullis
___________________________________________________________
Dr. Melissa Stormont
___________________________________________________________
Dr. Keith Herman

ii
DEDICATION
I would like to dedicate this dissertation to my parents, Clyde and Judy Paul.
Both of my parents worked in the field of education and instilled in me the importance of
setting goals and striving to be the best individual that you can be. My parents have
supported me emotionally and mentally throughout this process and encouraged me to
persist through all of the trials and tribulations. My parents have been my biggest
supporters and continue to serve as models for how I would like to live my life, a debt
which I can never repay and will continue to shape my future. Thank you mom and dad
for being my biggest cheerleaders, I love you!
iii
ACKNOWLEDGEMENTS
I would like to thank my committee members, Dr. Janine Stichter, Dr. Mike
Pullis, Dr. Melissa Stormont, and Dr. Keith Herman for their ongoing support of me as a
student, and for always being there to assist when needed. Their work and knowledge
about students with emotional and behavioral disorders has profoundly impacted my
development as a practitioner and scholar within this field. They have guided me to
explore and investigate issue and have helped to develop me as a passionate researcher
seeking to improve the field. It has been a privilege to get to know each of you and work
with you.
I would also like to thank Barb Mitchell, Sean Wachsmuth, Nick Gage, and
Stacey Jones. These students have served as my “BD Buddies” guiding me every step of
the way. They have always been there to collaborate with, ask questions to, or even to
share in a refreshing beverage. Each of these individuals has molded my career in their
own way and I value them all, professionally and personally.
My advisor, Dr. Tim Lewis has served as the strongest influence over my work as
a professional. When I am struggling with any issue related to special education, I look
to Dr. Lewis for guidance. Dr. Lewis has become a friend throughout this process. Dr.
Lewis has shaped and impacted the field of special education in ways that I can only
dream to obtain. He has given me opportunities as a student that has developed me into a
strong, independent person who seeks to answer the unknown and has developed
relationships across the country which will guide me to following in his footsteps and
become a leader. Thank you Dr. Lewis for your continued support and mentorship.
iv
Finally, I would like to thank my husband, Brandon Adamson, for sticking out
this process with me over the past four years. You have been a constant supporter in your
own way, and have always allowed me to do what is best for me. I thank you for putting
up with my late night study sessions and strange work habits. I could not have gotten
through this process without you.
v
TABLE OF CONTENTS
ACKNOWLEDGEMENTS.................................................................................................ii
LIST OF TABLES..............................................................................................................vi
LIST OF FIGURES...........................................................................................................vii
ABSTRACT.....................................................................................................................viii
CHAPTER
1. LITERATURE REVIEW........................................................................................1
2. METHOD..............................................................................................................26
3. RESULTS..............................................................................................................44
4. DISCUSSION........................................................................................................65
VITA..................................................................................................................................83
REFERENCES..................................................................................................................84
APPENDIX
A. OPPORTUNITIES TO RESPOND INTERVENTION MANUAL.......................90
B. OPERATIONAL DEFINITION OF TEACHER AND
STUDENT BEHAVIORS.....................................................................................97
C. OPPORTUNITIES TO RESPOND TREATMENT INTEGRITY.......................103
D. SCHOOL INTERVENTION RATING FORM – TEACHER.............................105
E. SCHOOL INTERVENTION RATING FORM – STUDENT..............................110
vi
LIST OF TABLES
Table Page
1. Mean Student Disruption Rates Across Each Phase
and Condition of OTR.........................................................................................55
2. Student One’s Weekly Classroom Performance Percentage
Average as Recorded in the Teacher’s Gradebook.............................................58
3. Student Two’s Weekly Classroom Performance Percentage
Average as Recorded in the Teacher’s Gradebook.............................................59
4. Student Three’s Weekly Classroom Performance Percentage
Average as Recorded in the Teacher’s Gradebook.............................................60
5. Social Validity Ratings of Teacher Perceptions for Opportunities
to Respond Instructional Interventions...............................................................63
vii
LIST OF FIGURES
Figure Page
1. Percentage of Time Student One was Academically Engaged
During 10-Minute Observations of Mathematics Instruction
Before, Throughout Three Different OTR Intervention
Conditions, and During the Best Treatment.......................................................48
2. Percentage of Time Student Two was Academically Engaged
During 10-Minute Observations of Mathematics Instruction
Before, Throughout Three Different OTR Intervention
Conditions, and During the Best Treatment.......................................................51
3. Percentage of Time Student Three was Academically Engaged
During 10-Minute Observations of Mathematics Instruction
Before, Throughout Three Different OTR Intervention
Conditions, and During the Best Treatment.......................................................54
4. Teacher Rates of Individual Student and Group OTR for Each
Intervention Condition.......................................................................................56
viii
ABSTRACT
A single subject alternating treatment design across three teacher-student dyads was used
to investigate the comparative impact on student academic engaged time (AET) of three
common opportunities to respond (OTR) interventions, a) guided notes, b) class-wide
peer tutoring, and c) response cards. Subjects were three students with
Emotional/Behavioral Disorders (EBD) who displayed both failing academic
performance and high rates of problem behavior. All selected dyads were within a high
school math class. Results indicated all OTR interventions were effective in improving
percentage of AET and related academic outcomes. Using visual analysis and an
additional replication phase, response cards proved to the most efficacious in improving
student outcomes. Implications for future research and practice within high school are
discussed.
1
CHAPTER I
LITERATURE REVIEW
The defining characteristic of students identified for Emotional and Behavioral
Disorders (EBD) under the Individuals with Disabilities Education Act (IDEA) is that
educational achievement is adversely influenced by inappropriate and problem behaviors
(Section 300.7(b)(9)). Although the federal definition of EBD is clear, within
educational settings specialized instruction is provided to students on a broader spectrum
of manifestation of EBD. The specific range and prevalence of EBD is necessary to
understand the complexities which exist in serving this population (Cassidy, James, &
Wiggs, 2001). This population of students includes those with significant internalizing
and externalizing behavioral problems and mental health issues (Kauffman, Mock, &
Simpson, 2007). Research has also shown high co-morbidity of mental health diagnosed
disorders and EBD, such as conduct disorder, anxiety, depression, and attention deficit
hyperactive disorders (Cassidy, James, & Wiggs, 2001; Dietz & Montague, 2006).
Students with EBD present administrators, teachers, parents, policymakers, and
researchers with challenges related to the social and academic aspects of education and
related services (Gage et al., 2010; Peacock Hill Working Group, 1991). This population
of students is increasingly educated within general education environments and less
frequently in pull out self-contained classrooms (Trout, Nordness, Pierce, & Epstein,
2003). By definition, this population struggles to achieve in any environment. Insuring
academic success among students with EBD who are educated within general education
classrooms often falls on the shoulders of teachers with minimal training in behavior and
classroom management (Reschly & Christenson, 2006). This issue is compounded
2
within secondary settings. The effective design of classrooms to foster individual student
academic and behavioral success is often a difficult task for many secondary teachers
with the resulting high rates of student misbehavior often documented as one of the
leading reasons teachers leave the field (Simpson, Peterson, & Smith, 2011).
To support students’ academic and behavioral needs, which are critical for
students with EBD, it is important to implement effective instruction within classrooms.
Educating students with EBD must insure student academic growth towards graduation,
post-secondary education, and limit problem behavior, which can disrupt the learning
environment (Trout et al., 2003). Information from the US Department of Education’s
30th
annual Report to Congress (2008) on the implementation of IDEA reported that only
43% of students with EBD during the 2005-2006 school year graduated with a regular
diploma. Students with EBD often display low school engagement, poor attendance, low
academic achievement, conflicts with adults and peers, disruptive behavior, mental health
issues, failing grades, high dropout rates, and are at risk for school suspension (Lane,
Carter, Pierson, & Glaeser, 2006; Merrell & Walker, 2004; US Department of Education,
2008).
Successful learning environments address the individual needs of students within
the classroom to allow for the academic and social success of all students (Haydon,
Borders, Embury, & Clark, 2009). Ensuring success at the high school level requires
universal interventions to be implemented that are flexible enough to meet the needs
across the spectrum of student abilities within a classroom, be implemented with fidelity,
and easily embedded within any instructional content area (Sprick, & Borgmeier, 2010).
3
One intervention incorporating all of the above recommendations is to increase the
number of student “opportunities to respond” (OTR).
The remainder of this chapter will provide a review of the current challenges in
educating students with and who display EBD. Within the review, a broad use of the term
EBD is taken to include any student with a mild disability who is presenting intense and
challenging behavior (e.g., LD, OHI). A review of the current literature focused on
improving academic and behavioral outcomes will follow. Next, a review of the
potential impact of increasing OTRs will be examined with a focus on the specific
challenges that exist within secondary settings. Finally, the chapter concludes with the
proposed need for the study and research questions.
Academic and Social Outcomes
Outcomes for students with emotional and behavioral disorders have been
described as “particularly troubling” (Wagner, 1992, p.11). Wagner’s conclusion is
based on the continuing poor post-secondary outcomes found among this population of
students. Dismal outcomes for students with EBD have remained static with only
minimal gains since longitudinal data were first collected and reported in the early 1980’s
(Bradley, Doolittle, & Bartolotta, 2008). Bradley and colleagues, recommend that
educators’ attempt to build environments and supports that effectively address the needs
of students with EBD. To do this effectively, a system that focuses on behaviors within
the individual child, the child’s environment, and all adults who interact with the
environment is necessary (Bradley et al, 2008). Addressing each of these components of
students’ with EBD academic and behavioral need is critical to understanding how to
support successful academic achievement.
4
As early as third grade, a clear trend of poor academic growth is often established
among student at risk for EBD when compared to typically developing peers (Hinshaw,
1992). Much of the existing research that addresses the academic and behavioral needs
of students has been done with elementary age students during a time that is assumed to
be critical in changing poor post-secondary outcomes (Hinshaw, 1992). However, very
little research has addressed the possibility of continuing these interventions for
secondary students to address their ongoing academic and behavioral needs. Ignoring
intervening in secondary settings may neglect an additional critical period in these
student’s lives where students drop out of school because of disengagement from
education (Gage et al., 2010; Gunter & Denny, 1998; Peacock Hill Working Group,
1991). In elementary school, students with EBD typically perform 1.2 to 2 grade levels
behind their peers (Coutinho, 1986). This gap widens to almost 3.5 grade levels by
secondary school (Coutinho, 1986). Reid, Gonzalez, Nordness, Trout, and Epstein
(2004) compared students with EBD were compared to non-disabled peers. Results
showed that 75% of students with EBD scored below the mean on reading achievement
tests. In addition, the average level for the students in the EBD group was at the 25th
percentile.
Given the widening achievement gap, compounded by their challenging
behaviors, it is not surprising that students with emotional and behavioral disorders have
poor post-secondary outcomes (Trout et al., 2003). A review of literature from 1961 to
2000, reported that students with EBD performed poorer academically than their same-
age peers across reading, writing, and math (Trout et al., 2003). These poor outcomes are
5
thought to be a result of the limited focus found in schools on combining both academic
and behavioral supports.
Reschly and Christenson (2006) analyzed data from the National Educational
Longitudinal Study and found that students with disabilities were more likely to take
remedial courses, earn fewer credits in core curriculum, be retained prior to eighth grade,
earn lower scores on math and reading proficiency tests, and drop out of school. These
descriptors of students with EBD are precursors to the dismal post-secondary outcomes
that have been well documented by the research community. Addressing these variables
within the school context through successful interventions to support students both
behaviorally and academically may help alter this trajectory.
Furthermore, frequent use of evidence-based practices are noticeably absent from
instruction for many students with EBD (Gunter & Denny, 1998). In the absence of
academic supports, many students with emotional and behavioral problems successfully
learn coping mechanisms and tactics to both exist and function within a general education
classroom without having to be actively engaged and participating in academic content
and learning in the same capacity as their peers (Sutherland & Oswald, 2005).
Understanding the relationship between academic and behavioral problems is
crucial to our understanding of how to effectively support students within the general
education setting. In a study conducted by Hinshaw (1992), students that demonstrated
inattention and hyperactivity were more at risk for academic problems than other
measured factors including aggression or internalizing problems. This co-occurring
effect of academic and behavioral problems emphasizes the necessity of placing equal
importance upon academic and behavioral goals when addressing the overarching needs
6
of students with and at-risk for EBD (Simpson, Peterson, & Smith, 2011). The focus
should be to address student problem behaviors by teaching replacement behaviors that
encourage appropriate classroom behavior. Equally addressing a student’s academic and
behavioral needs has the potential to impact student academic performance by creating
classroom environments, which can then foster student success across achievement and
behavior.
Challenges of Academic and Social Behaviors
Environments that discourage behavioral disruptions, teach replacement
behaviors, and successfully address a student’s academic and behavioral needs must
cultivate a structure where students are able to take academic risks and feel secure
learning alongside higher achieving peers (Sprick & Borgmeier, 2010). The
“transactional model” is one theoretical model that describes the experiences of a child as
a function or his or her environment and illustrates the need to address both individual
and classroom supports simultaneously (Sutherland & Oswald, 2003). Students and
teachers create an instructional climate within the classroom based on reciprocal
interactions that take place throughout the school day (Conroy, Sutherland, Snyder, &
Marsh, 2008). The transactional model describes the environment shaping the child, and
in turn, the environment being affected by the child. This model describes the impact
that a child and teacher have on one another within a classroom. Sutherland and Oswald
(2005) describe how these interactions exist within the classroom and how they influence
both teacher and student behavior. The authors describe the bi-directionality of
behaviors and the influence that teacher and student have on behavior of the other. This
7
is an area that is suggested for further exploration and of specific consideration for
effective interventions and practices for students with EBD.
Students with EBD create situations where the classroom teacher is negatively
reinforced through the student’s disruptive and inappropriate behavior (Wehby, Lane, &
Falk, 2003). For example, when students are asked to engage with difficult material or
challenging instruction, such as individually asking a student to respond to a complex
question, a student may consistently respond in an inappropriate manner. To avoid
negative student behavior teachers avoid asking students to respond to difficult tasks.
Many students with EBD find taking these academic risks, such as individually
responding aloud in front of their peers to an academic related question, to be aversive,
and they create escape patterns though acting out and causing disruptions (Sutherland,
Wehby, & Yoder, 2002). This pattern of bi-directionality can create an education
environment where students are allowed to disengage from learning. The disengagement
actually becomes reinforcing to the classroom teacher. Interactions such as this, can
drastically impact academic achievement for students with EBD. In addition, this
pattern of negative reinforcement potentially also discourages general education
classroom teachers to implement effective practices to respond to academic and
behavioral challenges and increases student removal due to problem behavior.
Direct observation with specific focus on the functional relationship that exists
between teachers and students has confirmed this transactional theory of interaction. An
early study explored the nature of classrooms and the transactional model by describing
how individual student responses and ability are directly affected by student participation
as elicited by the teacher (Good, 1970). The Good study found that teachers were more
8
likely to actively engage students who had high academic ability and had the ability to
answer questions correctly. Creating supportive environments and encouraging positive
interactions between the student and teacher must exist in an instructional setting where
students are willing to take academic risks and be actively engaged with instruction (e.g.,
Haydon, Mancil, & Van Loan, 2009; Sutherland, Wehby, & Yoder, 2002). To create this
environment a large amount of environmental supports must be in place to meet the
individual needs of students, especially those with distinct academic and social deficits
like students with EBD.
Creating instructional environments that incorporate supports for academic and
social behavior has the potential to allow students with EBD to be successful with
educational tasks by increasing academic engagement and improving content mastery
(Simonson, Fairbanks, Briesch, Myers, & Sugai, 2008; Vannest, Temple-Harvey, &
Mason, 2009; Wehby, Lane & Falk, 2003). A significant predictor of student dropout for
individuals with EBD is the overall level of student engagement within instruction when
compared to typically developing peers (Reschly & Christenson, 2006). Therefore,
implementation of an intervention that can be incorporated into instruction and increase a
student’s educational success through academic engagement and decreased problem
behavior is needed.
One specific target of any intervention implemented with students with EBD
should be increasing students’ academic engaged time (AET). AET refers to the covert,
passive (e.g., listening to the teacher instruct) or overt, active (e.g., responding orally to a
question) time a student spends interacting with instruction (Skinner, Pappas, & Davis,
2005). Existing literature for students with EBD supports a co-occurrence of problem
9
behaviors and academic failures (e.g., Deno, 1998; Greenwood, Terry, Marquis, &
Walker, 1994). Greenwood and colleagues (1994) found that when increasing student
AET, lower rates of incompatible problem behavior (e.g., disruptions, out of seat)
typically occur. Current research being conducted by Hirn and Scott (2012) describes the
status of high school educational environments and the rate of instructional intervention
variables related to increasing AET for secondary students. Hirn and Scott (2012)
conducted 1, 347 individual behavioral observations across six high schools in general
education classrooms that included students with EBD. Rates of AET were overall
dramatically low across all students. Students were individually given an opportunity to
respond at a rate of 0.056 minutes, or about once every 20 minutes within a class period.
Students received reinforcement (i.e., praise) either individually or as a group once every
41 minutes. In contrast, students received negative feedback over twice as often or once
every 17 minutes.
There are many additional unique challenges that exist within secondary settings
in comparison to K-8. Sprick and Borgmeier (2010) note that size, responsibility for
numerous students, assumptions about student knowledge of behavioral expectations,
frequent class changes, and disruptions to classroom management from misbehavior may
be one reason why many evidence-based practices are not examined or even commonly
implemented within secondary settings. Distinctive challenges exist in the
implementation of academic and behavioral supports at the secondary setting that would
increase student AET and decrease behavioral problems; however, there is much
information and research which exists at the K-8 level which can help to establish what
evidence-based practices should be investigated within secondary settings. Any of the K-
10
8 supports would have to be versatile to adjust to the different academic settings and
students that exist across educational environments in addition to supporting achievement
and behavioral deficits (Grossman & Stodolsky, 1995).
Simonsen et al. (2008) have identified 20 evidence-based practices for all
educational environments and grouped them within five categories; 1) maximize structure
and predictability, 2) post, teach, review, monitor, and reinforce expectations 3) actively
engage students in observable ways, 4) use a continuum of strategies to acknowledge
appropriate behavior, and 5) use a continuum of strategies to respond to inappropriate
behavior. One of the five categories is to actively engage students in observable ways.
Within this category, some of the specific strategies listed are the rate of OTRs, response
cards, class-wide peer tutoring, and guided notes.
Opportunities to Respond
The Council for Exceptional Children (CEC, 1987) proposed optimal rates of
OTR for all students with high-incidence disabilities. Suggested rates during instruction
proved that teachers should be prompting at minimum students 4-6 times per minute with
80% accuracy. An article by Stichter et al. (2009) investigated OTR at the elementary
level and reported on prompts, or the initiation of OTR. Observational data demonstrated
that mean prompts given to students in instructional settings was at a rate of 2.61 per
minutes; a rate almost five times higher than what was shown in secondary settings. In
addition the positive to negative feedback ratio was at a rate of 4.5:1. This ratio
demonstrates a stark contrast to the 1:2 ratio that was observed by Hirn and Scott (2012)
at the secondary level. The contrast in these rates demonstrate the current dynamic of
secondary settings for students with EBD highlighting the need for an intervention to
11
address these alarming low rates of practices routinely called for in the literature (praise,
OTR), and high rates of ineffective strategies (negative teacher attention). Since
secondary settings have shown to be unique from K-8 classrooms with respect to the rate
of teacher interactions with students and student AET, there may be an established covert
transactional agreement that exists between students with EBD and the general education
classroom teachers. Instructional strategies must also address AET and create a
transactional classroom model which encourages student success, such as increased use
of reinforcement for desired behaviors and appropriate responses through the opportunity
and rate of successful presentations (Sutherland & Singh, 2004). Simonsen and
colleagues (2008) suggest all educators in all environments use evidence-based practices
that have a high degree of success and effectively address classroom management.
However, the use of these evidence-based practices is less commonly found within
secondary settings.
Suggested interventions within this category to improve AET have been
supported within previous research by specifically increasing the opportunity for students
to engage with instruction. This method of presentations is called opportunities to
respond (OTR). Opportunities to respond can be described by a three-part sequence:
stimuli, response, and response contingency (Skinner, Fletcher, & Hennington, 1996).
Stimuli have also been described within the OTR sequence as a prompt (Simonsen,
Myers, & DeLuca, 2010; Stichter et al., 2009). This initial interaction is specifically
aimed to elicit an action or response from students (i.e., prompt). The student response
then follows. This interaction component is critical to the student choosing to engage in
instruction (Skinner, Pappas, & Davis, 2005). By providing students with the necessary
12
tools and skills to engage in instruction there is an increased likelihood for enhancing
academic engagement and students choosing to respond. Finally, the third step in
providing an OTR is the response contingency (Skinner, Fletcher, & Hennington, 1996).
This interaction has largely been described within OTR research as verbal praise or
feedback regarding the accuracy of the response (e.g., Sutherland & Wehby, 2001).
However, due to the low rates of verbal praise at the secondary level, the manifestation of
the response contingency component within secondary settings needs to be more
thoroughly investigated.
Multiple methods of OTR implementation have been investigated across settings;
however the majority of research has been conducted at the elementary level. The use of
guided notes was investigated with secondary students during an in-class review for
students with mild disabilities within a general education history class (Mastropieri,
Scruggs, Spencer, & Fontana, 2003). Within this study, the use of guided notes was
found to improve students test score within the classroom. A pre- post- test design
demonstrated a relationship between the use of guided notes within the classroom and
students academic performance on weekly quizzes. Students were given a packet of
guided notes that accompanied teacher lecture and discussion and were prompted when to
provide answers within their packet which became a permanent record of the teacher’s
instruction.
Another method of implementation of OTR is class-wide peer tutoring (CWPT).
CWPT has been investigated at the middle school level across three seventh grade and
eighth grade classes comparing CWPT to typical instruction (Spencer, Scruggs, &
Mastropieri, 2003). Classes were randomly assigned into typical instruction or CWPT
13
and then switched after a period of two weeks creating a crossover design. Specific
analyses were conducted on students that had emotional or behavioral difficulties within
the larger study to determine the effect of this intervention on their specific behavior.
After the implementation of CWPT the high risk students scored higher on content area
tests, were more on task during class, and reported to enjoy the intervention method more
than traditional methods of instruction. CWPT has also demonstrated positive outcomes
for encouraging students to engage within instruction (Bowman-Perrott, 2009).
An additional method of OTR is the use of response cards. In a study by
Amendariz and Umbreit (1999) two methods of active responding were investigated with
students in a fourth grade general education classroom during math instruction. The
comparative conditions were conventional lecture with hand raising and a response card
condition. During the response card condition students had to respond to the teacher’s
questions by writing answers onto individual cards and then showing the answers to the
teacher. Results demonstrated that behavioral disruptions were less during the response
card condition for most students within the classroom. When students were asked which
method they preferred, 19 of the 21 students also selected the response card method. A
similar study was conducted by Lambert and colleagues (2006) within a fourth grade
classroom during mathematics instruction but additionally focused on academic
responses during a response card OTR implementation method. Students selected for
participation within the study were students who had demonstrated a pattern of
disciplinary issues and disruptive behavior within the classroom. Results indicated that
students demonstrated higher rates of OTR, decreased behavioral disruptions, and a
higher rate of correct academic responding during the response card condition.
14
Three of the suggested interventions by Simonsen et al. are increasing OTR
through the use of response cards, class-wide peer tutoring, and guided notes. All of
these interventions have been shown to improve student engagement and reduce
behavioral problems at the elementary and middle school level (Haydon, Mancil, & Van
Loan, 2009; Partin, Robertson, Maggin, Oliver, & Wehby, 2010; Simonsen, Myers, &
DeLuca, 2010; Sutherland, Wehby, & Yoder, 2002). Overall, OTR has been researched
and reviewed as an effective practice recommended for use in all educational settings
(Sutherland & Wehby, 2001). OTR research has been conducted across multiple settings
including physical education, various content subject areas, self-contained classrooms,
and high- and low- risk elementary schools (e.g. Burns 2007; Burns & Boice, 2009;
Cautilli & Dziewolska, 2006; Haydon et al., 2010; Stichter et al., 2009; Sutherland,
Wehby, & Yoder, 2002; Sutherland & Oswald, 2005; Szadokierski & Burns, 2008).
Previous research has described OTR as a strategy to increase the likelihood of a
student’s response through an interaction between a teacher’s prompt (Haydon, Mancil,
& Van Loan, 2009). However, there is little research that has been conducted
specifically within secondary settings on the use of various OTR strategies.
As discussed above, the specific definition of OTR was first described as a
learning trial consisting of three specific terms: stimulus, response, consequent
contingency sequence (Skinner, Fletcher, & Hennington, 1996). This was initially
demonstrated in classrooms through choral responses whereby a teacher prompts the
entire class with a question signaling students to give a specific response (i.e., hand
raising) that is then reinforced by teacher attention. Haydon, et al. (2010) has
demonstrated that improving the quality and increasing the quantity of learning trials
15
result in greater academic achievement by students. The use of OTR as an academic
strategy has provided students with higher rates of AET, more correct classroom
responses, and decrease disruptions (Sutherland, Adler, & Gunter, 2003).
Rate of OTR refers to the presentation speed in which students are given an
academic prompt to respond (Sutherland, Adler, & Gunter, 2003). A review of increased
OTR to academic requests and the academic and behavioral outcomes for students with
EBD found only one study conducted with five secondary students (Sutherland and
Wehby, 2001). The total synthesis of literature identified by Sutherland and Wehby
(2001) only contained six studies using a traditional method of OTR such as choral
responding with a combined total of 19 students with EBD. However, despite the small
sample size there were significant results to support that by increasing the rate of OTR
there were increases in academic outcomes, task engagement, and decreased problem
behavior. In addition, it was found that the increased rates of OTR provided teachers
with more opportunities to provide praise to students creating more positive interactions
between students and teachers however results were not statistically significant. The
praise given in the reviewed articles was primarily non-behavior specific and directly
related to academic correctness (Sutherland & Wehby, 2001).
An additional study examining the rates of traditional methods of OTR (i.e. choral
responding) for 9 elementary students with EBD found that OTR increases were
associated with correct responses, task engagement, and decreased disruptive behavior
(Sutherland, Adler, & Gunter, 2003). Similar to the results found by Sutherland and
Wehby (2001), teacher praise rates had a slight increase during higher rates of OTR
(Sutherland, Adler, & Gunter, 2003). These articles highlight the need for further
16
research related to the rate of OTR for students with EBD and the reciprocal effect on
increasing the consequent-contingency component of the OTR transaction. In previous
research related to OTR this portion of the transaction is often manifested as praise.
However, Hirn and Scott (2012) have demonstrated that the variable of praise is minimal
within secondary settings. This consequent-contingency component of the OTR may be
defined and implemented differently than other settings and expand beyond the format of
praise. This is an area needing further exploration within applied settings.
An analysis of the specific significance between OTR and teacher praise was
conducted for students with EBD using time sequential analysis (Sutherland, Wehby, &
Yoder, 2002). In this study, a significant correlation was found between praise and OTR
suggesting that teachers with high rates of OTR had higher rates of praise, and teachers
with lower OTR had lower rates of praise. Despite these reviews, the lack of literature
suggests that more research is needed in regards to the interactions between students and
teachers during academic instruction related to the rate of OTR and teacher praise,
especially at the secondary level where unique obstacles exist for the implementation of
interventions.
Similarly, Haydon, Mancil, and Van Loan (2009) found that as a teachers
increased their rate of OTR to students there was a direct relationship to student on-task
behavior, correct responses, and decreases in student’s disruptive behavior. The Haydon
and colleagues study replicated findings by Sutherland, Adler, & Gunter (2003) and
continues to demonstrate that within a general education setting a teacher can increase
OTR and these increases are associated with increases in student’s appropriate behavior
and their engagement with academic instruction. Increasing the rate and opportunity for
17
student response and engagement in instruction has shown impact on student behavior
but the quality of OTR and implementation method for giving students opportunity to
engage has also been explored including response cards, guided notes, and class-wide
peer tutoring. Response cards are preprinted or write-on tools that teachers can use in a
whole-class format to allow students to demonstrate their knowledge and provide
immediate feedback. Guided notes are defined as teacher handouts that are prepared to
assist students during lectures using cues and blank space provided to insert key
information and facts. Class-wide Peer Tutoring engages all students in the class in
instruction through tutor-tutee pairs forming teams. Tutees earn points for their team by
responding to the tasks the tutors present. These variations of OTR have been minimally
researched at the secondary level, rarely implemented for students with EBD, and rarely
compared for different effects that may exist across OTR strategies.
Although these methods have only been limitedly implemented at the secondary
level each provides a format for creating positive interactions between student and
teacher with the incorporation of a format to engage with instructional content. In
addition, all of the selected methods of OTR are cost effective and can be implemented
within classroom settings without the need for additional tools or materials. This factors
leads these interventions to be more versatile, and acceptable with the wide range of
students being instructed within secondary settings. Also, within guided notes, response
cards, and class-wide peer tutoring there are components of each of these interventions
that embed the important characteristics and factors for successful interventions within
the unique context of secondary settings described by Sprick and Borgmeier (2010) and
Lane, Wehby, and Barton-Arwood (2005). Many of the OTR interventions are
18
implemented in a whole class format (i.e., Lambert, Cartledge, Heward, & Lo, 2006).
Interventions in this whole-group format may reduce any possible stigma that could exist
for accessing additional support and encourage a fast presentation of material where
students can receive feedback individually, but also while all students have equal
opportunity to respond (Skinner, Pappas, & Davis, 2005). Specific components of each
intervention and the advantage for use with students with EBD at the secondary settings
are described below.
Response cards. Response cards are personal white boards or pre-printed cards
which student’s use to answer teacher questions (Haydon, Borders, Embury, & Clarke,
2009). Out of all of the suggested OTR implementation strategies the use of response
cards has been documented across the most academic subject areas (social studies,
science, history, and mathematics) and with the most high school students (N=96;
Randolph, 2005). Randolph analyzed 18 response card studies within a meta-analysis to
determine specific effects of this OTR implementation method. It was found that
response cards have a statistically significant impact on multiple outcome measures for
students. These outcomes include teacher and quiz achievement, participation with
academic instruction, and decreases in disruptive behavior. Out of the 18 studies
reviewed only four studies directly investigated response cards within a high school
setting.
Response cards can be used as an example of OTR by incorporating stimulus,
response, and consequent contingency. The stimuli presented to students within the
response card intervention method would be a teacher’s request for students to write
answers to academic information on a white board, or to show the answer to the teacher
19
request using a pre-printed card. The teacher verbal prompt, or question, would serve as
the stimuli. The response would be the student behavior demonstrating an answer to the
teacher prompt through the use of the pre-printed card or the white board. The
consequent contingency would be the teacher’s response to the student engaging within
academic instruction. This could be done through the use of praise for presenting the
correct information or any other method that would be reinforcing to a student for
engaging in academic content.
Class-wide Peer Tutoring. Class-wide peer tutoring (CWPT) engages all
students in the process through tutoring dyads. During each session, students can
participate as both a tutor and tutee, or solely as a tutor or tutee (Ryan, Reid, & Epstein,
2004). In a review of 14 peer mediated intervention studies across individuals with EBD,
peer mediated strategies produced overall levels of positive academic growth (Ryan et al,
2004). Bell, Young, Blair, & Nelson (1990) examined 6 students with EBD within a
public school setting across 18, twenty-minute CWPT settings. Results demonstrated
increased engagement with instruction. Students also reported a preference for CWPT as
an instructional method.
Bell, Young, Blair, and Nelson (1990) studied the use of CWPT in a high school
comparing seven students with behavioral disorders to 52 non-disabled peers. Non-
disabled peers were separated within three categories of highest, middle, and lowest
performing students. During baseline students with disabilities were performing over
three letter grades below the non-disabled peers. However, post baseline, results shows
that CWPT narrowed differences to become non-significant. This article highlights the
20
potential impact that CWPT can have on students with emotional and behavioral
disorders within high school settings.
Bowman-Perrott (2009) compared eleven high school students with EBD between
two classrooms during the CWPT intervention during a core science subject area.
Results indicated higher rates of praise between peers, cooperative work, frequent use of
OTR, benefits for low- and high- ability students, support from administrations, and
generalization of praise during other periods of the day outside of CWPT intervention.
With the limited amount of research related to students with EBD and within
secondary settings, the impact of CWPT on students with EBD cannot be established but
the research that does exist demonstrates promising impact for this interventions use.
Overall, peer mediated interventions have been found to be an effective tool for
addressing academic engagement and decreasing problem behavior (Simonsen,
Fairbanks, Briesch, Myers, & Sugai, 2008). Since CWPT can be adapted for any
curriculum and for differing ability levels in the tutoring dyads it can address specific
factors that are unique to secondary settings.
Class-wide peer tutoring can be used as an OTR by having the tutor within the
dyad provide the stimuli or prompt for the tutee. The tutor serves as the initiator of the
OTR sequence requesting the tutee to engage in academic instruction. The tutee then
responds to the tutor providing them with a verbal answer related to the stimuli of an
academic question. In response to the tutee’s answer the tutor then provide a consequent
contingency encouraging the tutee to continue engaging with the academic instruction
and the CWPT format (Bell et al., 1990).
21
Guided notes. Guided notes are teacher’s handouts to the classroom or an
individual student that are designed to assist a student through a lecture by using standard
cues (or the stimulus), providing space for writing facts, concepts or relationships
(response), and the teacher providing feedback either verbally or on the permanent
product (consequent contingency sequence). This format of OTR is unique in that the
product produced during OTR is more covert than the other implementation methods
described. A potential advantage is that for students with anxiety or any other
maintaining factors, this OTR implementation method eliminates behaviors that could be
stigmatizing during overt participation (Skinner, Pappas, & Davis, 2005).
Blackwell and McLaughlin (2005) describe guided notes as an effective tool for
increasing students with disabilities overall academic performances. Simonson and
colleagues (2008) also consider it to be an evidence-based practice for addressing
classroom management needs based on the amount and quality of research relating to the
subject matter. Teachers give students direct prompts for each academic response in the
notes. This provides an individualized system and structure for responding to curriculum
with direct prompting. There is however a limited amount of research related to the
implementation of guided notes for students with disabilities, and no research on the
effect of EBD students.
Guided notes can be used as an OTR intervention method by teachers giving
student a guide to engage in lecture. This guide is paired with teacher verbal prompts to
serve as the stimuli and initiation for the OTR interaction. When this prompt is initiated
a student response is to fill in that area of the pre-printed guide to directly engage in
instruction. The consequent contingency for guided notes can be demonstrated in a
22
similar manner to other methods of OTR implementation where the teacher directly gives
students a form of reinforcement. However, in this method an additional potential
reinforcer is that students now have an accurate and informative guide to assist in
reviewing instruction outside of class (Blackwell & McLaughlin, 2005).
The limited research related to guided notes has left a significant gap in the
knowledge of the instructional benefit for this OTR strategy with secondary students with
EBD, however the initial studies that have addressed students with mild disabilities has
been promising. The investigations conducted to date have unfortunately not targeted
students with behavioral issues and there is limited information on the impact of problem
behavior. Having a systematic structure for delivering and implementing OTR can also
affect the rate. This is a broad area that has been researched, but only minimally with this
high-risk population of students.
Summary and Purpose Statement
Dismal outcomes have been documented for secondary students with EBD and
these must be addressed. One proposed way to address these outcomes is by creating
successful educational environments where students are engaged and foster positive
teacher-student interactions. OTR has been demonstrated to address both of these factors
(e.g., Blackwell & McLaughlin, 2005; Randolph, 2005; Ryan, Reid, & Epstein, 2004;
Sutherland & Wehby, 2001). However, there is a dearth of research on the effectiveness
of OTR at the secondary level for meeting the academic and social behavior needs of
students within the unique structure of secondary environments. A paucity of literature
exists addressing the comparison of OTR intervention strategies and the specific
complexities and differences, which may exist solely within secondary environments.
23
Overall, the issues that Sprick and Borgmeier (2010) describe within secondary
settings must be considered as unique features to the implementation of intervention at
the secondary level. Although OTR has been demonstrated as having an overall positive
impact on students with EBD and those with challenging behavior, variations of OTR
strategies have been minimally investigated. In addition, the comparison of multiple
methods at the secondary level has not been explored. Important influences on AET,
problem behavior, and the consequent contingency (e.g., teacher praise) need to be
explored. The possibility of OTR as an intervention to effectively address the academic
and problem behaviors that many students with EBD face is an important aspect of future
research.
While the various components of OTR as well as the variations in OTR strategies
have demonstrated improved academic engaged time along with correlated decreases in
problem behavior among elementary aged students, there is a clear dearth of work
conducted at the secondary level. To address these gaps within the current literature, this
study directly investigated the secondary level for students with EBD using a variety of
OTR intervention strategies. Previous literature has documented increased academic
engagement for students with EBD through faster presentation rates of OTR (Sutherland,
Adler, & Gunter, 2003; Sutherland & Wehby, 2001), the use of class-wide peer tutoring
(Bowman-Perrott, 2009; Ryan, Reid, & Epstein, 2004), and the use of response cards
(Randolph, 2007). The use of guided notes has never been researched specifically with
students with EBD but has been demonstrated as a promising practice for students with
mild disabilities (Mastropieri, Scruggs, Spencer, Fontana, 2003). The implementation
format for OTR and the components of the stimuli, response, and consequent-
24
contingency also need to be specifically described and analyzed within secondary
settings.
The purpose of this study was to examine the comparative impact of three
advocated OTR strategies on the academic engaged time of high school students with
EBD. Specifically, the following research questions were addressed through the use of a
alternating treatment design across teacher-student dyads in math class:
Primary Research Question One: Within a core instructional subject area of mathematics,
what are the effects of differing types of OTR (guided notes, class-wide peer tutoring,
and response cards) on student disruptive behavior and academic engagement?
Sub Aim 1: When OTR is implemented for students with EBD at the secondary
level using different implementation methods (guided notes, class-wide
peer tutoring, and response cards,) what is the rate of OTR provided to
students within each method?
Sub Aim 2: When OTR is implemented for students with EBD at the secondary
level, what is the effect of differing rates of OTR on student disruptive
behavior and academic engagement?
Secondary Research Question: When OTR intervention methods are implemented for
students with EBD at the secondary level, what is the effect on academic performance
(i.e., classwork, homework, quiz and test scores)?
Sub Aim 1: When OTR intervention methods are implemented for students with
EBD at the secondary level, what type of consequent contingency is
provided to students for participation in OTR (i.e., increase in general
25
praise statements, increases in behavior specific praise, pace of instruction,
other reinforcement, negative reinforcement)?
Sub Aim 2: When OTR intervention methods are implemented for students with
EBD at the secondary level, does student academic achievement level
effect classroom performance and student engagement rates?
26
CHAPTER II
METHOD
Overview
A single subject alternating treatment design across teacher-student dyads was
used to investigate the comparative impact on student academic engaged time (AET) of
three opportunities to respond (OTR) interventions; a) guided notes, b) class-wide peer
tutoring, and c) response cards. In addition, teacher implementation rate of the three
OTR conditions and student behavioral disruptions and week-by-week classroom
academic performance were also measured. Student academic achievement levels, the
various consequent-contingency components of OTR, feasibility and acceptability were
also examined.
General Procedures
All students selected were recruited through the procedures established by the Center
for Adolescent Research in Schools (CARS) project. A school liaison met with schools
and provided them with an outline of specific student inclusion and exclusion criteria.
Criterion included:
1. Students must exhibit at least one problem with basic school functioning such as
(a) absences greater than 10% from previous school year, (b) four or more office
referrals for behavior infractions in the current or previous semester, two or more
suspensions (in school or out of school) in current academic year, and (c) one or
more “F’s” or two or more “D’s” in one of two most recent grading periods.
2. Students also had to have an Intelligence Quotient at or above 70 as measured by
the Wechsler Intelligence Scale for Children-III (WISC-III; Wechsler, 1991),
27
Wechsler Abbreviated Scale of Intelligence (WASI; Wechsler, 1999), Wechsler
Intelligence Scale for Children-IV (WISC-IV; Wechsler, 2004), Wechsler Adult
Intelligence Scale-IV (WAIS; Wechsler & Bellevue, 2008), or the Stanford Binet
Intelligence Scale (SB, Stanford & Binet, 2003).
3. Students were in 10th
-12th
grade within the 2012-2013 school year.
4. Student’s primary language was English.
5. Students who had a diagnosis of mental retardation/mentally handicapped,
pervasive developmental disorder, or autism spectrum disorder were excluded
from the study.
6. Students included were considered EBD if (a) identified as having EBD by the
school system, or (b) identified as having EBD by teacher perception scores on a
standardized behavior rating scale and indicated a clinically significant level of
impairment.
7. Students included received services based on an Individualized Education Plan or
504 Plan if the student met all of the above criteria.
School personnel were asked to generate a list of students who met the general inclusion
and exclusion criteria. From the generated list school personnel contacted possible
eligible students’ families to secure consent/assent. If both parents and students agreed to
participate, an initial assessment to determine specific emotional and behavioral
functioning was completed by CARS staff. Additional inclusion criteria to participate in
the CARS project included a clinically at-risk or significant subtest scores on the parent,
teacher, or child version of the Behavior Assessment System for Children-2 (BASC-2;
Reynolds, & Kamphaus, 2004). If students were found eligible, a battery of assessments
28
was completed including parent, teacher, and student measures of social/emotional
concerns as well as academic achievement. Specific to academic achievement, a
Woodcock-Johnson (III) was administered for each subject. The outcome of the
achievement assessment did not factor into eligibility criteria, but provided a baseline
level of the students’ achievement level.
Participants were selected from a public high school located in the Midwest. The
targeted high school was selected among schools currently participating in a national
randomized control trial examining the effectiveness of a range of interventions with
secondary aged students with significant behavioral challenges. Parental and teacher
consent along with student assent had been obtained through the larger research study.
Participating classrooms were selected based on the following criteria: a) an
eligible student was enrolled in a core subject area classroom (either English or Math), b)
the target student had documented behavioral concerns within the classroom, c) parent
consent and student assent was secured as part of the larger project, and d) one possible
indicated strategy based on a classroom assessment was increasing the OTR during
instruction.
Teachers were contacted to participate in the present study when students met
eligibility within any core content academic subject. After written consent was secured,
teacher demographic data were collected including race, gender, age, years of experience,
highest degree earned, areas of certification, and subject areas taught. The investigator
met with interested teachers and discussed the specifics of the study and what would be
required of them.
29
An initial requirement to determine what interventions were indicated was teacher
participation in a standardized classroom assessment. The classroom assessment focused
on the implementation of use of rules, routines, providing accommodations, and
opportunities to respond. A direct observation piece is also included to determine rates of
teacher-student praise, and student engagement. As part of the classroom assessment,
teachers were observed during teacher-led instruction for a minimum of 3 days and
frequency and duration data were collected on teacher and student behaviors. Based on
all gathered information and conversations with the teacher interventions were
recommended. Feasibility and acceptability of all indicated interventions was then
discussed. Teachers were to rank order interventions based on their perceptions of
priority, feasibility, and acceptability.
Subjects
A total of five teacher-student dyads were initially selected for inclusion within
the study. Eligible student schedules were collected and core subject area classroom
teachers were interviewed to determine interest in participating in the study. Classrooms
invited to participate in the study met inclusion factors outlined above (i.e., students
receiving a failing grade or showing signs of failing and/or documented behavioral
problems).
Teachers. Five teacher-student dyads were identified for participation. All
teachers (4) were invited to participate based on their low rates of verbal, physical, or
written OTR (less than 4 times per minute) and no observance of a specific OTR
implementation strategy as recoded from the classroom assessment. All teachers
provided limited opportunities for student active engagement during teacher-led

30
instruction. During this period of observation as part of the classroom assessment if a
consequent-contingency was observed as part of an OTR sequences that did exist, the
consequent-contingency was recorded. It was noted that all teachers demonstrated two
types of consequent-contingencies during initial observation: instructional pace and
praise.
Out of the five student-teacher dyads indicated, only two of the teacher-dyads a)
ranked Opportunities to Respond as a number one priority, b) indicated they thought the
intervention would be feasible and acceptable, and c) indicated a willingness to
implement multiple methods of OTR during a single class period for the duration of the
study. The teachers also agreed to allow direct observation for the duration of the study
to determine impact of change on teacher and student behaviors. Two classrooms, with
three teacher-student dyads qualified for inclusion within the study. All included teacher
dyads were mathematics core content area teachers.
The two student-teacher dyads who were not selected for inclusion were English
core content area teachers. These teachers co-taught their English classrooms with
History teachers and had a class size that was double that of other instructional settings
within the school. Both of the teachers ranked OTR as not feasible at the time and listed
curriculum constraints as the primary reason. Additionally, one teacher did not feel that
this intervention was acceptable either given the amount of curriculum that had to be
embedded within the classroom period.
Teacher One was a twenty-two year old Caucasian female with a Bachelor’s
Degree within the area of mathematics. This was her first year teaching and she reported
having only worked with two students with emotional and behavioral disorders over the

31
course of her career. Teacher One currently taught grades ten, eleven, and twelve as a
general education mathematics teacher and had certification only within secondary
mathematics grades nine through twelve.
Teacher Two was a twenty-eight year old Caucasian male with a Master’s
Degree. This was his first year teaching and he reported having never worked with any
students with emotional and behavioral disorders in the past. Teacher Two currently
taught grades ten, eleven, and twelve as a general education mathematics teacher and had
certification only within secondary mathematics grades nine through twelve.
Students. Student One was a 16 year old African American/ Caucasian male in
the eleventh grade enrolled in Teacher One’s general education Algebra course. Student
One was on a 504 plan for a medical diagnosis of Attention Deficit Hyperactive Disorder,
Mood Disorder, and Oppositional Defiant Disorder. An intelligence quotient (IQ) of 123
was recorded within a previous evaluation placing him in the high average range. Data
from the Behavior Assessment System for Children, Second Edition (BASC-2) self-
report showed significant impact within the inattention/hyperactivity category with
clinically significant classifications in the hyperactivity category and at-risk classification
for attention problems. Teacher rating scales of the BASC-2 demonstrated clinically
significant classification within externalizing problems, internalizing problems, school
problems, behavioral symptoms index, and adaptive skills. Parent rating scales of the
BASC-2 data found clinically significant classifications within externalizing problems
and adaptive skills. At-risk classification was reported by Student One’s parents within
internalizing problems and behavioral symptoms index. On the Woodcock Johnson-3,
Student One’s standardized scores were all within the average range for reading and math
32
subtests (letter-word identification, reading fluency, calculation, math fluency, passage
comprehension, and applied problems) ranging from 98 to 114 and had a standardized
score of 105 in broad reading and a 109 within broad math.
For Student One, academic achievement and behavioral data from the previous
year were recorded to show this student as receiving a failing grade within his Algebra
class from the previous year. This course was his only failing grade from the previous
school year. Student One had also received a total of 16 office referrals during the
previous school year and had a total of 6 days of in-school suspensions.
Student Two was a 16 year old Caucasian male in the eleventh grade within
Teacher One’s Algebra course. Student Two had a special education diagnosis of Other
Health Impairment due to a medical diagnosis of Attention Deficit Hyperactive Disorder.
An IQ score of 112 was recorded within his special education evaluation placing his
general intelligence within the high average range. Data from the BASC-2 self report
demonstrated no areas of impairment. However, teacher reports from the BASC-2
demonstrated clinically significant classifications with the area of externalizing problems
and at-risk levels within school problems, behavioral symptoms index, and adaptive
skills. Parent reports from the BASC-2 reported at-risk levels within externalizing
problems, behavioral symptoms index and adaptive skills. On the Woodcock Johnson-3
Student Two scored in the average range on four subtests: letter-word identification,
calculation, math fluency, and applied problems ranging from 86 to 111. Below average
scores were found within the subtest of reading fluency and passage comprehension
ranging from 78 to 79. In the areas of broad reading and math, average scores were
obtained. Academic achievement and behavioral data for Student Two from the previous
33
year showed five office referrals and a total of four failing grades across all core
academic subject areas.
Student Three was a 15 year old Caucasian male in the tenth grade within Teacher
Two’s Algebra course. Student Three had a special education diagnosis of Other Health
Impairment due to a medical diagnosis of Attention Deficit Hyperactive Disorder. An IQ
was complemented as part of a special education evaluation for a standard score of 93
placing Student Three within the average range. Self-report data from the BASC-2
demonstrated at-risk classifications within internalizing problems, inattention/
hyperactivity, and personal adjustment. Teacher reports showed at-risk classification of
externalizing problems, school problems, behavioral symptoms index, and adaptive
skills. Parent reports on the BASC-2 for Student Three show clinically significant
classifications within the areas of externalizing problems, internalizing problems,
behavioral symptoms index, and adaptive skills. Achievement scores for Student Three
were all within the average to below average range. An average standardized score was
received on the passage comprehension, letter-word identification, and applied problems
subtests ranging from 88 to 95. A low average score of 77 was received on the reading
fluency subtest. Below average scores were received on two math subtests of calculation
and math fluency ranging from 52 to 63. A broad reading score of 85 was recorded a
broad math score of 64 was recording placing Student Three in the below average and
low average range for achievement.
Academic achievement and behavioral data for Student Three showed a total of
three office referrals from the previous year. Student Three also had the highest number
of failing grades from the previous year, having failed nine classes. These classes
34
included all core subject area classes and electives. Student Three had only passed one
elective course, taking the course pass/fail, during the previous school year and had
received no credit towards graduation during the entire school year.
Interventions
Each targeted classroom implemented three OTR strategies, a) guided notes, b)
response cards, and c) class-wide peer tutoring in a randomized order within a single 90
minute class period. These instructional strategies were selected based on their
requirements for no additional tools or materials outside of what existed naturally within
the classroom environment. Classroom teachers were trained to implement each of the
three using the Center for Adolescent Research in Schools Manual (2012; See Appendix
A). This manual provides a brief overview of each of the instructional strategy and
contains an instructional planning guide for incorporating strategies within the classroom
context. The investigator met with each of the teachers to train on key components,
demonstrate what the OTR strategy looked like, and planned on how each of the three
could be embedded in the current class curriculum. In addition, the investigator reviewed
with the classroom teacher how to introduce each strategy and teach the appropriate
student action for each. First, the investigator outlined for the teachers the importance of
providing opportunities to respond in general during classroom instruction and gave
specific examples on when and how to use. Next each OTR intervention was outlined
and taught to teachers.
Guided notes were explained to teachers as a method for organizing curriculum
for students and providing a method to accurate capture information from instruction and
lectures. Possible positive outcomes of this intervention were also shared with teachers
35
and included increased retention of content by students, higher rates of active responding,
and a student product for test preparation. Teachers were shown an example of a guided
notes lesson and practiced talking through a piece of lecture cueing the investigator on
when a guided notes interaction should be initiated. The teachers were also instructed to
provide behavior reinforcement at the end of each guided notes OTR interaction. The
teacher than practiced incorporating reinforcement as a consequence-contingency during
the OTR interaction, after presenting the investigator with the guided notes cue.
Once teachers felt they understood guided notes and demonstrated mastery
through practice, response card training took place. The investigator demonstrated two
types of response cards, “pre-printed” and “write on.” While demonstrating how
response cards could be used within a classroom the benefits of this intervention were
outlined to the teacher by explaining that this form of OTR can be used as a formative
assessment to help guide instruction and check for student understanding. After
demonstrating response cards with the classroom teacher the roles were reversed and the
classroom teacher practiced using the response cards with the investigator.
Following mastery of response cards, training in class-wide peer tutoring was
introduced to the classroom teachers. Specific benefits of class-wide peer tutoring were
described for the teachers including outcomes such as tutors gaining a broader
understanding of concepts by teaching them and a sense of responsibility, enhanced self-
esteem and self-confidence that can promote pro-social behaviors. A video from
YouTube was shown to teachers where a contrived class-wide peer tutoring setup was
shown with all of the core procedures: Review and introduction of material, partner
pairing strategies, reciprocal roles, teams competing for highest point total, contingent
36
individual tutee points for correct responses, tutors providing immediate error correction,
public posting of team scores, and social rewards for winning. Role-play practice
between the teacher and investigator took place on what the pairing should look like with
the investigator cueing core procedures from a provided checklist.
After explanation and practice of all components of each of the three
interventions, a conversation between the investigator and teacher occurred about the
materials that were needed for each and a plan to create the needed materials was
developed. In addition, a specific plan for teaching each of the strategies to the students
was developed and any potential barriers to fidelity of implementation were discussed.
This information was recorded for the teacher to use within the Opportunities to Respond
Worksheet (See Appendix A) that was used to help guide implementation. The researcher
provided ongoing technical assistance to the classroom teacher during the intervention
phase of the study. Prior to implementation, a decision rule to provide training booster
sessions was set if integrity fell below 80% for any of the OTR intervention strategies.
The booster sessions were designed to review the specific components required of the
OTR intervention. Instructional pace and planning were also reviewed if the three
implementation OTR strategies were not conducted within a single class session. Booster
sessions also included role-plays of scenarios using the specific OTR intervention and
brainstorming of solutions to individual problems by the researcher and teacher should
unique situations arise. OTR integrity was measured separately for each individual OTR
intervention strategy.
37
Experimental Procedures
An alternating treatment design (Gast, 2010) was used to compare the three OTR
procedures; guided notes, class-wide peer tutoring, and response cards. The effect of
these interventions on student and teacher behavior in high school settings was measured
through direct observation and archival data. This design allowed for investigation and
comparison of varying types of OTR interventions against one another using the primary
dependent variable of AET. This design also allows one to see the distinct functional
relationship that potentially exists between teacher instructional presentation and student
engagement rates.
Information on classroom performance was collected on a week-by-week basis to
provide an overall measure of student academic performance. Consequent-contingency
components were also recorded to determine the nature, type, and rate of reinforcement
within secondary settings. Finally, feasibility and acceptability data were recorded across
both students and teacher to determine the suitability of each OTR intervention within
these general education classrooms. Data from these variables were analyzed through
descriptive statistics and correlations specifically related to the sub aims of each research
question.
Baseline data were collected until a clear trend or level was established. While
traditionally not required in an alternating treatment design (Kazdin, 1982), baseline
provided additional information on current use and rate of teacher led OTR and student
level of AET. Baseline data were collected on student engagement and student
disruptions during teacher led activities. Baseline data on student AET were collected
until a consistent pattern emerged. Patterns were determined based on level, trend, and
38
variability. Specifically, trend was determined using a split middle design, level using a
percentage of non-overlapping data points, and variability using a 15% range from the
mean (Tawney & Gast, 1984). OTR implementation data were only collected during
teacher led instructional activities. Teacher-led instruction includes any content that
involves a didactical relationship of gaining information between teacher and student.
This format includes class time related to academic content, the introduction of material,
or reviewing previously learned material. Excluded instructional activities were
independent classroom work or any instruction that was not related to academic
instruction.
Following the establishment of a stable baseline, each OTR strategy was
introduced daily within the class period through a randomly established order. After
baseline, OTR strategy variations were introduced within the intervention phase.
Interventions were done using a randomized rotation across the three OTR strategies
(e.g., ABC, BCA, CAB, ACB, BAC, CBA). This method of presentation potentially
controls for the possibility of carryover and sequencing effects across class periods (Gast,
2010). All three of the OTR intervention strategies were measured during each session.
Each session consisted of a ninety-minute instructional class period. Each OTR
instructional strategy was observed and recorded during the first ten minutes of
implementation. Recording of teacher and student behaviors began after the first prompt
to use the instructional strategy has been given by the classroom teacher (e.g., “please get
your white boards out and ready” or “please take out your note outline and get ready to
record responses as I review the material”). This distinct discriminative stimulus
39
preceding each treatment was given to make it clear to students which OTR condition
was in effect.
Once a differentiated pattern of responding across the three OTR strategies was
established, the most effective OTR was implemented in isolation during the final phase
of the design to confirm the initial findings. A final phase of the design was implemented
where the most effective or best treatment, of the intervention was continued. This
decision was based on the level, trend, and variability of the primary independent
variable, AET across the three strategies. Phase change decisions were made using
visual analysis of level, trend, and variability of AET. The primary decision rule in
selecting the best treatment was based on the overall level of data compared to baseline
and other treatment conditions. Trendline and variance were also considered. Finally, if
a clear determination of best treatment was not readily apparent, mean rate of student
disruptions were also considered. This allowed for a replication of the most effective
strategy and a solo demonstration of the impact of the best OTR intervention on student
AET..
Observations were conducted across all phases of the design using a frequency
and duration observational system that recorded both student and teacher behaviors. The
use of an alternating treatment design allowed for the researcher to demonstrate the
comparison of three OTR intervention strategies, a phase of the best treatment, and the
functional relation of these strategies.
Dependent Variables. The primary measure across the study was direct
observation of student academic engaged time using duration recording. Other measured
variables included pre-assessment measures of emotional and behavioral concerns and
40
overall level of academic achievement, student demographics, teacher demographics,
student classroom performance, and OTR strategy integrity checks and social validity
assessments completed by both teachers and students. Academic engaged time was
collected using the Multi-Option Observation System for Experimental Studies
(MOOSES; Tapp, Wehby, & Ellis, 1995) software. All observations were ten minutes in
length during teacher-directed activities across baseline, intervention and replication
phases.
In addition to duration of AET, the frequency of student disruptive behaviors was
also measured. AET duration recording used mutually exclusive definitions of academic
engaged time, active engagement and off-task. A student was considered academically
engaged if they were actively or passively engaged with the academic instruction and not
exhibiting any of a range of “off-task” behaviors (see Appendix B for operational
definition). Student and teacher behavior was collected simultaneously.
Duration of AET served as the primary dependent variable to ascertain possible
functional relationships between teacher use of OTR strategies and student behavior
(adapted from the Center for Adolescent Research in Schools: M.O.O.S.E.S. Data
Collector Coding Manual and Training Procedures, 2012). In addition, this observational
system allowed the investigator to determine individualized rates of OTR use for each of
the selected teacher-student dyads. It also provided information on additional contextual
variables that may have affected the OTR intervention strategies. A simple frequency
recording documented any type of consequent-contingency that was given to students
during and OTR interaction.
41
Four data collectors were trained across a minimum of four training sessions.
First, data collectors were trained on collecting frequency and duration data using paper
and pencil methods of collection using videos of classroom problem behaviors. At this
time, individuals learned specific observational codes in addition to both examples and
non-examples of the recorded teacher and student behaviors (See Appendix B). Once
data collectors achieved at least 80% reliability with the trainer on the video observations
of problem behaviors they were given personal handheld electronic devices (PDA) with
the MOOSES program to record observational data. Data collectors were then required to
achieve an inter-observer agreement (IOA) of at least 80% during in-vivo coding of non-
research classrooms with using the PDAs.
Once observers reached 80% or better during in-vivo practice, data collection in
the target classroom began. IOA rates were collected in at least 30% of the total number
of observations within target classrooms. If at any time data collectors inter-observer
agreement (IOA) fell below 80%, they were retrained using the above procedures until
appropriate percentage was met.
Key teacher behaviors related to OTR were measured to insure correct
implementation and to potentially account for variation across dyads. The frequencies of
the following variables were coded: a) opportunities to respond-group, b) opportunities to
respond-individuals, c) praise, d) correction, and e) negative feedback, and any additional
consequent-contingencies. Each of these variables is an essential component step in
OTRs. Measurement of individual and group OTR provides a rate for presentations
across target and all students. Teacher feedback (e.g., praise, correction, and negative
feedback, and any additional consequent-contingencies) provides a rate and descriptive
42
method for exploration of the OTR consequent-contingency differences that may exist at
the secondary level in comparison to past research conducted at the elementary level.
Treatment Integrity. All treatment integrity forms were developed as part of the
Center for Adolescent Research in Schools (2012) and adapted for use within this project
(See Appendix C). Specifically, integrity forms for the present study were broken into
individual measures for each intervention method. Integrity checks were given on the
first three days of OTR implementation and used a combination of direct observation data
during OTR implementation and a checklist of critical components of each OTR
intervention. If an OTR intervention was not demonstrated during one of the first
sessions an integrity score of 0% was given and a booster session was conducted with the
individual teacher. After an 80% established integrity level was met, OTR integrity was
measured once a week for all three intervention methods during the remainder of the
intervention phase. During the replication phase additional integrity data were collected.
If at any time an individual teacher fell below the required 80% integrity rate, a booster
session was conducted.
Social Validity. All teachers completed a 25 question acceptability measure
which included 4 optional open ended questions at the conclusion of the intervention
phase (See Appendix D). This component was implemented before the replication phase
to eliminate potential bias once data were shared on the most effective strategy. Each of
the 21 Likert scale questions was rated on a scale from one to seven and addressed areas
of: a) training, b) acceptability, c) impact, d) cost, e) barrier to implementation, and f)
maintenance. The final four questions were optional open ended questions asking
teachers to report any specific changes in student/classroom performance, components of

43
the intervention they found to be most effective, components of the intervention that were
not effective, and any potential barriers that existed with the implementation of the OTR
intervention. In addition, students also completed a 6 question acceptability measure
(See Appendix E). Each of the questions was rated on a Likert scale from one to seven.
These questions addressed two areas of student perception: acceptability and
effectiveness.
44
CHAPTER III
RESULTS
Direct observation data were collected and plotted for visual analysis across three
student-teacher dyads. Using an alternating treatment design, visual analysis and related
descriptive data comparison were examined to answer each research question. Both
teacher and student behavioral data was collected for each session and plotted across
three phases: baseline, alternating interventions, and then the best treatment. Level,
trend, and variability were visually analyzed for comparisons across phases and between
OTR strategies. Overall, two functional relationships were noted; a) there was a clear
level change for all OTR strategies over baseline and b) response cards emerged as the
most efficacious (see Figures 1 to 3). Other analyses include descriptive comparisons of
week-by-week classroom performance, feasibility and acceptability reports, academic
achievement, classroom behaviors and teacher use of consequent contingency. Results
are further discussed by research question.
Research Question One
Within a core instructional subject area of mathematics, what are the effects of differing
types of OTR (guided notes, class-wide peer tutoring, and response cards) on student
disruptive behavior and academic engagement?
AET data were collected and visually analyzed across the three phases of the
alternating treatment design, baseline, intervention and best treatment replication, and
plotted into individual teacher-student dyad graphs (Tawney & Gast, 1984). Clear trend
and level changes existed for all three participants. Although data variability was
observed for all three students during both baseline and intervention phases, when best
45
treatment was provided alone a reduction in variability was observed. During the
baseline phase all three students demonstrated significantly low levels of AET with
moderate levels of disruption. Once the three different types of OTR were introduced
(guided notes, class-wide peer tutoring, and response cards) all three students
demonstrated overall higher percentages of AET. While the comparison across OTR
strategies did not produce a clear superior treatment, overall, response card conditions
had higher levels of AET. During the best treatment phase there was a lower level of
variability within the data for all three students and AET occurred at a higher mean level
in comparison to the alternating treatment condition confirming response cards as the
most efficacious intervention. Individual student data are reported in more detail below.
Student One. During baseline, Student One displayed low levels of AET
averaging less than 30% (mean = 23.3%) during all observed sessions. Visual analysis
shows an overall slight increasing trend during the baseline phase with some variability
but at a significantly low level. Disruption rates during baseline for Student One ranged
from 0.26 to 1.2 per minute during with an average of 0.58 per minute. This rate
indicates that on average during the baseline phase Student One disrupted the learning of
others about once every two minutes. While there was a slight increasing trend during
baseline, the decision to intervene was made for Student One because of the overall low
rate of AET. In addition, student disruptions were occurring at a high level.
During the guided notes (GN) intervention condition of OTR, Student One
displayed higher rates of AET than baseline with a mean of 46.61% of time (range 22.4%
to 73.9%). Data values represented 50% of the observations of AET were not within the
recommendation level of 80-90% for stability, indicating a high level of variability

46
(Tawney & Gast, 1984). AET during the guided notes intervention had the largest
amount of variability across the three OTR methods. Visual analysis shows that during
the guided notes condition an overall flat trend with a gradual increase toward the end of
the phase. Mean AET represented an overall increase of 23.3% from the baseline
condition. Student One’s disruptions during guided notes ranged from 0.0 to 0.6 per
minute with an average rate 0.22 per minutes (see Table 1), or an average of about once
every five minutes.
Student One had a range of AET from 15.0% to 77.9% during CWPT with an
average of 60.31%. Furthermore, 83.0% of the data values fell within the 15% mean
range recommended by Tawney & Gast (1984) as evidence of stability. Visual analysis
shows that the percentage of AET during this condition was at a higher level during this
method of implementation then what had been observed within the guided notes,
included less variability, and had an increasing trend. An overall mean increase of 37.0%
of AET existed during the CWPT condition over baseline.
Student One’s disruptions during CWPT ranged from 0.0 to 0.5 per minute with
an average rate of 0.28 per minute. This average rate is slightly higher than within the
guided notes intervention condition but with less variability. Similarly to guided notes,
disruptions showed at an increasing rate during alternating intervention conditions.
During CWPT, student disruptions decreased from baseline rates by 0.3 per minute.
During the response card intervention condition for Student One, a range of AET
existed from 62.1% to 100% with an average of 76.06%. All AET data values (100%)
existed within a 15% range from the mean performance level which surpassed the
Tawney and Gast (1984) 80-90% recommendation of stability. Visual analysis shows
47
that during the response card condition AET was at a higher level than guided notes or
CWPT and included the least amount of variability and an increasing trend. The mean
level of AET during the response card condition was 52.76% higher than baseline. There
was one less data point for response card intervention than the other intervention
conditions due to the target student being called out of the classroom during the
instructional period to meet with a school counselor related to a personal issue regarding
his family.
Student One disruptions during the response card strategy was at a rate of 0.22
with a range of 0.0 to 0.6 per minute. This was a decrease of 0.36 per minute from
baseline and occurred at a stable rate.
The response card intervention was determined the best condition for Student One
because this condition demonstrated a high level with the greatest increasing trend of
AET and the least amount of variability. In addition, the rate of student disruptions was
the lowest during the response card condition and occurred at a stable rate. The best
treatment condition of response cards demonstrated a mean AET of 88.8% with a range
of 73.9% to 100%. All data values (100%) exist within the stability recommendation by
Tawney and Gast (1984) of a 15% point range from the mean performance level. Visual
analysis shows that the level for the best treatment was higher than any of the levels
during the alternating intervention phase and demonstrated a slightly increasing trend.
Student mean disruption rates were also at 0.07 per minute with a range of 0.0 to 0.2 per
minute, or a mean disruption frequency of seven times out of every 100 minutes. This
rate was lower than any condition and demonstrated a decreasing trend.
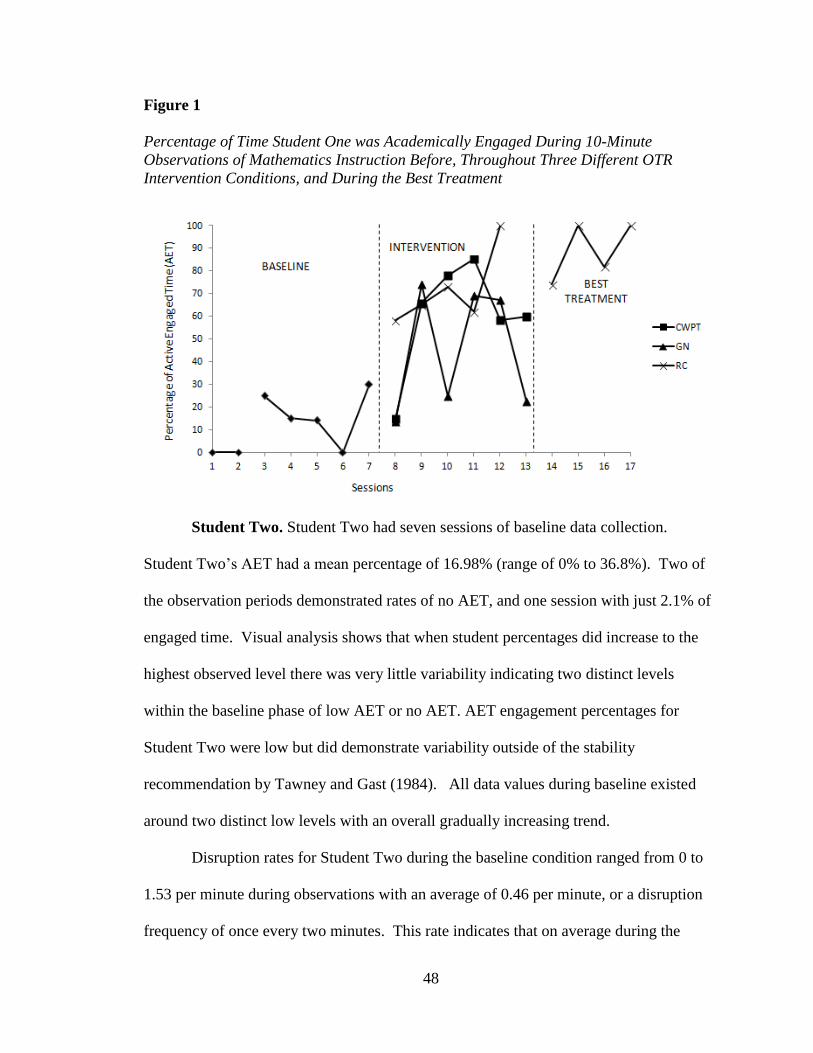
48
Figure 1
Percentage of Time Student One was Academically Engaged During 10-Minute
Observations of Mathematics Instruction Before, Throughout Three Different OTR
Intervention Conditions, and During the Best Treatment
Student Two. Student Two had seven sessions of baseline data collection.
Student Two’s AET had a mean percentage of 16.98% (range of 0% to 36.8%). Two of
the observation periods demonstrated rates of no AET, and one session with just 2.1% of
engaged time. Visual analysis shows that when student percentages did increase to the
highest observed level there was very little variability indicating two distinct levels
within the baseline phase of low AET or no AET. AET engagement percentages for
Student Two were low but did demonstrate variability outside of the stability
recommendation by Tawney and Gast (1984). All data values during baseline existed
around two distinct low levels with an overall gradually increasing trend.
Disruption rates for Student Two during the baseline condition ranged from 0 to
1.53 per minute during observations with an average of 0.46 per minute, or a disruption
frequency of once every two minutes. This rate indicates that on average during the
49
baseline phase Student Two disrupted the learning of others a little less than once every
two minutes. Similar to Student One, across baseline a decreasing trend of student
disruptions existed with significant variability, but at an overall high level.
During the guided notes intervention condition Student Two demonstrated AET
percentages with a range of 0.0% to 89.9% of time with and an average mean of 33.8%.
Only 57% of observations were recorded within the stability criteria outlined by Tawney
and Gast (1984) indicating a high rate of variability. Data also showed a decreasing trend
at an overall low level. However, during the guided notes intervention condition for
Student Two there was an increase in AET by 16.82%.
Disruption rates for Student Two during the guided notes intervention condition
averaged 0.46 per minute (range 0.0 to 1.5). This rate is very similar to the baseline
phase of student disruptions once every two minutes and included similar variability, but
demonstrated a decreasing rate.
During the CWPT Student Two’s average AET was 52.5% (range 26.5% to
89.6%). Seventy percent of the observations fell outside of the stability criteria of 15%
from the mean for AET indicating significant variability during observations. However,
the average AET percent of time was 35.52% higher than the baseline, at a median level
with a decreasing trend. CWPT demonstrated higher average rates of AET than guided
notes.
Student disruption rates during the CWPT intervention occurred on average 0.36
(range of 0.0 to 1.5), or a frequency disruption of once every three minutes. This was a
decrease from baseline by 0.1 disruptions per minute. Student disruptions occurred
during CWPT at a high rate with significant variability and at an increasing trend.

50
Student disruptions rates during CWPT were less than both guided notes and baseline
conditions.
During the response card condition rates of AET were between 0.1% and 94.9%
of time with an average rate of 60.37%. Although the data values were highly variable
and unstable according to Tawney and Gast (1984), only one data point occurred at a rate
less that the mean baseline AET. During the response card condition, the AET mean rate
was 43.39% higher than the baseline condition and also 24.78% higher than the CWPT
condition. AET data demonstrated a flat trend across the phase.
Student disruption rates during the response card condition occurred at a mean of
0.42 per minute with a range of 0.06 to 1.0, with a mean frequency of less than once
every two minutes. Although this range is less than the guided notes and CWPT
condition it still occurred at a similar rate to baseline. Student disruptions also showed an
increasing trend across the response card condition.
The best treatment condition for Student Two was the response card condition
based on the highest overall level of AET. An average rate of AET during the best
treatment condition was 90.93% of time with a range of 81.8% to 95.8% of time. The
mean level of engagement was higher than any of conditions during the alternating
treatment design and 100% of observations were within the stable range recommended by
Tawny and Gast (1984) as 15% from the mean level. Visual analysis showed AET rates
were also stable and demonstrated a marked difference from baseline. Disruption rates
were also at an average mean rate per minute of 0.2 with a range of 0.1 to 0.3 per minute
with a slight increasing trend with a mean frequency of about once every five minutes.
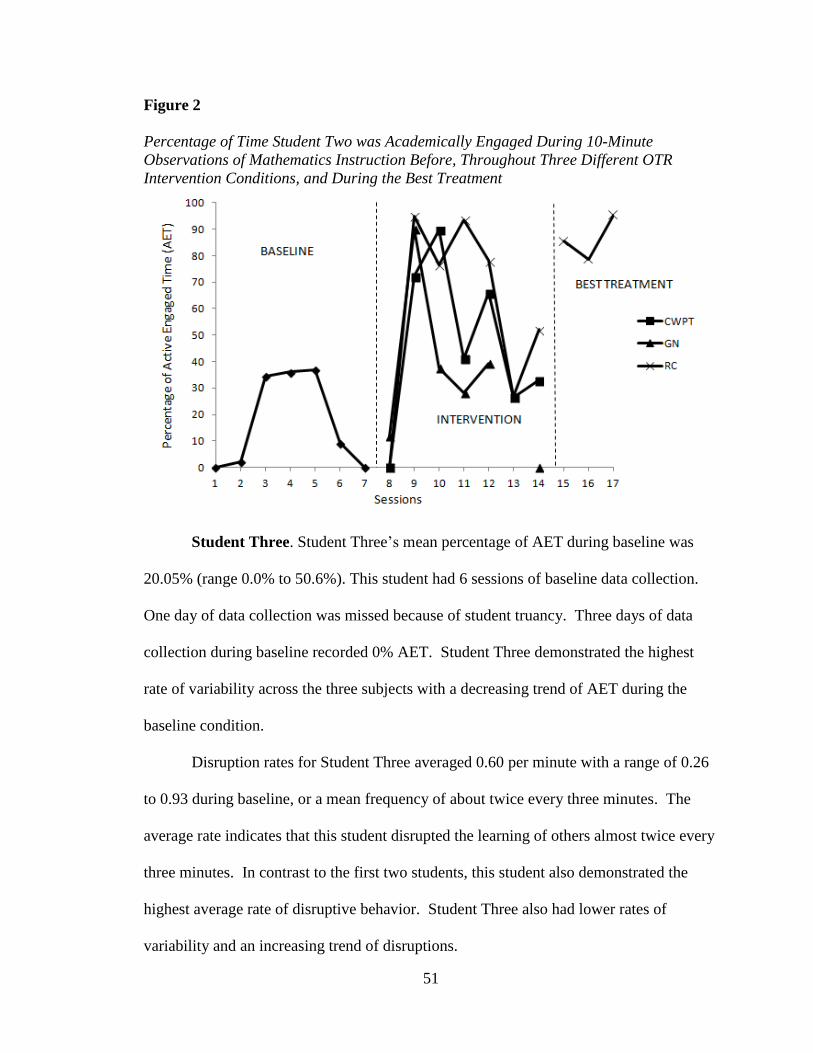
51
Figure 2
Percentage of Time Student Two was Academically Engaged During 10-Minute
Observations of Mathematics Instruction Before, Throughout Three Different OTR
Intervention Conditions, and During the Best Treatment
Student Three. Student Three’s mean percentage of AET during baseline was
20.05% (range 0.0% to 50.6%). This student had 6 sessions of baseline data collection.
One day of data collection was missed because of student truancy. Three days of data
collection during baseline recorded 0% AET. Student Three demonstrated the highest
rate of variability across the three subjects with a decreasing trend of AET during the
baseline condition.
Disruption rates for Student Three averaged 0.60 per minute with a range of 0.26
to 0.93 during baseline, or a mean frequency of about twice every three minutes. The
average rate indicates that this student disrupted the learning of others almost twice every
three minutes. In contrast to the first two students, this student also demonstrated the
highest average rate of disruptive behavior. Student Three also had lower rates of
variability and an increasing trend of disruptions.
52
The decision to intervene the alternating OTR conditions was made because even
though variability existed the highest percentage of AET was still low and was occurring
at a decreasing trend. Student disruptions during this time were happening at a high rate
with an increasing trend.
During the guided notes intervention condition, Student Three had an average
AET of 54.78% (range 17.3-100%). AET percentages also indicated high levels of
variability for data values outside of the standard recommendation by Tawney and Gast
(1894). Guided notes data showed a gradually increasing trend with a median level of
AET. Overall mean percentage of AET for Student Three during the guided notes
intervention condition was 9.98% higher than baseline.
Student disruptions during the guided notes condition existed at a mean rate of
0.29 per minute and ranged from 0.0 to 0.7 per minute, or a mean frequency of once
every three minutes. Student disruptions had significant variability during this condition
but occurred at less than half the rate from the baseline condition, 0.60 to 0.29 per
minute, of from twice every three minutes to once every three minutes. Student
disruptions still occurred at a high rate during the guided notes condition and with an
increasing trend.
During the CWPT intervention four sessions of this condition were observed for
Student Three. The student’s AET mean during CWPT was 60.35% of time with a range
of 0% to 100% of time. Only 25% of the data values were within the stability
recommendations by Tawney and Gast (1984), and displayed a decreasing trend.
However, despite the variability and decreasing trend there is a mean AET percentage
increase over baseline of 15.55%.
53
Student Three’s disruption mean rate during CWPT was 0.3 per minute ranging
from 0.0 to 0.5 per minute, or a disruption frequency of once every three minutes. This
range is less than baseline and guided notes. The mean student disruption rate is also half
of what it was during the baseline condition and very similar in rate to the guided notes
condition.
The response card intervention condition had the highest mean percentage of AET
at 78.8% of time with a range of 64.7% to 100%. Of the data values 75% of the data
points are within a 15% range of the mean. The one data point that was not was at 100%
of time. Visual analysis showed that this intervention condition demonstrated the highest
level of AET with an increasing trend, and the most stability over baseline, guided notes,
and CWPT.
However, student disruption rates for response cards were the highest of any of
the intervention conditions, but still below the baseline level. A mean rate of student
disruptions during the response card intervention was 0.42 per minute and ranged from
0.18 to 1.0 per minute, or a frequency of a little less than once every two minutes.
Despite the disruption rate being greater than guided notes and CWPT, there is still a 0.18
per minute decrease from baseline.
Student Three’s data showed clear and marked changes during the intervention
phase. AET percentages were largest during the response card intervention and
demonstrated a higher level of performance than the other two intervention methods.
Similar to Students One and Two, the decision for best treatment was made because of a
high level and had a greater increasing trend of AET than the two other intervention
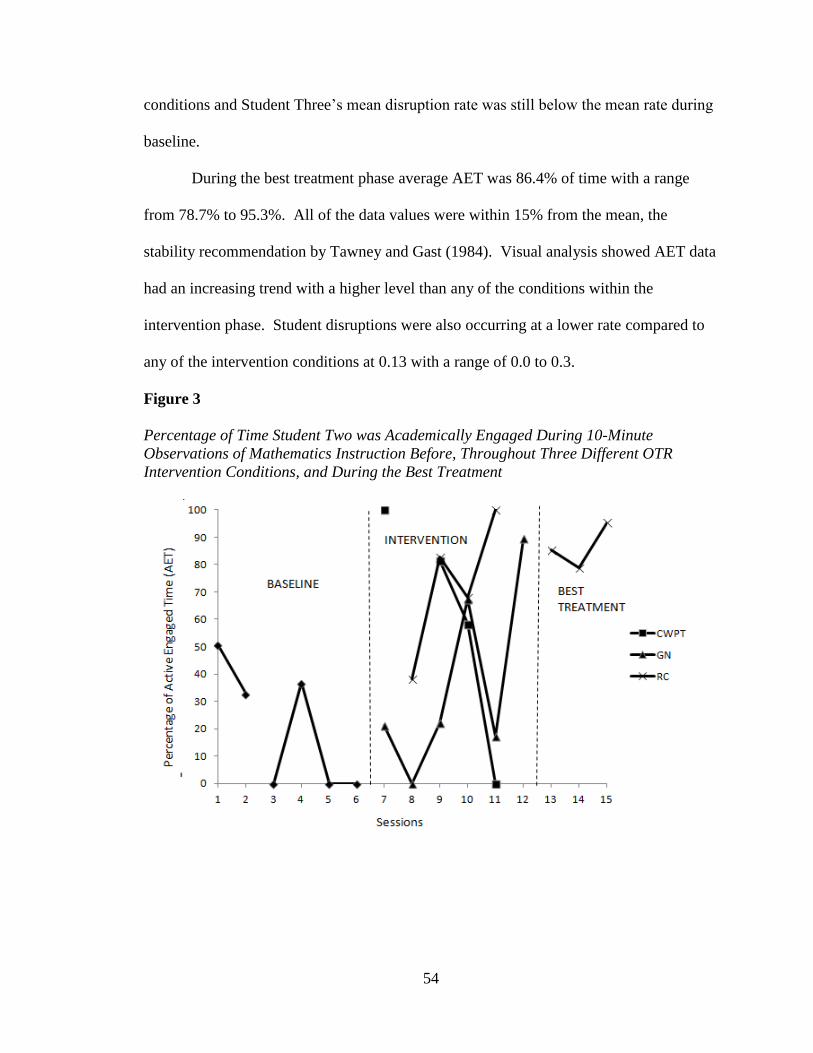
54
conditions and Student Three’s mean disruption rate was still below the mean rate during
baseline.
During the best treatment phase average AET was 86.4% of time with a range
from 78.7% to 95.3%. All of the data values were within 15% from the mean, the
stability recommendation by Tawney and Gast (1984). Visual analysis showed AET data
had an increasing trend with a higher level than any of the conditions within the
intervention phase. Student disruptions were also occurring at a lower rate compared to
any of the intervention conditions at 0.13 with a range of 0.0 to 0.3.
Figure 3
Percentage of Time Student Two was Academically Engaged During 10-Minute
Observations of Mathematics Instruction Before, Throughout Three Different OTR
Intervention Conditions, and During the Best Treatment
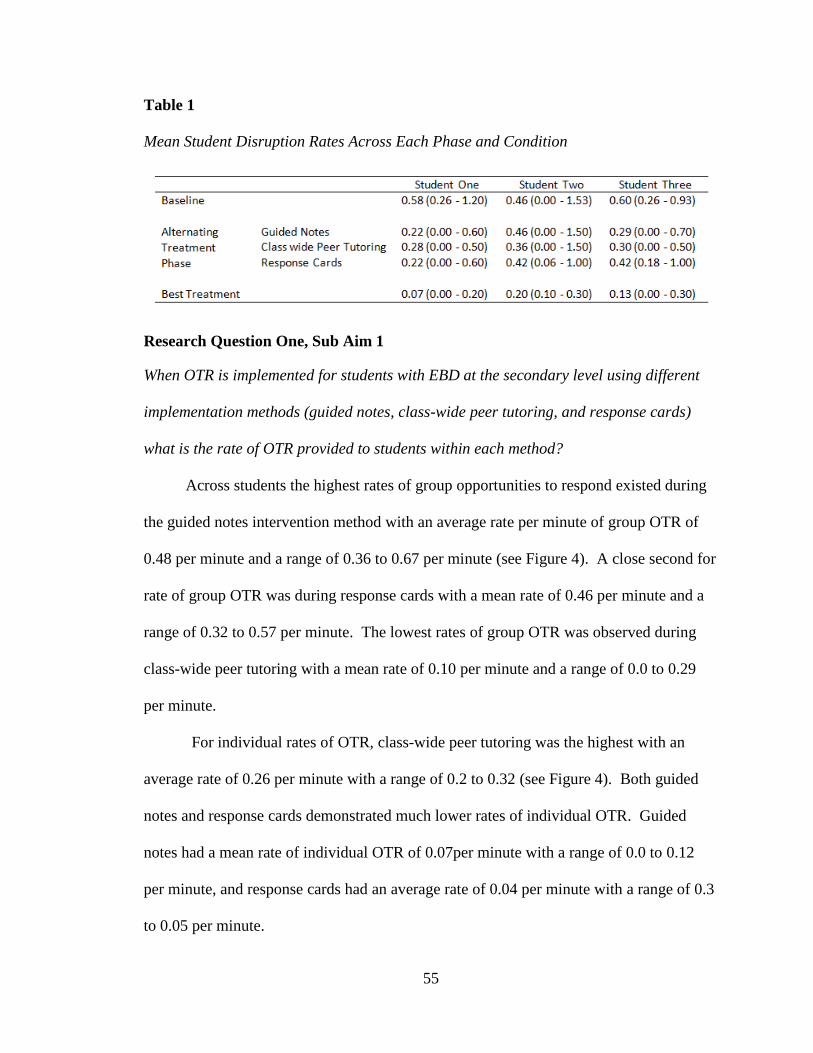
55
Table 1
Mean Student Disruption Rates Across Each Phase and Condition
Research Question One, Sub Aim 1
When OTR is implemented for students with EBD at the secondary level using different
implementation methods (guided notes, class-wide peer tutoring, and response cards)
what is the rate of OTR provided to students within each method?
Across students the highest rates of group opportunities to respond existed during
the guided notes intervention method with an average rate per minute of group OTR of
0.48 per minute and a range of 0.36 to 0.67 per minute (see Figure 4). A close second for
rate of group OTR was during response cards with a mean rate of 0.46 per minute and a
range of 0.32 to 0.57 per minute. The lowest rates of group OTR was observed during
class-wide peer tutoring with a mean rate of 0.10 per minute and a range of 0.0 to 0.29
per minute.
For individual rates of OTR, class-wide peer tutoring was the highest with an
average rate of 0.26 per minute with a range of 0.2 to 0.32 (see Figure 4). Both guided
notes and response cards demonstrated much lower rates of individual OTR. Guided
notes had a mean rate of individual OTR of 0.07per minute with a range of 0.0 to 0.12
per minute, and response cards had an average rate of 0.04 per minute with a range of 0.3
to 0.05 per minute.
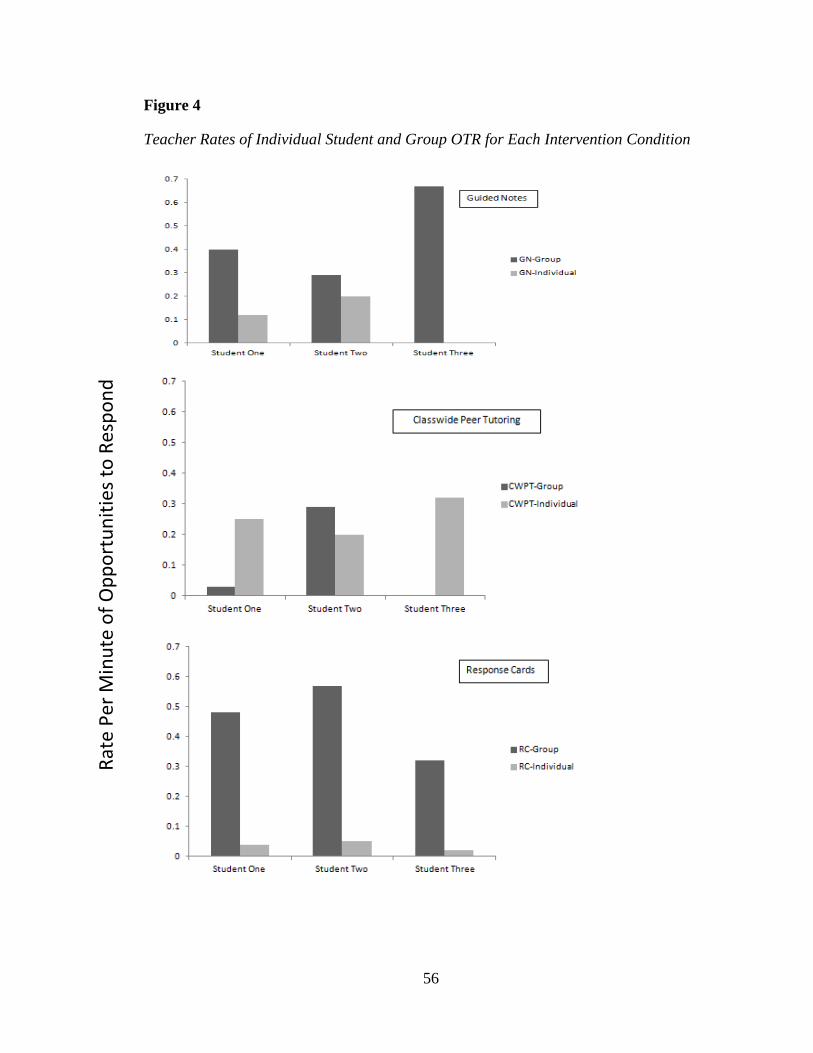
56
Figure 4
Teacher Rates of Individual Student and Group OTR for Each Intervention Condition
Rat
e P
er M
inu
te o
f O
pp
ort
un
itie
s to
Res
po
nd
57
Research Question One Sub Aim 2
When OTR is implemented for students with EBD at the secondary level, what is the
effect of differing rates of OTR on student disruptive behavior and academic
engagement?
A two-tailed correlation design was analyzed across 81 observations to determine
if a relationship existed between disruptive behavior, academic engagement, and the rate
of OTR. The analysis indicated the only significant finding was within the relationship
between percent of academic engagement and rate of disruptive behavior. These two
variables were negatively correlated (r = -.365) at a significance level of 0.01. No other
variables were significant when correlated with one another.
Research Question Two
When OTR intervention methods are implemented for students with EBD at the
secondary level, what is the effect on academic performance (i.e., classwork, homework,
quiz and test scores)?
All students demonstrated variance across each performance criterion. However,
the greatest academic performance gains were demonstrated across all three students
within the classwork criterion. Individual student average percentages for each week of
the studies implementation are described below.
For Student One homework completion increased during the alternating treatment
design condition by an average percentage of 28.33 but decreased during the best
treatment phase (see Table 2). The mean percentage score for classwork for Student One
continued to rise from baseline to the best treatment phase. Overall the percentage gain
across the study during all phases was 90%. Quiz percentage of correct response
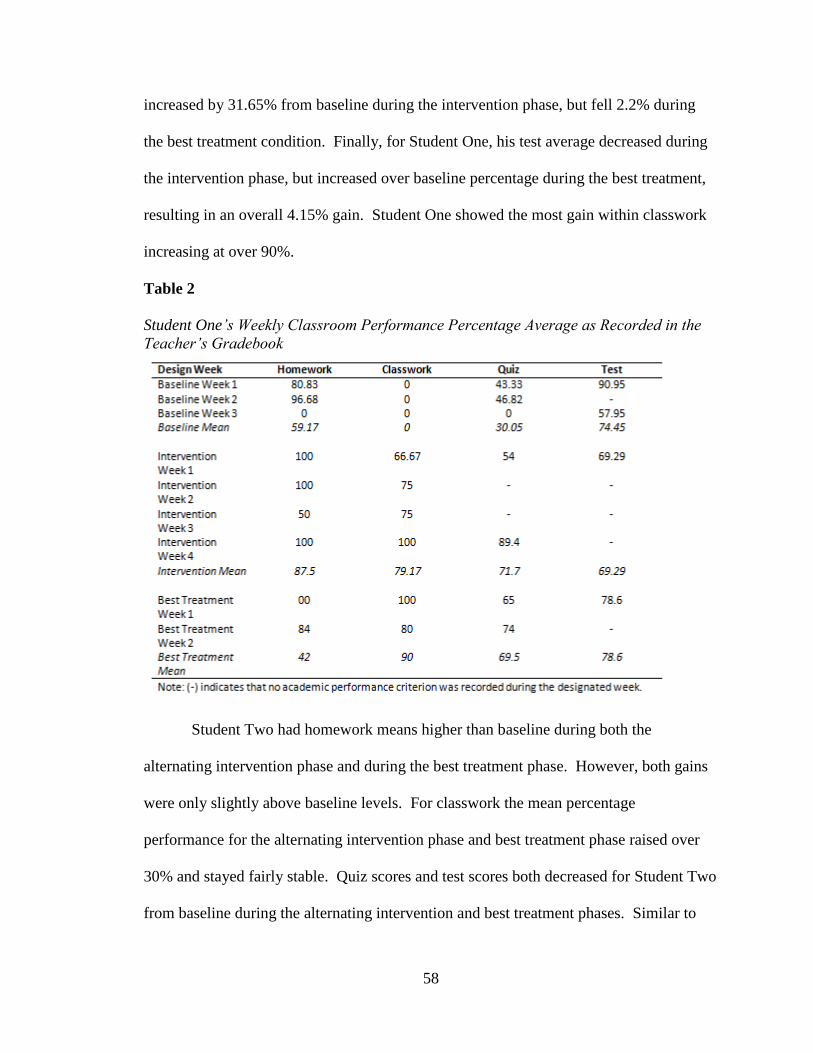
58
increased by 31.65% from baseline during the intervention phase, but fell 2.2% during
the best treatment condition. Finally, for Student One, his test average decreased during
the intervention phase, but increased over baseline percentage during the best treatment,
resulting in an overall 4.15% gain. Student One showed the most gain within classwork
increasing at over 90%.
Table 2
Student One’s Weekly Classroom Performance Percentage Average as Recorded in the
Teacher’s Gradebook
Student Two had homework means higher than baseline during both the
alternating intervention phase and during the best treatment phase. However, both gains
were only slightly above baseline levels. For classwork the mean percentage
performance for the alternating intervention phase and best treatment phase raised over
30% and stayed fairly stable. Quiz scores and test scores both decreased for Student Two
from baseline during the alternating intervention and best treatment phases. Similar to
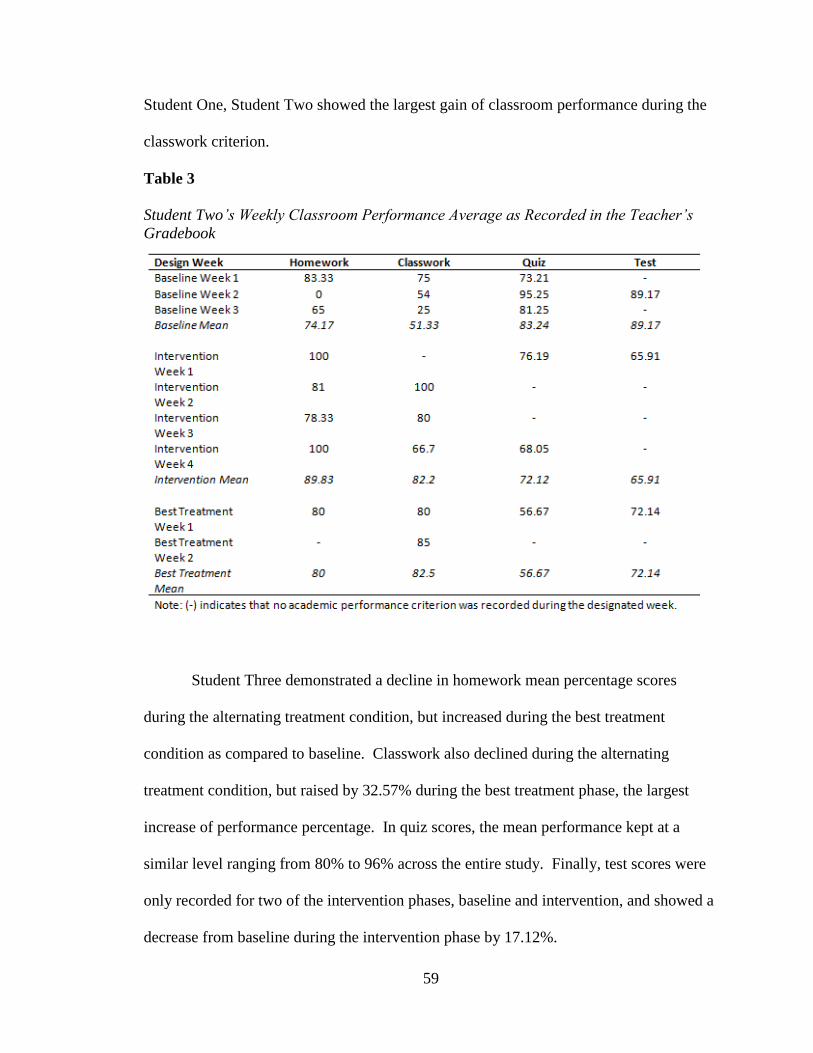
59
Student One, Student Two showed the largest gain of classroom performance during the
classwork criterion.
Table 3
Student Two’s Weekly Classroom Performance Average as Recorded in the Teacher’s
Gradebook
Student Three demonstrated a decline in homework mean percentage scores
during the alternating treatment condition, but increased during the best treatment
condition as compared to baseline. Classwork also declined during the alternating
treatment condition, but raised by 32.57% during the best treatment phase, the largest
increase of performance percentage. In quiz scores, the mean performance kept at a
similar level ranging from 80% to 96% across the entire study. Finally, test scores were
only recorded for two of the intervention phases, baseline and intervention, and showed a
decrease from baseline during the intervention phase by 17.12%.
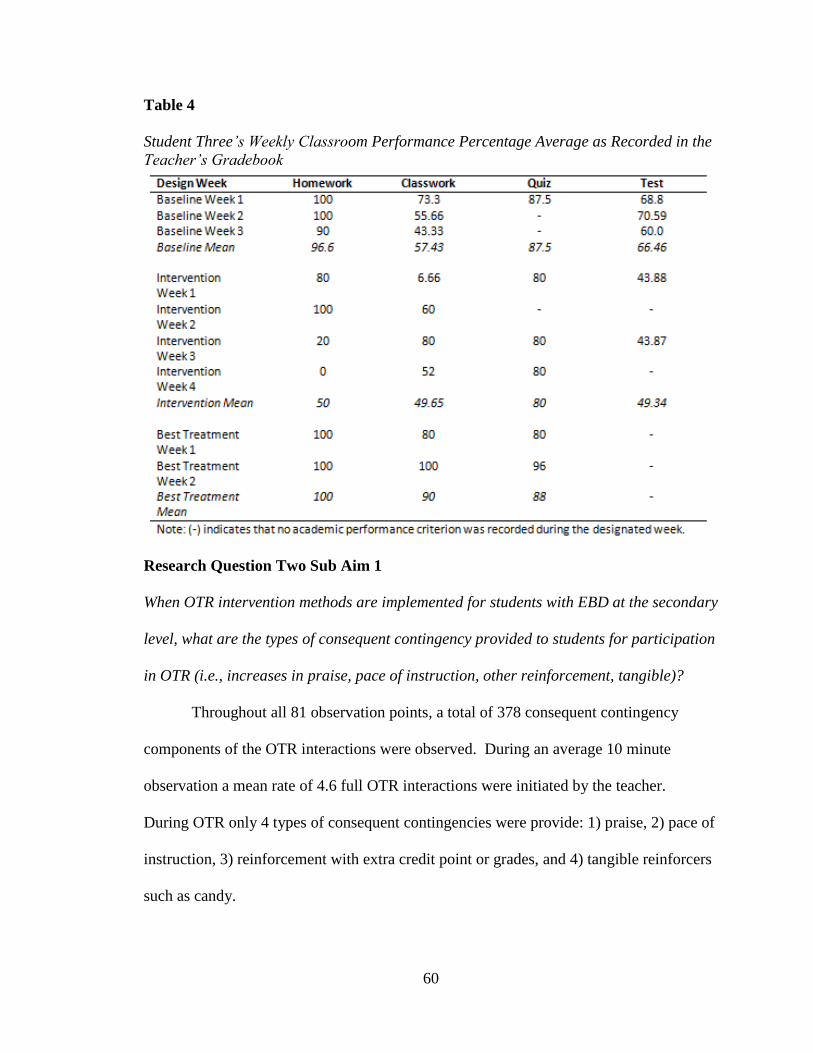
60
Table 4
Student Three’s Weekly Classroom Performance Percentage Average as Recorded in the
Teacher’s Gradebook
Research Question Two Sub Aim 1
When OTR intervention methods are implemented for students with EBD at the secondary
level, what are the types of consequent contingency provided to students for participation
in OTR (i.e., increases in praise, pace of instruction, other reinforcement, tangible)?
Throughout all 81 observation points, a total of 378 consequent contingency
components of the OTR interactions were observed. During an average 10 minute
observation a mean rate of 4.6 full OTR interactions were initiated by the teacher.
During OTR only 4 types of consequent contingencies were provide: 1) praise, 2) pace of
instruction, 3) reinforcement with extra credit point or grades, and 4) tangible reinforcers
such as candy.
61
The use of praise was only given by teachers 73 times or a total of 19.3% of the
possible opportunities for the component of consequent contingencies. The most often
used consequent contingency was pace of instruction. This was used a total of 255 times
or a total of 67.5% of all OTR interactions. Giving a naturally occurring reinforcer
within the classroom, such as a credit towards in-class participation or even extra credit,
was used 43 times or 11.4%. The lowest rate of consequent contingency used was a
tangible reward and this was done only 8 times or 2.1% of the opportunities.
Research Question Two Sub Aim 2
When OTR intervention methods are implemented for students with EBD at the secondary
level, does student academic achievement level effect student engagement rates and
academic performance?
All students’ standardized subtest scores on the Woodcock Johnson-3 and broad
reading scores were correlated against mean student engagement rates for each type of
OTR intervention strategy and academic performance across each phase of study. There
were only two significant correlations between any of the factors on the two-tailed
Pearson correlation. The first significant correlation was between classroom performance
and a student’s standardized score on the applied problems subtest within the Woodcock
Johnson-3. This was positively correlated at a level of 0.999 at the 0.05 significance
level. The other significant correlation was a positive correlation between student
engagement during baseline and passage comprehension. This was also positively
correlated at a level of 0.999 at the 0.05 significance level. Student’s individual scores on
each of the Woodcock Johnson-3 subtests are reported below.
62
Inter-Observer Agreement
Across all observations, 30.09% of the total included a second observer to
measure reliability through inter-observer agreement (IOA). IOA was checked
frequently across the study and agreement was high across all conditions of the study
with a mean of 95.8% agreement. During baseline, rates ranged from 86% to 100% of
agreement with an average rate of 93.3% agreement. The alternating treatment condition
had a total of 12 observations and ranged from 88% to 100% with an average IOA of
96.2%. Finally, during the best treatment intervention three observations were recorded
for IOA with a total average rate of 97.9%.
Social Validity
Teacher perception data were taken across four areas for analysis: Acceptability,
effectiveness, disruptiveness, and cost (see Table 5). Teachers were given a social
validity survey for each of the OTR components. Students were only given one social
validity questionnaire to record overall perceptions. Across both teachers, response cards
was found to be the OTR intervention which was rated the most acceptable and the most
effective and scored the same as guided notes with respect to disruptiveness to the
classroom routine (5.8) and cost of implementation (6.75). Overall, Teacher One rated
OTR implementation methods more positively than Teacher Two. Scores from both
teachers demonstrated effectiveness and acceptability as a strength of the best treatment
condition.

63
Table 5
Social Validity Ratings of Teacher Perceptions for Opportunities to Respond
Instructional Interventions
Student social validity data were collected across two categories: Acceptability
and effectiveness using a 7 point Likert scale. The Acceptability category contained a
total of six questions. Effectiveness on changing behavior was only addressed through
one question within the survey. Students rated all Opportunities to respond
implementation methods on one form. Student One rated the acceptability of OTR as a
7.0 the highest rating it could receive. He also thought that the effectiveness of the
intervention helped him to improve in school. Student Two found the acceptability of
OTR to have a mean score of 6.2 with a range of 6 to 7 across the 6 questions within the
acceptability category. For the effectiveness category Student Two believe that this
intervention helped him at a level of 5.0. Student Three rated the acceptability of OTR at
4.2 citing a lowest score of 3.0 on a question that asked if there were things that he did
not like about the intervention package. He did think that OTR interventions helped him
some (4.0) to improve in school.
64
Intervention Fidelity
Intervention fidelity data were collected during the first three days of intervention
conditions for each OTR intervention. All teachers scored 100%, meeting each of the
check listed intervention components. Data indicate that both teachers were able to
implement each of the three instructional approaches of implementing OTR (guided
notes, class-wide peer tutoring, and response cards) at a high level.
65
CHAPTER IV
DISCUSSION
Students who display emotional and behavioral disorders (EBD) are increasingly
educated within general education environments and less frequently in pull out or self-
contained classrooms (Trout et al., 2003). The defining characteristics of this population
reflect the struggles that these students have to achieve in any environment. Academic
and behavioral success is a critical component for effectively addressing students with
EBD’s educational needs. However, most of the educators that are providing instruction
to these students are those with minimal training in behavior and classroom management
(Reschly & Christenson, 2006). Educating students to insure academic growth, post
secondary education, and limit problem behavior has been an issue which has plagued
educators for decades (Trout et al., 2003; Wagner, 1992).
Results of this study extend the literature base in several ways. Previous literature
using an alternating treatment design have been focused on comparing one intervention
strategy, or a mixed responding method to a traditional method of response such as choral
responding (e.g. Blackwell & McLaughin, 2005; Haydon, Conroy, Scott, Sindelar,
Barber, & Orlando, 2010). Although, using a design incorporating a traditional method
as compassion has shown favorable outcomes for increasing academic engaged time, the
literature suggests more research studies focus on the comparison of multiple methods of
implementation compared to the natural teaching environment (Haydon, Mancil, & Van
Loan, 2009). The current study is the first of its kind to compare the selected types of
OTR strategies: a) guided notes, b) class-wide peer tutoring, and c) response cards.
Investigating each of these strategies at the same time provides comparison and
66
insight into the specific relationship of each method on teacher and student behavior.
Although all strategies were shown to be effective on increasing the rate of AET for
students, the response cards condition had the greatest impact. In addition, asking
teachers to implement all three intervention methods during one instructional period gave
teachers and students the opportunity to make direct comparisons on the acceptability,
feasibility, and effectiveness of each OTR method (Haydon, Mancil, & Van Loan, 2009;
Hayling, Cook, Gresham, State, & Kern, 2008). One explanation for the increase of
students’ AET during the intervention condition is that the essential components of the
intervention required teachers to change their traditional instructional format by eliciting
much higher rates of responding for all students in the classroom.
Much of the current research base around creating effect environments to support
student academic and behavioral needs has been within elementary settings. There are
limited amounts of research within secondary settings and the unique characteristics
which may impact the effectiveness and feasibility of implementing OTR strategies
within these settings. Immediacy exists to support investigation into effective supports at
secondary levels. Numerous negative educational academic and behavioral factors have
created secondary settings where students have low school engagement, poor attendance,
low academic achievement, conflicts with adults and peers, disruptive behavior, mental
health issues, failing grades, high dropout rates, and school suspension (Lane et al., 2006,
Merrell & Walker, 2004; US Department of Education, 2008). This study is one of a
handful of other studies that look at addressing universal OTR strategies within the high
school setting. A larger comparison across multiple settings, instructional areas, and
67
teacher-student dyads is needed to increase the generalization of these OTR strategies for
implementation within secondary settings.
The current study expanded the current literature base for OTR by directly
examining the specific components of the OTR interaction: stimuli, response, and
consequent-contingency. The nature of high school classrooms has been shown to be
unique from other educational settings and even more unique within each individual
school subject areas (Grossman & Stodolsky, 1995). Specifically examining the
reinforcement provided by teachers during the consequent-contingency component
outside of praise has been recommended within research on OTR (Skinner, Pappas, &
Davis, 2005) but has not been specifically examined. In previous research implementing
OTR strategies, a consequent-contingency component of praise was required by
definition of the OTR interaction. Allowing teachers to not have constraint on the type of
consequent-contingency provided gave specific insight into acceptable reinforcers and
the natural preference of teachers within secondary setting. The consequent-contingency
component should be analyzed more extensively to determine if these results are
generalizable across multiple instructional contexts and student-teacher dyads.
This study also looked at the rate of OTR within secondary settings. Different
from previous research, increased OTR rates did not show any relationship to academic
and behavioral outcomes. Previous reviews of literature have shown that increased
academic and behavioral outcomes for students with EBD are directly related to increases
in the rate of OTR (Sutherland & Wehby, 2001). However, with the limited amount of
literature that exists within these reviews in high school settings, this conclusion may not
be true within secondary students.
68
Implementation of universal interventions to meet students’ with EBD needs is
critical for ensuring academic and social success. Opportunities to Respond (OTR) has
been researched at the secondary level but within limited environments and using limited
implementation strategies. Thus, the purpose of this study was to extend the existing
research base by examining the effects of three OTR intervention strategies within
secondary settings for students with emotional and behavioral disorders. In addition,
week-by-week classroom performance, student academic achievement, social validity,
and the use of various consequent contingencies were also explored.
Presented below are explanations of major findings from the current investigation.
Outcomes of each research question and sub aim are discussed in relation to previous
OTR research, expansion of the known knowledgebase, and limitations of the present
study. Implications for both research and practice are discussed.
Major Findings
Research Question One: Within a core instructional subject area of mathematics, what
are the effects of differing types of OTR (guided notes, class-wide peer tutoring, and
response cards) on student disruptive behavior and academic engagement?
In the current study all students showed higher rates of AET from baseline when
any of the OTR intervention strategies were implemented. Through direct observation,
levels of AET were at a higher level than during baseline for all students across all
interventions. Previous research has demonstrated changes from baseline comparing
OTR methods (e.g., Sutherland, Adler, & Gunter, 2003). However, the conditions
measured have been primarily within a reversal design comparing a single condition to
baseline. In addition, when comparing multiple conditions, the conditions typically only
69
used one of the OTR intervention strategies and a more traditional strategy of increasing
OTR, such as choral response (e.g., Hayden, Conroy, Scott, Sindelar, Barber, & Orlando,
2010). Student disruptive behavior also showed a decrease from baseline by comparing
the mean disruption rate during intervention conditions. Further investigation into the
rate and type of student disruptions during each of the intervention strategies may provide
insight within the maintenance of high rate of disruptive behavior for students during the
intervention strategies.
When only the best treatment was implemented, which was the response card
strategy for all students, an even higher level of student AET was observed. Since the
highest level of AET and lowest levels of behavioral disruptions existed during the best
treatment phase of response cards. There may have been an additive effect that existed
when multiple methods were previously presented.
Within all OTR intervention strategies there was a significant amount of
variability. During the alternating intervention condition only Student One had strategies
which fell within the Tawney and Gast (1984) recommendations for stability. Those
interventions which were considered stable were class-wide peer tutoring and response
cards. However, all three students did meet the stability criteria during the best treatment
phase when just the response card OTR intervention strategy was implemented. This
conclusion may show that implementing only one OTR intervention strategy at a time is
more conducive to improving student AET and reducing student disruptions.
Research Question One Sub Aim One: When OTR is implemented for students with EBD
at the secondary level using different implementation methods (guided notes, class-wide
70
peer tutoring, and response cards) what is the rate of OTR provided to students within
each method?
Implementation of OTR occurred at the highest rate for all students during the
guided notes intervention method with an average rate per minute of group OTR (0.48),
followed by response cards (0.46) and finally class-wide peer tutoring (0.10). However,
average individual OTR rates during the guided notes strategy (0.07) and response card
(0.04) were much lower.
If group and individual OTR were combined together to represent the most
possibility for engagement, guided notes had the highest amount of response
opportunities possible with an average rate of 0.55 per minute, followed by response
cards at 0.50 per minute, and then class-wide peer tutoring at 0.36 per minute. Within a
previous article examining rate of OTR by Sutherland, Adler and Gunter (2003) focusing
solely on increasing teacher use of OTR without incorporating a specific strategy, results
indicated rates of up to 3.52 per minute were optimal to demonstrate improved student
responding. While focused on OTR rates within elementary schools the Sutherland et al.
article demonstrated that OTR rates by teachers can increase to a rate per minute similar
to that suggested by the Council of Exception Children (1987). All of these suggested
rates have been considered from literature primarily at the elementary level. Even the
highest rates of OTR implementation at the secondary level observed within the present
study did not come close to the recommended rates. Given the present study did improve
student performance similar to past research conducted at the elementary level, further
research at the secondary level is clearly needed to determine optimal rates appropriate
for high school instruction.
71
Research Question One Sub Aim Two: When OTR is implemented for students with EBD
at the secondary level, what is the effect of differing rates of OTR on student disruptive
behavior and academic engagement?
No correlation was found when examining the relationship of student factors on
differing rates of OTR, but between the factors of disruptive behavior and academic
engagement a relationship did exist. One factor which was unable to be measured but
may have a potential impact on rate of OTR, academic engagement, and disruptive
behavior is the difficulty of the OTR response. Responses to OTR ranged from one word
answers to complex responses requiring the synthesis and analysis of multi-step problems
and situations. The amount of time required to answer the difficulty range of possible
OTR questions directly impacts rate. In addition, if OTR are presented at a slower rate, it
has been found in previous research to increase student disruptions (Haydon et. al.,
2010). Additionally, students are less likely to disrupt when they are engaged with OTR
(Sutherland, Wehby, & Yoder, 2002). All of these factors together may be why no
correlation existed. In addition, since much of this research has been done at the
elementary level, this conclusion may not be true for secondary settings.
Using a correlation design a significant negative relationship was found (r = -
0.365) when comparing a student’s AET and disruptive behavior. This finding is similar
to previous research that academic engagement is an incompatible variable with student
disruptions (Deno, 1998). Since student AET rates were based on the implementation of
OTR and much variability existed within AET, it is important to investigate other factors
that may have influenced these results. In addition, AET was analyzed as a combined
variable across all intervention methods. There may have been more impact related to
72
one OTR implementation method over another. Also, student data showed increases in
AET towards the end of the alternating treatment intervention phase. This increase may
be because student AET did not immediately respond to environmental changes or that it
took environmental changes to be in place across consistent days before a stable change
in student behavior existed. During the best treatment phase, student AET increased to
an even higher level. This increase may be based on response to a specific intervention
and actually improved when there was not a combination of multiple interventions.
Research Question Two: When OTR intervention methods are implemented for students
with EBD at the secondary level, what is the effect on academic performance (i.e.,
classwork, homework, quiz and test scores)?
Overall, the greatest gain across all students existed within the classwork criterion
for student engagement. Across all three students the gain was close to a 30% increase
in academic performance. A consistent measure did not exist for each of the criteria
within academic performance. Student academic performance was only measured when
a permanent product was created that was kept for a grade. Given the lack of a
consistent measure, results should be interpreted with caution. However, even the
measure of recorded grades provides promise on the relationship of academic
performance to OTR but a more systematic measure would have to be used to clearly
understand the relationship between OTR and academic performance, but would require
further investigation.
In previous research a consistent record of academic performance has been
analyzed through the measurement and accuracy of responses during the OTR
interaction (e.g., Lambert, Cartledge, Heward, & Lo, 2006; Sutherland, Alder, & Gunter,
73
2003). A higher rate of accuracy has also been demonstrated to relate to higher
presentation rates of OTR (Sutherland & Wehby, 2001). Increasing rates to an optimal
level in a classroom could produce significant long-term impact in influencing course
grades. However, the specific rate needed within high school settings has not yet been
established.
Research Question Two Sub Aim One: When OTR intervention methods are implemented
for students with EBD at the secondary level, what are the types of consequent
contingency provided to students for participation in OTR (i.e., increases in praise, pace
of instruction, other reinforcement, tangible)?
Much of the previous research within the area of OTR has defined the
consequent-contingency portion of the sequence. This has been defined as teacher praise
(i.e., Simonsen, Myers, & DeLuca, 2010). However, given the significant low rates of
praise at the secondary level it was important to examine the exact manifestation of the
consequent contingency. Atypical reinforcers outside of the traditional method of praise
have been demonstrated to be effective for changing student behavior within previous
research (Skinner, 2002; Skinner, Papas, & Davis, 2005). Data demonstrated that
instructional pace (67.5%) was actually the highest method of consequent-contingency
provided. This rate of the consequent-contingency component of the OTR interaction
reflects on the nature of secondary settings and possibly the transactional model
discussed in Chapter One. Also, the consequent-contingency of praise was considered a
specific variable of the CWPT intervention strategy. Therefore, the rate of praise given
as a consequent-contingency also takes this specific step as part of the reported
percentage and may be inflated.
74
Teacher and student interactions are influenced by one another within the
classroom (Sutherland, Lewis-Palmer, Stichter, & Morgan, 2008). Within the
transactional model, a student and teacher as members of the same environment effect
each other’s behavior. Teachers that require and prompt academic engagement from
students can have an adverse effect on both individual’s behavior. This interaction can
escalate student problem behavior making the prompt itself aversive and in return the
escalation of student problem behavior creates a pattern of negative reinforcement where
teachers no longer attempt to engage students to reduce the likelihood of student problem
behavior (Partin, Robertson, Maggin, Oliver, & Wehby, 2010). In addition students may
be reinforced for demonstrating problem behavior by the removal of the teacher’s
expectation for academic engagement. However, this pattern of reinforcement can also
be demonstrated by the encouragement of positive behavior. With the implementation of
the selected OTR strategies an individual student is not singled out for a required
response, and the use of peers to gain answers and information is even encouraged.
Using these supports, a prompt becomes less intrusive for students and may lessen the
aversion of engaging with instruction and responding to academic prompts. Additionally,
teachers within the current study used a similar form of reinforcement for appropriate
behavior (pace of instruction—or removing the academic prompt) as they had for
negative behavior. The process of moving on and continuing instruction serves as a
motivator for students. The same motivation occurs in both situations of eliciting
engagement. However, with the use of OTR strategies, the prompt for a student engaging
with instruction may be less aversive for the student and teacher by students giving
appropriate responses and the teacher responding with a similar consequent-contingency.
75
Engagement rates for the target student increased just by the teacher receiving an
appropriate response. This outcome supports an area that needs additional research and
investigation. The interaction between teachers and students may similarly exist for
student’s demonstration of both positive and negative behaviors. Exploring this
relationship between teacher and student behavior would be an expansion of previous
literature that has demonstrated teacher engagement of students solely based on the
child’s ability (Good, 1970).
Research Question Two Sub Aim Two: When OTR intervention methods are implemented
for students with EBD at the secondary level, does student academic achievement level
effect student engagement rates and academic performance?
Student academic achievement was an interesting variable that was explored in
relation to OTR. Only two areas were found to be significantly significant and existed at
a level which at a level which is highly indicative of a Type 1 error, and should be
interpreted with caution. The first correlation was between student’s classroom
performance and a student’s scores on the applied problems subset of the Woodcock
Johnson-3. This finding may have been significant simply based on a student’s
mathematical abilities in applying math calculations to problems. Many of the responses
required during the OTR interaction were directly related to this skill because of the core
targeted academic subject.
The second achievement finding was a significant positive correlation between
student engagement during the baseline condition and passage comprehension. This
relationship may also simply relate back to when students are first developing skills
76
within the early elementary grades and the relationship that has been established within
research to poor academic growth (Hinshaw, 1992).
Both of these findings should be acknowledged as descriptive patterns within the
data. There is a high possibility of a Type 1 error with the small sample size that was
analyzed to answer the research questions, and the correlation effect size. Although,
these results should be interpreted with caution is does create questions about the
existence of a relationship between AET and academic achievement.
Individual student academic performance must also be considered and
investigated further related to specific OTR intervention strategies. It is possible that
specific academic performance issues may impact the ability to engage with an OTR
intervention. An example of this would be the necessity of written language skills and
abilities within the guided notes intervention. Given that guided notes responses ranged
from a simple one word answer to complex sentences and reflection, there is a wide
variance of prerequisite skills that are needed to be able to effectively respond and engage
with the specific intervention.
Social Validity
Teacher rates of acceptability and feasibility were similar, but Teacher One rated
all of the intervention more favorably. However, both Teacher One and Teacher Two
found response cards to be the most acceptable intervention followed closely behind by
guided notes, and finally class-wide peer tutoring. Although class-wide peer tutoring was
found to be more effective by the mean combined score, it was also rated as more costly
and disruptive, and therefore least acceptable. Within the open-ended responses
questions as part of the social validity measure Teacher One reported that:
77
The peer tutoring did not provide desirable results. Part of the issue was
the timing. Students had already fit in to my normal pattern and the
amount of training was more burdensome then helpful thus performance
really made no change.
The social validity component of implementation of these intervention strategies
is especially important within secondary settings given secondary teachers typically have
had minimal classroom and behavior management training (Reschly & Christenson,
2006). The ease and acceptability is a significant factor for consideration on the
sustainability of incorporating these interventions within general education settings to
meet the needs of diverse learners.
Intervention Fidelity
` The strong fidelity outcomes are especially encouraging. Given a minimal
amount of training and technical assistance, both of the teachers were able to incorporate
all three interventions within their existing structures and curriculums. The strong
fidelity of implementation provides support for being able to implement multiple OTR
interventions within the complex nature and diverse settings that are found at the high
school level.
Limitations
There are some specific aspects of the present study that must be taken into
account when interpreting the results. Since this study was conducted within a larger
study, it is unknown the impact that additional intervention may have had on student and
teacher behaviors. Increased support existed within the school setting and the target
student each had an adult within the school as a mentor within an intervention package.
Students were also receiving social skill instruction as part of the larger project. All of
these interventions may have directly affected increased academic performance or student

78
classroom behaviors. Implementing this intervention in the future without the potential
additive effect of the larger study would provide information on the specific effectiveness
of these interventions.
Both of the teachers who participated within this study were first year teachers.
The individual teacher’s willingness to implement and adapt instruction may be a direct
reflection of lack of established teaching style. In addition, low baseline rates may also
be influenced by the teacher’s unfamiliarity with teaching. Impact and the improvement
of student behavior may also have been influenced by other environmental components
of instruction that were extraneous to the researched variables and interventions. Also,
teachers who consented to participate were only within one core subject area. Therefore,
generalization to secondary settings as a whole is unclear. Future research should address
replication to other academic subject areas (i.e. English, History, and Science), settings,
gender, and grades.
Classroom performance measures were also used based on the recording of
assignments within the teacher’s gradebook. Although, this is a permanent product that
is commonly used to analyze a student’s performance within education, there were many
weeks where no performance measure within the specific category was recorded.
Therefore, there was a small sample of classroom performance pieces and the overall
performance increases must be interpreted with hesitation. Also, the nature of the design
chosen does not allow for determination about the specific intervention, or combination
of interventions that lead to the overall improved classroom performance outcome.
Implementing each strategy in isolation for an extended period of time would allow for
analysis of the direct impact of each intervention on classroom performance.
79
Implications for Practice
All OTR intervention methods demonstrated positive impact on student’s
academic and social behavior and teacher rates of effective practice. A systematic
approach for teaching secondary general education teachers, who are the primary
instructors of most students with EBD, is needed to promote awareness and
implementation of these methods. Although research is still minimal within the
secondary level, results from past research and the present study are encouraging and
combined with the work to date at the elementary level indicate OTR as a promising
practice in high school. Incorporating these OTR methods, in particular response cards,
within high school settings may lead to more positive outcomes for students and to help
break some of negative interactions that currently take place between high-risk students
and teachers.
Creating systems and supports within schools and districts where these strategies
can be incorporated within existing curriculum is crucial. Schools and teachers need to
have access to the materials to implement each of these interventions. Also, to help
address the cost of implementation of these interventions, creating materials, which could
be shared across multiple teachers who teach similar courses, is suggested. Schools that
create these established systems will create a natural environment that encourages use of
promising practices and has the potential to create collaborative teams for implementing
these practices.
While not explored in the present study, the use of performance feedback directed
to the students based on daily observations may also have helped to increase student
engagement and decrease disruptions (Simonson, Myers, & DeLuca, 2010). Students
80
were unaware during this research study about what variables were being measured and
what levels they had achieved beyond standard feedback given by the teacher (e.g.,
grades). Teacher performance feedback related to student behavior may also impact
outcomes implementation of the consequent-contingency of praise and increasing the rate
of OTR (Partin et. al., 2010).
Implications for Research
The positive outcomes for each of the studied OTR intervention strategies warrant
further investigation individually, collectively, and comparatively. Comparison of these
interventions across more student-teacher dyads and across classrooms will help to
provide a larger evidence-base on the impact of these interventions on student and
teacher behaviors. All of the student-dyads which elected to participate contained
students without an IDEA diagnosis of EBD, but displayed high levels of clinically
significant problem behavior. Also, all three students had a medical diagnosis of
Attention Deficit Hyperactive Disorder (ADHD). This homogeneity of the sample may
indicate that these intervention methods are more acceptable for teachers that have this
population of students. Research related to OTR and ADHD is significantly limited and
has been only minimally investigated using traditional methods of choral response
(Skinner & Shapiro, 1989) or within a broad category of mild disabilities.
Further areas for exploration are the direct effect of these strategies on teacher
rates, the effect on long-term classroom performance, and additional study of the range of
consequent-contingencies used. Knowledge of the most beneficial rate of
implementation is another critical component that has yet to be definitively determined
81
for secondary settings, and is crucial to developing knowledge for both researchers and
practitioners of the acceptable dosage of this intervention.
Additionally, a more consistent measure of classroom performance would allow
for there to be a direct cost benefit analysis of the impact that these interventions could
make across a student’s secondary educational career. Since passing grades within credit
courses are of primary importance in secondary schools (Wagner, 1996), additional
research on OTR and other related strategies to promote AET and academic outcomes is
needed.
This study demonstrated positive outcomes in increasing student and teacher
engagement. However, teachers were not required to maintain the best treatment phase
after a stable rate was established. Similar to previous research, both teachers did not
seem to be reinforced by the increased rates of student engagement and seemed more
comfortable with a traditional lecture instruction (Armendariz & Umbreit, 1999). It is
unknown if the teachers continued to implement any of the OTR strategies after the
conclusion of the study. Future research should investigate the maintenance of
incorporating intervention strategies for the remainder of the school year, within other
class periods, or during the next school year.
Finally, since this study only addressed one core subject area it is important for
investigation across multiple core subject areas to determine if similar results exist. Each
academic area within a secondary school serves as a separate instructional context
(Grossman & Stodolsky, 1995). Knowledge of the differences within the instructional
areas could serve to define this intervention as a universal effective practice within
secondary environments.
82
Conclusion
The purpose of this study was to investigate the effects of three opportunities to
respond (OTR) intervention strategies on student and teacher behaviors. In addition,
feasibility and acceptability was studied, the influence of student academic achievement,
and the specific use of the consequent-contingency component of OTR. The present
study contributes to the evidence-base to support the use of OTR interventions for
students with emotional and behavioral disorders. In particular, the use of response cards
lead to the highest rates of AET. Although the results are encouraging, additional
replication of the present study as well as expansion within high school settings is clearly
needed.

83
VITA
Reesha Adamson received a Bachelor of Arts degree and Master of Arts and
Education degree from Truman State University in Kirksville, Missouri. Reesha started
her career as a special education teacher for students with Emotional and Behavioral
Disorders at the elementary level. Additional experience included instructing within a
Juvenile Justice Facility and serving as a school district’s Behavior Support Specialist.
Her current areas of interest for students with Emotional and Behavioral Disorders
include implementing evidence-based practices within secondary settings and the use of
incorporating behavior management strategies within general education environments.
84
REFERENCES
Alberto, P. A., & Troutman, A. C. (2013). Applied behavior analysis for teachers (9th
ed.). Upper Saddle River, NJ: Pearson, Merrill, Prentice-Hall.
Armendariz, F. & Umbreit, J. (1999). Using active responding to reduce disruptive
behavior in a general education classroom. Journal of Positive Behavior
Interventions, 1(3), 152-158.
Bell, K., Young, K. R., Blair, M., & Nelson, R. (1990). Facilitating mainstreaming of
students with behavioral disorders using classwide peer tutoring. School
Psychology Review, 19(4), 564-574.
Blackwell, A. J. & McLaughlin, T. F. (2005). Using guided notes, choral responding, and
response cards to increase student performance. The International Journal of
Special Education, 20(2), 1-5.
Bowman-Perrott, L. (2009). Class-wide peer tutoring: An effective strategy for students
with emotional and behavioral disorders. Intervention in School and Clinic, 44,
259-267.
Bradley, R., Doolittle, J., et al. (2008). Building on the data and adding to the discussion:
The experiences and outcomes of students with emotional disturbance."Journal of
Behavioral Education, 17(1), 4-23.
Bradley, R., Henderson, K., & Monfore, D. A. (2004). A national perspective on children
with emotional disorders. Behavioral Disorders, 29, 211-223.
Burns, M. K. (2007). Comparison of opportunities to respond within a drill model when
rehearsing sight words with a child with mental retardation. School Psychology
Quarterly, 22(2), 250-263.
Burns, M. K.& Boice, C. H. (2009). Comparison of the relationship between words
retained and intelligence for three instructional strategies among students with
below-average IQ. School Psychology Review, 38(2), 284-292.
Carnine, D. W. (1976). Effects of two teacher-presentation rates on off-task behavior,
answering correctly, and participation. Journal of Applied Behavior Analysis,
9(2), 199-206.
Cassidy, E., James, A., Wiggs, L. (2001). The prevalence of psychiatric disorder in
children attending a school for pupils with emotional and behavioural difficulties.
British Journal of Special Education, 28(4), 168-173.
Cautilli, J. D. & Dziewolska, H. (2006). Brief report: The use of opportunity to respond
and practice to increase efficiency of the stepping reflex in a five-month-old
infant. The Behavior Analyst Today, 7(4), 538-547.
85
Cavanuagh, R. A., Heward, W. & Donelson, F. (1996). Effects of response cards during
lesson closure on the academic performance of secondary students in an earth
science course. Journal of Applied Behavior Analysis, 29(3), 403-406.
Center for Adolescent Research in Schools. (2012, August). Center for adolescent
research in schools: M.O.O.S.E.S. data collector coding manual and training
procedures. Bethleham, PA: Lehigh University.
Center for Adolescent Research in Schools. (2012, August).Classroom Procedures
Manual. Bethleham, PA: Lehigh University.
Christle, C. A. & Schuster, J. W. (2003). The effects of using response cards on student
participation, academic achievement, and on-task behavior during whole-class,
math instruction. Journal of Behavioral Education, 12(3), 147-165.
Clarfield, J. & Stoner, G. (2005). The effects of computerized reading instruction on the
academic performance of students identified with ADHD. School Psychology
Review, 34(2), 246-254.
Conroy, M. A., Sutherland, K. S., Snyder, A. L., & Marsh, S. (2006). Classwide
intervention: Effective instruction makes a difference. Teaching Exceptional
Children, 40(6), 24-30.
The Council for Exceptional Children. (1987). Academy for effective instruction:
Working with mildly handicapped students. Reston, VA: Author.
Coutinho, M. J. (1986). Reading achievement of students identified as behaviorally
disordered at the secondary level. Behavioral Disorders, 11(3), 200-207.
Dietz, S. & Montague, M. (2006). Attention deficit hyperactivity disorder co-morbid with
emotional and behavioral disorders and learning disabilities in adolescents.
Exceptionality, 14(1), 19-33.
Deno, S.L. (1998). Academic progress as incompatible behavior: Curriculum-based
measurement (CBM) as intervention. Beyond Behavior, 9(3), 12-17.
Gage, N. A., Adamson, R. M., Mitchell, B. S., Lierheimer, K., O’Connor, K. V., Bailey,
N., . . . Jones, S. (2010). Promise and possibility in special education services for
students with emotional or behavioral disorders: Peacock hill revisited.
Behavioral Disorders, 35(4), 294-307.
Gast, D. L. (2010). Single subject research methodology in behavioral sciences. New
York, New York: Routledge.
Godfrey S. A., Grisham-Brown, J. Schuster, J. W., & Hemmeter, M. L. (2003). The
effects of three techniques on student participation with preschool children with
attending problems. Education and Treatment of Children, 26(3), 255-272.
Good, T. L. (1970). Which pupils do teachers call on? The Elementary School Journal,
70(4), 190-198.
86
Greenwood, C. R., Terry, B., Marquis, J., & Walker, D. (1994). Confirming a
performance-based instructional model. School Psychology Review, 23(4), 652-
668.
Grossman, P.L. & Stodolsky, S. S. (1995). Context as context: The roles of school
subjects in secondary school teaching. Educational Researcher, 24(8), 5-11, 23.
Gunter, P. L., & Denny, R. K. (1998). Trends and issues in research regarding academic
instruction of students with emotional and behavioral disorders. Behavioral
Disorders, 24(1), 44-50.
Haydon, T., Borders, C., Embury, D., & Clarke, L. (2009). Using effective instructional
delivery as a classroom management tool. Beyond Behavior, 18(2), 12-17.
Haydon, T., Conroy, M. A., Scott, T. M., Sindelar, P.T., Barber, B. R., & Orlando, A.
(2010). A comparison of three types of opportunities to respond on student
academic and social behaviors. Journal of Emotional and Behavioral
Disorders,18(1), 27-40.
Haydon, T., Mancil, G. R., & Loan, C. V. (2009). Using opportunities to respond in a
general education classroom: A case study. Education and Treatment of Children,
32(2), 267-278.
Hayling, C. C., Cook, C., Gresham, F. M., State, T., & Kern, L. (2008). An analysis of
the status of stability of the behaviors of students with emotional and behavioral
difficulties. Journal of Behavioral Education, 17, 24-42.
Hinshaw, S. P. (1992). Externalizing behavior problems and academic underachievement
in childhood and adolescence: Causal relationships and underlying mechanisms.
Psychological Bulletin, 111(1), 127-155.
Hirn, R., & Scott,T. M. (2012). Academic and Behavior Response to Intervention Project.
University of Louisville: Louisville, KY.
Individuals with Disabilities Education Act Amendments of 1997, 20 U.S.C. § 1400 (26).
Kauffman, J. M., Mock, D. R., & Simpson, R. L. (2007), Problems related to
underservice of students with emotional or behavioral disorders. Behavioral
Disorders, 33(1), 43-57.
Lambert, M. C., Cartledge, G., Heward, W. L., & Lo, Y. (2006). Effects of response
cards on disruptive behavior and academic responding during math lessons by
fourth-grade urban students. Journal of Positive Behavior Interventions, 8(2), 88-
99.
Lane, K. L., Wehby, J., & Barton-Arwood, S. M. (2005). Students with and at risk for
emotional and behavioral disorders: Meeting their social and academic needs.
Preventing School Failure, 49(2), 6-9.
87
Lane, K. L. Carter, E. W., Pierson, M. R., & Glaeser, B. C. (2006). Academic, social,
and behavioral characteristics of high school students with emotional disturbances
or learning disabilities. Journal of Emotional and Behavioral Disorders, 14(2),
108-117.
Lazarus, B. D. (1993). Guided notes: Effects with secondary and post secondary students
with mild disabilities. Education and Treatment of Children, 16(3), online.
Mastropieri, M. A., Scruggs, T. E., Spencer, V., & Fontant, J. (2003). Promoting success
in high school world history: Peer tutoring versus guided notes. Learning
Disabilities Research and Practice, 18(1), 52-65.
Merrell, K. W., & Walker, H. M. (2004). Deconstructing a definition: Social
maladjustment versus emotional disturbance and moving the EBD field forward.
Psychology in the Schools, 41(8), 899-910.
Partin, T. C. M., Robertson, R. E., Maggin, D. M., Oliver, R. M., & Wehby, J. H. (2010).
Using teacher praise and opportunities to respond to promote appropriate student
behavior. Preventing School Failure, 54(3), 172-176.
Peacock Hill Working Group (1991). Problems and promises in special education and
related services for children and youth with emotional and behavioral disorders.
Behavioral Disorders, 16(1), 299-313.
Randolph, J. J. (2007). Meta-analysis of the research on response cards: Effects on test
achievement, quiz achievement, participation, and off-task behavior. Journal of
Positive Behavior Interventions,9(2), 113-128.
Reid, R., Gonzalez, J. E., Nordness, P.D., Trout, A., & Epstein, M. H. (2004). A meta-
analysis of the academic status of students with Emotional/Behavioral
Disturbance. The Journal of Special Education, 38(3), 130-143.
Reschly, A. L. & Christenson, S. L. (2006). Prediction of dropout among students with
mild disabilities: A case for the inclusion of student engagement variables.
Remedial and Special Education, 27(5), 276-292.
Reynolds, C. R. & Kamphaus, R. W. (2004). Behavior assessment system for children—
Second edition. Circle Pines, MN: AGS.
Ryan, J.B., Reid, R., & Epstein, M. H. (2004). A review of peer-mediated intervention
studies on academic achievement for students with emotional and behavioral
disorders. Remedial and Special Education, 25, 330-341.
Simonson, B., Fairbanks, S., Briesch, A., Myers, D., & Sugai, G. (2008). Evidence-based
practices in classroom management: Considerations for research to practice.
Education and Treatment of Children, 31(3), 351-380.
88
Simonson, B., Myers, D., & DeLuca, C. (2010). Teaching teachers to use prompts,
opportunities to respond, and specific praise. Teacher Education and Special
Education, 33(4), 300-318.
Simpson R. L., Peterson, R. L., & Smith, C. R. (2011). Critical educational program
components for students with emotional and behavioral disorders: Science,
policy, and practice. Remedial and Special Education, 32(3), 230-242.
Skinner, C. H. (2002). An empirical analysis of interspersal research: Evidence,
implications and application of the discrete task completion hypothesis. Journal
of School Psychology, 40, 347-368.
Skinner, C. H., Fletcher, P. A., & Henington, C. (1996). Increasing learning rates by
increasing student responses rates: A summary of research. School Psychology
Quarterly, 11, 313-325.
Skinner, C. H., Pappas, D. N., & Davis, K. A. (2005). Enhancing academic engagement:
Providing opportunities for responding and influencing students to choose to
respond. Psychology in the Schools, 42(4), 389-403.
Skinner, C. H. & Shapiro, E. S. (1989). A comparison of taped-words and drill
interventions of reading fluency in adolescents with behavior disorders. Education
and Treatment of Children, 12(2), 123-133.
Spencer, V. G., Scruggs, T. E., & Mastropieri, M. A. (2003). Content area learning in
middle school social studies classrooms and students with emotional or behavioral
disorders: A comparison of strategies. Behavioral Disorders, 28(2), 77-93.
Sprick, R. & Borgmeier, C. (2010) Chapter 17: Behavior prevention and management in
three tiers in secondary schools. In M. R. Shinn & H. M. Walker Eds. (2010).
Interventions for achievement and behavior problems in a three-tier model
including RTI (pp.435-468). Bethesda, Maryland: National Association of School
Psychologists Publications.
Stichter, J. P., Lewis, T. J., Whittaker, T. A., Richter, M., Johnson, N. W., & Trussell, R.
P. (2009). Assessing teacher use of opportunities to respond and effective
classroom management strategies: Comparisons among high- and low-risk
elementary schools. Journal of Positive Behavior Interventions, 11(2), 68-81.
Sutherland, K. S., Alder, N., & Gunter, P. L. (2003). The effect of varying rates of
opportunities to respond to academic requests on the classroom behavior of
students with EBD. Journal of Emotional and Behavioral Disorders, 11(4), 239-
248.
Sutherland, K. S., Lewis-Palmer, T., Stichter, J., & Morgan, P. L. (2008). Examining the
influence of teacher behavior and classroom context on the behavioral and
academic outcomes for students with emotional or behavioral disorders. The
Journal of Special Education, 41(4), 223-233.
89
Sutherland, K. S., & Oswald, D. P. (2005). The relationship between teacher and student
behavior in classrooms for students with emotional and behavioral disorders:
Transactional process. Journal of Child and Family Studies, 14(1), 1-14.
Sutherland, K. S. & Singh, N. N. (2004). Learned helplessness and students with
emotional or behavioral disorders: Deprivation in the classroom. Behavioral
Disorders, 29(2), 169-181.
Sutherland, K. S., & Wehby, J. H. (2001). Exploring the relationship between increased
opportunities to respond to academic requests and the academic and behavioral
outcomes of students with EBD: A review. Remedial and Special Education,
22(2), 113-121.
Sutherland, K. S., Wehby, J. H., & Yoder, P. J. (2002). Examination of the relationship
between teacher praise and opportunities for students with EBD to respond to
academic requests. Journal of Emotional and Behavioral Disorders, 10(1), 5-13.
Szadokierski, I. & Burns, M. K. (2008). Analogue evaluation of the effects of
opportunities to respond and rations of known items within drill rehearsal of
Esperanto words. Journal of School Psychology, 46, 593-609.
Tapp, J., Wehby, J., & Ellis, D. (1995). A multiple option observation system for
experimental studies: MOOSES. Behavioral Research Methods, Instruments, and
Computers, 27, 25-31.
Tawney, J. W. & Gast, D. L. (1984). Single-subject research in special education.
Columbus, OH: Merrill.
Trout, A. L., Nordness, P. D., Pierce, C. D., & Epstein, M. H. (2003). Research on the
academic status of children with emotional and behavioral disorders: A review of
the literature from 1961 to 2000. Journal of Emotional and Behavioral Disorders,
11(4), 198-210.
U. S. Department of Education, Office of Special Education and Rehabilitative Services,
(2008). 30th
Annual report to congress on the implementation of the individuals
with disabilities education act, 2008. Retrieved from
http://www2.ed.gov/about/reports/annual/osep/2008/parts-b-c/30th-idea-arc.pdf.
Vannest, K. J., Temple-Harvey, K. K., & Mason, B. A. (2009). Adequate yearly progress
for students with emotional and behavioral disorders through research-based
practices. Preventing School Failure, 53(2), 73-83.
Wheby, J. H., Lane, K. L., & Falk, K. B. (2003). Academic instruction for students with
emotional and behavioral disorders. Journal of Emotional and Behavioral
Disorders, 11(4), 194-197.
Vannest, K. J., Temple-Harvey, K. K., & Mason, B.A. (2009). Adequate yearly progress
for students with emotional and behavioral disorders through research-based
practices, Preventing School Failure, 53(2), 148-163.
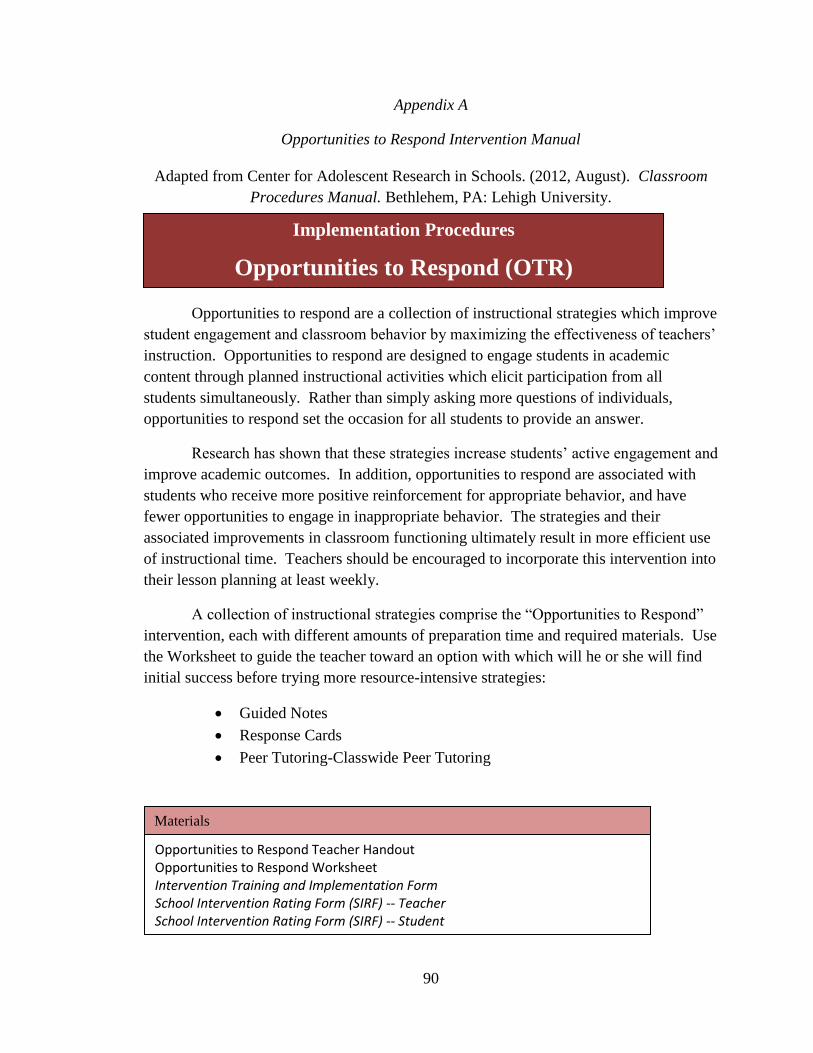
90
Appendix A
Opportunities to Respond Intervention Manual
Adapted from Center for Adolescent Research in Schools. (2012, August). Classroom
Procedures Manual. Bethlehem, PA: Lehigh University.
Opportunities to respond are a collection of instructional strategies which improve
student engagement and classroom behavior by maximizing the effectiveness of teachers’
instruction. Opportunities to respond are designed to engage students in academic
content through planned instructional activities which elicit participation from all
students simultaneously. Rather than simply asking more questions of individuals,
opportunities to respond set the occasion for all students to provide an answer.
Research has shown that these strategies increase students’ active engagement and
improve academic outcomes. In addition, opportunities to respond are associated with
students who receive more positive reinforcement for appropriate behavior, and have
fewer opportunities to engage in inappropriate behavior. The strategies and their
associated improvements in classroom functioning ultimately result in more efficient use
of instructional time. Teachers should be encouraged to incorporate this intervention into
their lesson planning at least weekly.
A collection of instructional strategies comprise the “Opportunities to Respond”
intervention, each with different amounts of preparation time and required materials. Use
the Worksheet to guide the teacher toward an option with which will he or she will find
initial success before trying more resource-intensive strategies:
Guided Notes
Response Cards
Peer Tutoring-Classwide Peer Tutoring
Implementation Procedures
Opportunities to Respond (OTR)
Materials
Opportunities to Respond Teacher Handout Opportunities to Respond Worksheet Intervention Training and Implementation Form School Intervention Rating Form (SIRF) -- Teacher School Intervention Rating Form (SIRF) -- Student
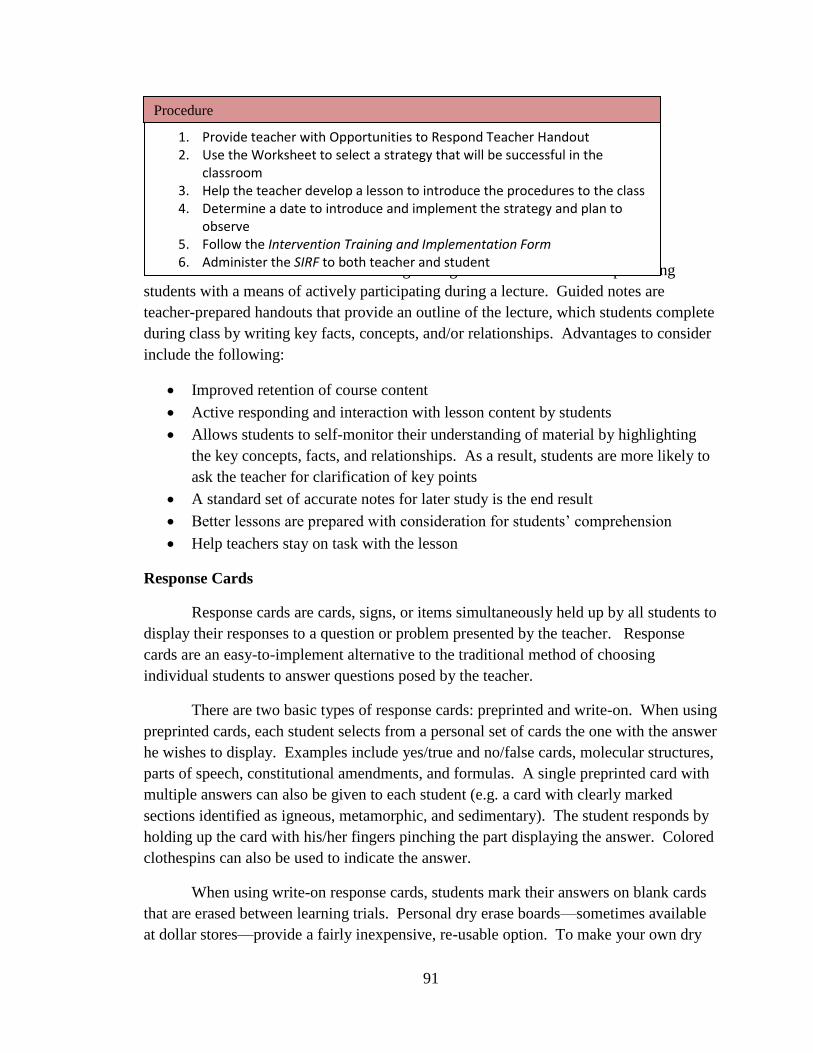
91
Opportunities to Respond: Instructional Strategies
Guided Notes
Guided notes are a method for organizing curriculum content and providing
students with a means of actively participating during a lecture. Guided notes are
teacher-prepared handouts that provide an outline of the lecture, which students complete
during class by writing key facts, concepts, and/or relationships. Advantages to consider
include the following:
Improved retention of course content
Active responding and interaction with lesson content by students
Allows students to self-monitor their understanding of material by highlighting
the key concepts, facts, and relationships. As a result, students are more likely to
ask the teacher for clarification of key points
A standard set of accurate notes for later study is the end result
Better lessons are prepared with consideration for students’ comprehension
Help teachers stay on task with the lesson
Response Cards
Response cards are cards, signs, or items simultaneously held up by all students to
display their responses to a question or problem presented by the teacher. Response
cards are an easy-to-implement alternative to the traditional method of choosing
individual students to answer questions posed by the teacher.
There are two basic types of response cards: preprinted and write-on. When using
preprinted cards, each student selects from a personal set of cards the one with the answer
he wishes to display. Examples include yes/true and no/false cards, molecular structures,
parts of speech, constitutional amendments, and formulas. A single preprinted card with
multiple answers can also be given to each student (e.g. a card with clearly marked
sections identified as igneous, metamorphic, and sedimentary). The student responds by
holding up the card with his/her fingers pinching the part displaying the answer. Colored
clothespins can also be used to indicate the answer.
When using write-on response cards, students mark their answers on blank cards
that are erased between learning trials. Personal dry erase boards—sometimes available
at dollar stores—provide a fairly inexpensive, re-usable option. To make your own dry
Procedure
1. Provide teacher with Opportunities to Respond Teacher Handout 2. Use the Worksheet to select a strategy that will be successful in the
classroom 3. Help the teacher develop a lesson to introduce the procedures to the class 4. Determine a date to introduce and implement the strategy and plan to
observe 5. Follow the Intervention Training and Implementation Form 6. Administer the SIRF to both teacher and student
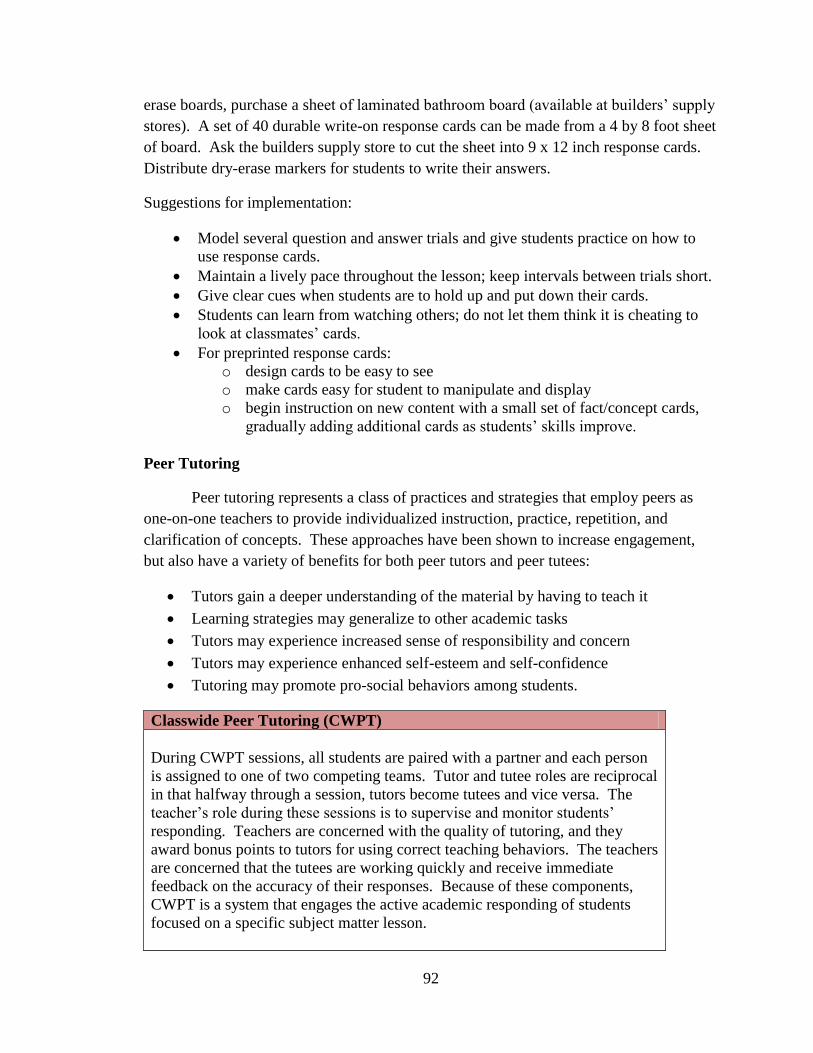
92
erase boards, purchase a sheet of laminated bathroom board (available at builders’ supply
stores). A set of 40 durable write-on response cards can be made from a 4 by 8 foot sheet
of board. Ask the builders supply store to cut the sheet into 9 x 12 inch response cards.
Distribute dry-erase markers for students to write their answers.
Suggestions for implementation:
Model several question and answer trials and give students practice on how to
use response cards.
Maintain a lively pace throughout the lesson; keep intervals between trials short.
Give clear cues when students are to hold up and put down their cards.
Students can learn from watching others; do not let them think it is cheating to
look at classmates’ cards.
For preprinted response cards:
o design cards to be easy to see
o make cards easy for student to manipulate and display
o begin instruction on new content with a small set of fact/concept cards,
gradually adding additional cards as students’ skills improve.
Peer Tutoring
Peer tutoring represents a class of practices and strategies that employ peers as
one-on-one teachers to provide individualized instruction, practice, repetition, and
clarification of concepts. These approaches have been shown to increase engagement,
but also have a variety of benefits for both peer tutors and peer tutees:
Tutors gain a deeper understanding of the material by having to teach it
Learning strategies may generalize to other academic tasks
Tutors may experience increased sense of responsibility and concern
Tutors may experience enhanced self-esteem and self-confidence
Tutoring may promote pro-social behaviors among students.
Classwide Peer Tutoring (CWPT)
During CWPT sessions, all students are paired with a partner and each person
is assigned to one of two competing teams. Tutor and tutee roles are reciprocal
in that halfway through a session, tutors become tutees and vice versa. The
teacher’s role during these sessions is to supervise and monitor students’
responding. Teachers are concerned with the quality of tutoring, and they
award bonus points to tutors for using correct teaching behaviors. The teachers
are concerned that the tutees are working quickly and receive immediate
feedback on the accuracy of their responses. Because of these components,
CWPT is a system that engages the active academic responding of students
focused on a specific subject matter lesson.
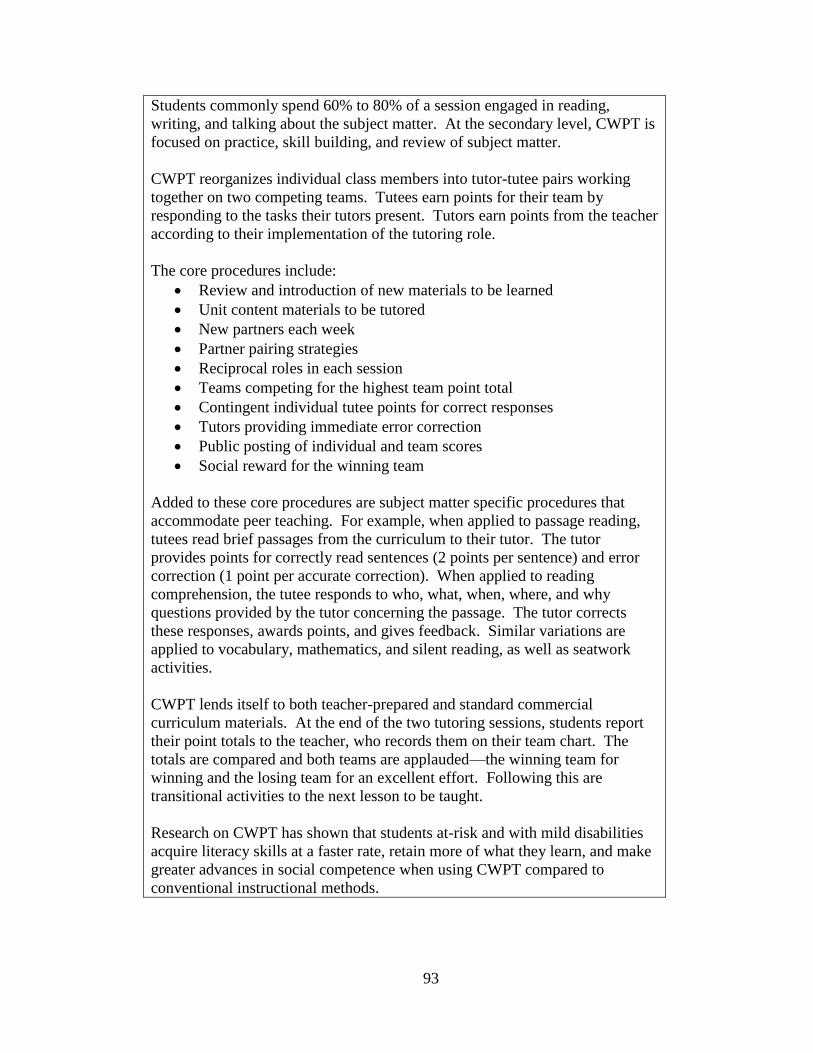
93
Students commonly spend 60% to 80% of a session engaged in reading,
writing, and talking about the subject matter. At the secondary level, CWPT is
focused on practice, skill building, and review of subject matter.
CWPT reorganizes individual class members into tutor-tutee pairs working
together on two competing teams. Tutees earn points for their team by
responding to the tasks their tutors present. Tutors earn points from the teacher
according to their implementation of the tutoring role.
The core procedures include:
Review and introduction of new materials to be learned
Unit content materials to be tutored
New partners each week
Partner pairing strategies
Reciprocal roles in each session
Teams competing for the highest team point total
Contingent individual tutee points for correct responses
Tutors providing immediate error correction
Public posting of individual and team scores
Social reward for the winning team
Added to these core procedures are subject matter specific procedures that
accommodate peer teaching. For example, when applied to passage reading,
tutees read brief passages from the curriculum to their tutor. The tutor
provides points for correctly read sentences (2 points per sentence) and error
correction (1 point per accurate correction). When applied to reading
comprehension, the tutee responds to who, what, when, where, and why
questions provided by the tutor concerning the passage. The tutor corrects
these responses, awards points, and gives feedback. Similar variations are
applied to vocabulary, mathematics, and silent reading, as well as seatwork
activities.
CWPT lends itself to both teacher-prepared and standard commercial
curriculum materials. At the end of the two tutoring sessions, students report
their point totals to the teacher, who records them on their team chart. The
totals are compared and both teams are applauded—the winning team for
winning and the losing team for an excellent effort. Following this are
transitional activities to the next lesson to be taught.
Research on CWPT has shown that students at-risk and with mild disabilities
acquire literacy skills at a faster rate, retain more of what they learn, and make
greater advances in social competence when using CWPT compared to
conventional instructional methods.
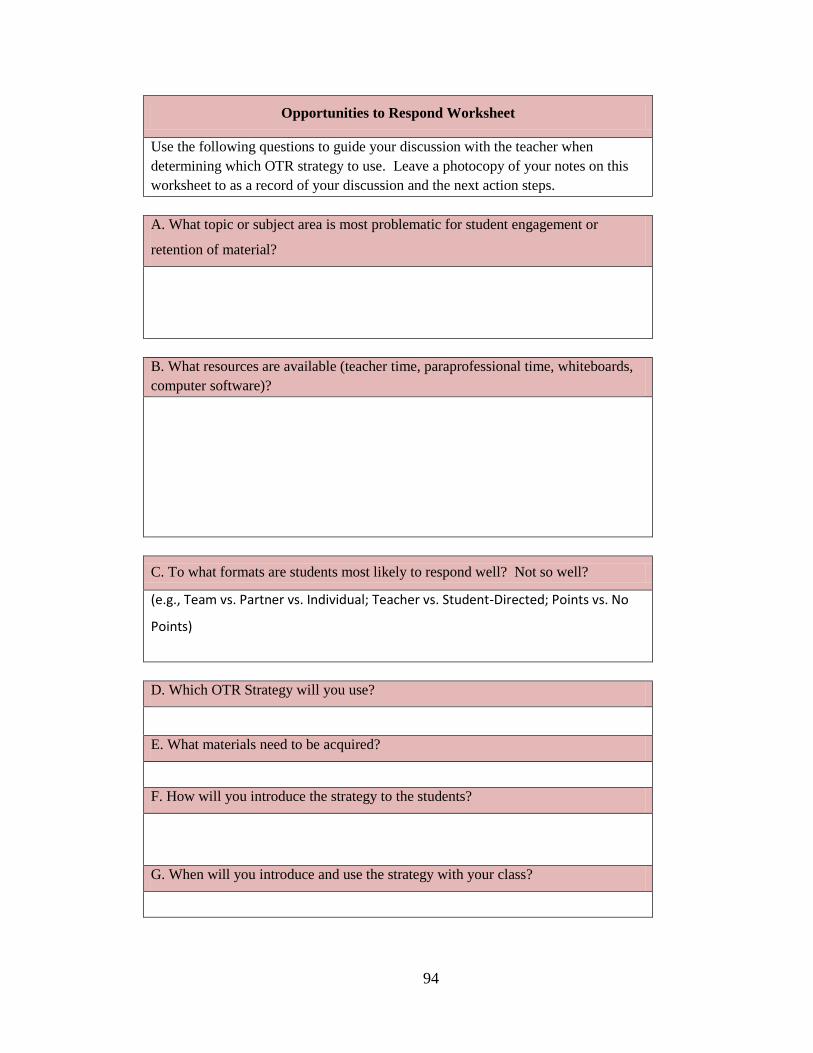
94
Opportunities to Respond Worksheet
Use the following questions to guide your discussion with the teacher when
determining which OTR strategy to use. Leave a photocopy of your notes on this
worksheet to as a record of your discussion and the next action steps.
A. What topic or subject area is most problematic for student engagement or
retention of material?
B. What resources are available (teacher time, paraprofessional time, whiteboards,
computer software)?
C. To what formats are students most likely to respond well? Not so well?
(e.g., Team vs. Partner vs. Individual; Teacher vs. Student-Directed; Points vs. No
Points)
D. Which OTR Strategy will you use?
E. What materials need to be acquired?
F. How will you introduce the strategy to the students?
G. When will you introduce and use the strategy with your class?
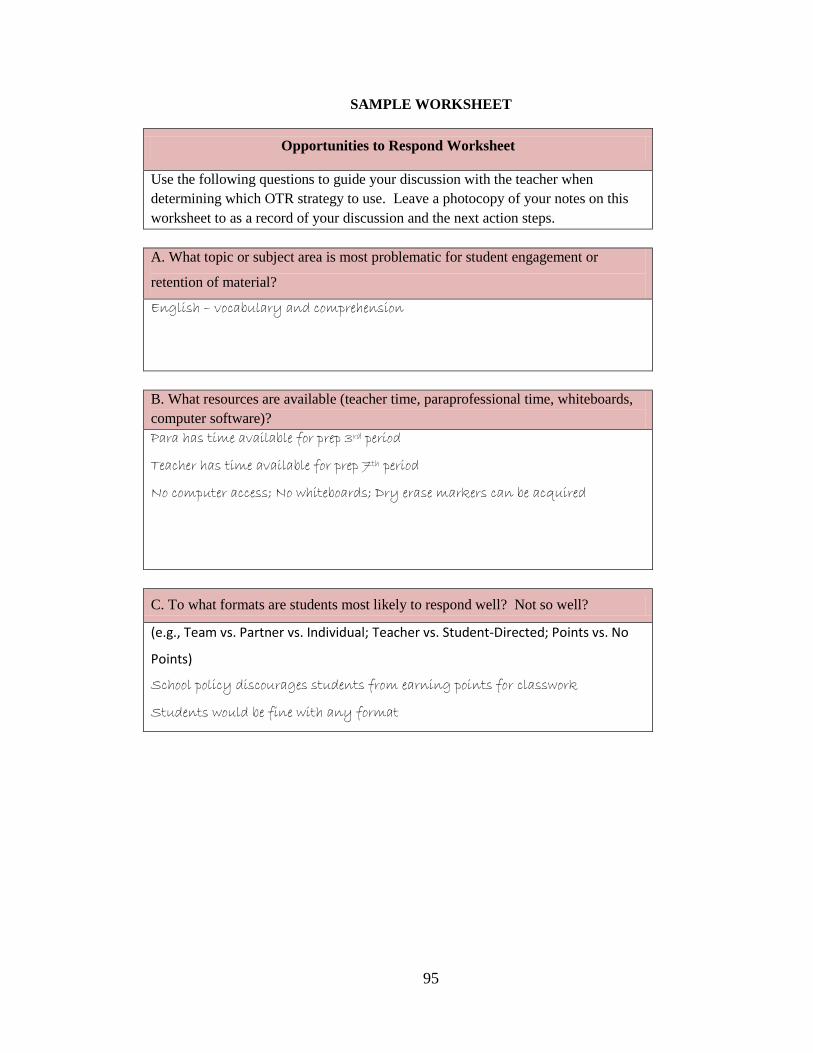
95
SAMPLE WORKSHEET
Opportunities to Respond Worksheet
Use the following questions to guide your discussion with the teacher when
determining which OTR strategy to use. Leave a photocopy of your notes on this
worksheet to as a record of your discussion and the next action steps.
A. What topic or subject area is most problematic for student engagement or
retention of material?
English – vocabulary and comprehension
B. What resources are available (teacher time, paraprofessional time, whiteboards,
computer software)?
Para has time available for prep 3rd period
Teacher has time available for prep 7th period
No computer access; No whiteboards; Dry erase markers can be acquired
C. To what formats are students most likely to respond well? Not so well?
(e.g., Team vs. Partner vs. Individual; Teacher vs. Student-Directed; Points vs. No
Points)
School policy discourages students from earning points for classwork
Students would be fine with any format
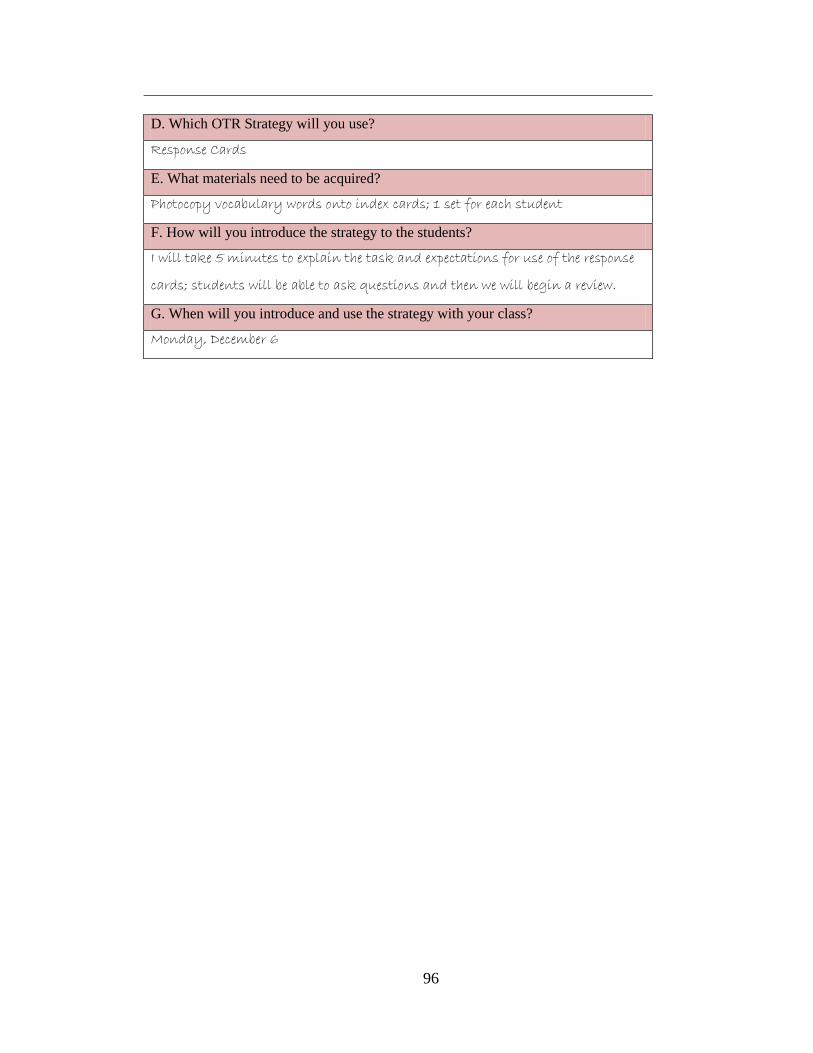
96
D. Which OTR Strategy will you use?
Response Cards
E. What materials need to be acquired?
Photocopy vocabulary words onto index cards; 1 set for each student
F. How will you introduce the strategy to the students?
I will take 5 minutes to explain the task and expectations for use of the response
cards; students will be able to ask questions and then we will begin a review.
G. When will you introduce and use the strategy with your class?
Monday, December 6
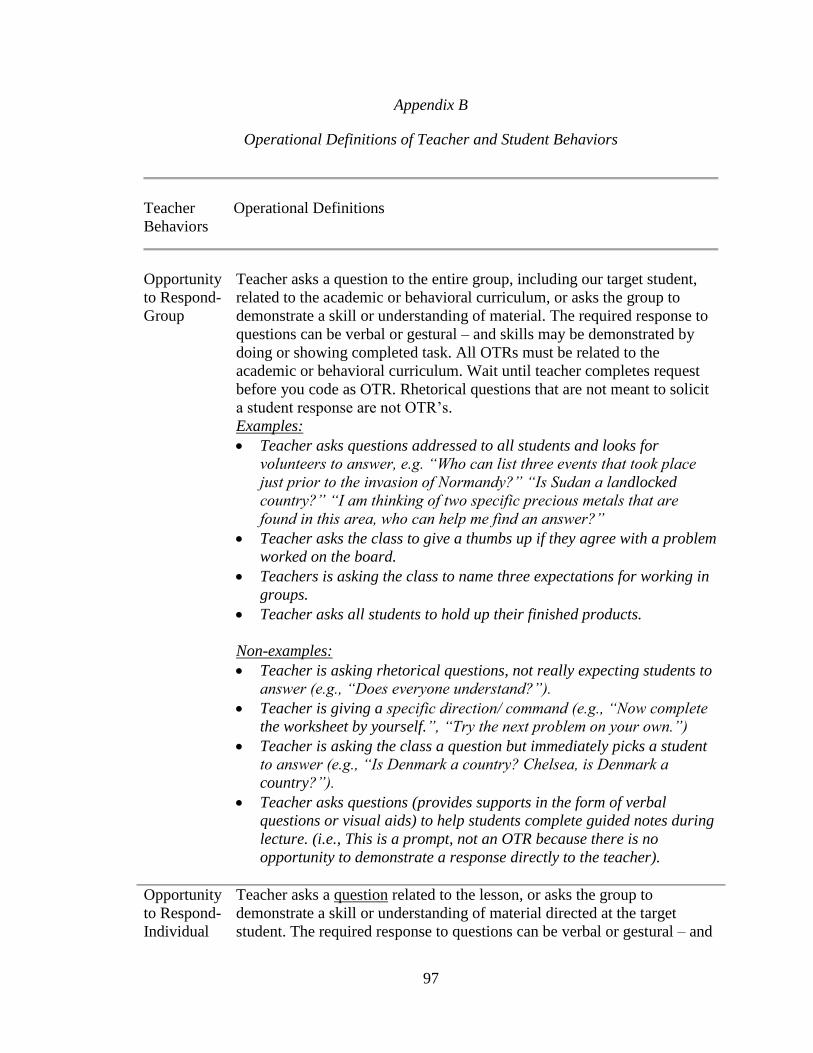
97
Appendix B
Operational Definitions of Teacher and Student Behaviors
Teacher
Behaviors
Operational Definitions
Opportunity
to Respond-
Group
Teacher asks a question to the entire group, including our target student,
related to the academic or behavioral curriculum, or asks the group to
demonstrate a skill or understanding of material. The required response to
questions can be verbal or gestural – and skills may be demonstrated by
doing or showing completed task. All OTRs must be related to the
academic or behavioral curriculum. Wait until teacher completes request
before you code as OTR. Rhetorical questions that are not meant to solicit
a student response are not OTR’s.
Examples:
Teacher asks questions addressed to all students and looks for
volunteers to answer, e.g. “Who can list three events that took place
just prior to the invasion of Normandy?” “Is Sudan a landlocked
country?” “I am thinking of two specific precious metals that are
found in this area, who can help me find an answer?”
Teacher asks the class to give a thumbs up if they agree with a problem
worked on the board.
Teachers is asking the class to name three expectations for working in
groups.
Teacher asks all students to hold up their finished products.
Non-examples:
Teacher is asking rhetorical questions, not really expecting students to
answer (e.g., “Does everyone understand?”).
Teacher is giving a specific direction/ command (e.g., “Now complete
the worksheet by yourself.”, “Try the next problem on your own.”)
Teacher is asking the class a question but immediately picks a student
to answer (e.g., “Is Denmark a country? Chelsea, is Denmark a
country?”).
Teacher asks questions (provides supports in the form of verbal
questions or visual aids) to help students complete guided notes during
lecture. (i.e., This is a prompt, not an OTR because there is no
opportunity to demonstrate a response directly to the teacher).
Opportunity
to Respond-
Individual
Teacher asks a question related to the lesson, or asks the group to
demonstrate a skill or understanding of material directed at the target
student. The required response to questions can be verbal or gestural – and
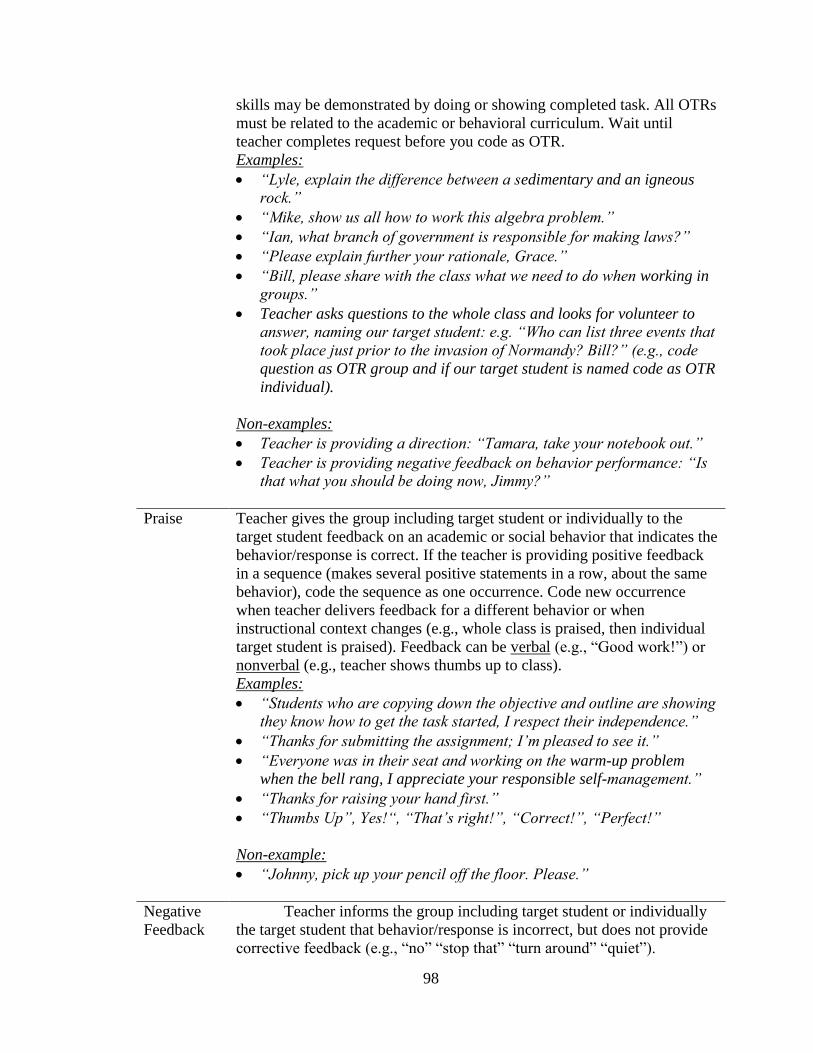
98
skills may be demonstrated by doing or showing completed task. All OTRs
must be related to the academic or behavioral curriculum. Wait until
teacher completes request before you code as OTR.
Examples:
“Lyle, explain the difference between a sedimentary and an igneous
rock.”
“Mike, show us all how to work this algebra problem.”
“Ian, what branch of government is responsible for making laws?”
“Please explain further your rationale, Grace.”
“Bill, please share with the class what we need to do when working in
groups.”
Teacher asks questions to the whole class and looks for volunteer to
answer, naming our target student: e.g. “Who can list three events that
took place just prior to the invasion of Normandy? Bill?” (e.g., code
question as OTR group and if our target student is named code as OTR
individual).
Non-examples:
Teacher is providing a direction: “Tamara, take your notebook out.”
Teacher is providing negative feedback on behavior performance: “Is
that what you should be doing now, Jimmy?”
Praise Teacher gives the group including target student or individually to the
target student feedback on an academic or social behavior that indicates the
behavior/response is correct. If the teacher is providing positive feedback
in a sequence (makes several positive statements in a row, about the same
behavior), code the sequence as one occurrence. Code new occurrence
when teacher delivers feedback for a different behavior or when
instructional context changes (e.g., whole class is praised, then individual
target student is praised). Feedback can be verbal (e.g., “Good work!”) or
nonverbal (e.g., teacher shows thumbs up to class).
Examples:
“Students who are copying down the objective and outline are showing
they know how to get the task started, I respect their independence.”
“Thanks for submitting the assignment; I’m pleased to see it.”
“Everyone was in their seat and working on the warm-up problem
when the bell rang, I appreciate your responsible self-management.”
“Thanks for raising your hand first.”
“Thumbs Up”, Yes!“, “That’s right!”, “Correct!”, “Perfect!”
Non-example:
“Johnny, pick up your pencil off the floor. Please.”
Negative
Feedback
Teacher informs the group including target student or individually
the target student that behavior/response is incorrect, but does not provide
corrective feedback (e.g., “no” “stop that” “turn around” “quiet”).
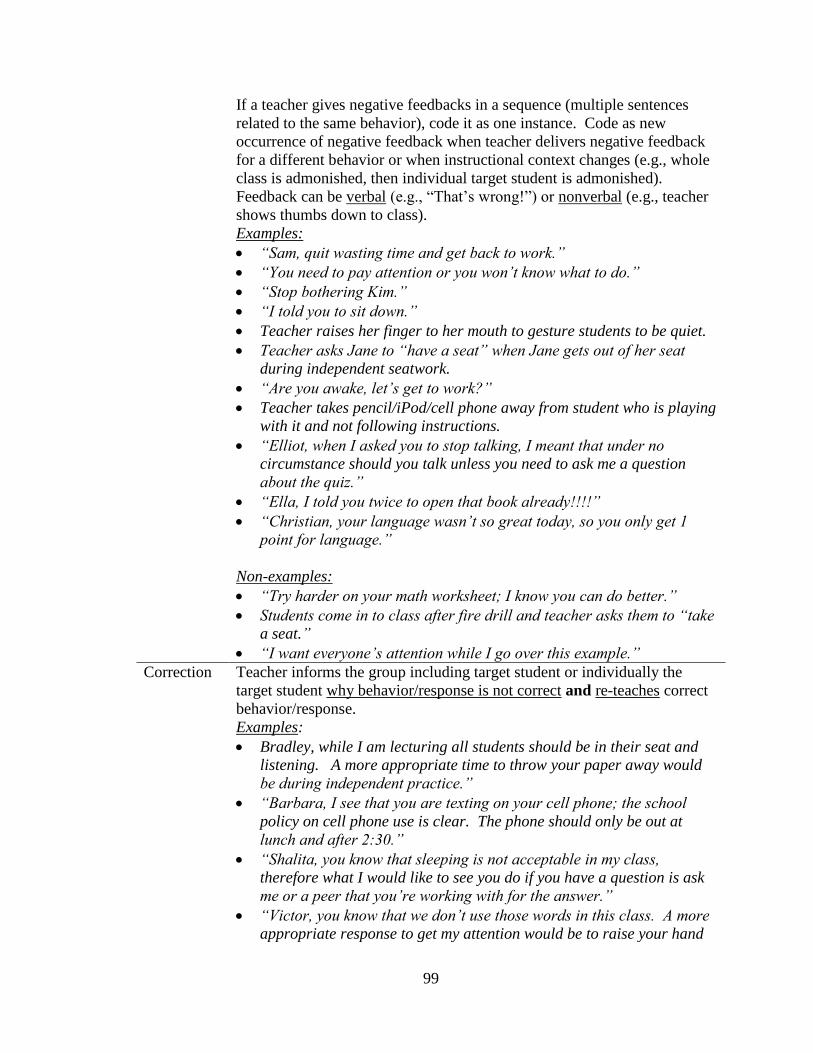
99
If a teacher gives negative feedbacks in a sequence (multiple sentences
related to the same behavior), code it as one instance. Code as new
occurrence of negative feedback when teacher delivers negative feedback
for a different behavior or when instructional context changes (e.g., whole
class is admonished, then individual target student is admonished).
Feedback can be verbal (e.g., “That’s wrong!”) or nonverbal (e.g., teacher
shows thumbs down to class).
Examples:
“Sam, quit wasting time and get back to work.”
“You need to pay attention or you won’t know what to do.”
“Stop bothering Kim.”
“I told you to sit down.”
Teacher raises her finger to her mouth to gesture students to be quiet.
Teacher asks Jane to “have a seat” when Jane gets out of her seat
during independent seatwork.
“Are you awake, let’s get to work?”
Teacher takes pencil/iPod/cell phone away from student who is playing
with it and not following instructions.
“Elliot, when I asked you to stop talking, I meant that under no
circumstance should you talk unless you need to ask me a question
about the quiz.”
“Ella, I told you twice to open that book already!!!!”
“Christian, your language wasn’t so great today, so you only get 1
point for language.”
Non-examples:
“Try harder on your math worksheet; I know you can do better.”
Students come in to class after fire drill and teacher asks them to “take
a seat.”
“I want everyone’s attention while I go over this example.”
Correction Teacher informs the group including target student or individually the
target student why behavior/response is not correct and re-teaches correct
behavior/response.
Examples:
Bradley, while I am lecturing all students should be in their seat and
listening. A more appropriate time to throw your paper away would
be during independent practice.”
“Barbara, I see that you are texting on your cell phone; the school
policy on cell phone use is clear. The phone should only be out at
lunch and after 2:30.”
“Shalita, you know that sleeping is not acceptable in my class,
therefore what I would like to see you do if you have a question is ask
me or a peer that you’re working with for the answer.”
“Victor, you know that we don’t use those words in this class. A more
appropriate response to get my attention would be to raise your hand
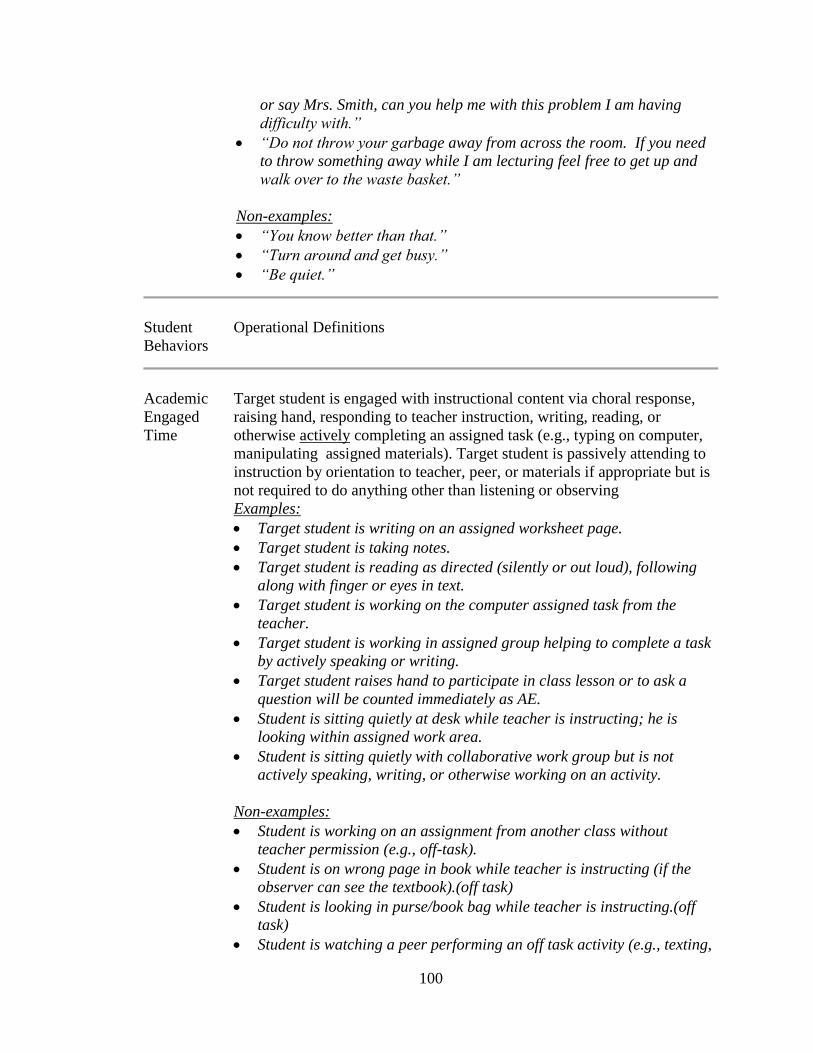
100
or say Mrs. Smith, can you help me with this problem I am having
difficulty with.”
“Do not throw your garbage away from across the room. If you need
to throw something away while I am lecturing feel free to get up and
walk over to the waste basket.”
Non-examples:
“You know better than that.”
“Turn around and get busy.”
“Be quiet.”
Student
Behaviors
Operational Definitions
Academic
Engaged
Time
Target student is engaged with instructional content via choral response,
raising hand, responding to teacher instruction, writing, reading, or
otherwise actively completing an assigned task (e.g., typing on computer,
manipulating assigned materials). Target student is passively attending to
instruction by orientation to teacher, peer, or materials if appropriate but is
not required to do anything other than listening or observing
Examples:
Target student is writing on an assigned worksheet page.
Target student is taking notes.
Target student is reading as directed (silently or out loud), following
along with finger or eyes in text.
Target student is working on the computer assigned task from the
teacher.
Target student is working in assigned group helping to complete a task
by actively speaking or writing.
Target student raises hand to participate in class lesson or to ask a
question will be counted immediately as AE.
Student is sitting quietly at desk while teacher is instructing; he is
looking within assigned work area.
Student is sitting quietly with collaborative work group but is not
actively speaking, writing, or otherwise working on an activity.
Non-examples:
Student is working on an assignment from another class without
teacher permission (e.g., off-task).
Student is on wrong page in book while teacher is instructing (if the
observer can see the textbook).(off task)
Student is looking in purse/book bag while teacher is instructing.(off
task)
Student is watching a peer performing an off task activity (e.g., texting,
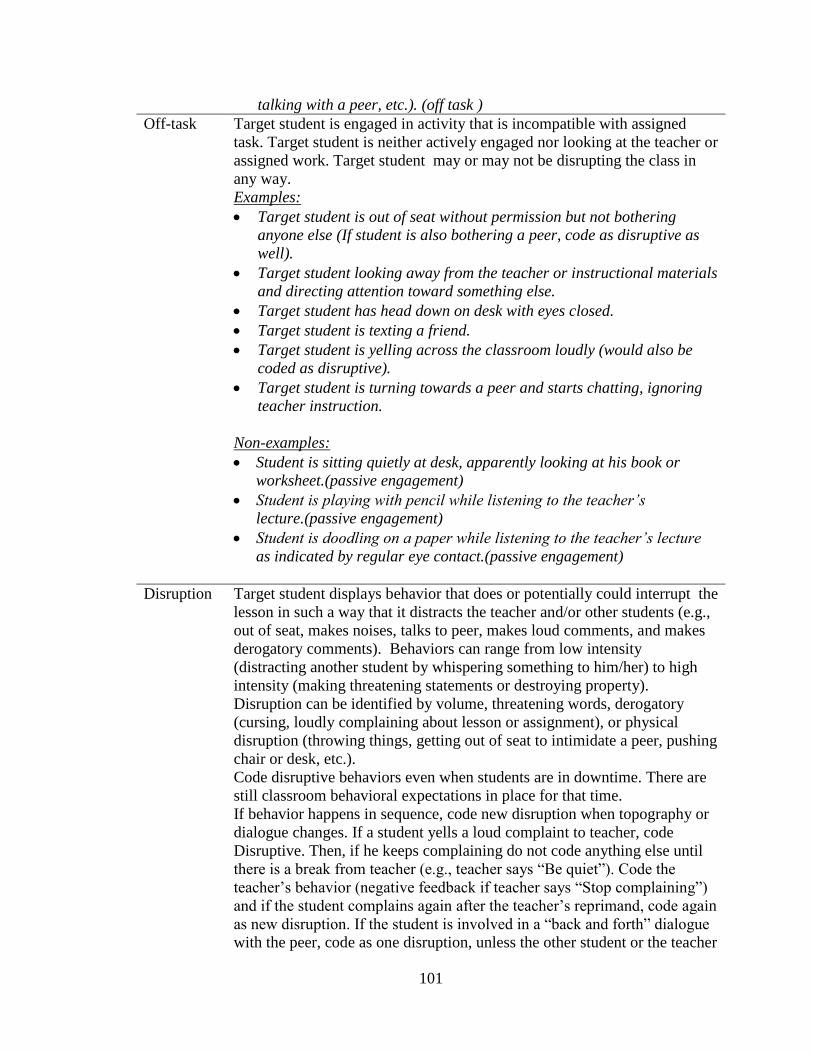
101
talking with a peer, etc.). (off task )
Off-task Target student is engaged in activity that is incompatible with assigned
task. Target student is neither actively engaged nor looking at the teacher or
assigned work. Target student may or may not be disrupting the class in
any way.
Examples:
Target student is out of seat without permission but not bothering
anyone else (If student is also bothering a peer, code as disruptive as
well).
Target student looking away from the teacher or instructional materials
and directing attention toward something else.
Target student has head down on desk with eyes closed.
Target student is texting a friend.
Target student is yelling across the classroom loudly (would also be
coded as disruptive).
Target student is turning towards a peer and starts chatting, ignoring
teacher instruction.
Non-examples:
Student is sitting quietly at desk, apparently looking at his book or
worksheet.(passive engagement)
Student is playing with pencil while listening to the teacher’s
lecture.(passive engagement)
Student is doodling on a paper while listening to the teacher’s lecture
as indicated by regular eye contact.(passive engagement)
Disruption Target student displays behavior that does or potentially could interrupt the
lesson in such a way that it distracts the teacher and/or other students (e.g.,
out of seat, makes noises, talks to peer, makes loud comments, and makes
derogatory comments). Behaviors can range from low intensity
(distracting another student by whispering something to him/her) to high
intensity (making threatening statements or destroying property).
Disruption can be identified by volume, threatening words, derogatory
(cursing, loudly complaining about lesson or assignment), or physical
disruption (throwing things, getting out of seat to intimidate a peer, pushing
chair or desk, etc.).
Code disruptive behaviors even when students are in downtime. There are
still classroom behavioral expectations in place for that time.
If behavior happens in sequence, code new disruption when topography or
dialogue changes. If a student yells a loud complaint to teacher, code
Disruptive. Then, if he keeps complaining do not code anything else until
there is a break from teacher (e.g., teacher says “Be quiet”). Code the
teacher’s behavior (negative feedback if teacher says “Stop complaining”)
and if the student complains again after the teacher’s reprimand, code again
as new disruption. If the student is involved in a “back and forth” dialogue
with the peer, code as one disruption, unless the other student or the teacher
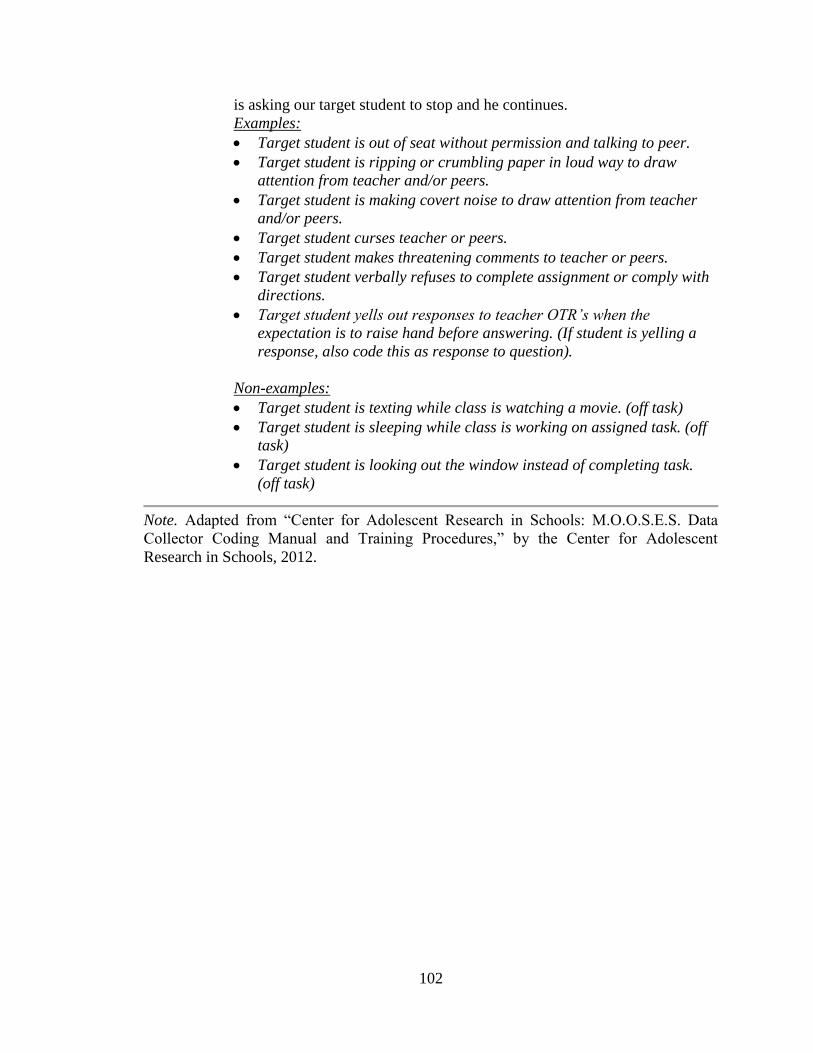
102
is asking our target student to stop and he continues.
Examples:
Target student is out of seat without permission and talking to peer.
Target student is ripping or crumbling paper in loud way to draw
attention from teacher and/or peers.
Target student is making covert noise to draw attention from teacher
and/or peers.
Target student curses teacher or peers.
Target student makes threatening comments to teacher or peers.
Target student verbally refuses to complete assignment or comply with
directions.
Target student yells out responses to teacher OTR’s when the
expectation is to raise hand before answering. (If student is yelling a
response, also code this as response to question).
Non-examples:
Target student is texting while class is watching a movie. (off task)
Target student is sleeping while class is working on assigned task. (off
task)
Target student is looking out the window instead of completing task.
(off task)
Note. Adapted from “Center for Adolescent Research in Schools: M.O.O.S.E.S. Data
Collector Coding Manual and Training Procedures,” by the Center for Adolescent
Research in Schools, 2012.

103
Appendix C
Opportunities to Respond Treatment Integrity
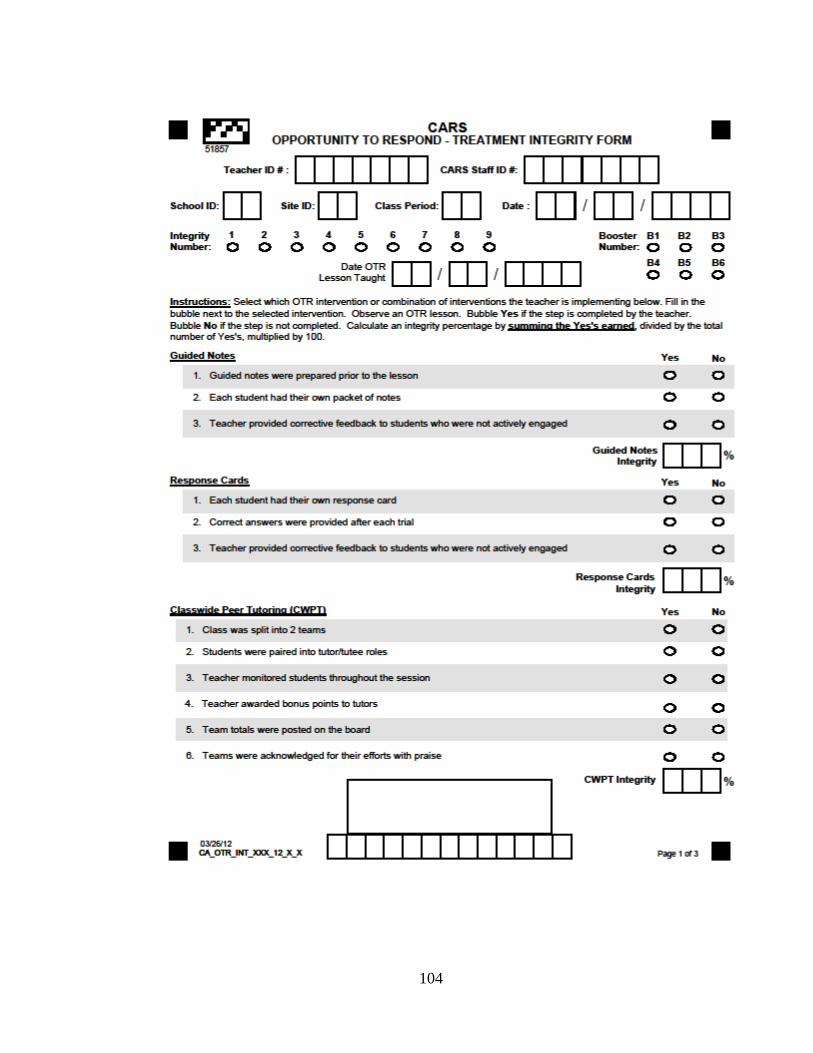
104
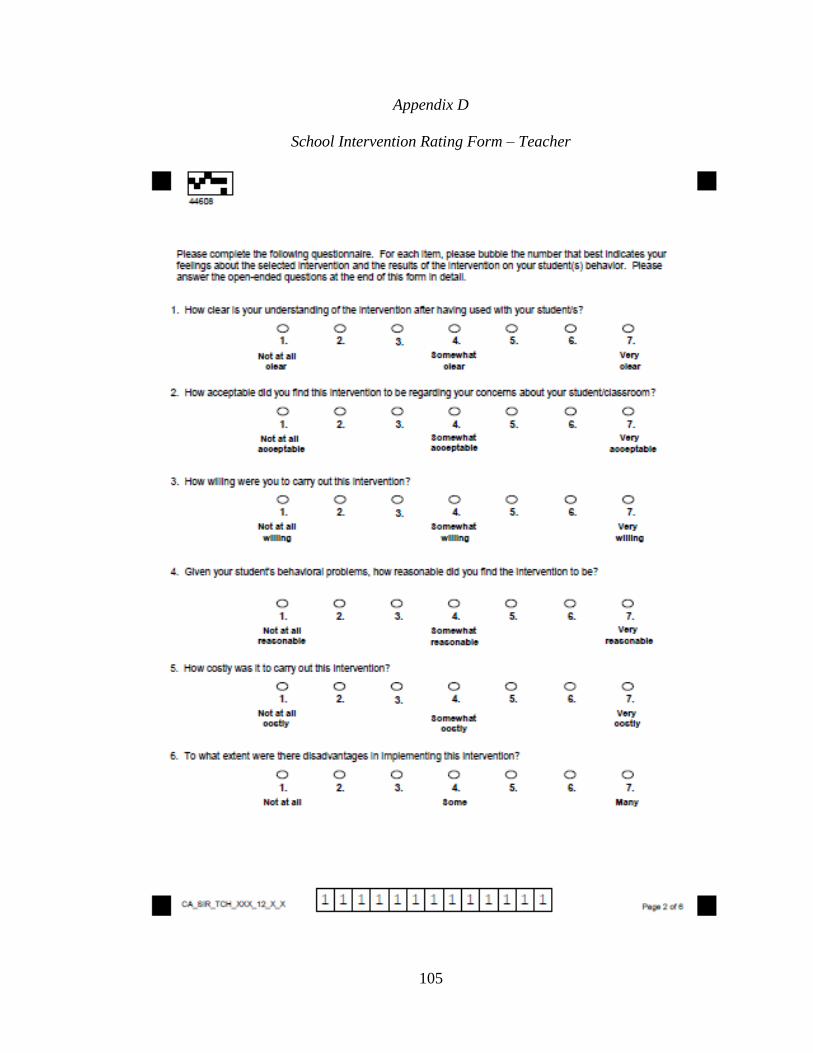
105
Appendix D
School Intervention Rating Form – Teacher
106
107
108

109
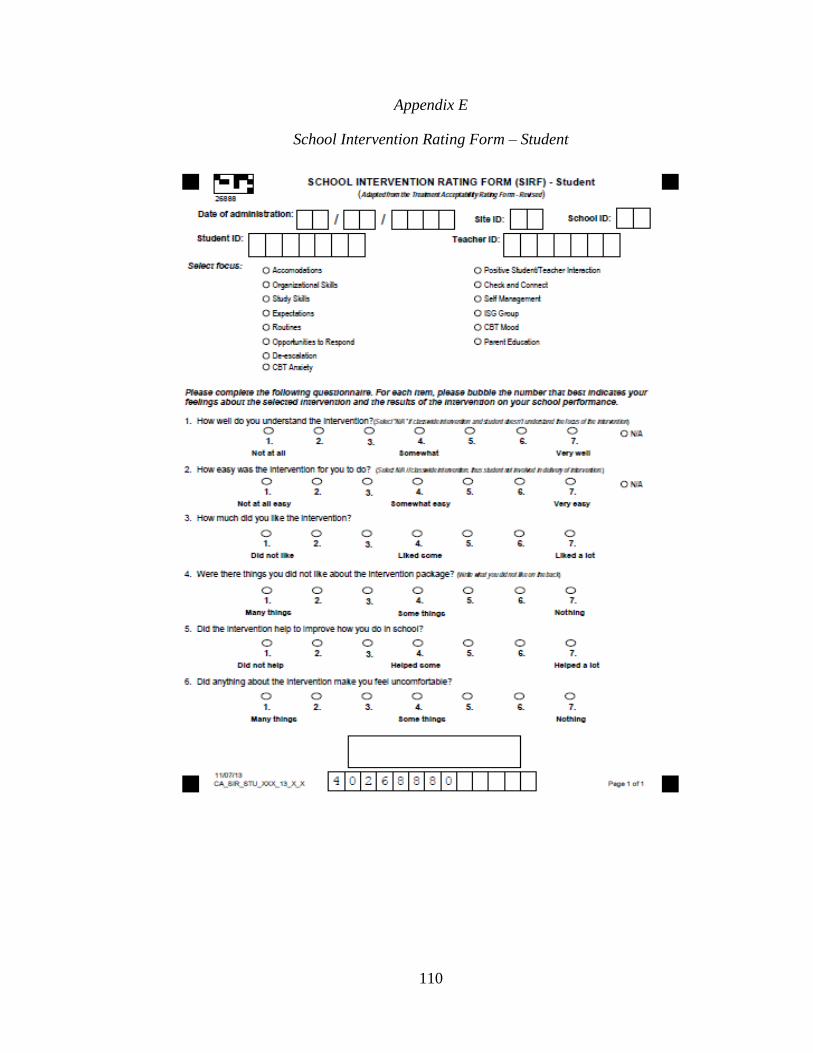
110
Appendix E
School Intervention Rating Form – Student