A comparison of the spherical flame characteristics of sub-millimeter droplets of binary mixtures of...
14
A comparison of the spherical flame characteristics of sub-millimeter droplets of binary mixtures of n-heptane/iso-octane and n-heptane/toluene with a commercial unleaded gasoline Yu Cheng Liu, C. Thomas Avedisian ⇑ Sibley School of Mechanical and Aerospace Engineering, Cornell University, Ithaca, NY 14853, USA article info Article history: Received 6 April 2011 Received in revised form 19 July 2011 Accepted 17 August 2011 Available online 13 September 2011 Keywords: Droplet combustion Gasoline Surrogate Soot Primary reference fuel Evaporation abstract The droplet burning characteristics of binary blends of iso-octane, n-heptane and toluene were studied in an ambience that minimizes external convection and promotes spherical droplet flames. The results are compared to gasoline (87 octane rating). The initial droplet diameter was fixed at 0.51 ± 0.02 mm and the experiments were carried out in room temperature air. Measurements of the evolution of droplet diameter show that iso-octane, n-heptane and their mixtures have almost identical burning rates that are significantly higher than gasoline. The pure toluene burning rate matches the gasoline burning rate during the quasi-steady period of the combustion history while it is lower than gasoline in approximately the first quarter and last quarter of the burning history. A small dilution with heptane (heptane (0.05)/toluene (0.95)) raised the mixture burning rate in the last quarter of the history to provide the best overall agreement with gasoline from ignition to burnout. The results show that no combination of the hydrocarbons examined could replicate the flame or soot shell standoff ratios for gasoline. The sooting propensities inferred from observations of flame brightness and image intensities are in the order toluene > gasoline > n-heptane (0.05)/toluene (0.95) > heptane (0.5)/toluene (0.5) > iso-octane > n-heptane (0.5)/iso-octane (0.5) > n-heptane. Ó 2011 The Combustion Institute. Published by Elsevier Inc. All rights reserved. 1. Introduction Practical fuels such as gasoline, diesel, and jet fuels consist of miscible mixtures of many individual chemical compounds origi- nating from crude oil distillation processes. These fuels are used widely in commercial and military transportation systems, but it has been prohibitive to develop combustion models for them due to the dissimilar fuel properties, sooting tendencies, and combus- tion kinetics of the mixture constituents [1–6]. Surrogate fuels, de- fined as blends of relatively fewer compounds of known chemical species and mixture fractions [7–10], and selected to match certain thermochemical aspects (i.e., ‘‘targets’’ or ‘‘objective functions’’) of the real fuel [3,11–14], offer the prospect of solving this problem. Combustion of a commercial fuel may be replicated if its burning behavior could be reproduced with a blend comprised of relatively fewer compounds of known chemical species. What a surrogate is intended to match depends on the combus- tion configuration. Most prior work has focused on combustion tar- gets derived exclusively from pre-vaporized fuel. The associated ‘‘gaseous’’ properties include ignition delay time, molecular weight, threshold sooting index, derived cetane number (DCN), hydrogen to carbon ratio, flame speed and extinction strain rate [14–18]. The experimental designs used to develop these targets generally promote a one-dimensional transport such as flat flame burners, shock tubes, flow and jet-stirred reactors, and opposed jet diffusion flames. Comparatively fewer studies have considered combustion prop- erties derived exclusively from surrogates that are initially liquid and whose evaporation and hence phase equilibrium behavior may be important to combustion performance. 1 Typically, for fuels that are liquids at room temperature the fuel is pre-vaporized (e.g., by spraying) before the combustion properties are measured (e.g., as in the ignition quality tester (IQT) where a model of the spray is used to separate the physical processes of droplet break up in a spray and subsequent vaporization from chemical processes [20] thereby giving the chemical delay time for ignition of the fully vaporized fuel). At the same time, for condensed phases, a flame may exist in the multiphase region. The preferential vaporization and phase equilibrium characteristics of the fuel then become important to 0010-2180/$ - see front matter Ó 2011 The Combustion Institute. Published by Elsevier Inc. All rights reserved. doi:10.1016/j.combustflame.2011.08.015 ⇑ Corresponding author. Fax: +1 607 255 1222. E-mail address: [email protected] (C.T. Avedisian). 1 Surrogates may also be developed to replicate exclusively the distillation (i.e., non-combustion) behavior of real fuels apart from combustion performance [19]. Combustion and Flame 159 (2012) 770–783 Contents lists available at SciVerse ScienceDirect Combustion and Flame journal homepage: www.elsevier.com/locate/combustflame
-
Upload
yu-cheng-liu -
Category
Documents
-
view
215 -
download
0
Transcript of A comparison of the spherical flame characteristics of sub-millimeter droplets of binary mixtures of...

Combustion and Flame 159 (2012) 770–783
Contents lists available at SciVerse ScienceDirect
Combustion and Flame
journal homepage: www.elsevier .com/locate /combustflame
A comparison of the spherical flame characteristics of sub-millimeter dropletsof binary mixtures of n-heptane/iso-octane and n-heptane/toluenewith a commercial unleaded gasoline
Yu Cheng Liu, C. Thomas Avedisian ⇑Sibley School of Mechanical and Aerospace Engineering, Cornell University, Ithaca, NY 14853, USA
a r t i c l e i n f o a b s t r a c t
Article history:Received 6 April 2011Received in revised form 19 July 2011Accepted 17 August 2011Available online 13 September 2011
Keywords:Droplet combustionGasolineSurrogateSootPrimary reference fuelEvaporation
0010-2180/$ - see front matter � 2011 The Combustdoi:10.1016/j.combustflame.2011.08.015
⇑ Corresponding author. Fax: +1 607 255 1222.E-mail address: [email protected] (C.T. Avedisian).
The droplet burning characteristics of binary blends of iso-octane, n-heptane and toluene were studied inan ambience that minimizes external convection and promotes spherical droplet flames. The results arecompared to gasoline (87 octane rating). The initial droplet diameter was fixed at 0.51 ± 0.02 mm and theexperiments were carried out in room temperature air.
Measurements of the evolution of droplet diameter show that iso-octane, n-heptane and their mixtureshave almost identical burning rates that are significantly higher than gasoline. The pure toluene burningrate matches the gasoline burning rate during the quasi-steady period of the combustion history while itis lower than gasoline in approximately the first quarter and last quarter of the burning history. A smalldilution with heptane (heptane (0.05)/toluene (0.95)) raised the mixture burning rate in the last quarterof the history to provide the best overall agreement with gasoline from ignition to burnout. The resultsshow that no combination of the hydrocarbons examined could replicate the flame or soot shell standoffratios for gasoline.
The sooting propensities inferred from observations of flame brightness and image intensities are in theorder toluene > gasoline > n-heptane (0.05)/toluene (0.95) > heptane (0.5)/toluene (0.5) > iso-octane >n-heptane (0.5)/iso-octane (0.5) > n-heptane.
� 2011 The Combustion Institute. Published by Elsevier Inc. All rights reserved.
1. Introduction
Practical fuels such as gasoline, diesel, and jet fuels consist ofmiscible mixtures of many individual chemical compounds origi-nating from crude oil distillation processes. These fuels are usedwidely in commercial and military transportation systems, but ithas been prohibitive to develop combustion models for them dueto the dissimilar fuel properties, sooting tendencies, and combus-tion kinetics of the mixture constituents [1–6]. Surrogate fuels, de-fined as blends of relatively fewer compounds of known chemicalspecies and mixture fractions [7–10], and selected to match certainthermochemical aspects (i.e., ‘‘targets’’ or ‘‘objective functions’’) ofthe real fuel [3,11–14], offer the prospect of solving this problem.Combustion of a commercial fuel may be replicated if its burningbehavior could be reproduced with a blend comprised of relativelyfewer compounds of known chemical species.
What a surrogate is intended to match depends on the combus-tion configuration. Most prior work has focused on combustion tar-gets derived exclusively from pre-vaporized fuel. The associated
ion Institute. Published by Elsevier
‘‘gaseous’’ properties include ignition delay time, molecularweight, threshold sooting index, derived cetane number (DCN),hydrogen to carbon ratio, flame speed and extinction strain rate[14–18]. The experimental designs used to develop these targetsgenerally promote a one-dimensional transport such as flat flameburners, shock tubes, flow and jet-stirred reactors, and opposedjet diffusion flames.
Comparatively fewer studies have considered combustion prop-erties derived exclusively from surrogates that are initially liquidand whose evaporation and hence phase equilibrium behaviormay be important to combustion performance.1 Typically, for fuelsthat are liquids at room temperature the fuel is pre-vaporized (e.g.,by spraying) before the combustion properties are measured (e.g.,as in the ignition quality tester (IQT) where a model of the spray isused to separate the physical processes of droplet break up in a sprayand subsequent vaporization from chemical processes [20] therebygiving the chemical delay time for ignition of the fully vaporizedfuel). At the same time, for condensed phases, a flame may exist inthe multiphase region. The preferential vaporization and phaseequilibrium characteristics of the fuel then become important to
Inc. All rights reserved.
1 Surrogates may also be developed to replicate exclusively the distillation (i.e.,non-combustion) behavior of real fuels apart from combustion performance [19].
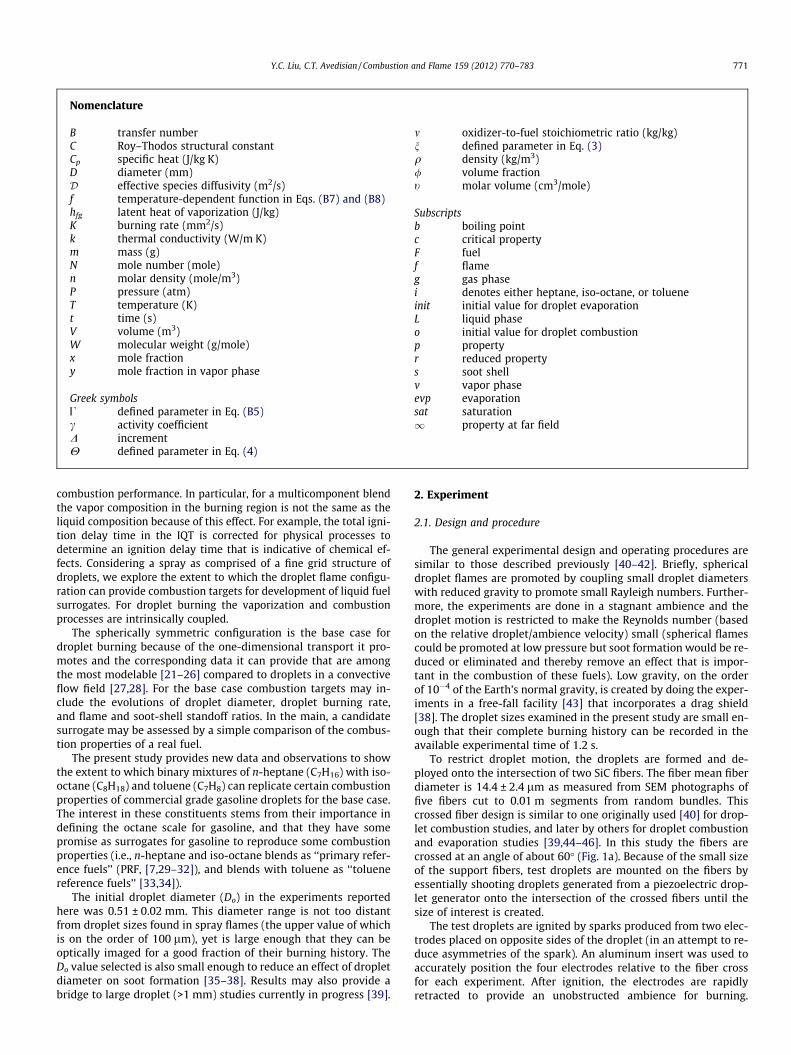
Nomenclature
B transfer numberC Roy–Thodos structural constantCp specific heat (J/kg K)D diameter (mm)D effective species diffusivity (m2/s)f temperature-dependent function in Eqs. (B7) and (B8)hfg latent heat of vaporization (J/kg)K burning rate (mm2/s)k thermal conductivity (W/m K)m mass (g)N mole number (mole)n molar density (mole/m3)P pressure (atm)T temperature (K)t time (s)V volume (m3)W molecular weight (g/mole)x mole fractiony mole fraction in vapor phase
Greek symbolsU defined parameter in Eq. (B5)c activity coefficientD incrementH defined parameter in Eq. (4)
m oxidizer-to-fuel stoichiometric ratio (kg/kg)n defined parameter in Eq. (3)q density (kg/m3)/ volume fractiont molar volume (cm3/mole)
Subscriptsb boiling pointc critical propertyF fuelf flameg gas phasei denotes either heptane, iso-octane, or tolueneinit initial value for droplet evaporationL liquid phaseo initial value for droplet combustionp propertyr reduced propertys soot shellv vapor phaseevp evaporationsat saturation1 property at far field
Y.C. Liu, C.T. Avedisian / Combustion and Flame 159 (2012) 770–783 771
combustion performance. In particular, for a multicomponent blendthe vapor composition in the burning region is not the same as theliquid composition because of this effect. For example, the total igni-tion delay time in the IQT is corrected for physical processes todetermine an ignition delay time that is indicative of chemical ef-fects. Considering a spray as comprised of a fine grid structure ofdroplets, we explore the extent to which the droplet flame configu-ration can provide combustion targets for development of liquid fuelsurrogates. For droplet burning the vaporization and combustionprocesses are intrinsically coupled.
The spherically symmetric configuration is the base case fordroplet burning because of the one-dimensional transport it pro-motes and the corresponding data it can provide that are amongthe most modelable [21–26] compared to droplets in a convectiveflow field [27,28]. For the base case combustion targets may in-clude the evolutions of droplet diameter, droplet burning rate,and flame and soot-shell standoff ratios. In the main, a candidatesurrogate may be assessed by a simple comparison of the combus-tion properties of a real fuel.
The present study provides new data and observations to showthe extent to which binary mixtures of n-heptane (C7H16) with iso-octane (C8H18) and toluene (C7H8) can replicate certain combustionproperties of commercial grade gasoline droplets for the base case.The interest in these constituents stems from their importance indefining the octane scale for gasoline, and that they have somepromise as surrogates for gasoline to reproduce some combustionproperties (i.e., n-heptane and iso-octane blends as ‘‘primary refer-ence fuels’’ (PRF, [7,29–32]), and blends with toluene as ‘‘toluenereference fuels’’ [33,34]).
The initial droplet diameter (Do) in the experiments reportedhere was 0.51 ± 0.02 mm. This diameter range is not too distantfrom droplet sizes found in spray flames (the upper value of whichis on the order of 100 lm), yet is large enough that they can beoptically imaged for a good fraction of their burning history. TheDo value selected is also small enough to reduce an effect of dropletdiameter on soot formation [35–38]. Results may also provide abridge to large droplet (>1 mm) studies currently in progress [39].
2. Experiment
2.1. Design and procedure
The general experimental design and operating procedures aresimilar to those described previously [40–42]. Briefly, sphericaldroplet flames are promoted by coupling small droplet diameterswith reduced gravity to promote small Rayleigh numbers. Further-more, the experiments are done in a stagnant ambience and thedroplet motion is restricted to make the Reynolds number (basedon the relative droplet/ambience velocity) small (spherical flamescould be promoted at low pressure but soot formation would be re-duced or eliminated and thereby remove an effect that is impor-tant in the combustion of these fuels). Low gravity, on the orderof 10�4 of the Earth’s normal gravity, is created by doing the exper-iments in a free-fall facility [43] that incorporates a drag shield[38]. The droplet sizes examined in the present study are small en-ough that their complete burning history can be recorded in theavailable experimental time of 1.2 s.
To restrict droplet motion, the droplets are formed and de-ployed onto the intersection of two SiC fibers. The fiber mean fiberdiameter is 14.4 ± 2.4 lm as measured from SEM photographs offive fibers cut to 0.01 m segments from random bundles. Thiscrossed fiber design is similar to one originally used [40] for drop-let combustion studies, and later by others for droplet combustionand evaporation studies [39,44–46]. In this study the fibers arecrossed at an angle of about 60� (Fig. 1a). Because of the small sizeof the support fibers, test droplets are mounted on the fibers byessentially shooting droplets generated from a piezoelectric drop-let generator onto the intersection of the crossed fibers until thesize of interest is created.
The test droplets are ignited by sparks produced from two elec-trodes placed on opposite sides of the droplet (in an attempt to re-duce asymmetries of the spark). An aluminum insert was used toaccurately position the four electrodes relative to the fiber crossfor each experiment. After ignition, the electrodes are rapidlyretracted to provide an unobstructed ambience for burning.

2 We saw no evidence of opalescence of the binary mixtures during the dropleturning process that could signify phase separation of the constituents.
Fig. 1. (a) Top view photograph showing a droplet mounted at the cross of the fibers. (b) Side view photograph taken at normal gravity showing a droplet mounted on a fiber(droplet center is slightly below the plane of the fibers because of gravity). Dotted line shows trajectory of droplet directed toward cross of the fibers from the dropletgenerator nozzle (partly visible) to build up droplet diameter of interest. (c) Schematic showing camera arrangement. Numbers are in millimeters.
772 Y.C. Liu, C.T. Avedisian / Combustion and Flame 159 (2012) 770–783
However, this retraction process influenced the initial sootingdynamics as discussed later.
The average energy provided by the two sparks is approxi-mately 0.1 J, though the actual number differs from fuel to fuel.By comparison, the energy released by the combustion process ofthe fuels examined (based on their lower heating values) is about45 MJ/kg. For the droplet sizes examined (order of 0.5 mm diame-ter), the spark energy is a factor of about 20 smaller than this value.The diameter of the spark generated by the electrode pairs is sim-ilar to the initial droplet diameter.
Once the droplet of the desired size is on the fiber, the followingprocedure is used to conduct the experiment: the instrumentationpackage housing the hardware is released into free-fall by turningoff an electromagnet that fixes the package to the support ceiling;the droplet is ignited approximately 320 ms after the package is re-leased by two sparks discharged across two electrode pairs fromseparate circuits (the spark duration is 800 ls in this study); andthe experiment is terminated after the instrumentation packagehits the bottom after about 1.2 s of free-fall. These sequences arecontrolled by a multi-channeled signal generator (Quantum Com-poser, QC-9618). The delay time prior to ignition is imposed to al-low for disturbances of the release of the instrumentation packageto dissipate.
The fuels used in this study are n-heptane (Fisher Scientific,>99%), iso-octane (Sigma–Aldrich 99+%, A.C.S. reagent), toluene(Aldrich, HPLC, 99.8%), and 87-octane gasoline. Selected propertiesare listed in Table 1. The gasoline was a commercial grade pur-chased from a local service station (Mobil�). It contained no etha-nol, and GC/MS analysis of it (discussed in Appendix A) indicatedno oxygenates. For the binary mixtures, the initial fractionalamounts investigated are given in Table 2. The mixtures were pre-pared on a volumetric basis. The volume fractions were convertedto the initial mole fraction values listed in Table 2 with the aid of
density values (listed in Table 1, measured using a Digital DensityMeter (Toledo DA-100M) at 297.7 K)). The boiling point ranges ofthe fuels are close such that there would be no possibility of the fi-ber to induce a disruptive (or microexplosion) effect beyond thatwhich could be triggered by hot soot aggregates contacting thecomparatively cold droplets during the burning process [47].
An extensive range of mixture compositions was not investi-gated because the goal was to determine the fractional amountof mixture constituents that best replicated the burning of gaso-line. Since the heptane and iso-octane droplet burning processeswere so similar, and they form nearly ideal miscible mixtures,2 itwas expected that the mixture properties (e.g., burning rates) wouldbe intermediate between the mixture fractions selected. For the hep-tane/toluene system it was found that the burning process of toluenealone was close to gasoline. Adding heptane to toluene allowed foradjusting the composition to better match the burning rate of gaso-line. These results are discussed further in Section 3.2.
Three considerations for the experimental arrangement are thefollowing: exposure of the droplet to surrounding air during theset-up time prior to ignition; the potential for heat conductionthrough the fiber to alter the burning process; the motion of theelectrode retraction to induce a flow field that could influencethe droplet burning process; and the potential for significant inter-nal liquid motion to exist inside the droplet prior to ignition thatcould have a demonstrable effect on the droplet burning process.For a single component liquid the only effect of exposure to air be-fore ignition is to reduce the droplet diameter by evaporation. Formixtures, an added effect is the potential of preferential evapora-tion to change the droplet composition from the initially prepared
b

Table 1Selected properties.
Property n-Heptane Iso-octane Toluene Gasoline
Formulaa C7H16 C8H18 C7H8 C7.76H13.1 or C8.26H15.5
Boiling pointb (K) 372 372 384 297–494c
Molecular weightb (g/mole) 100.2 114.23 92.14 114.8 or 106.4a
Densityd (@ 297.7 K, kg/m3) 680 688 862 731Densitye (@ boiling point, kg/m3) 608 638 776 –K (mm2/s)f 0.72 0.69 0.55 0.53Heat of vaporizationb (@ Tb, J/kg) 31.7 � 104 27.0 � 104 36.0 � 104 –Octane numberg 0 100 112 87Stoichiometric coefficienth 11.0 12.5 9 11.035–12.135
a Formula for gasoline is from [50].b [65] Except for gasoline.c [66].d Measured in this study.e Eq. (B15).f Estimated from insets to Figs. 8, 9 and 11 in an approximate quasi-steady period.g Anti-Knocking Index (AKI) = (Research Octane Number (RON) + Motor Octane Number (MON))/2 [72], except for gasoline.h Assumes one mole of fuel and products of CO2 and H2O.
Table 2Fractional amounts (of heptane) investigated for the indicated mixture components(actual compositions will differ slightly from the indicated values due to the pre-vaporization process discussed in Appendix A).
Mixture Initial volume fraction Initial mole fraction
Heptane/iso-octane 0.5 0.530Heptane/toluene 0.5 0.420Heptane/toluene 0.2 0.154Heptane/toluene 0.05 0.037
Y.C. Liu, C.T. Avedisian / Combustion and Flame 159 (2012) 770–783 773
value. This effect is discussed in Appendix A. It is shown that if thedroplets are ignited within about 5 s of being deployed on the fiber,the droplet composition at ignition is virtually the same as at thetime of ignition. The effect of using fiber materials with ostensiblydifferent thermal conductivities is discussed in Sections 2.3 and 2.4discusses the influence of electrode retraction on sooting dynam-ics. The potential for the flight of the droplet from the nozzle tothe plane of the fiber (Fig. 1b) to induce significant internal circu-latory motion inside of the droplet was estimated in a prior study[48] and shown to dissipate over a time significantly shorter thanthe droplet burning time. Also, the spherical flame shapes suggestthat liquid motion, if it existed, evidently did not exert a significanteffect on the gas phase symmetry.
2.2. Data acquisition
The droplet combustion process was recorded by two cameras(cf, Fig. 1c): a color video camera for self-illuminated flame images(0.3 MP per frame Hitachi HV-C20 operated at 30 frames per sec-ond, and fitted with a Nikkor 135 mm f/2.0 lens and two Kenko36 mm extension tubes); and a black and white (BW) digitalhigh-speed camera for backlit silhouette images that highlightthe droplet and soot shell boundaries (a 3.9 MP per frame CanadianPhotonics Labs, Inc. MS-80K digital high speed camera operated at200 fps, and fitted with an Olympus Zuiko 90 mm f/2.0 lens, anOlympus OM Telescopic Extension Tube 65–116 mm (fixed at100 mm), and a Vivitar MC 2X teleconverter). The use of a telecon-verter for the BW camera allowed for higher magnification of drop-let images and the ability to make diameter measurements downto about 80 lm where feasible. Backlighting is provided by a 1-W LED lamp (Black Diamond) to minimize heating of the gas insidethe combustion chamber.
The camera and lens settings were not fixed for the differenthydrocarbons examined due to variations of sooting propensitiesand associated thickness variations of the soot clouds. Adjustmentswere made for each fuel examined to provide the best images. For
each setting, a scale factor was applied to the images by a 0.79 mmtungsten-carbide ball (Salem Specialty Ball Company). This ballwas photographed with the same magnification, position fromthe lens and lighting for each setting.
For n-heptane and iso-octane the lens settings were the follow-ing: exposure time of 100 ls per frame; lens f-stop of 2.8. For tol-uene and heptane/toluene mixtures, an exposure time of 200 lsper frame and an f-stop of 8 were used (had these settings beenused for n-heptane and iso-octane the background of the soot shellwould have appeared brighter and the droplet visibility wouldhave been reduced). For gasoline, an exposure time of 80 ls perframe and an f-stop of 4 were employed to obtain good contrastfor soot shells and droplet images.
The dimensions of droplet, outer luminous zones and soot shellswere obtained from computer analysis of individual video frames.The commercial software package Image Pro-Plus v6.3 was usedfor toluene, gasoline, and some heptane/toluene mixtures. Forthe other fuels, an automated Matlab-based program was used toanalyze a series of consecutive images with adaptive thresholds[49] because of their relatively lower sooting.
Flame diameters were measured with the aid of the CorelDraw9 graphics package. Individual frames were imported into thepackage and an ellipse tool was used to draw an enclosure aroundthe outer luminous zone from which the major and minor axes ofthe ellipse were determined.
The optically thick ambience formed from dense soot cloudscreated difficulties in some cases for extracting dimensions fromBW images. Soot obscuration of the droplet and the lack of a welldefined geometrical structure for the trapped aggregates for heav-ily sooting conditions made it in some cases impossible to deter-mine a soot shell ‘‘diameter’’ or droplet diameter. This effect wasespecially problematic near the end of burning. Soot shell mea-surements were discarded when the soot shell perimeter had awidth/height ratio greater than 1.1 or less than 0.9, and whenthe soot shell was obscured by agglomerated particles that formeda crust. The soot shell diameter of pure toluene is not reported inthis study because the thickness of the soot crust almost com-pletely obscured the soot shell. For most of the data reported here,averages were taken of three selected individual experiments.
Figure 2 shows how a droplet image was analyzed for a heavilysooting condition when soot obscured part of the droplet. Thediameter measurements in this case were manually made by defin-ing an area of interest (AOI) on each droplet image with the aid ofImage-Pro Plus software. With this area, an equivalent diameterwas determined by the software based on imposing an ellipse onthe image. Figure 2b and c shows examples of ellipses placed overimages.

Fig. 2. Droplet diameter measurement with the aid of the Image-Pro Plus v6.3 software: (a) droplet before ignition showing the gray scale of the software; (b) image withminimum diameter reported in this study; (c) droplet image obscured by soot accumulation (circle is manually placed).
Fig. 3. Evolution of scaled droplet diameter for gasoline showing the change ofstandard deviation as burning progresses.
774 Y.C. Liu, C.T. Avedisian / Combustion and Flame 159 (2012) 770–783
For Fig. 2a, the error from manual manipulation of the AOI isestimated as one half pixel which equals to 0.4% of the initial drop-let diameter. Different choices of threshold values for dropletboundary would produce about a 5 pixel difference for such an ex-treme case, which is about 13% of an 80 lm droplet.
The image of Fig. 2b is the last in the sequence for iso-octane.The boundary of the droplet is quite blurred. For this case, thedroplet diameter was obtained by first filtering the image (secondrow of Fig. 2b) with the ellipse manually placed to fill in the drop.The last image analyzed for gasoline (Fig. 2c) shows a droplet thatis almost totally obscured by soot. The arrows point to visible seg-ments of the droplet boundary which served as arcs of an ellipsethat was completed as shown in the second image of Fig. 2c. Suchimages were analyzed only when more than one visible arc of thedroplet boundary could be observed.
In analyzing the droplet images, no attempt was made to sub-tract out the diameter of the fiber protruding into the ellipse sothat, in effect, the diameter of the fiber was considered part ofthe droplet diameter. The fiber has a negligible effect in this in-stance when D� Dfiber. The reliability of droplet diameter mea-surements breaks down at the end of burning when D � Dfiber.We took the condition D < 10Dfiber or about 144 lm as this limit.Measurements below this threshold (down to 80 lm) were madeonly in a few instances when it was considered reliable to do so.
Concerning data precision, it is dependent on the sharpness andclarity of the images. To estimate the uncertainty, we express it interms of the number of pixels an image encompasses. For dropletdiameter measurements, a 0.5 mm droplet comprised approxi-mately 250 pixels for the high resolution black and white cameraused in the present study. This pixel count is measured from whatis best judged as the outer edge of the droplet. The droplet surfaceis a sort of diffuse boundary whose thickness depends on the sharp-ness of the image. A value of 5 pixels is approximate for the dropletboundary thickness in images reported in the present study. Theuncertainty of the initial droplet diameter expressed as a percentof the pixels it encompasses is then, approximately, ±2% (i.e., +255/250;�245/250). At the end of burning, the smallest droplet diameterthat could be measured is approximately 80 lm which encompassesapproximately 40 pixels. Taking again a droplet boundary thicknessof 5 pixels, the precision to which the number of pixels a droplet of80 lm would be known is approximately ±13%.
For the soot shell diameter the largest shell diameters measuredencompassed approximately 750 pixels. With a boundary thick-ness of approximately 20 pixels the uncertainty of the initial sootshell pixel counts, measured from the video images, should beapproximately ±3%. The smallest shell that could be measuredencompassed approximately 300 pixels, though it must be empha-sized that as burning progressed the shells evolved into irregularshapes and the boundaries were often not contiguous. For a fixed
number of boundary pixels, again taken as 20, the approximateuncertainty is ±7%.
Regarding flame or luminous zone diameter, a lower resolution(640 � 480) color camera was used for the flame. The largest flameimage measured comprised approximately 190 pixels and thesmallest measured flame consisted of approximately 100 pixels.The luminous zone boundary thickness (as best as could be deter-mined) consisted of approximately 8 pixels. At the upper size, theuncertainty of luminous zone diameter measurements would thenbe ±4% (i.e., +198/190; �182/190). At the lower size, the uncer-tainty of luminous zone diameter measurements would approxi-mately be ±9% (i.e., +108/100; �92/100).
Concerning repeatability, the data presented in this study arethe averages of three individual runs for each fuel unless otherwisenoted. Though it is a bit tenuous to determine a mean and standarddeviation from such a rather small sampling number, a standarddeviation can nonetheless be obtained. For example, taking gaso-line as an example Fig. 3 shows the evolution of droplet diametersquared using the scaled coordinates of the classical theory ofdroplet burning [50,51]. The vertical bars indicate the standarddeviation (STD). With increasing time the STD increases becausethe droplet diameter becomes smaller with time and thus moredifficult to measure accurately. These trends are indicative of theother fuels examined. In the presentation of the data that follows,we omit the STD for clarity to illustrate trends.

Y.C. Liu, C.T. Avedisian / Combustion and Flame 159 (2012) 770–783 775
2.3. Effect of fiber support material
The fiber support may influence the burning process of sootingfuels through perturbations of the symmetry of the soot shell [52],distortions of the droplet shape, or by heat conduction through thefiber [53,54]. Concerning energy transfer through the fiber, an esti-mate of the conductive transfer through the fiber based on the fiberbehaving as a fin insulated on its side with fixed temperatures atits ends was estimated when using a SiC thermal conductivity of60 W/m K [55]. However, the thermal conductivity of the SiC fiberswe used is a matter of speculation. Literature values for bulk SiCrange from 490 W/m K at room temperature to about 60 W/m Kat 1200 K [56]. And for fibrous SiC strands less than 20 lm diame-ter values of less than 5 W/m K are reported [57]. These differencesin fiber thermal conductivity will obviously influence the conclu-sions one may draw about heat transfer to the droplet throughthe fiber.
We performed some limited tests for heptane and toluene drop-lets mounted on fibers of a different material with documentedthermal conductivity but with the nearly same fiber diameter:
Fig. 4. Comparison of the evolution of scaled droplet diameter burning on SiC andceramic fibers of approximately 14 lm diameter: (a) heptane; (b) toluene.
3 M Nextel 312 ceramic fibers with k � 2 W/m K [58]. Figure 4compares data from individual (not averaged) runs for the evolu-tion of droplet diameter of heptane (a) and toluene (b).
The results in Fig. 4 are similar for the two fuels. From thisobservation we can at most conclude that the heat transfer effectassociated with conduction through these two different fiber mate-rials appears to be similar, suggesting that the fibers either havethe same thermal conductivity (since the fiber diameters are close)or that the fibers do not induce a significant heating effect becauseof their small size except possibly very near the end of burning.What is more important for the present study is comparing theburning characteristics of the different fuel systems investigatedfor ambient conditions and hardware designs that are identical.Such a comparison is at the heart of the surrogate problem.
2.4. Effect of electrode retraction
The geometrical structures formed by soot aggregates that aretrapped between the droplet and flame are ideally spherical –the so-called soot ‘‘shell’’ – if the flow field is only in the radialdirection. In reality there are asymmetries in the soot aggregatestructure. The electrode retraction process and initial positioningof the electrodes relative to the droplet can promote a disturbanceto the gas and create an uncontrollable gas motion. Figure 5ashows a selection of images that cover the first 25% of the tolueneburning history for three toluene droplets. Corresponding quanti-tative measurements of droplet diameter are shown in Fig. 5b.
In 1I of Fig. 5a, the soot shell is initially stretched laterally and in1III it is stretched longitudinally, the differences being due to slightvariations in the position of the droplet relative to the center of theelectrodes. Interestingly, as burning proceeds and the flow createdby the electrode retraction and spark discharge dissipates, the sootstructures assume the expected spherical or near spherical config-uration (5I–5III). The evolution of droplet diameter illustrated inFig. 5b further shows that the burning process becomes unaffectedby the initial spark disturbance after even earlier times. These re-sults show that physical disturbances from initial conditions asso-ciated with the spark that effect the soot structure extend toapproximately the initial 25% of the droplet burning history(Fig. 5a) but that the evolution of droplet diameter is much less ef-fected by the soot structure in this period (Fig. 5b).
3. Results and discussion
3.1. Soot and flame structure
Figure 6 shows selected images of the flame structure for thefuels examined, arranged according to image ‘‘brightness’’. Thebrightness of the flame is due to the sensitivity of the eye to wave-lengths in the visible region of the electromagnetic spectrum cre-ated by oxidation of soot aggregates that are transported to theflame [51]. The brightness should qualitatively correlate with theamount of soot formed, being greater with increasing soot forma-tion. Based on this assessment, the sooting propensities (highest tolowest) consistent with Fig. 6 would be toluene > heptane/tolu-ene > gasoline > iso-octane > heptane/iso-octane > heptane whichis consistent with the ordering given in [51] based on broad chem-ical classes.
Selected back-lit images which clearly illustrate the soot struc-ture are shown in Fig. 7. The images are again arranged from high-est to lowest sooting tendency. It is evident that the heptane andiso-octane flames (Fig. 7d–f) are considerably less sooting thanthe toluene blends (Fig. 7a and b) or gasoline (Fig. 7c) and thatiso-octane (Fig. 7d) appears to produce more soot than n-heptane(Fig. 7f) which is consistent with Fig. 4. For the toluene flame

Fig. 5. (a) Sooting dynamics of various toluene droplets, just after being ignited, at the selected times after ignition showing the evolution of the developing soot structureinto a near-spherical form. (b) Evolution of D2 for the sequences of (a).
Fig. 6. Color video frames of burning droplets (Do = 0.51 ± 0.02 mm) arranged from highest to lowest intensity: (a) toluene, (b) toluene/heptane (0.5/0.5), (c) gasoline, (d) iso-octane, (e) iso-octane/heptane (0.5/0.5), and (f) n-heptane. Images were selected from each sequence for maximum qualitative luminosity.
776 Y.C. Liu, C.T. Avedisian / Combustion and Flame 159 (2012) 770–783
(Fig. 7a) soot formation was so extensive that the aggregates col-lected and formed a crust that eventually completely obscuredthe soot shell.3 Connected soot aggregates are also seen for gasoline(Fig. 7c) and an equivolume heptane/toluene mixture (Fig. 7b).
3 For toluene and gasoline droplets, the soot cloud was observed to be fed by whatappeared to be pulsating ‘‘waves’’ originating from near the flame boundary thatpropagated inward toward the cloud, much like waves moving toward a shore. Thiseffect was not evident for the other hydrocarbons studied, and we are not sure of itsorigin.
For some gasoline and toluene droplets, a disruptive effect wasobserved near the end of burning. This phenomenon could be theresult of volatile species being trapped inside the droplet owingto a preferential vaporization effect [59–61], dissolution of prod-uct gases in the droplet during burning [47], or nonvolatile impu-rities initially existing inside the liquid. Significant superheatingof the primary mixture constituents could not be sustained be-cause of their similar boiling points (Table 1) with such impuri-ties being present. Nonvolatile impurities, however small theirfractional amount is initially, could affect the burning process

Fig. 7. Back-lit high speed digital images of burning droplets (Do is 0.51 ± 0.02 mm): (a) toluene, (b) toluene/heptane (0.5/0.5), (c) gasoline, (d) iso-octane, (e) iso-octane/heptane (0.5/0.5), and (f) n-heptane. Images are selected based on intensity.
Y.C. Liu, C.T. Avedisian / Combustion and Flame 159 (2012) 770–783 777
near the end of the combustion process and potentially producethis effect.
3.2. Quantitative analysis of images
An important task for developing a surrogate is to adjust thefractional amount of constituents to match combustion targets.For droplet burning these targets include the evolution of droplet,soot and flame diameters, and burning rates. A measure of sootingcould also be included (e.g., mean or peak soot volume fraction)
Fig. 8. Comparison of the evolutions of scale droplet diameter for iso-octane, n-heptane, gasoline and a iso-octane/heptane (0.5/0.5) mixture. Data are averages ofthree repetitions for each fuel. Inset shows burning rates based on a 4th orderpolynomial fit to data. The dashed line indicates where D � 10Dfiber.
Fig. 9. Comparison of the evolutions of droplet diameters for heptane (data fromFig. 8), gasoline (data from Fig. 8) with toluene, and a toluene/heptane (0.5/0.5)mixture. Data are averages of three repetitions for each fuel. Inset shows burningrates based on a 4th order polynomial fit to data. The dashed line indicates whereD � 10Dfiber.
but was not added in the present study. Figures 8 and 9 providesuch comparisons.
As shown in Fig. 8, and from the standpoint of droplet burning,it is clear that heptane and iso-octane are poor surrogates for gas-oline. The burning rates, K, are much higher than gasoline as shown
in the inset to Fig. 8. K ¼ dðD=DoÞ2
dðt=D2o Þ
��� ���� �was obtained from a fourth-or-
der polynomial fit of the data in Fig. 8 (polynomial fits of differentorder will produce slightly different trends while the choice of 4thorder was considered to be suitable for comparative purposes).

Fig. 10. Variation of ni/nheptane with hydrocarbon mole fraction evaluated usingproperty correlations in Appendix B at the indicated flame temperatures (Tf,i). For allconditions examined, nheptane,iso-octane > ntoluene which, from the classical theory ofdroplet burning, would imply that Kheptane,iso-octane > Ktoluene.
Fig. 11. Comparison of the evolutions of droplet diameters for a finer range ofcompositions for toluene/n-heptane mixtures, (80/20 and 95/5) with toluene (datafrom Fig. 9) and gasoline (data from Fig. 8). Inset shows burning rates based on a 4thorder polynomial fit to data. Data are averaged three repetitions for each fuel. Thedashed line indicates where D � 10Dfiber.
778 Y.C. Liu, C.T. Avedisian / Combustion and Flame 159 (2012) 770–783
Moreover, the heptane and iso-octane sooting propensities arevery different from gasoline as noted previously.
The burning rates of gasoline, iso-octane, and heptane increasefor a portion of the burning history (probably the result of dropletheating that persists throughout burning [40,60]) followed by aquasi-steady period, 0.7 s/mm2 < t/D2
o < 1.25 s/mm2. The heptaneburning rate in this range is close to previous studies for n-heptanedroplets of this size [38]. On the other hand, the quasi-steady gas-oline burning rate is considerably lower. This shows that there isno mixture fraction for a binary blend of heptane/iso-octane thatcan replicate the burning rate of gasoline.
It has been shown that toluene can provide a mean for adjustingmixture chemical properties to bring them more in line with gas-oline [29]. Regarding the physical process of droplet burning,Fig. 9 shows that toluene alone represents well the droplet burningrate of gasoline in the quasi-steady regime, 0.7 s/mm2 < t/D2
o < 1.2 s/mm2. Outside of this range, toluene’s burning rate is sig-nificantly lower than gasoline. At the same time, considering therange of other combustion properties that might be matched(e.g., flame speed, ignition delay, extinction strain rate, etc.), a po-tential surrogate might not be able to match all conceivable com-bustion properties. It depends on what is important to match ina particular application as to labeling a fuel as a surrogate for thatapplication.
As shown in Figs. 8 and 9, heptane and iso-octane burn in an al-most identical way while toluene burns considerably slower. Tounderstand this result, we draw upon the classical quasi-steadytheory of droplet combustion [50,51]. This theory (which assumesconstant properties, no droplet heating, radiation or soot forma-tion, and a single step reaction) shows that the droplet burning rateis related to properties as
K � n lnð1þ BÞ ð1Þ
where
n � kg
qLcpgð2Þ
where B is the transfer number and the other symbols are defined inthe Nomenclature. For the present study, the quasi-steady theory isnot quantitative because the properties depend on temperature andcomposition while the theory assumes properties are constant.Nonetheless, the physical mechanism responsible for the dropletburning process should still be captured by this analysis.
n was estimated using property correlations given in Reid et al.[62] as listed in Appendix B. The liquid density in Eq. (2) arisesfrom a mass balance on the droplet and it is evaluated at the fuelboiling point. The ratio of gas thermal conductivities to specificheats were evaluated at Tp;i � 1
3 Tb;i þ 23 Tf ;i as suggested in [51].
Since the flame temperature and a suitable fuel mole fraction arenot well established ([63] suggests x = 0.4), n was evaluated over0 < x < 1 and for several droplet flame temperatures (we took val-ues ranging from 1400 K to 2000 K). Figure 10 shows the trendsof n normalized by nheptane.
It is evident from Fig. 10 that nheptane � niso-octane over the recom-mended range of x (between 0.2 and 0.4) so that Kheptane � Kiso-octane
while ntoluene/nheptane < 1 which implies that Ktoluene < Kheptane. Thesetrends are consistent with Figs. 8 and 9. As such, the physics ofthe constant property theory are consistent with the experimentalresults.
There is no obvious indication of preferential vaporization inFigs. 8 and 9 beyond the gradual change of K shown in the insetsto these figures. The mechanisms that could cause K to dependon time include preferential vaporization in which one componentevaporates out of the droplet first leaving behind less volatile spe-cies [59], or a droplet heating process that persists throughout
burning [60]. The lower heat of vaporization of iso-octane com-pared to heptane suggests that iso-octane should preferentiallyvaporize in a heptane/iso-octane mixture. But the fuel boilingpoints (Table 1) and the values of n are very close. As a result, anabrupt change of K should not be expected, and it was not observed(Fig. 8). The discussions in Appendix A suggest that preferentialvaporization may also be evidenced by the droplet compositionchanging over time.
Figure 11 shows a finer division of mixture fraction at lowerheptane loadings for heptane/toluene mixtures that result in animproved match with gasoline. Results for (initial) heptane con-centrations of 20% and 5% are illustrated in Fig. 11. For both blends,the mixture burning rates are now much closer to gasoline over the

Y.C. Liu, C.T. Avedisian / Combustion and Flame 159 (2012) 770–783 779
entire burning history, especially the 0.05/0.95 heptane/toluenemixture which is almost the same as gasoline (compare insets toFigs. 9 and 11).
Figure 12 shows the flame and soot standoff ratios (i.e., outerluminous zone diameter divided by the droplet diameter at thesame time, Df/D (FSR), and the soot shell diameter divided by thedroplet diameter at the same time, Ds/D (SSR), respectively). Unlikethe classical theory of droplet burning which shows that Df/D isconstant [50,51], the present results show transient behaviorswhich are consistent with prior experimental observations andtheories that consider fuel vapor accumulation effects, and gasflow fields that exhibit quasi-steady and unsteady regions as re-viewed in [63]. Heptane, iso-octane and toluene flames are sub-stantially farther from the droplet than gasoline flames.
A simple explanation of the flame standoff ratios shown inFig. 12, relative to each other, can be obtained from the extensionof the classical theory developed by Aharon and Shaw [64] whichshows that
Df
D� qLKmO2
8WFnDxO2;1
ð3Þ
where a single step stoichiometric reaction is assumed,Fuelþ mO2 O2 ! mCO2 CO2 þ mH2OH2O. For present purposes, we wantto compare the standoff ratios of heptane, iso-octane and tolueneto gasoline. From Eq. (3)
H �Df =D
��i
Df =D��
gasoline
�qL;i
qL;gasoline
!Ki
Kgasoline
� �mi
mgasoline
� �Wgasoline
Wi
� �ð4Þ
where ‘‘i’’ denotes heptane, iso-octane or toluene. Based on themeasurements in Fig. 12, it is evident that H > 1. To estimate Hfrom Eq. (4) the liquid densities (which are dependent on tempera-ture) and the burning rates, which are time dependent as shown inFigs. 8, 9 and 11, are needed. To simplify the estimates, we use theburning rates in the approximate quasi-steady periods determinedfrom the insets to Figs. 8, 9 and 11; values are listed in Table 1. Withthe data in Table 1, and taking mgasoline � 11.585 and densityvalues at 297.7 K from Table 1, H � 1.32, 1.28 and 1.14 for heptane,iso-octane and toluene, respectively. These trends are qualitatively
Fig. 12. Evolutions of flame and soot standoff ratios (Df/D, Ds/D) for the fuel systemsinvestigated. Data are averages of three repetitions for each fuel. Numbers in legendare initial droplet diameters in millimeters and compositions are a volume percent.Inset is an enlargement of the soot standoff ratio in terms of the scaled time.
consistent with the experimental results in Fig. 12 which show thatgasoline flames are closer to gasoline droplets than the flames of theother fuels examined.
Figure 12 shows that the soot standoff ratio is between 1.8 and2.5 at the low end (beginning from where it could be measured asnoted previously). At the upper end it is between 2.9 and 4.0. Theinset to Fig. 12 shows the SSR on an expanded scale for clarity (theaxes labels in the inset are omitted for space but are the same asthe major figure). The SSR for gasoline is consistently lower thanthe hydrocarbons examined which, together with the fact thatH – 1, shows the challenge of simultaneously satisfying a rangeof droplet combustion properties with a single fractional amountfor given mixture components.
4. Conclusions
The present study compared the burning histories of sphericaldroplet flames of an octane 87 grade of gasoline, with n-heptane/iso-octane and n-heptane/toluene mixtures while holding the ini-tial diameter at 0.51 ± 0.02 mm for the base case of droplet burningin an environment that promotes spherical droplet flames whilestill maintaining significant soot formation. The major observa-tions are the following.
(1) An n-heptane/toluene blend in the amount of 5% heptaneand 95% toluene replicates the burning rate of gasoline quitewell over the entire burning history, while pure toluene iscloser to gasoline in the quasi-steady period.
(2) None of the mixture fractions examined for heptane/iso-octane or heptane/toluene blends matched the flamestandoff or soot standoff ratios of gasoline, with values beingconsistently higher than gasoline throughout the dropletburning period. The results show that mixture fractionsselected to match one droplet burning combustion propertymay not carry over to another property.
(3) Sooting propensities are in the order (low to high) hep-tane < heptane/iso-octane < iso-octane < gasoline < heptane/toluene < toluene.
(4) No significant differences are observed for the burning ratesof iso-octane and n-heptane in spite of their significantly dif-ferent soot propensities.
(5) Toluene has a lower burning rate compared to iso-octane, n-heptane, and their mixtures.
(6) No significant preferential vaporization was detected in theevolution of droplet diameter (squared) for the mixturesexamined because the relevant properties (liquid density,gas thermal conductivity and specific heat) are close.
(7) A binary blend of an initially prepared composition canexperience significant compositional changes by exposureof the blend to air prior to ignition that lowers the composi-tion of the volatile component in the droplet. At ignition themean droplet composition can therefore be different thanthe initial value. This effect was minimized by limiting expo-sure of the mixture droplets of the sizes examined(�0.5 mm) to ambient air for less than 5 s prior to ignitionand the start of burning.
Acknowledgements
This work was supported by the National Aeronautics and SpaceAdministration under Grant Number NNX08AI51G with Mr. Mi-chael Hicks as the Project Monitor. The authors have significantlybenefitted from technical discussions with Mr. Hicks, and fromthe assistance of Messrs. Anthony Savas, James Roll, Christopher

780 Y.C. Liu, C.T. Avedisian / Combustion and Flame 159 (2012) 770–783
Dembia, and Mark Fuller of Cornell with the experiments, Dr. EdgarLara-Curzio of Oak Ridge National Laboratory for discussions on SiCthermal conductivity, and Mr. John Hunt of Cornell with SEM anal-ysis of SiC fibers. The authors also thank the NASA/NY Space GrantConsortium program for partial support of this work.
Fig. 15. GC/MS traces for a 0.5 mm diameter toluene/n-heptane mixture dropletprior to evaporation in air (a) initially (prior to exposure to air) and (b) afterevaporation in air for 50 s. Note different abscissas in (a) and (b). The two peaksshown are for heptane (3.2 min) and toluene (4.4 min).
Appendix A. Effect of air exposure on droplet composition
Preferential vaporization of mixture droplets comprised of var-ious species is normally associated with the combustion process.However, this phenomenon can occur during the experimentalset-up time when the droplet may be exposed to air from variousprocedures such as preparing the mixture, forming and deployingthe droplet, positioning the instrumentation package prior to re-lease into free-fall and ignition, and/or waiting for a (larger) de-ployed droplet to reach a (smaller) size of interest. In these cases,the initially prepared mixture fractions may be different at thetime of ignition. This section discusses this effect for a representa-tive blend of an initially equivolume mixture of toluene andheptane.
To illustrate this effect, our approach is to first form a ‘‘large’’droplet of known initial composition and allow it to evaporate inair down to a ‘‘small’’ drop, here being 0.50 mm due to its relevanceto the present study. When the droplet reaches the desired size, itsmean composition is measured. Figure 13 shows the concept. Thetime to evaporate down to a 0.5 mm droplet is considered to serveas a sort of set-up time in an experiment during which the dropletis exposed to air but has not yet been ignited.
Fig. 13. Schematic showing development of droplets of a given size formed byevaporation in air from larger droplets. The indicated times (tevp) are the valuesassociated with evaporation of toluene/n-heptane mixture droplets from Dinit toDo = 0.5 mm.
Fig. 14. Process for terminating the droplet evaporation process in air andpreparation for GC/MS measurements by immersion of the droplet in an acetonebath.
After reaching 0.5 mm, the droplet compositions are measuredby gas chromatography/mass spectrometry (GC/MS) analysis. Aplot of the average measured composition with evaporation timegives the actual droplet composition that would exist after expo-sure of the droplet to air for the elapsed time prior to ignition.The time of an initially equivolume toluene/heptane mixture withDo > 0.5 mm to evaporate down to 0.5 mm is measured, as well asthe resulting average droplet composition.
To measure the evaporation time (which may alternatively beconsidered the exposure time of the mixture to air), test dropletsof a nominally equivolume toluene/heptane mixture were placedon a 14 lm diameter SiC fiber that had been twisted into a loopas schematically illustrated in Fig. 14. The time for the droplet toreach 0.5 mm was then recorded by digital video imaging usingthe same camera as described previously. Eq. (A1) correlates thetime (tevp) of an (initially) equivolume heptane/iso-octane mixturedroplet at Do to evaporate down to 0.5 mm:
tevp ¼ 517:11Do � 777:55D2o þ 447:1D3
o � 93:803 ðA1Þ
where 0.6 mm < Do < 1 mm. At each value of tevp given by Eq. (A1),the droplet concentration was measured by terminating the evapo-ration process by quickly inserting the droplet into an acetone car-rier bath after which the composition was analyzed by a GC/MS.
Figure 15a shows representative data from this analysis for hep-tane/toluene mixtures. The initial state (tevp = 0 s, Do = 0.88 mm inthis case) is the equivolume mixture. The two peaks represent tol-uene (larger) and heptane (smaller). Though there are heavier non-volatile impurities in the droplet (because the compositions wereblended from supplies that contained on the order of 0.5% impuri-ties), they do not show up on the scale of Fig. 15a. Figure 15bshows the composition change after tevp = 50 s (i.e., correspondingto Do = 0.79 mm). The different vertical scales are noteworthy.Comparing Figs. 15a and b, evaporation of the droplet (from0.79 mm to 0.5 mm) has clearly enriched the droplet with toluene.This evaporation effect on droplet composition is far more complexfor gasoline.
Figure 16 shows GC/MS traces for a gasoline droplet that evap-orated down to 0.5 mm from a larger size. The constituents areidentified in the figure caption. After exposure to air for 49 s, manyof the species initially present have virtually disappeared therebyreducing the highly multicomponent nature of the gasoline blend

Fig. 16. GC/MS measurements for gasoline droplets (a) initially (prior to exposure to air) and (b) after evaporation in air for 49 s. Droplets were diluted with acetone prior toinsertion in GC/MS (Fig. 14). The peaks are as follows: (A) 2-methylpentane; (B) 3-methylpentane; (C) hexane; (D) methylcyclopentane, (E) benzene; (F) 3-methylhexane; (G)iso-octane; (H) heptane; (I) methylcyclohexane; (J) 2,4-dimethylhexane; (K) 2,3,4-trimethylpentane; (L) 3,3-dimethylhexane; (M), toluene; (N) 3-methylheptane; (O) 1,3-dimethyl-cis-cyclohexane; (P) 2,2,5-trimethylhexane; (Q) octane; (R) ethylcyclohexane; (S) ethylbenzene; (T) 1,3-dimethylbenzene; (U) p-xylene; (V) nonane; (W) 1-ethyl-2-methyl-benzene; (X) 1,2,3-trimethylbenzene; (Y) 1,3,5-trimethylbenzene; (Z) indane; (a) 1-ethyl-3,5-dimethybenzene; (b) 1-methyl-2-(1-methylethyl)benzene; (v) 1,2,4,5-tetramethylbenzene; (d) 1-methylindane; (e) 2-ethyl-1,4-dimethylbenzene.
Y.C. Liu, C.T. Avedisian / Combustion and Flame 159 (2012) 770–783 781
to fewer constituents, primarily toluene, 1,3-dimethylbenzne, 1-ethyl-2-methylbenzene and 1,3,5-trimethylbenzene.
Figure 17 shows the variation of measured droplet compositionwith tevp for heptane/toluene. The mixture is clearly enriched withtoluene over time. Thus, for example, a droplet at 0.5 mm that isignited after being exposed to air for 50 s would now containapproximately 76% toluene and 24% heptane.
The trends in Fig. 17 are predicted by considering the evapora-tion process as proceeding through steps in which an incrementalmass of liquid, Dm, is removed from the droplet until the dropletreaches the final specified diameter (0.5 mm). This approach fol-lows the modeling of evaporation of oil spills in ambient air [67]though is less detailed than using more rigorous analyses of multi-component droplet evaporation [68,69].
The model is as follows. When a liquid shell of mass Dm sur-rounding a droplet evaporates, it is assumed to be transformed into
Fig. 17. Average concentrations of toluene/heptane mixture droplets after exposureto air for the indicated times (tevp). Data points are measured by GC/MS and thetheoretical curves are developed from formulations in Appendix A. All data are fordroplet diameter D � 0.5 mm.
a vapor shell of the same incremental mass with mole numberssuch that DN1,2v = DN1,2L where
DN1;2L ¼y1;2
y1W1 þ y2W2Dm ðA2Þ
The vapor shell is assumed to be in equilibrium with liquid of acomposition that is created by removal of DN1,2L moles, and a sim-plified vapor/liquid equilibrium relationship is assumed to apply,
y1 ¼Psat;1c1x1
PtotalðA3Þ
y2 ¼Psat;2c2x2
PtotalðA4Þ
where
x1 ¼N1
N1 þ N2ðA5Þ
Fig. 18. Evolution of diameter of individual gasoline droplets showing influence ofprior exposure to air at the indicated times (tevp).

782 Y.C. Liu, C.T. Avedisian / Combustion and Flame 159 (2012) 770–783
x2 ¼ 1� x1 ðA6Þ
The activity coefficients and Antoine constants in Eqs. (A3) and(A4) were obtained from [70] and [71], respectively. Ptotal is the to-tal vapor pressure (1 atm), and Psat,1,2 are the saturation of vaporpressures of components 1 and 2). In the far field, the vapor com-position will be different because of diffusion but the analysis con-cerns only the vapor in the immediate vicinity of the dropletsurface.
The droplet size decreases incrementally from Do by N1,2L–DN1,2L as Dm is progressively removed from the droplet. Time isbrought into the problem when the droplet diameter reaches aspecified diameter, here being 0.5 mm, when Eq. (A1) gives thecorresponding tevp for the chosen Do.
In the analysis, Dm = 10�7 g is much smaller than the mass of a0.5 mm diameter droplet (�10�5 g). This stepwise mass removalprocess proceeds until the targeted final diameter is reached. Atany step in the process,
N1;2 ¼q1;2V1;2
W1;2ðA7Þ
where
V1;2 ¼ /1;2 �pðDÞ3
6ðA8Þ
and
/1 ¼x1
x1 þ q1q2
W1W2ð1� x1Þ
ðA9Þ
Figure 17 shows the variation of predicted toluene and heptaneliquid mole fractions with tevp (the corresponding value of Do
comes from Eq. (A1)). The agreement with the measured dropletcomposition is good, considering the simplicity of this model.
Figure 18 shows the evolution of diameter of gasoline dropletsthat illustrates the effect of air exposure prior to droplets being ig-nited. The times shown in the inset represent the period of thedroplet on the fiber when it was evaporating in air prior to ignition.The initial diameter of the droplet (t/D2
o = 0) is also indicated. Theseinitial diameters were the result of larger droplets on the fiberevaporating to the indicated size (Fig. 13) before being ignited.The principle differences in the evaporation time appear to residein the droplet heating period. With prolonged devolitalization ofthe droplet by air exposure, the effect of heavier components leftbehind seems to increase the heating period. Once in the relativelysteady burning period, there is a slight decrease of burning ratewith increased waiting time. However, the gasoline burning rateseems not to be strongly affected by exposure to air in spite ofthe apparent removal of many constituents from the drop (seeFig. 16) at the times indicated in Fig. 18. The effect of pre-vaporiza-tion on the droplet composition and hence burning rate is, ofcourse, tied to the thermal properties of the mixture constituentsas noted in Section 3.2. The aggregate of these properties for gaso-line is evident that after 155 s and the associated vaporization thatoccurs over that time, the droplet composition seems largely toonly effect the initial heating period.
Appendix B. Property correlations
The property correlations used to estimate the parameters thatfactor into n for Eq. (2), namely the specific heats and thermal con-ductivities of the hydrocarbon gas, and the liquid densities at thehydrocarbon boiling points, are given in this appendix. The pri-mary source for the correlations is [62]. In what follows, the sub-script ‘‘i’’ denotes either heptane, iso-octane or toluene. Since thegas temperature varies over about a thousand degrees from thedroplet surface to the flame, a mean temperature is needed to esti-
mate the gas property since the interest is primarily to estimate nwhich comes from a constant property theory. We take the prop-erty temperature (Tp,i) to be
Tp;i ¼13
Tb;i þ23
Tf ;i ðB1Þ
as suggested in [51]. The flame temperature is not known so valuesbetween 1400 K and 2000 K were thought to be reasonable.
Once the hydrocarbon properties are evaluated, the gas specificheats and thermal conductivities were evaluated using simplemole fraction averages of the gas (assumed to be air) and fuelgas values as
kg ¼ xkg;i þ ð1� xÞkg;air ðB2Þ
and
Cpg ¼ xCpg;i þ ð1� xÞCp;air ðB3Þ
where ‘‘x’’ is the fuel mole fraction. The linear relationship of Eqs.(B2) and (B3) are not generally valid. However, according to [63]the approximation of Eq. (B2) allows Eq. (1) to predict burning rates.For present purposes we are only using Eq. (1) to explain qualitativetrends. Furthermore, since the value of x in Eqs. (B2) and (B3) is notknown ([63] recommends 0.4 for Eq. (B2) and 1 for Eq. (B3)) itmakes no sense to be more precise on mixing rules for gas propertypredictions when the assumptions of the classical droplet burningtheory are questionable in the first place. As a result we evaluatedproperties over the range 0 < x < 1.
For the hydrocarbon thermal conductivity (W/m K), the Roy/Thodos method as recommended by Reid et al. [62] is used:
kg;i ¼1Cið8:757ðe0:0464Tr;i � e�0:0412Tr;i Þ þ CifiÞ ðB4Þ
where
Ci ¼ 210Tc;iW
3i
p4c;i
!1=6
ðB5Þ
and
Tr;i ¼Tp;i
Tc;iðB6Þ
For iso-octane and heptane,
fi ¼ �0:152Tr;i þ 1:191T2r;i � 0:059T3
r;i ðB7Þ
and for toluene,
fi ¼ �0:354Tr;i þ 1:501T2r;i � 0:147T3
r;i ðB8Þ
For heptane and toluene
Ci ¼ 0:052Wi þ 0:00182W2i ðB9Þ
and for iso-octane, Ci = 28.07.For gas specific heat (J/kg K) [62]
Cpg;heptane ¼ �5:146þ0:6762Tp;i�3:651�10�4T2p;iþ7:658�10�8T3
p;i
� ��1000
Wi
ðB10Þ
Cpg;iso-octane ¼ �7:461þ 0:779Tp;i � 4:28� 10�4T2p;i þ 9:17� 10�8T3
p;i
� �� 1000
Wi
ðB11Þ

Y.C. Liu, C.T. Avedisian / Combustion and Flame 159 (2012) 770–783 783
and
Cpg;toluene ¼ �24:35þ 0:5125Tp;i � 2:765� 10�4T2p;i þ 4:911� 10�8T3
p;i
� �� 1000
Wi
ðB12Þ
The air specific heat (J/kg K) and thermal conductivity (W/m K)were computed from correlations developed from data reported inIncropera and DeWitt [56],
Cpg;air ¼ 860:68þ 0:04386Tp;i þ 0:00022465T2p;i þ 6:2921
� 10�8T3p;i ðB13Þ
and
kg;air ¼ 0:02408þ 2:7367� 10�5Tp;i þ 1:4866� 10�8T2p;i ðB14Þ
Liquid density (kg/m3) at the normal boiling point (1 atm) wasdetermined from the Tyn/Calus correlation [62],
qb;i ¼ 3508:8Wi
t1:048c;i
ðB15Þ
where tc,i is the molar volume (in cm3/mole) at the critical point asdetermined from values listed in Reid et al. [62]. The above correla-tions were used to develop Fig. 10 from Eq. (2).
References
[1] W.J. Pitz, N.P. Cernansky, F.L. Dryer, F.N. Egolfopoulos, J.T. Farrell, D.G. Friend,H. Pitsch, Society of Automotive Engineers Paper, SAE-2007-01-0175, 2007.
[2] P. Gokulakrishnan, G. Gaines, J. Currano, M.S. Klassen, R.J. Roby, J. Eng. GasTurb. Power 129 (2007) 655–663.
[3] H.R. Zhang, E.G. Eddings, A.F. Sarofim, Proc. Combust. Inst. 31 (2007) 401–409.[4] J.T. Farrell, N.P. Cernansky, F.L. Dryer, D.G. Friend, C.A. Hergart, C.K. Law, R.M.
McDavid, C.J. Mueller, A.K. Patel, H. Pitsch, Society of Automotive EngineersPaper, SAE-2007-01-0201, 2007.
[5] S.P. Heneghan, T.F. Williams, C.R. Martel, D.R. Ballal, J. Gas Turb. Power 115(1993) 480–484.
[6] S.P. Heneghan, S. Zabarnick, D.R. Ballal, W.E. Harrison III, J. Energy Resour.Technol. 118 (1996) 170–179.
[7] H.J. Curran, W.J. Pitz, C.K. Westbrook, C.V. Callahan, F.L. Dryer, Proc. Combust.Inst. 27 (1998) 379–387.
[8] T. Edwards, L.Q. Maurice, J. Propul. Power 17 (2001) 461–466.[9] J.A. Cooke, M. Bellucci, M.D. Smooke, A. Gomez, A. Violi, T. Faravelli, E. Ranzi,
Proc. Combust. Inst. 30 (2005) 439–446.[10] A.G. Kyne, P.M. Patterson, M. Pourkashanian, A. Williams, C.W. Wilson, in:
Proc. International Symposium on Air Breathing Engines, 14th, Florence, Italy,1999, pp. 377–387.
[11] A. Hakansson, K. Stromberg, J. Pedersen, J.O. Olsson, Chemosphere 44 (2001)1243–1252.
[12] R.A. Smith, C.P. Wood, G.S. Samuelsen, Paper No. AIAA-85-1311, in: AIAA/SAE/ASME/ASEE 21st Joint Propulsion Conference, Monterey, CA, July 8–10, 1985.
[13] B.A. Williams, Combust. Flame 124 (2001) 330–333.[14] S. Dooley, S.H. Won, M. Chaos, J. Heyne, Y. Ju, F.L. Dryer, K. Kumar, C.J. Sung, H.
Wang, M.A. Oehlschlaeger, R.J. Santoro, T.A. Litzinger, Combust. Flame 157(2010) 2333–2339.
[15] J.-Y. Ren, W. Qin, F.N. Egolfopoulos, T.T. Tsotsis, Combust. Flame 124 (2001)717–720.
[16] B.M. Gauthier, D.F. Davidson, R.K. Hanson, Combust. Flame 139 (2004) 300–311.[17] C.S. McEnally, L.D. Pfefferle, Combust. Flame 148 (2007) 210–222.[18] S.S. Vasu, D.F. Davidson, R.K. Hanson, Combust. Flame 152 (2008) 125–143.[19] B.L. Smith, T.J. Bruno, Ind. Eng. Chem. Res. 46 (2007) 310–320.[20] G.E. Bogin Jr., A. DeFilippo, J.Y. Chen, G. Chin, J. Luecke, M.A. Ratcliff, B.T. Zigler,
A.M. Dean, in: Western States Section Meeting of the Combustion Institute,Irvine, CA, October 26–27, 2009, Report No. NREL/CP-540-46738, May 2010.
[21] A.J. Marchese, F.L. Dryer, V. Nayagam, Combust. Flame 116 (1999) 432–459.[22] S. Kumar, A. Ray, S.R. Kale, Combust. Sci. Technol. 174 (2002) 67–102.[23] D.L. Dietrich, P.M. Struck, M. Ikegami, G. Xu, Combust. Theory Model. 9 (2005)
569–585.[24] K. Kroenlein, A. Kazakov, F.L. Dryer, in: Fall Technical Meeting, Eastern States
Section of the Combustion Institute, University of Virginia, 2007, Paper# A-24.
[25] V. Raghavan, D.N. Pope, D. Howard, G. Gogos, Combust. Flame 145 (2006) 791–807.
[26] G. Ben-Dor, T. Elperin, B. Krasovitov, Proc. Roy. Soc. Lond. A 459 (2003) 766–803.[27] M.A. Jog, P.S. Ayyaswamy, I.M. Cohen, J. Fluid Mech. 307 (1996) 135–165.[28] W.A. Sirignano, Fluid Dynamics and Transport of Droplets and Sprays,
Cambridge University Press, 1999.[29] M. Chaos, Z. Zhao, A. Kazakov, P. Gokulakrishnan, M. Angioletti, F.L. Dryer, in:
5th US National Combustion Meeting, 2007, Paper# E26.[30] M. Colket, T. Edwards, S. Williams, N.P. Cernansky, D.L. Miller, F. Egolfopoulos,
P. Lindstedt, K. Seshadri, F.L. Dryer, C.K. Law, D. Friend, D.B. Lenhert, H. Pitsch,A. Sarofim, M. Smooke, W. Tsang, AIAA Paper, 2007, AIAA-2007-0770.
[31] P.A. Glaude, V. Conraud, R. Fournet, F. Battin-Leclerc, G.M. Comet, G. Scacchi, P.Dagaut, M. Cathonnet, Energy Fuels 16 (2002) 1186–1195.
[32] Y. Ra, R.D. Reitz, Combust. Flame 158 (2011) 69–90.[33] J. Andrae, D. Johansson, Pehr Björnbom, Per Risberg, G. Kalghatgi, Combust.
Flame 140 (2005) 267–286.[34] N. Morgan, A. Smallbone, A. Bhave, M. Kraft, R. Cracknell, G. Kalghatgi,
Combust. Flame 157 (2010) 1122–1131.[35] K.-O. Lee, S.L. Manzello, M.Y. Choi, Combust. Sci. Technol. 132 (1998) 139–156.[36] G.S. Jackson, C.T. Avedisian, J.C. Yang, Int. J. Heat Mass Transfer 35 (1992)
2017–2033.[37] C.T. Avedisian, Soot formation in spherically symmetric droplet combustion,
in: Physical and Chemical Aspects of Combustion, Gordon and Breach Publ.,1997, pp. 135–160 (Chapter 6).
[38] G.S. Jackson, C.T. Avedisian, Proc. Roy. Soc. Lond. A 446 (1994) 255–276.[39] M.C. Hicks, V. Nayagam, F.A. Williams, Combust. Flame 157 (2010) 1439–1445.[40] C.T. Avedisian, B.J. Callahan, Proc. Combust. Inst. 28 (2000) 991–997.[41] J.H. Bae, C.T. Avedisian, Proc. Combust. Inst. 31 (2007) 2157–2164.[42] J.H. Bae, C.T. Avedisian, Combust. Flame 145 (2006) 607–620.[43] C.T. Avedisian, J.C. Yang, C.H. Wang, Proc. Roy. Soc. Lond. A 420 (1988) 183–
200.[44] M. Mikami, H. Oyagi, N. Kojima, M. Kikuchi, Y. Wakashima, S. Yoda, Combust.
Flame 141 (2005) 241–252.[45] K.L. Pan, J.W. Li, C.P. Chen, C.H. Wang, Combust. Flame 156 (2009) 1926–1936.[46] C. Chauveau, M. Birouk, I. Gökalp, Int. J. Multiphase Flow 37 (2011) 252–259.[47] B.D. Shaw, F.L. Dryer, F.A. Williams, J.B. Haggard Jr., Acta Astronaut. 17 (1988)
1195–2102.[48] G.S. Jackson, C.T. Avedisian, Int. J. Heat Mass Transfer 41 (1998) 2503–2515.[49] C. Dembia, Y.C. Liu, C.T. Avedisian, Image Vision Comput., 2011, submitted for
publication.[50] S.R. Turns, An Introduction to Combustion, second ed., McGraw-Hill, New York,
2000. pp. 376, 391, 651 (Table B2).[51] I. Glassman, Combustion, third ed., Academic Press, San Diego, 1987. pp. 270,
303, 307–309, 403.[52] G.S. Jackson, C.T. Avedisian, J. Propul. Power 16 (2000) 974–979.[53] G.A.E. Godsave, Nature 164 (1949) 708–709.[54] G.A.E. Godsave, Proc. Combust. Inst. 4 (1953) 818–830.[55] J.H. Bae, C.T. Avedisian, Proc. Combust. Inst. 32 (2009) 2231–2238.[56] F.P. Incropera, D.P. DeWitt, Introduction to Heat Transfer, fourth ed., Wiley,
New York, 2002. pp. 824, 831.[57] G.E. Youngblood, D.J. Senor, W. Kowbel, J. Webb, A. Kohyma, A. in: A.F.
Rowcliffe (Ed.), US DOE Office of Fusion Science, Washington, DC, 2000.;S.J. Zinkle, L.L. Snead, Thermophysical and Mechanical Properties of SiC/SiCComposites, Oak Ridge National Laboratory, 1998.
[58] A.J. Whittaker, M.L. Allitt, D.G. Onn, J.D. Bolt, in: C.J. Cremers, H.A. Fine (Eds.),Thermal Conductivity, vol. 21, 1990, pp. 187–198.
[59] C.K. Law, AIChE J. 24 (1978) 626–632.[60] B.D. Shaw, F.A. Williams, Int. J. Heat Mass Transfer 33 (1990) 301–317.[61] J.C. Yang, G.S. Jackson, C.T. Avedisian, Proc. Combust. Inst. 23 (1991) 1619–
1625.[62] R.C. Reid, J.M. Prausnitz, B.E. Poling, The Properties of Gases and Liquids, fourth
ed., McGraw-Hill, New York, 1987. pp. 53–55, 498–513, 703, 704, 709, 710,715, 716.
[63] C.K. Law, F.A. Williams, Combust. Flame 19 (1972) 393–405.[64] I. Aharon, B.D. Shaw, Microgravity Sci. Technol. X/2 (1997) 75–85.[65] D.R. Lide, Basic Laboratory and Industrial Chemicals: A CRC Quick Reference
Handbook, CRC Press, Boca Raton, 1993. pp. 153, 306, 322.[66] Mobil Oil Corp., Automotive Gasolines, Report No. 9130-00-142-9457. <http://
ww2.ramapo.edu/libfiles/HR/Environmental_Health_and_Safety/MSDS/Facilities/Plumbing/gasoline.pdf>.
[67] K. Okamoto, N. Watanabe, Y. Hagimoto, K. Miwa, H. Ohtani, J. Loss Prevent.Proc. 23 (2010) 89–97.
[68] S.S. Sazhin, A. Elwardany, P.A. Krutitskii, G. Castanet, F. Lemoine, E.M. Sazhina,M.R. Heikal, Int. J. Heat Mass Transfer 53 (2010) 4495–4505.
[69] C.K. Law, H.K. Law, AIAA J. 20 (1982) 522–527.[70] H.S. Myers, AIChE J. 3 (1957) 467–472.[71] H.H.Y. Chien, H.R. Null, AIChE J. 18 (1972) 1177–1183.[72] S. Tanaka, F. Ayala, J.C. Keck, J.B. Heywood, Combust. Flame 132 (2003) 219–
239.