A Comparison of Mercury Localization, Speciation, and .../67531/metadc115162/m2/1/high...Histology...
139
APPROVED: Aaron Roberts, Major Professor Matt Chumchal, Committee Member Duane Huggett, Committee Member Barney Venables, Committee Member Steve Wolverton, Program Coordinator Art Goven, Chair of the Department of Biological Sciences James D. Meernik, Acting Dean of the Toulouse Graduate School A COMPARISON OF MERCURY LOCALIZATION, SPECIATION, AND HISTOLOGY IN MULTIPLE FISH SPECIES FROM CADDO LAKE, A FRESH WATER WETLAND James Durward Smith, B.A., M.E.M. Dissertation Prepared for the Degree of DOCTOR OF PHILOSOPHY UNIVERSITY OF NORTH TEXAS May 2012
Transcript of A Comparison of Mercury Localization, Speciation, and .../67531/metadc115162/m2/1/high...Histology...

APPROVED: Aaron Roberts, Major Professor Matt Chumchal, Committee Member Duane Huggett, Committee Member Barney Venables, Committee Member Steve Wolverton, Program Coordinator Art Goven, Chair of the Department of
Biological Sciences James D. Meernik, Acting Dean of the
Toulouse Graduate School
A COMPARISON OF MERCURY LOCALIZATION, SPECIATION, AND HISTOLOGY IN MULTIPLE
FISH SPECIES FROM CADDO LAKE, A FRESH WATER WETLAND
James Durward Smith, B.A., M.E.M.
Dissertation Prepared for the Degree of
DOCTOR OF PHILOSOPHY
UNIVERSITY OF NORTH TEXAS
May 2012

Smith, James Durward, A Comparison of Mercury Localization, Speciation, and Histology
in Multiple Fish Species from Caddo Lake, a Fresh Water Wetland. Doctor of Philosophy
(Environmental Science), May 2012, 129 pp., 8 Tables, 39 Figures, references, 122 titles.
This work explores the metabolism of mercury in liver and spleen tissue of fish from a
methylmercury contaminated wetland. Wild-caught bass, catfish, bowfin and gar were
collected. Macrophage centers, which are both reactive and primary germinal centers in various
fish tissues, were hypothesized to be the cause of demethylation of methylmercury in fish
tissue. Macrophage centers are differentially expressed in fish tissue based on phylogenetic
lineage, and are found primarily in the livers of preteleostean fish and in the spleen of
teleostean fish. Histology of liver and spleen was examined in both control and wild-caught fish
for pathology, size and number of macrophage centers, and for localization of mercury. Total
mercury was estimated in the muscle tissue of all fish by direct mercury analysis. Selenium and
mercury concentrations were examined in the livers of wild-caught fish by liquid introduction
inductively coupled plasma mass spectrometry (ICP-MS). Total mercury was localized in
histologic sections by laser ablation ICP-MS (LA-ICP-MS). Mercury speciation was determined
for inorganic and methylmercury in liver and spleen of fish by bas chromatography-cold vapor
atomic fluorescence spectroscopy (GC-CVAFS).
Macrophage center tissue distribution was found to be consistent with the literature,
with a predominance of centers in preteleostean liver and in spleens of teleostean fish. Little
evidence histopathology was found in the livers or spleens of fish examined, but differences in
morphology of macrophage centers and liver tissue across species are noted. The sole sign of
liver pathology noted was increased hepatic hemosiderosis in fish with high proportions of liver

inorganic mercury. Inorganic mercury was found to predominate in the livers of all fish but
bass. Organic mercury was found to predominate in the spleens of all fish. Mercury was found
to accumulate in macrophage centers, but concentrations of mercury in this compartment were
found to vary less in relation to total mercury than hepatocyte mercury. No association was
found between selenium content and inorganic mercury proportions. Overall, findings from this
study to not support a primary role for macrophage centers in the demethylation of
methylmercury in fish tissues.

ii
Copyright 2012
by
James Durward Smith

iii
ACKNOWLEDGEMENTS
I would like to thank Dr. Jennifer Schulmeier and the staff at Dermatopathology
Associates, Jackson MS, for their contribution of slide making equipment, slide preparation
expertise, and expertise in histologic examination. Thanks to Dr. Chad Hammerschmidt at
Wright State University, Dayton OH, for his contribution of equipment, expertise, and time in
the analysis and preparation of samples for mercury speciation analysis. I am grateful to Dr.
Guido Verbeck, at UNT Laboratory of Imaging Mass Spectrometry, for his contribution of
equipment, software, advice, and expertise in analysis and imaging of mercury and selenium in
tissue, and to his team including: Billy Hoffman and Casey Thurber for hours of support and
advice with the LA‐ICP‐MS. Special thanks to Rickey Campbell and the crew at Private John Allen
National Fish Hatchery in Tupelo, MS for their kind donation of fish, time, and advice on
restaurants in Tupelo.
I would like to than my fellow students: Brian Matherne for his constant cheerfulness,
enthusiasm, and support in sampling and total mercury analysis, Deanne Blake for support in
fieldwork, tissue processing, and patience with my grouchiness from lack of sleep, and Lucas
Driver and Greg McMichael for their tireless work and expertise in fish collection and fieldwork.
I am very grateful to the members of my committee: Dr. Aaron Roberts for his advice,
enthusiasm, expertise, and unfailing support throughout my time at UNT, Dr. Mathew
Chumchal for his support in fieldwork and total mercury analysis, and for teaching me to
electrofish, Dr. Barney Venables for great advice, enthusiasm, and interest in the findings and
scientific curiosity, and Dr. Duane Huggett for making me think outside the box and for
suggesting alternative explanations for observations.

iv
TABLE OF CONTENTS
Page ACKNOWLEDGEMENTS ................................................................................................................... iii LIST OF TABLES ................................................................................................................................ vi LIST OF ILLUSTRATIONS.................................................................................................................. vii Chapters
1. GENERAL INTRODUCTION ....................................................................................... 1
1.1 Overview of Mercury Metabolism in Animal Tissues ................................. 3
1.2 Melanomacrophages .................................................................................. 6
1.3 Conclusion ................................................................................................. 12 2. HISTOLOGY AND HISTOPATHOLOGY OF FISH EXPOSED TO MERCURY IN CADDO
LAKE ...................................................................................................................... 18
2.1 Introduction .............................................................................................. 18
2.2 Materials and Methods ............................................................................. 20
2.2.1 Fish Collection and Tissue Processing ........................................... 20
2.2.2 Tissue Mercury Analysis ................................................................ 21
2.2.3 Histologic Examination ................................................................. 24
2.2.4 Image Analysis............................................................................... 26
2.3 Results ....................................................................................................... 26
2.3.1 Muscle Total Mercury Analysis ..................................................... 26
2.3.2 Liver Total Mercury by ICP‐MS ..................................................... 27
2.3.3 Histologic Analysis ......................................................................... 28
2.3.4 Relationship between Macrophage Center Area and Mercury.... 51
2.4 Discussion.................................................................................................. 53 3. THE ROLE OF MACROPHAGE CENTERS IN MERCURY METABOLISM OF FISH:
EVIDENCE FROM LIVER AND SPLEEN .................................................................... 60
3.1 Introduction .............................................................................................. 60
3.2 Materials and Methods ............................................................................. 62

v
3.2.1 Fish Tissue Collection .................................................................... 62
3.2.2 Preparation of Histologic Slides .................................................... 63
3.2.3 Image Analysis............................................................................... 64
3.2.4 Laser Ablation ICP‐MS Analysis ..................................................... 64
3.3 Results ....................................................................................................... 68
3.3.1 Image Analysis............................................................................... 68
3.3.2 Mercury Localization by ICP‐MS ................................................... 71
3.3.3 Liver Total Mercury ....................................................................... 78
3.4 Discussion.................................................................................................. 80 4. MERCURY SPECIATION AND SELENIUM TO MERCURY RATIO OF TELEOSTEAN
AND PRETELEOSTEAN FISH FROM CADDO LAKE .................................................. 84
4.1 Introduction .............................................................................................. 84
4.2 Materials and Methods ............................................................................. 87
4.2.1 Fish Collection and Processing ...................................................... 87
4.2.2 Determination of Tissue Mercury ................................................. 88
4.3 Results ....................................................................................................... 91
4.3.1 Mercury Speciation in Liver and Spleen Tissues ........................... 91
4.3.2 Total Mercury and Selenium Analysis in Liver .............................. 97
4.4 Discussion................................................................................................ 102 5. GENERAL DISCUSSION......................................................................................... 110
REFERENCES ................................................................................................................................ 120

vi
LIST OF TABLES
Page 1.1 Fish Taxonomy, Phylogenetic Group, Tissues, and Analyses for Proposed Sampling ...... 15
2.1 Mean and Standard Deviations of Wet and Dry Weight Muscle Tissue Total Mercury ... 27
2.2 Analytical Results for ICP‐MS Estimates of Liver Mercury in Caddo Fish (Mean, SD) ...... 28
2.3 Hepatic Hemosiderin Score for Caddo Fish ...................................................................... 50
2.4 Number and Total Size of Macrophage Centers in Liver of Caddo Fish (Mean + SD) ...... 51
3.1 Number and Total Size of Macrophage Centers in Liver and Spleen (Mean + SD) .......... 68
4.1 Caddo Tissue Total Mercury and Methylmercury Content (Mean + SD, n = 3 all groups) ........................................................................................................................................... 91
4.2 Selenium to Mercury Ratios by Fish Species .................................................................. 102

vii
LIST OF ILLUSTRATIONS
Page
1.1 Total mercury in fish muscle from Caddo Lake Texas (Mean+SD) ................................... 11
2.1 Melanomacrophages in bass liver and spleen .................................................................. 30
2.2 Catfish liver histology ........................................................................................................ 32
2.3 Catfish spleen histology .................................................................................................... 33
2.4 Gar liver and spleen histology .......................................................................................... 35
2.5 Bowfin histology: liver and spleen .................................................................................... 37
2.6 Caddo catfish H&E and melanin bleach of liver macrophage centers ............................. 40
2.7 Caddo gar and bowfin H&E and melanin bleach of liver macrophage centers ................ 41
2.8 PAS staining of livers of Caddo fish and positive control ................................................. 43
2.9 PAS staining of bowfin and bass liver macrophage centers ............................................. 44
2.10 Prussian blue of positive control and bass liver macrophages ......................................... 47
2.11 Prussian blue of catfish liver macrophage centers and catfish hepatic hemosiderosis ... 48
2.12 Prussian blue stain of bowfin liver macrophages and hepatic hemosiderosis ................. 49
2.13 Association between total liver mercury concentration and macrophage center area in Caddo fish (R2 values for linear regression) ..................................................................... 52
3.1 Example of mercury signal in Caddo gar MC liver ............................................................ 66
3.2 Average number of macrophage centers in livers and spleens of Caddo fish (n=5 for each group) (Mean + SD) ........................................................................................................... 69
3.3 Percentage areas of macrophage centers in liver and spleen of Caddo fish (n=5 for all groups) (Mean + SD) ......................................................................................................... 70
3.4 Ratio of macrophage mercury to adjacent hepatocyte mercury in bowfin test by LAICP‐MS (Mean + SD) ...................................................................................................... 72
3.5 Comparison of bass macrophage center and adjacent hepatocyte total mercury (Mean + SD) ..................................................................................................................................... 74

viii
3.6 Comparison of catfish macrophage center and adjacent hepatocyte total mercury (Mean + SD) .................................................................................................................................. 75
3.7 Comparison of bowfin macrophage center and adjacent hepatocyte total mercury (Mean + SD) ....................................................................................................................... 75
3.8 Comparison of gar macrophage center and adjacent hepatocyte total mercury (Mean + SD) ..................................................................................................................................... 76
3.9 Mercury signal in macrophage centers of fish from Caddo Lake (Mean + SD) ................ 77
3.10 Mercury signal in hepatocytes of fish from Caddo Lake .................................................. 77
3.11 Comparison of macrophage to hepatocyte total mercury in Caddo fish livers (Mean + SD) ........................................................................................................................................... 78
3.12 Total liver mercury estimated by liquid introduction ICP‐MS (Mean + SD) ..................... 79
3.13 Total mercury relationship to localization ratio ............................................................... 79
4.1 Liver total mercury (Mean + SD, n =3 for all groups) ........................................................ 92
4.2 Liver methylmercury (Mean + SD, n=3 for all groups) ...................................................... 93
4.3 Liver percent of total mercury as methylmercury (Mean + SD, n=3 for all groups)......... 94
4.4 Spleen total mercury (Mean + SD, n=3 for all groups) ..................................................... 95
4.5 Spleen methylmercury (Mean + SD, n=3 for all groups)................................................... 96
4.6 Spleen percent of total mercury as methylmercury (Mean + SD, n=3 for all groups) ..... 97
4.7 Fish liver mercury (Mean + SD, n) ..................................................................................... 98
4.8 Fish liver selenium (Mean + SD, n) .................................................................................... 98
4.9 Ratio of selenium to mercury (Mean + SD, n) .................................................................. 99
4.10 Association between selenium and mercury levels ....................................................... 100
4.11 Association of gar liver selenium and total mercury ...................................................... 101
5.1 Association of muscle to liver ratio and percent of liver inorganic mercury in bass, gar, and catfish ....................................................................................................................... 117

1
CHAPTER 1
GENERAL INTRODUCTION
Mercury is a widespread contaminant that impacts the health of human populations
and ecosystems. It is found in both inorganic and organic compounds, is environmentally
persistent, and biomagnifies in the food chain (NRC, 2000). Estimates of annual mercury
releases suggest that up to two‐thirds of all mercury deposition is the result of human activities
such as the burning of fossil fuels and is especially associated with the burning of coal (ATSDR,
1999). Mercury released from fossil fuel combustion exists in the atmosphere as metallic
mercury (Hg0) and, due to its half‐life of 1‐2 years, can travel great distances before it becomes
oxidized, associates with water droplets or particulates, and is deposited on the earth’s surface.
The rate of atmospheric deposition of mercury is likely to increase in the future as the demand
for, and use of, fossil fuels increases among developing nations. Deposition of atmospherically
released mercuric mercury can contaminate lakes and streams where microorganisms in the
water and soil convert it to methylmercury (Morel, Karaepiel, & Amyot, 1998; Ullrich, Tanton, &
Abdrashitova, 2001).
EPA estimates that over 90% of mercury in edible fish tissue is in the form of
methylmercury based on the Mercury Study Report to Congress (USEPA, 1997), and total
mercury is routinely used as a surrogate for methylmercury in fish tissues and seafood. USEPA
Water Quality Criteria are based on fish tissue concentrations since this route is expected to
define the dominant human exposure pathway; other routes of exposure are estimated to be
negligible (Borum, Manibusan, Schoeny, & Winchester, 2001; NRC, 2000). Methylmercury is
much more bioavailable from oral exposures than are other forms of mercury and it

2
accumulates in the brain and other tissues (ATSDR, 1999; USEPA, 1987, 1997). A USEPA review
suggests that only about 7% of orally ingested inorganic mercury is absorbed (USEPA, 1987,
1997) while virtually all orally ingested methylmercury is absorbed (USEPA, 1997).
In humans, mercury accumulates in the brain and kidney where it can cause permanent
damage. It is of special concern to children and to pregnant women. Children born to exposed
mothers can have effects ranging from small reductions in IQ at low chronic exposures, to
delays in reaching developmental milestones and mental retardation at higher chronic doses
(ATSDR, 1999). The RfD of 0.0001 mg/kg/day for methylmercury is based on human
epidemiological studies in which developmental and neuropsychological impairment was
observed for maternal daily intakes of 0.857‐ 1.472 g/kg/day and was derived using
benchmark dose methodology (IRIS, 2002).
In fish, mercury is thought to accumulate in kidney, muscle, and liver resulting in signs of
necrosis with inflammatory infiltrate (Mela et al., 2007b), apoptosis with upregulation of
apoptotic signaling pathway genes, and lesions in Disse’s space of the liver (Klaper et al., 2008).
Methylmercury exposure in fish has been shown to impair coordination and swimming activity
(Crump & Trudeau, 2009) which can reduce species fitness by reducing successful hunting,
evasion of predation, and mating behaviors (Sandheinrich & Miller, 2006). Environmentally
relevant concentrations of mercury have been shown to impair reproduction in fish and are
thought to act through induction of apoptosis in steroidogenic cells and/or through disruption
of the hypothalamic‐pituitary‐gonadal axis (Crump & Trudeau, 2009; Drevnick et al., 2008;
Drevnick & Sandheinrich, 2003; Drevnick, Sandheinrich, & Oris, 2006; Vieira, Gravato, Soares,
Morgado, & Guilhermino, 2009).

3
Biomagnification of methylmercury in fish translates to greater risk to organisms that
feed at higher levels of the food chain. Mercury concentrations in birds have been found to be
highest in those species that eat fish and other birds. In mammals, the highest concentrations
of mercury in tissues have been found in marine pinnipeds and other piscivorous species (Eisler,
1987). Among fur‐bearing mammals, those that feed on fish have higher levels of mercury than
herbivorous species (Eisler, 1987). The distribution of mercury species in fish tissues, and thus
its bioavailability, directly affects the risk to species of higher trophic levels and can significantly
impact whole ecosystem health.
Emerging evidence suggests that demethylation of methylmercury may be occurring in
some animal species, most notably species of birds, mammals, and fish. It is not known how
demethylation of methylmercury may affect the toxicokinetics and toxicodynamics of organic
mercury. Some evidence exists for the sequestration of mercury in the livers of animals (Eagles‐
Smith, Ackerman, Yee, & Adelsbach, 2009; Palmisano, Cardellicchio, & Zambonin, 1995), and
this may protect other organs, such as brain and gonads, from mercury‐mediated damage. In
light of this evidence, assumptions about forms of mercury in fish tissue call current ecological
and human health risk assessment practices into question. Continued contamination of aquatic
systems by mercury makes the development of realistic estimates for risk to ecosystem and
human health from fish consumption imperative.
1.1 Overview of Mercury Metabolism in Animal Tissues
Orally absorbed methylmercury is first transferred to the blood where it is associated
with the red blood cell. From the blood, mercury moves rapidly to the viscera and is slowly
transported out of the viscera to the muscle tissue, where long‐term storage occurs, probably

4
as mercurial amino acids incorporated into proteins (Leaner & Mason, 2004; McCloskey,
Schultz, & Newman, 1998; Schultz & Newman, 1997). High concentrations of inorganic mercury
have been found in liver and kidney of fish and are thought to be organs that are active in the
metabolism of organic mercury to inorganic mercury (Kasper et al., 2009). The elimination half‐
life of methylmercury from tissues has been shown to be much higher than that of inorganic
mercury (Kehrig et al., 2009; M. Nigro, Campana, Lanzillotta, & Ferrara, 2002; Vahter et al.,
1995) and so the mobility of the pool of inorganic mercury from tissues is likely to be very low.
Demethylation of methylmercury has been shown to occur in many if not all species, but
is very slow in most species (Yasutake & Hirayama, 2001). Orally absorbed methylmercury is
first transferred to the blood where it is associated with the red blood cell. From the blood,
mercury moves rapidly to the viscera and is slowly transported out of the viscera to the muscle
tissue, where long‐term storage occurs, probably as mercurial amino acids incorporated into
proteins (Leaner & Mason, 2004; McCloskey, et al., 1998; Schultz & Newman, 1997).
In most species, methylmercury reacts with glutathione in the liver and is transported
into the bile canaliculus and out into the large intestine. Glutathione conjugated
methylmercury can be reabsorbed in the enterohepatic circulation or can be demethylated by
bacteria in the gut. Mercury demethylated in the gut by bacteria is very poorly reabsorbed and
virtually all of this is lost to the feces. Almost all mercury found in feces is inorganic (Engström
et al., 2008).
It is widely accepted that selenium has a protective effect against mercury toxicity, but
the underlying mechanisms for this protective effect are not known. Different studies have
found selenium exposure to increase mercury elimination but in others to be without effect.

5
Recently, high selenium diets, have been found to decrease assimilation efficiency in fish orally
exposed to inorganic mercury, but not organic mercury (Dang & Wang, 2011). In the rat, co‐
administration of methylmercury and selenium has been found to decrease biliary mercury
elimination (Urano, Imura, & Naganuma, 1997). Increased levels of mercury have also been
associated with increased selenium in mammalian and bird tissues, and selenium:mercury
ratios of 1:1 have been specifically linked to increased demethylation (Eagles‐Smith, et al.,
2009; J. Yang, Kunito, Tanabe, & Miyazaki, 2007; Yoneda & Suzuki, 1997). Ratios of mercury and
selenium with selenium in molar excess have been associated with those individuals below the
threshold for demethylation, while 1:1 or even mercury excess have been associated with
demethylation (Eagles‐Smith, et al., 2009). However, it has been suggested that this 1:1 ratio is
more appropriately associated with selenium:inorganic mercury than total mercury.
Detoxification is thought to culminate in the formation of complexes of inorganic mercury
bound with selenoproteins or selenium salts in crystals (Khan & Wang, 2009; J. Yang, et al.,
2007). Selenoproteins include the important antioxidant protein glutathione peroxidase which
is upregulated in oxidative stress (Reeves & Hoffmann, 2009).
Mercury demethylating enzymes similar to those found in bacteria have not been found
in vertebrates. Demethylation of mercury in animals is thought to occur through a free radical
mechanism (Gailer et al., 2000). Methymercury has been found to be demethylated by reactive
oxygen species (specifically superoxide) in liver Kupfer cells, lymph nodes, and in macrophage‐
rich parts of the spleen (Havarinasab, Björn, Nielsen, & Hultman, 2007). The respiratory burst is
an important immune function of phagocytic cells that produces superoxide to destroy foreign
cells. Ethyl‐ and methylmercury have been shown to be degraded to inorganic mercury in

6
human, rat, and rabbit polymorphonuclear leukocytes and ethylmercury is degraded in guinea
pig macrophages and human monocytes (Suda, Totoki, Uchida, & Takahashi, 1992). Blockade of
the reticuloendothelial system in the rat has been shown to inhibit biotransformation of
methylmercury to inorganic mercury (Suda & Takahashi, 1990). This leads to the possibility that
a large proportion of mercury demethylation in tissues may be due to the action of
macrophages and other phagocytes.
Additional support for the involvement of macrophages in the demethylation of
methylmercury is lent by mechanistic data. Mercury is known to increase intercellular levels of
calcium and this effect leads to the well documented mercury‐mediated apoptosis and necrosis
(S. H. Kim & Sharma, 2004). Increased intercellular calcium can lead not only to deregulation of
the electron transport system and production of oxidative and pro‐apoptotic signals in the cell,
but is known to mediate the respiratory burst in macrophages and other phagocytic cells
(Hotchkiss, Bowling, Karl, Osborne, & Flye, 1997; Iles & Forman, 2002; S. H. Kim & Sharma,
2004). Exposure of human neutrophils to mercury has been shown to induce the respiratory
burst (Jansson & Harms‐Ringdahl, 1993) and fail to do so at subtoxic doses (Freitas, Lima, Porto,
& Fernandes, 2010). The lack of respiratory burst in phagocytic cells at low dose may at least
partially explain the observation of a dose threshold for mercury demethylation (Eagles‐Smith,
et al., 2009).
1.2 Melanomacrophages
Melanomacrophages have been used as biomarkers of general pathology (Hartley,
Thiyagarajah, & Treinies, 1996; Wolke, 1992) but are also thought to occur in certain tissues as
non‐pathologic germinal centers of fixed macrophages (C Agius, 1980; C Agius & Roberts,

7
2003a). In fish, melanomacrophages appear to follow an evolutionary pattern in distribution
and degree of organization with a trend from random distribution and low levels of
organization in Condrichthyes and Agantha, to highly organized structures in the liver of the
primitive bony fish, and finally to well‐organized structures in the spleens and kidney of the
Teleosts (C Agius, 1980).
Very little is known about the function and normal structure of melanomacrophages in
fish. Some sources claim that melanomacrophages are not phagocytic (Koppang, Fischer, Satoh,
& Jirillo, 2007), while other studies show uptake of colloidal carbon that seems to indicate
active phagocytosis (Adedeji & Kakulu, 2011). The literature suggests that melanomacrophages
produce respiratory burst, and this is supported by the finding of hemosiderin, lipofuscin, and
ceroid in melanomacrophage centers (MMCs) (Wolke, 1992). In Caddo Lake, a freshwater
wetland in Texas, increasing concentrations of hepatic mercury have been observed correlate
with increasing numbers of melanomacrophages and increased tissue pathology in the form of
darkening of gross liver (B. Barst et al., 2011).
Caddo lake is a freshwater reservoir that spans the Louisiana and Texas border, and is
reported to have among the highest levels of mercury in fish in the state of Texas (TCEQ, 2004).
The Texas side of Caddo lake is primarily shallow forested wetland while the Louisiana side is a
more open water habitat. The mercury levels in fish are significantly higher on the wetland side
of the lake than the open water side of the lake (Chumchal MM, Drenner RW, Fry B, Hambright
KD, & LW, 2008). The top fish predators in this ecosystem include spotted gar (Lepisosteus
oculatus) and largemouth bass (Micropterus salmonides). Largemouth bass belong to the
Teleostei, or modern fish, while spotted gar belong to a more primitive preteleostean group.

8
Recent mercury speciation data from livers of spotted gar and largemouth bass from Caddo
lake show a pattern of the predominance of inorganic mercury in the liver of preteleostean gar
(98% of total mercury), while in teleostean bass liver, methylmercury was found to dominate
(74% of total mercury) (M. M. Chumchal et al., 2011). Spotted gar also show much higher total
levels of mercury (30,171+12,377 ng/g) in liver tissue than do largemouth bass (977+154 ng/g)
(M. M. Chumchal, et al., 2011). Melanomacrophage centers (MMCs) are found mostly in the
livers of gar while those in bass occur mostly in spleen and kidney (C Agius, 1980).
Extreme differences in mercury form and concentration in the livers of spotted gar and
largemouth bass may result from (1) prehepatic, (2) hepatic, and (3) posthepatic differences in
mercury toxicokinetics. Potential prehepatic mechanisms include a high oral exposure of
spotted gar to inorganic mercury over that to largemouth bass. Methylmercury exposure in fish
is primarily through diet and so feeding behaviors and trophic level are primary determinants of
exposure. Largemouth bass and spotted gar from Caddo Lake have been shown to occupy
similar trophic levels through the use of stable nitrogen isotopic ratios (Chumchal MM &
Hambright KD, 2009). One primary determinant of mercury concentration in fish is stable
nitrogen isotopic ratios, with higher trophic levels correlating with higher 15N (Cabana &
Rasmussen, 1994), which itself correlates with mercury content of fish tissues (Boudou &
Ribeyre, 1997; K. Kidd, Hesslein, Fudge, & Hallard, 1995).
Species feeding at the same trophic level may eat different prey items. Some studies
have also found that the nature of the base of the food chain from which organisms are feeding
affects mercury concentration. This can be estimated through the measuring of the ratios of
carbon stable isotopic ratios ( 13C and 12C). High 12C correlates with feeding from a food

9
chain based in phytoplankton, while high 13C indicates a carbon source in periphyton (France,
1995; Hecky & Hesslein, 1995). Phytoplankton based food webs have associated with higher
mercury concentrations when compared with same trophic level species that feed on
periphyton‐based communities (Gorski, Cleckner, Hurley, Sierszen, & Armstrong, 2003; K. A.
Kidd, Bootsma, Hesslein, Lyle Lockhart, & Hecky, 2003; Power, Klein, Guiguer, & Kwan, 2002).
Work at Caddo Lake has failed to show stable carbon isotopic ratios as significant determinants
of mercury concentrations in fish tissues (Chumchal MM & Hambright KD, 2009).
The current study is primarily concerned with mercury speciation. Spotted gar and
largemouth bass both occupy the top of the food chain in Caddo Lake, as evidenced by stable
nitrogen ratio. Trophic transfer rates of inorganic and organic mercury for whole experimental
food chains from primary producers to terminal consumers show have been shown to be quite
different, with 1.3% for inorganic mercury and 87% for MeHg. Even lower trophic level transfers
have been shown to favor transfer of methylmercury, with 6% of inorganic mercury transferred
between contaminated algae and Daphnia magna and 58% of MeHg being transferred under
the same conditions. This suggests that the form of mercury to which both bass and gar can be
expected to be exposed to from dietary sources will be predominantly methylmercury (Boudou
& Ribeyre, 1997). Similar trophic level predicts that the fraction of organic and inorganic
mercury from dietary sources should be the same for both gar and bass. This makes the
prehepatic explanation for increased gar inorganic mercury levels unlikely.
Absorption of inorganic mercury from the gut following excretion of methylmercury‐
glutathione conjugates from the liver is a possible posthepatic mechanism of increased liver
inorganic mercury. In this proposed mechanism, excretion of methylmercury‐glutathione

10
conjugates occurs normally, bacteria in the gut convert organic mercury to inorganic mercury,
and the inorganic mercury is reabsorbed. For this mechanism to be plausible, reabsorption of
inorganic mercury would need to be enhanced beyond the reported 7% efficiency (USEPA,
1987, 1997). There is no known evidence for such a mechanism and no theoretical support for
such a mechanism.
Hepatic mechanisms appear to be the best candidates to explain the observed
differences in liver mercury speciation and concentration between spotted gar and largemouth
bass in Caddo Lake. Animal tissues are thought to demethylate methylmercury at a slow rate
and enrichment of inorganic mercury may occur in the liver through selective binding of
inorganic mercury to selenoproteins. Excessive sequestration of mercury in the gar liver tissue
compartment over long periods of time could account for high proportions of inorganic
mercury and retention of high concentrations of total mercury in spotted gar liver over
largemouth bass liver.
Methylmercury excretion from the body is through glutathione conjugation and
excretion into the bile. Decreased rate of conjugation for methylmercury, decreased levels of
hepatic glutathione, or decreased transport of conjugated methylmercury out of the
hepatocyte and into the bile, could all increase methylmercury levels in the liver and through
slow demethylation, inorganic mercury could build up in hepatic tissue over time. Decreased
hepatic excretion of methylmercury would be expected to result in increased levels of total
mercury in muscle tissue over time, since muscle is a major long‐term storage depot for organic
mercury that enters the systemic circulation from the liver. However, muscle tissue from

11
spotted gar and largemouth bass sampled from Caddo Lake show no significant differences in
total mercury concentration within habitats (Figure 1.1; data from Chumchal et al. 2011).
Figure 1.1. Total mercury in fish muscle from Caddo Lake Texas (Mean+SD). a, b, c: Letters show groups that are statistically indistinguishable. The finding of indistinguishable concentrations of total mercury in muscle in largemouth bass
and spotted gar but liver concentrations that vary by a factor of thirty is not consistent with the
pattern expected in the hepatic mechanism of reduced methylmercury secretion.
Another potential explanation for the increased proportion of inorganic mercury and
the higher overall level of total mercury in the livers of spotted gar is differences in metabolism
between the two species. Histologic analysis of the tissues of gar and bass from Caddo lake
show large differences in the types of cells in residence. Spotted gar show significant brown‐
0
500
1000
1500
2000
2500
3000
3500
4000
4500
5000
Total M
ercury in
Muscle Tissue (ng Hg/g Muscle)
Largemouth Bass
Spotted Gar
Open Water Region Wetland Region
n =11
n =6
n =13
n =5
n =11
n =6
n =13
n =5
n =11
n =6
n =13
n =5
a
b,c
b
a,c

12
black centers that tend to be associated with perivascular spaces and surrounded by normal
liver tissue. The centers are not found in any of the bass sampled from the lake but can
constitute up to 30% of the surface of histologic liver sections in the spotted gar (unpublished
data). These brown‐black masses have been identified through differential staining to be
melanomacrophage centers. The association of free radical formation in the
melanomacrophage centers, demethylation of mercury in macrophage rich tissues of
mammals, accumulation of mercury in melanomacrophage centers in spotted gar from Caddo
lake, and the observation of enhanced ratios of inorganic mercury in the liver of preteleostean
gar over the more “advanced” teleostean bass may all point to evolutionary differences in the
location of macrophage hematopoietic centers leading to differences in tissue demethylation of
mercury.
1.3 Conclusion
The purpose of environmental risk assessment is to predict the probability of significant
changes in the health of individual humans or populations in ecosystems. Mercury
contamination of aquatic systems is unlikely to improve in the near future, and with continued
input from developing nations into the global pool, is in fact likely to worsen. The metabolism
of mercury in animal tissues from organic to inorganic forms has implications for the fate of
mercury in foodwebs as well as toxicity to organisms. Knowledge of the mechanism of this
metabolic activity gives us the ability to predict the extent to which populations of organisms
within specific ecosystems may metabolize methylmercury allowing greater predictive power
for the assessment of potential impacts from mercury contamination.

13
The purpose of this research was to identify possible links between observations of large
differences in mercury speciation in organs of fish from different species and the presence in
those tissues of phagocytes. In particular the phagocytes of interest were suspected to
melanomacrophages which follow a phylogenetic distribution in tissue of residence and tend to
be found in the liver of primitive fish, and in spleen and kidney of modern fish. Findings of the
involvement of this cell type as a predictor of the extent of mercury metabolism may also
support the role of other, similarly acting, immune cells such as the granulocytes in mercury
metabolism.
This work posits five hypotheses:
Hypothesis I: Methylmercury demethylation is much more active in the liver of preteleostean
fish than teleostean fish.
Hypothesis II: Methylmercury demethylation is much more active in the spleen of teleostean
fish than in preteleostean fish.
Hypothesis III: The organic:inorganic mercury ratio is higher in tissue and fish with high
abundance of tissue macrophages.
Hypothesis IV: Tissue mercury levels are higher in areas of MMCs and deposits than in
surrounding parenchyma.
Hypothesis V: In the tissue of active methylmercury demethylation, increased levels of
histopathology will be found.
These hypotheses led to the design of this research which is detailed in Objectives I, II, and III.
Objective I: Determine the Phylogenetic and Tissue Distribution of Mercury Demethylation

14
Hypothesis I: Methylmercury metabolism is much more active in the liver of preteleostean fish
than teleostean fish.
Hypothesis II: Methylmercury metabolism is much more active in the spleen and kidneys of
teleostean fish than in preteleostean fish.
Approach: Sampling of preteleostean and teleostean fish species was carried out at Caddo Lake,
Texas. As noted above, according to the literature tissue MMCs are most prevalent in the livers
of preteleostean fish, while those same hematopoietic centers are localized in the liver and
spleen of teleostean fish. Caddo Lake was chosen due to its level of mercury contamination,
familiarity with the lake and working relationship with the Caddo Lake Institute, preliminary
data associated with populations from this body of water, the presence of diverse fish species
spanning the phylogenic groups, and the characteristics of local fishery use that potentially
impact human health.
Caddo Lake has many preteleostean fish which include lampreys (Agnatha), paddlefish
(Chondrostei), several species of gar (preteleostean Neopterygii), and bowfin (preteleostean
Neopterygii). At least 14 families of Teleosti have also been identified from the lake, including
the primitive teleostean freshwater eels (Hubbs 2002). Paddlefish, bowfin, and gar have been
found to have large numbers of MMCs in their livers with few in spleen and kidney.
Targeted sampling of fish species representing teleostean (largemouth bass and channel
catfish) and preteleostean (spotted gar and bowfin) fish was carried out (Table 1.1). Mercury
concentrations and speciation were determined in each of the sampled tissues using a
combination of direct mercury analysis (DMA) for muscle tissue estimates, liquid digestion
ICP/MS for estimates of mercury and selenium concentrations in liver, and gas chromatography

15
cold vapor atomic fluorescence spectroscopy (GC/CV/AFS) for mercury speciation in liver and
spleen tissues. Histologic sections were prepared and analyzed, melanomacrophage center
number and area were estimated through image analysis, and special stains were used to
identify MMC content.
Table 1.1
Fish Taxonomy, Phylogenetic Group, Tissues, and Analyses for Proposed Sampling
Common Name
Genus and Species
Tissues for Mercury Determination (Speciation and Total Mercury)
Tissue for Macrophage center counts and Histopathology
Preteleostean Fish
Spotted Gar Lepisosteus oculatus
Liver, Spleen Liver, Spleen
Bowfin Amia rostrata
Liver, Spleen Liver, Spleen
Teleostean Fish
Channel Catfish
Ictalurus punctatus
Liver, Spleen Liver, Spleen
Largemouth bass
Micropterus salmonides
Liver, Spleen Liver, Spleen
Outcome: High inorganic:organic ratios for mercury in tissues possessing high abundance of
MMCs support the role of macrophages in the demethylation of mercury. High levels of
mercury deposition in macrophage centers and in melanin‐lipofuscin oxidative lesions support a
role for macrophages in mercury demethylation and the role of an oxidative mechanism.
16
Objective II: Determine the association of methylmercury demethylation to relative abundance
of tissue macrophages
Hypothesis III: The organic:inorganic mercury ratio is higher in tissue and fish with high
abundance of tissue macrophages.
Hypothesis IV: Tissue mercury levels are higher in areas of MMCs and deposits than in
surrounding parenchyma.
Approach: Histologic sections were stained with H&E and MMCs in liver and spleen were
counted and compared with mercury speciation data to determine if a correlation existed
between high inorganic:organic mercury ratio and high abundance of MMCs. Slides were taken
for relative total mercury imaging by LA‐ICP‐MS and area sizes of normal parenchyma and
melanoMMCs were analyzed and statistically compared by ANOVA and imaged.
Outcome: High inorganic:organic ratios for mercury in tissues possessing high abundance of
MMCs support the role of macrophages in the demethylation of mercury. High levels of
mercury deposition in macrophage centers and in melanin‐lipofuscin oxidative lesions support a
role for macrophages in mercury demethylation and the role of an oxidative mechanism.
Objective III: Determine protectiveness of mercury demethylation
Hypothesis V: In the tissue of active methylmercury demethylation increased levels of
histopathology will be found.
Approach: As was discussed earlier in the introduction, exposure to mercury can cause
apoptosis and or necrosis in the tissues in which it accumulates (Mela et al., 2007a). Necrosis
and apoptosis can be seen as extreme points along a continuum of the path to cell death.
Necrosis is attended by inflammatory infiltrate and necrosis can be visualized by the formation

17
of apoptotic bodies (Cotran, Kumar, & Collins, 1999). Histologic sections of liver and were made
from fish samples and analyzed for pathology, with special attention to the development of
melanin‐lipofuscin deposits, apoptotic bodies, inflammatory infiltrate, and other lesions.
Outcome:
The development a greater abundance of histopathologic signs in tissues with high levels of
inorganic mercury is considered supportive of an association between accumulation of
inorganic mercury in tissue and tissue damage.
Results of these experiments are detailed in the following chapters. Chapters 2‐4 are
written as primary research articles for submission for publication. Chapter 6 provides an
overall conclusion and synthesis of each of the research chapters.

18
CHAPTER 2
HISTOLOGY AND HISTOPATHOLOGY OF FISH EXPOSED TO MERCURY IN CADDO LAKE
2.1 Introduction
Mercury is a widespread contaminant that impacts the health of human populations
and ecosystems. It is found in both inorganic and organic compounds, is environmentally
persistent, and biomagnifies in the food chain (NRC, 2000). In fish, mercury is thought to
accumulate in kidney, muscle, and liver, resulting in signs of necrosis with inflammatory
infiltrate (Mela, et al., 2007b), apoptosis with upregulation of apoptotic signaling pathway
genes, and lesions in Disse’s space of the liver (Klaper, et al., 2008). Methylmercury exposure in
fish has been shown to impair coordination and swimming activity (Crump & Trudeau, 2009)
which can reduce species fitness by reducing successful hunting, evasion of predation, and
mating behaviors. Environmentally relevant concentrations of mercury have been shown to
impair reproduction in fish and are thought to act through induction of apoptosis in
steroidogenic cells and/or through disruption of the hypothalamic‐pituitary‐gonadal axis
(Crump & Trudeau, 2009; Drevnick, et al., 2008; Drevnick & Sandheinrich, 2003; Drevnick, et al.,
2006; Vieira, et al., 2009).
Caddo Lake is a freshwater reservoir that spans the Louisiana and Texas border, and is
reported to have among the highest levels of mercury in fish in the state of Texas (TCEQ, 2004).
The Texas side of Caddo Lake is primarily shallow forested wetland while the Louisiana side a
more open water habitat. The mercury levels in fish are significantly higher on the wetland side
of the lake than the open water side of the lake (Chumchal MM, et al., 2008). The top predators
in this ecosystem include spotted gar and largemouth bass (M. M. Chumchal, et al., 2011).

19
Melanomacrophages, fixed tissue macrophages of amphibians and fish, have been used
as biomarkers of general pathology (Hartley, et al., 1996; Wolke, 1992) but are also thought to
occur in certain tissues as non‐pathologic germinal centers of fixed macrophages (C Agius,
1980; C Agius & Roberts, 2003a). Melanomacrophage centers (MMCs)(the melanomacrophages
of fish) appear to follow an evolutionary pattern in distribution and degree of organization with
a trend from random distribution and low levels of organization in Condrichthyes and Agantha,
to highly organized structures in the liver of the primitive bony fish, and finally to well‐
organized structures in the spleens and kidney of the Teleosts (C Agius, 1980).
Macrophage centers have been shown to increase in the livers of fish with high body
burdens of mercury, as has liver color and lipofuscin content. In northern pike from Isle Royale,
increases in lipofuscin content and liver color were observed with increasing mercury
concentration (Drevnick, et al., 2008). Increases in macrophage centers in spleen and liver have
also been observed in Pike from the Oder River in Germany with increasing muscle mercury
(Meinelt, Krüger, Pietrock, Osten, & Steinberg, 1997), and independently of age in trout in the
U.S. (Schwindt, Fournie, Landers, Schreck, & Kent, 2008). In Devil’s Swamp Louisiana, increased
MMCs and increased hepatic iron were seen in gar liver over Tunica Swamp gar controls. Gar
muscle tissues from Tunica Swamp were found to be much lower in several contaminants,
including mercury (Hg 5.8 ng/g), than in Devil’s Swamp fish (426.6 ng/g)(Hartley, et al., 1996).
In Caddo Lake increasing concentrations of hepatic mercury have been observed to correlate
with increasing levels of melanomacrophages in spotted gar and increased tissue pathology in
the form of darkening of gross liver (B. Barst, et al., 2011).
20
The goal of this study was to conduct a histological examination of macrophage centers
in Caddo Lake fish species known to be high in total mercury concentrations. Species were
selected to include both primitive preteleosts (spotted gar and bowfin) and modern teleosts
(largemouth bass and channel catfish) to provide an evolutionary comparison based on
macrophage center distribution. Low mercury fish were obtained from other sources to act as
a histological baseline. This study reports strong correlations between MMC size/number and
total mercury concentrations in the livers of each of the four species. These data further
support the role of macrophages in the metabolism and cellular response to hepatic mercury
accumulation.
2.2 Materials and Methods
2.2.1 Fish Collection and Tissue Processing
Fish were collected in accordance with Texas Parks and Wildlife Scientific Research
Permit No. SPR‐0311‐092 and the University of North Texas Institutional Animal Care and Use
Committee Protocol #11005. Fish were collected from the wetland habitat in the Western edge
of Caddo Lake, near to the city of Uncertain, Texas. The specific fish collection methods used
were electro‐shocking from a boat, gill netting, and line fishing. The target species for this
research were largemouth bass (Micropterus salmonides), channel catfish(Ictalurus punctatus),
spotted gar (Lepisosteus oculatus), and bowfin (Amia rostrata). Collected fish were kept alive in
aerated water until sacrificed.
Histologic baseline samples of largemouth bass were taken from a pond (stock tank) on
a ranch in West Texas (32°25'14.29"N, 98°59'35.47"W). The ranch is located near Cisco, Texas
and has been used as agricultural land for raising small herds of cattle for over 70 years. No

21
industry exists near the ranch in the surrounding region. This body of water was chosen as the
source of low mercury exposure bass because of ease of use, low cost of obtaining fish, and
expected low levels of tissue mercury. Histologic baseline samples for alligator gar and channel
catfish were taken as donations from the Private John Allen National Fish Hatchery in Tupelo,
MS.
Fish were sacrificed by placing them in tricane solution (MS222) until dead. Tissue
samples were taken for liver and spleen histology (n = 5 individuals per species from baseline
and Caddo fish groups), muscle mercury analysis (n = 5 baseline fish and Caddo fish per
species), and liver mercury analysis (n =5 Caddo fish per species). Biopsies of spleen and liver
tissue were taken immediately for histology and were placed in 20‐ml histology vials pre‐filled
with 10‐ml 10% buffered formalin (Life Science Products HW1103). The remaining liver and
spleen were placed in labeled quart Ziploc® plastic bags (SC Johnson) and placed on ice for later
mercury analysis. However, due to histologic results and small spleen tissue sizes, spleen
mercury levels were not analyzed in this study. Samples of muscle for mercury analysis were
similarly taken from all fish.
2.2.2 Tissue Mercury Analysis
Batches of scintillation vial stored samples were removed from storage and freeze dried
for 72 hours in a lyophilizer (Labconco FreeZone 6‐Liter Console System 7753027) at ‐56○ C and
a pressure of 3.5 pascals (3.45 x 10‐5 atmospheres). Dried samples were ground in the
scintillation vial using glass stir rods. Stir rods were washed three times between each sample in
deionized water and wiped clean before moving to the next sample. Ground samples were
stored at ‐80○ C until mercury content analysis was carried out.

22
2.2.2.1 Muscle Total Mercury Content by Direct Mercury Analyzer
Lyophilized and ground samples were weighed and run on a DMA‐80 Direct Mercury
Analyzer (Milestone Inc). To each run of samples was added certified reference material each
20 samples and a blank was positioned every 10 samples. Certified reference materials (CRM)
used included Mess‐3, TORT‐2, DOLT‐3, and DORM‐3 (National Research Council Canada). All
recoveries for CRM were from 97 to 106% of the reported certified values. Duplicate values
were from 80‐99% of one another.
2.2.2.2 Liver Total Mercury Analysis by ICP‐MS
ICP‐MS was chosen as the analytical method for total liver mercury due to the ability of
this method to quantify multiple elements simultaneously. Selenium was quantified as well as
mercury in all samples (data not shown, see Chapter 4). Mercury concentrations were
determined by acid digestion of dried, powdered samples and liquid introduction to an
Inductively Coupled Plasma Mass Spectrometer (ICP‐MS). Digestions were carried out with
modification and adaptation of the method used by Ashoka (Ashoka, Peake, Bremner,
Hageman, & Reid, 2009), in which a domestic microwave oven was used in closed vessel
digestion with nitric acid and hydrogen peroxide. All samples and standards were made up,
digested, and analyzed in in molded clarified homopolymer polypropylene screw cap digestion
vessels (Environmental Express SC475), which allowed sample preparation and analysis in one
vessel and minimized contamination or loss through vessel transfer. Lyophilized and ground
samples were weighed and placed screw cap digestion vessels and to each tube 1 ml 70% nitric
acid (Fischer Scientific, Trace Metal Grade) and 500 l 50% hydrogen peroxide (Fischer
Scientific, certified, stabilized) were added. A domestic style 700 watt microwave (Maytag
23
Magic Chef, Model number MCM770W) oven was used in all digestions. Digestions were
carried out at 50% power for 1 minute followed by a 5 minute rest period; this microwave and
rest cycle was carried out three times on each sample. After digestion and cooling, internal
standard and gold solution were added to digestate and the volume of the samples was
brought up to 50 ml with MiliQ water. All standards and dilutions were made up in 18 M
MiliQ water.
A multi‐element standard containing bismuth, holmium, indium, lithium 6, terbium, and
yttrium was used to determine proper dilution of digestate (Ricca Chemica CLISS‐1) by
monitoring the Terbium content during analysis. The final concentration of internal standard
was 50 ppb in each solution. Gold standard was also placed in all solutions to reduce carryover
of mercury (Ricca Chemical MSAU1KN‐100). Gold was also added to ICP wash solution (2% (v/v)
trace metal grade 70% nitric acid) and in both wash solution and analytical solutions the
concentration of gold was kept at 100 ppb. Single element mercury (MSHG1KN100) and
selenium (MSSE1KN100) standards were obtained to produce an external standard curve. To all
solutions 100 ppb gold standard and 50 ppb internal standard were added after digestion and
cooling and before dilution of digestate.
All analyses were conducted using a Varian 820 ICP‐MS with SPS3 Sample Preparation
System autosampler. Isotopic mass data for Mercury 202 were collected. Five estimates of each
measurement were made; percent relative standard deviations and mean counts per second at
each measured mass were reported by Varian Software. Development of standard curves,
calculation of solution and tissue concentrations, and variability in internal standards were
performed on exported data using Microsoft 2007 Excel software.

24
2.2.3 Histologic Examination
Histologic samples were processed to make slides, embedded, sectioned, stained, read,
and photographed at Dermatopathology Associates in Jackson, MS. Reference fish were used
for histologic comparison to Caddo lake fish to evaluate possible pathologic processes and were
necessary as a point of departure for histologically unremarkable tissue in comparison with
mercury exposed fish. This was particularly important to evaluate the preteleostean fish whose
tissues are poorly characterized in the literature.
2.2.3.1 Tissue Processing and Embedding
Tissue samples were grossed and placed in properly labeled cassettes. Tissue was
processed overnight in an Excelsior Advanced Tissue processor (Thermo Shandon A78410100).
The reagents used in processing the tissue were 10% neutral buffered formalin (Leica 3800598),
reagent alcohol (Leica 3803686), Sub‐X, an aliphatic hydrocarbon xylene substitute (Leica
3803670), and blue ribbon paraffin (Leica 3801360). All reagents addition was made at ambient
temperature, except for paraffin, which was held at 61○ C. The stir agitation function was held
at the intermediate 5 setting.
2.2.3.2 Sample Sectioning and Staining
Hematoxylin and eosin staining: Slides stained for routine histologic examination and
light microscopy image analysis were sectioned on a microtome to 4 m, mounted on glass
slides (Leicha Surgepath glass slides 3800375), and stained with H&E using an Shandon Varistain
Gemini Slide Stainer (Thermo Shandon A78000014) and an Leica CV 5030 automated glass
coversliper (Thermo Shandon).

25
Melanin bleaching: Sections (4 m) were mounted on glass microscope slides (Leicha
Surgepath glass slides 3800375).Slides were prepared as sequential sections for melanin
bleaching followed by H&E staining and sections for H&E staining alone. This allowed for
comparison of the same structures with and without melanin bleach treatment. One individual
was chosen randomly from each group for melanin bleaching of liver tissue. Melanin bleaching
was performed using potassium permanganate 0.25% (Polyscientific S2273‐8oz) followed by
decoloration with 5% aqueous oxalic acid (S2199‐8oz) and slides were subsequently stained
with H&E in the Varistain Gemini Slide Stainer as above
Periodic Acid‐Schiff staining: One individual from each group (liver and spleen) was
randomly chosen for PAS staining to confirm H&E analysis of vacuolation and
melanomacrophage PAS positivity. Staining was carried out using a commercial kit (Sigma
Aldrich PAS Kit 395B) by the standard procedure. Staining was carried out as per the instruction
in the kit with the exception that deparaffination of the slides and drying were carried out in
the Varistain Genmini Stainer. Slides were coversliped using the automatic coversliper. Sections
(4 m) were mounted on charged slides (Fischer Brand Probe on Plus 22‐230‐900). A PAS
positive control was used with each run of PAS staining. This control consisted of human skin
tissue of an individual with a dermal fungal infection.
Prussian blue staining: Initially iron staining was carried out on liver and spleen from one
randomly chosen individual from each group, but due to the deposition of large amounts of
iron in hepatocytes of certain fish and the possible relation of iron deposits to oxidative
processes in tissue, samples from each individual and group were stained and inspected. Iron
staining was carried out with a Prussian blue reaction with a Pararosaniline counterstain using a

26
commercial kit (Sigma Aldrich Iron Stain Kit HT20). Staining was carried out as per the
instruction in the kit with the exception that deparaffination of the slides and drying were
carried out in the Varistain Genmini Stainer. Slides were coversliped using the automatic
coversliper. Sections (4 m) were mounted on charged slides as above. A positive control of
human spleen was prepared with each run of Prussian blue staining.
2.2.4 Image Analysis
Slide imaging was carried out using a Motic Instruments Microscope Camera (Moticam 2000
SP10‐0382) on an Olympus Bx40 microscope. Image analysis of MMCs was performed on TIF
images created through the Motic 2000 software on H&E stained slides. Processing of images
for MMC count and percent area of MMC in relation to the total captured field was carried out
using Image J (NIH http://rsbweb.nih.gov/ij/), a free Java based image processing and analysis
software. Digital TIF images were converted to binary images in Image J and the size and
number of MMCs were estimated through the Analyze Particles function in the software. Size of
captured field was adjusted based on the image, circularity was kept in the all‐inclusive range
from 0‐10, outlines were shown for comparison with H&E stain, and results were displayed and
summarized.
2.3 Results
2.3.1 Muscle Total Mercury Analysis
Reference fish muscle tissue show lower concentrations of mercury than Caddo lake fish
of the same species (one‐tailed t test: Bass (p=0.0063), Catfish (p = 0.001), gar (p<0.0001))
(Table 2.1). Wet weight tissue concentrations of 200 ng/g and lower in fish muscle have been
estimated to be protective of the health of juvenile and adult fish (Dillon, Beckvar, & Kern,

27
2010). The tissue residue criterion for the edible portion of fish is 300 ng/g wet weight based
on a total fish and shellfish consumption‐weighted rate of 17 g fish/day. This estimate is based
on the methyl mercury RfD of 0.0001 mg methylmercuy/kg/day (Borum, et al., 2001). All
reference fish in this study are well below the EPA tissue criterion for human health and
literature‐derived estimated fish protective levels and even the maximum measured values fall
below these two reference concentrations. All Caddo fish groups have muscle tissue
concentrations higher than the muscle tissue concentration expected to be without health
effects in fish. Average muscle tissue concentrations for Caddo Lake fish are all above the EPA
criterion, except for catfish, and all maximum values for Caddo fish exceed the EPA tissue
criterion. These results support the use of these reference fish for histologic comparison.
Table 2.1
Mean and Standard Deviations of Wet and Dry Weight Muscle Tissue Total Mercury
Fish Group Mean Total Mercury in Muscle (ng/g dry weight +SD)
Mean Total Mercury in Muscle (ng/g wet weight +SD)*
Bass Reference 687.3 + 246.7 137.5 + 49 Bass Caddo 3631 + 2229 726.2 + 445 Catfish Reference 84.1 + 51.68 16.8 + 10 Catfish Caddo 1143 + 601.8 228.5 + 120 Bowfin Caddo 5001 + 2792 1000 + 558 Gar Reference 58.14 + 4 11.63 + 0.7 Gar Caddo 2200 + 947 440 + 190 *estimated as 1/5 the dry weight concentration.
4.3.2 Liver Total Mercury by ICP‐MS
Mercury concentrations were found to be similar in liver for Caddo fish analyzed in this
study and no significant differences were found between species (Kruskal‐Wallis test, p =0.51).
This lack of significance is largely due to the high levels of variation between individuals within a

28
species. This variability hides the fact that two of the five gar livers were very high in mercury
and may suggest the existence of a subpopulation (table 2.2).
Table 2.2
Analytical Results for ICP‐MS Estimates of Liver Mercury in Caddo Fish (Mean, SD)
Sample ID Mean Concentration of Mercury in Liver tissue (ng/g)
Bass 3317 + 3041 Catfish 2435 + 1440 Bowfin 2289 + 1342 Gar 16421 + 18570
2.3.3 Histologic Analysis
2.3.3.1 Hematoxylin and Eosin Analysis
Largemouth bass: Largemouth bass from both reference and Caddo populations were
infected with a parasitic worm in almost all individuals examined. Parasites were large and were
found in both spleen and liver tissue. Worm larvae were found in vascular spaces and in some
cases were associated with clot formation and occlusion of vascular lumina. The livers of bass
reference and Caddo populations showed occasional large, macrophage centers with uniform
golden‐brown cytoplasm that was agranular and whose color was not as dark as that expected
for melanin (Figure 2.1).
Spleens showed large populations of lymphocytes and red blood cells with large
macrophage centers. In general, spleens showed a much higher abundance of macrophage
centers than liver in both populations but were, as in the liver, consistently large and pale. No
apparent melanin was seen in macrophages in liver or spleen in either population. Melanin
bleaching, Prussian blue staining, and PAS staining were used to identify the brown material in

29
macrophage centers, which was provisionally identified as bile, lipofuscin, and/or iron.
Histologic examination of liver and spleen were otherwise unremarkable (Figure 2.1).

30
Figure 2.1. Melanomacrophages in bass liver and spleen Bass H&E, Panel A: reference bass Liver 400x, Panel B: Caddo Bass Liver 400x, Panel C: Reference Bass Spleen 400x, Panel D: Caddo
bass spleen 400x. MC: macrophage center, Hep: hepatocytes, Sp: spleen parenchyma (lymphocytes, red cells)

31
Catfish: Catfish in both reference and Caddo fish showed extensive pancreatic tissue
embedded in normal liver tissue (hepatopancreas). Hepatocytes of reference fish showed
moderate vacuolation in comparison with those of Caddo populations, which may be due to
enhanced glycogen storage in the well‐fed state. PAS staining was performed on liver to identify
this vacuolar material as glycogen. Hepatocytes of catfish from Caddo had cytoplasmic granules
of brown material which were provisionally identified as iron or, perhaps more likely bile. Later
Prussian blue staining confirmed iron deposition in hepatocytes of catfish. Hepatic cytoplasmic
granules were not seen in reference fish (Figure 2.2).
Macrophage centers in livers of both reference and Caddo populations are occasional,
almost universally associated with pancreatic tissue, and seem to vary in prevalence based on
the amount of pancreatic tissue in the section being examined. Macrophage centers in livers of
both reference and Caddo populations were characterized by pale, golden brown, agranular
cytoplasm. No obvious dark granular material characteristic of melanin was seen in liver
macrophage centers.
Catfish spleen showed lymphocyte and red blood cells as the predominant cell types
with large macrophage centers. The cytoplasm of macrophage centers in spleens of reference
catfish were agranular and pale golden‐brown, while those in Caddo fish were similar, except
that they also showed stippling of granular black material characteristic of melanin. In general,
the splenic macrophage centers of Caddo fish were darker than those of reference catfish, and
were in some cases quite dark. No increase in macrophage centers was obvious in Caddo fish
over the reference population in number (Figure 2.3).

32
Figure 2.2. Catfish liver histology Catfish Liver H&E, Panel A: Reference 100x, Panel B: Reference 400x, Panel C: Caddo 100x, Panel D: Caddo 400x, MC: macrophage center, Bv: blood vessel, Hep: hepatocytes, P: pancreatic tissue.

33
Figure 2.3. Catfish spleen histology
Catfish Spleen H&E, Panel A: Reference 400x, Panel B: Caddo 400x

34
Spotted Gar: Gar hepatocytes from reference fish were uniformly highly vacuolated with
very little visible cytoplasm. This is in contrast with Caddo gar populations, which showed
condensed cytoplasm with little vacuolation. Caddo and reference livers showed perivascular
cuffs of hematopoiesis populated with lymphocytes, eosinophillic granulocytes, plasma cells,
and hematopoetic precursors (blasts). Reference gar showed smaller more prominent
aggregates of macrophages than those seen in bass or catfish and the cytoplasm of these
macrophages was filled with dark, black, granular material. The macrophage centers of gar from
the Caddo population were very prevalent with intensely dark, granular inclusions in their
cytoplasm and were sometimes completely obscured by the dark material. Some Caddo fish
showed very large numbers of macrophage centers that commanded large portions of the
surface area of liver sections (Figure 2.4).
The spleens of gar from both Caddo and reference populations showed signs of
germinal activity that was much more prominent than that seen in other species in spleen. The
reference fish showed very high levels of hematopoetic activity with frequent mitosis,
hematopoetic precursors (blasts), and prominent nucleoli. The background cellularity of the
spleen was composed of lymphocytes and red blood cells with scattered macrophages and
small, infrequent, islands of liver cells. Macrophages in both reference and Caddo populations
were very dark with granular black material (Figure 2.4).

35
Figure 2.4. Gar liver and spleen histology Panel A: Reference Liver 100x, Panel B: Caddo Liver 100x, Panel C: Reference 400x Spleen, Panel D: Caddo Spleen 400x

36
Bowfin: No reference fish were available for bowfin and all descriptions are of Caddo
fish. Hepatocytes were unremarkable in most fish, but some showed granular deposits of
golden brown material, and, in one case, increased vacuolation. All livers showed periportal
lymphocytes, which were considered non‐inflammatory and unremarkable in these fish.
Melanomacrophage centers were very prominent, if slightly less in number than in gar, and like
gar contained large amounts of black granular material. Unlike other fish, macrophage centers
did not seem to be predominantly perivascular and were scattered through the liver. One
bowfin (Bowfin 4) showed a large well circumscribed area with very low abundance of
macrophages, normal appearing hepatocytes, and an absence of biliary structures. This well
circumscribed lesion could be appreciated grossly as round area of pale liver tissue.
Spleens of bowfin showed isolated, scant, dark macrophages in a background of
lymphocytes and red blood cells. Some, (bowfin 4) showed granular deposits scattered in the
parenchyma of the spleen, and had granular deposits of black material in vascular endothelial
cells (Figure 2.5).
MC

37
Figure 2.5. Bowfin histology: liver and spleen
Panel A: Bowfin Liver 100x, Panel B: Bowfin Spleen 400x
38
2.3.3.2 Incidental Findings
Some observations were made during the course of the H&E analysis of slides that were
considered abnormal, but not related to mercury exposure. One of these was the parasitic
infection of virtually all bass in this study, both in reference and Caddo fish. Another finding was
a pale staining mass in the liver of one bowfin, which was examined both microscopically and
grossly. This mass was circular, large, and well‐circumscribed and showed a lack of biliary
structures. This mass is consistent with begin biliary adenoma and was considered to be
unrelated to mercury exposure.
2.3.3.3 Special Stain Analysis
Macrophage centers were found to be heterogeneous in composition, containing iron,
melanin, and glycogen. Melanin was confirmed to be in abundance in the macrophage centers
of gar and bowfin while catfish and bass were likewise confirmed to have low contributions of
melanin in macrophage centers, but some was seen in catfish spleen. In accordance with the
literature, melanomacrophages were found to be PAS positive, which was best appreciated in
bass and catfish, since macrophage centers in these species were less obscured by melanin. In
bowfin, macrophage centers were also observed to be PAS positive, since they were less darkly
pigmented than gar. Melanin and iron were major constituents of melanomacrophages in
bowfin.
Hepatocyte iron deposits were somewhat variable within species, but large deposits
were found in all bowfin, and were found in some Caddo lake catfish. Iron deposition in
hepatocytes was not seen in bass or gar. Based on these results, further examination of hepatic
iron was carried out (Hepatic Iron Scoring section, this Chapter).

39
2.3.3.4 Melanin Bleaching
Melanin is often a prominent component of pigments in fish and amphibian
macrophages, which has led to the term melanomacrophages to describe them (Wolke, 1992).
In the current study, initial inspection of macrophage centers in liver and spleen of both
reference and Caddo fish showed a species specific difference in the expression of macrophage
pigments. Gar and bowfin macrophages were very dark with a pigment that appeared to be
melanin, while the macrophages of bass and catfish appeared golden brown with no apparent
melanin.
Melanin bleaching confirmed that melanin was a major component cytoplasmic pigment
of melanomacrophages in the spotted gar and bowfin (Figure 2.7), but was a minor component
in bass and catfish (Figure 2.6). Melanin bleaching followed by H&E stain showed the
characteristic change in color toward blue in subsequent H&E stain; this effect is well known
and expected with this procedure. Largemouth bass and channel catfish (Figure 2.6) liver
sample show little change in macrophage center characteristics with and without bleaching.
The dark material in gar and bowfin liver show almost complete removal with bleaching (Figure
2.7).

40
Figure 2.6. Caddo catfish H&E and melanin bleach of liver macrophage centers
Panel A: Catfish Liver H&E, Panel B: Catfish Melanin Bleach followed by H&E, Panel C: Catfish Liver H&E, Panel D: Catfish Melanin Bleach followed by H&E. MC: macrophage, MCMB: macrophage melanin bleach. All fields 400x magnification.

41
Figure 0.7: Caddo Gar and Bowfin H&E and Melanin Bleach of Liver Macrophage Centers
Figure 2.8. Caddo gar and bowfin H&E and melanin bleach of liver macrophage centers
Panel A: Gar Liver H&E, Panel B: Gar liver Melanin Bleach, Panel C: Bowfin Liver H&E, Panel D: Bowfin Liver melanin bleach, MC: macrophage center. All fields 400x magnification.
42
2.3.3.5 Periodic Acid Schiff Stain
Periodic Acid Schiff Stain (PAS) is a staining method that stains glycogen in tissues by
oxidizing the glucose residues in the molecule to produce aldehydes that react with the Schiff
reagent to produce a purple color. A high degree of liver cell vacuolation was found in
reference fish in this study. Vacuolation of hepatocytes can be due to pathologic processes or,
in some animals, to energy storage in the well fed state.
PAS staining shows that the prominent vacuolation in the livers of reference fish is
associated with glycogen storage. Reference channel catfish and alligator gar were found to
have extensive vacuolation which was provisionally attributed to extensive glycogen storage in
the well fed state. PAS staining confirms that this vaculation is associated with glycogen store
and is not considered to result from any pathologic process (Figure 2.8).
Macrophage centers in fish have been shown to contain large amounts of ceroid
material, which has been found to be PAS‐positive (Brusle, Anadon, Datta, & Dutta, 1996).
Ceriod, or lipofuscin, is an age pigment that is produced in cells from oxidatively modified
proteins and lipids. It forms a polymeric cellular inclusion that is difficult to digest and builds up
in the cell over time (Terman & Brunk, 2004). PAS staining in Caddo fish confirms PAS‐positivity
of macrophage centers and further shows significant deposits of lipofuscin in fish macrophage
centers (Figure 2.9). Macrophage centers are focal points of oxidative activity and this finding is
expected.

43
Figure 2.9. PAS staining of livers of Caddo fish and positive control
Panel A: PAS Positive Control, human fungal Infection in skin, 100x magnification, Panel B: Reference gar liver, 100x magnification, Panel C: Reference catfish 100x magnification, Panel D: Caddo catfish 100x magnification

44
Figure 2.10. PAS staining of bowfin and bass liver macrophage centers
Panel A: Bowfin macrophage center showing PAS positivity, 400x magnification, Panel B: Bass macrophage center showing PAS positivity 400x magnification

45
2.3.3.6 Prussian Blue Iron Stain
Hemosiderin occurs as yellow to brown intercellular granules and is a waste product of
iron metabolism. Hemosiderin is a heterogeneous mixture of iron oxides and perhaps ferritins,
but iron is present in the oxidized iron III form (Richter, 1978). Hemosiderin is a normal pigment
in macrophages, which often phagocytize senescent red blood cells, but an abnormal,
generalized overabundance of iron deposits is called Hemosiderosis. Hepatic iron can be
increased in hemochromatosis, iron‐overload, conditions of intravascular hemolysis, and
anemia of chronic disease (Batts, 2007). Hepatic hemosiderosis has been observed in fish
exposed to mixed pollutants, including mercury, in the Mississippi basin (Thiyagarajah, Hartley,
& Abdelghani, 1998) and with methylmercury exposure in frogs (Chang, Reuhl, & Dudley, 1974).
Hepatic Hemosiderosis has also been associated with oxidative stress induced by lead poisoning
in mallard ducks (Mateo, Beyer, Spann, Hoffman, & Ramis, 2003).
The Prussian blue reaction exposes tissue sections to acid solutions and ferrocyanides
which reacts with ferric iron (iron III) resulting in the formation of a bright blue pigment which
is called Prussian blue. The reaction is very sensitive and can reveal even single granules of iron.
A second reaction called Turnbull’s blue also produces the Prussian blue pigment, but it uses
ferricyanide and preferentially stains ferrous iron (iron II). The Prussian blue reaction is most
often used, perhaps because of the biological importance of the formation of oxidized iron
precipitates in the cell (Sheehan & Hrapchak, 1980).
Prussian blue staining showed iron to be a large proportion of the pigment of
macrophages in bass (Figure 2.10) and catfish (Figure 2.11), and was also a component of
bowfin and gar MC. Some catfish (Figure 2.11, panel C) and all bowfin (Figure 2.12, panel B)

46
showed marked hepatocellular hemosiderosis. Hepatocellular hemosiderosis, as a pathologic
condition in these fish, was scored and has been analyzed further in this study.

47
Figure 2.11. Prussian blue of positive control and bass liver macrophages
100x 400x

48
Figure 2.12. Prussian blue of catfish liver macrophage centers and catfish hepatic hemosiderosis

49
Figure 2.13. Prussian blue stain of bowfin liver macrophages and hepatic hemosiderosis
Panel A: Gar liver, 400x, Panel B: Bowfin liver 400x magnification

50
2.3.3.8 Hepatic Iron Scoring
Hepatic iron deposition was scored in all Caddo fish and controls since the deposition of
iron in liver is generally a pathologic process and is often the result of oxidative processes.
Variation in iron deposition was suspected in initial H&E staining and in subsequent iron stains
so a complete workup and scoring was performed to quantify the observed differences. The
scoring method defines scant as occasional trace iron, followed by one plus to four pluses as to
hepatic iron content. One plus is occasional but well defined iron particles in hepatocytes.
Four pluses is very widespread (almost total organ involvement) and heavy hemosiderin
deposits in hepatocytes.
Control fish were found to have generally low levels of hepatic hemosiderin deposits.
Caddo bass were found to be similar in iron deposition with reference fish, but catfish, bowfin
and gar were found to have high levels of iron deposition in their livers (Table 2.3).
Table 2.2
Hepatic Hemosiderin Score for Caddo Fish
Fish ID Control Catfish
Control Bass
Control Gar
Caddo Catfish
Caddo Bass
Caddo Bowfin
Caddo Gar
1 + + 0 +++ ++ ++++ Scant 2 0 + 0 +++ 0 ++++ Scant 3 0 ++ 0 +++ Scant ++++ +++ 4 ++ + 0 ++ + ++++ +++ 5 ++ + 0 +++ + ++++ +

51
2.3.3.9 Image Analysis
Image analysis of macrophage centers shows expected tissue tropism based on the
literature, with predominance of macrophage centers in livers of preteleostean fish and spleens
of teleosts. The percent area shows better concordance than simple macrophage center counts.
This is related to the histologic finding of larger, less frequent MMCs in teleostean fish and
smaller abundant centers in preteleostean fish (Table 2.4).
Table 2.3
Number and Total Size of Macrophage Centers in Liver of Caddo Fish (Mean + SD)
Species Count Area Percent
Liver Bass 1.60 (1.34) 0.37 (0.43) Catfish 0.8 (0.67) 0.27 (0.21) Bowfin 123.4 (35.25) 6.0 (2.26) Gar 106.2 (8.27) 9.14 (7.50) Spleen
Bass 14.7 (6.35) 5.38 (6.21) Catfish 7.5 (6.35) 2.43 (1.83) Bowfin 2.4 (1.29) 0.12 (0.03) Gar 2.1 (1.48) 0.23 (0.10)
2.3.4 Relationship between Macrophage Center Area and Mercury
Earlier research suggested that macrophage center number increased with increasing
mercury concentration so comparisons were made of estimated macrophage area with
mercury concentrations from ICP‐MS analysis (figure 2.13).

52
Figure 2.14. Association between total liver mercury concentration and macrophage center area in Caddo fish (R2 values for linear regression)
Evidence was found for an association between total mercury and relative liver
macrophage center area. Higher concentrations of liver total mercury were associated with
increases in macrophage center area in all fish examined (figure 2.13). The association was
found to be strongest in bass (Pearson correlation r2= 0.9833, p= 0.0026) and bowfin (Pearson
correlation r2= 0.9681, p= 0.0068). Correlations of associations between mercury concentration
and macrophage center area are lower in gar (Pearson correlation r2= 0.7841, p= 0.116) and
catfish (Pearson r2= 0.818, p= 0.091) than in bass and bowfin. In catfish and gar one individual
in each of these groups reduces correlation, when these individuals are removed from analysis
the Pearson correlation coefficients for gar become 0.9984 (p= 0.0016) and 0.985 (p=0.015) for
catfish. The strength of association in bass and bowfin coupled with the suggestion of similar
Bass Catfish
Gar Bowfin
R2= 0.967 R
2= 0.970
R2= 0.997 R
2= 0.937

53
association gar and catfish, and very low measurement for catfish macrophage center area in
the lowest estimate give confidence that the apparent outliers in gar and bass can be removed
from the data sets for analysis. The measurement of area of macrophage centers is based on
two fields each of from H&E sections from each individual, and some variation in estimation is
expected.
2.4 Discussion
Macrophage centers in fish and amphibian tissues have been termed
melanomacrophages based on their accumulation of pigments, yellow to black in color, rather
than specifically on the melanin molecule (Roberts, 1975). This is an historic definition of the
term melanin, rather than the one currently in use that only recognizes a set of closely related
pigment molecules as melanins (C Agius & Roberts, 2003a). Results from the current study have
identified the types of pigments commonly associated with melanomacrophages: melanin,
hemosiderin, and lipofuscin/ceriod, and have shown them to often co‐occur within the same
cell.
In mammals melanin production is confined to neuroectodermally derived tissues, but
in amphibians and fish melanogenesis can also occur in hematopoietic tissue. Recently, fish
cells from a leukocyte cell line (CD83+) were shown to express dopachrome
tautomerase/tyrosine‐related protein‐2 (Haugarvoll, Thorsen, Laane, Huang, & Koppang, 2006).
This demonstrates that leukocytes in fish are capable of producing melanin. Tyrosinase, the key
enzyme in melanin synthesis, has been shown play an integral role in encapsulation and
phagocytosis in invertebrates, is produced with infestation or inflammation, and has recently
been shown to increase in immunologic challenge in fish (Wang et al., 2009).

54
In this study, species‐specific differences in pigmentation of macrophage centers of the
liver were found. Caddo gar and reference gar have macrophages that are characterized by very
abundant melanin, while those of catfish and bass have high levels of hemosiderin, but very
little melanin. All macrophage centers were found to be PAS positive and to contain large
amounts of lipofuscin. The literature often reports differences in melanin content of
macrophage centers. These differences have been variously characterized as independent of
phylogenetic relationship and highly variable between species and individuals (Wolke, 1992)
and remarkably constant within organs by species (C Agius, 1980).
Spleenic iron in melanomacrophage centers has been linked to hematopoiesis and
hemoglobin synthesis, while that of liver and kidney has been suggested to occur with
hemolytic crisis (Wolke, 1992). In the current study high levels of iron were found in the
macrophage centers of the liver both in wild‐caught and reference fish. The finding of hepatic
hemosiderosis in some Caddo fish leads us to suggest that some iron deposits in MMCs may be
due to oxidative processes in hepatocytes rather than being confined to hemolysis or iron
overload.
Differences were also found in the location and size of macrophage centers in this study.
In the gar and bass, macrophage centers were found to be perivascular, while those in bowfin
were more randomly distributed, and finally, those in the catfish were almost uniformly
confined to pancreatic tissue. Sporadic studies have noted differences in the appearance of
macrophages by species, tissue of residence, and in different physiological conditions within the
same species, but few, if any, have systematically reviewed these differences across species
from one body of water with reference tissues.

55
Morphological differences of melanomacrophage centers have been noted by species,
organ and physiologic condition in the literature, however most of this work has been done in
teleosts. One seminal study comparing various phylogenetic groups of fish found increasing
organization of these structures from diffuse, rudimentary structures in Condrichthyes to well
organized structures of in all Osteichthyes, except for salmonids (C Agius, 1980). Morphologic
comparison of MMCs is mostly confined to broad generalizations about organization of the
structures in the literature.
No pathological processes, other than hepatic hemosiderosis were observed.
Vacuolation was common among reference fish, but PAS staining identified this as likely to be
due to glycogen deposition in the well‐fed state. Observation of differences in normal hepatic
tissues of the examined species included the finding of perivascular germinal centers in gar
(both Caddo and reference) that were absent in other species, and the high degree of inclusion
of pancreatic tissue in catfish liver. Incidental findings included parasitic worm infection in
Caddo and reference bass one begin tumor was found in bowfin liver.
Little evidence was found in this study for gross histopathology related to mercury in
spleen or liver of fish from Caddo Lake. Evidence was found for extensive hepatic hemosiderosis
in catfish, gar, and bowfin, but not in bass. This hemosiderosis may be due to oxidative
processes occurring in hepatocytes that result in the deposition of oxidized iron (iron III).
Mercury is known to cause tissue damage through the formation of reactive oxygen species and
this may have led to the oxidation and precipitation of iron in the cell. Such extensive oxidative
stress in the liver may lead to reductions in species fitness, as more cellular resources are used

56
to protect from, and repair, oxidative damage. Chronic wounding could also lead to an
increased rate of formation of neoplasia, such as that seen in one bowfin from this study.
Evidence was found for the reactivity of macrophage centers to increasing levels of
mercury. This has been found in earlier studies in our laboratory and in the literature (Hartley,
et al., 1996; Mela, et al., 2007a; Schwindt, et al., 2008). This increase in macrophage center
mass may be due to increased cell turnover secondary to mercury exposure or may result from
a more direct response to mercury itself. Macrophages are cells of the primary immune system
that clear cellular debris in necrosis, so increases in macrophage center mass may be secondary
to increased necrosis in hepatic parenchymal cells and the need to clear cellular debris and
reduce inflammatory response, which can produce further damage to tissues. Alternatively, the
increase in MMC mass may be due to direct effects of mercury on macrophages in these
centers by increasing intercellular calcium, promotion of cellular division, and hypertrophy of
the structures.
Macrophage centers were found to vary greatly in presentation between species of fish,
but were not found to be show large differences between reference fish and Caddo fish.
Variation in histologic presentation in macrophage centers has been noted in fish by species
and within species by site of collection (C Agius, 1980; C Agius & Roberts, 2003b). Few studies
have been carried out comparing histologic presentation of macrophage centers across fish
species, and none to found in the literature have compared multiple species and tissues with
reference to histologic baseline fish. Macrophage centers have been used as biomarkers of
pathology and exposure to environmental degradation and toxicants.

57
Few publications address the specific liver or spleen histologic findings of mercury
exposure at defined tissue concentrations. The population health based level of 200 ng/g
(Dillon, et al., 2010) derived as a no‐effect estimate is based on percent hatching success,
spawning success, and severe developmental anomaly mixed endpoints. There is, of course, no
reason to expect liver or spleen lesions, visible by light microscopy at this tissue concentration.
Experimental evidence in the neotropical fish Hoplias malabaricus from a 70‐day feeding
methylmercury study show histologic effects at liver tissue concentrations of 1,069 ng/g of
exposed fish but not in the controls which had mercury concentrations of 601 ng/g (both in wet
weight). The exposed group showed inflammatory infiltrate, necrotic lesions, and increased
melanomacrophage centers by light microscopy. Further ultrastructural analysis confirmed
necrosis, cytoskeletal disarray and sever damage in Disse’s space (Mela, et al., 2007a).
Histopathology in the form of hepatic necrosis, interstitial inflammation, reduced glycogen
storage, and bile duct hyperplasia was likewise seen in spotted seatrout from south Florida in
comparison with Indian River Lagoon control fish. Liver concentrations of mercury in South
Florida fish were 630 ng/g, while those of controls were 320 ng/g (both wet weight) (Adams et
al., 2010). Comparison of dry weight values with these wet weight concentrations in liver may
be carried out using a factor of five conversion. Histopathology was seen at an estimated
equivalent liver concentration of 5345 ng/g dry weight in Hoplias malabaricus and 3150 ng/g
dry weight in spotted seatrout using this conversion. Other feeding studies found in the
literature were the result of exposures to inorganic mercury which may or may not mimic high
trophic level exposes of fish in the field.

58
Average liver concentrations in the Caddo fish studied here were lower than those
found in the literature to be associated with hepatopathologic lesions, but were higher than
those expected to be associated with effects on reproduction and development. However, high
concentrations in individual gar reached concentrations in excess of 37 thousand ng/g (data not
shown). Liver concentrations exceeded the 3150 ng/g level in two bass, one catfish, one bowfin,
and four of the gar. These mercury concentrations reflect total mercury and do not take into
account the possible effects of mercury speciation or the possible attenuating effects of
secondary factors, such as selenium levels. This lack of histopathology may be the result of
species specific differences in sensitivity to mercury in specific tissues, which could include
mechanisms involving mercury metabolism with binding and inactivation of mercury species.
Evidence was found for increasing macrophage center number with increasing mercury
concentration (as was reported in Melina, Randi et al, 2007) and increased hepatohemosiderin
deposits in all fish species but bass.
Continued characterization of macrophage center cytoplasmic inclusions and
morphology by species would be of particular aid in future attempts to develop biomarkers.
Morphologic differences in across species make subtle differences in macrophage cytoplasmic
content, which may be indicative of specific tissue processes. Characterization of species and
exposure related differences in morphology may increase melanomacrophage centers as a
biomarker of pathologic processes.
This study is the first to show morphologic differences in melanomacrophage centers
between species from wild caught fish with reference to farm raised fish. Large species specific
differences were found that could not be explained by exposures in the wild. This is the first

59
study is the first to suggest the development of hepatic hemosiderosis in fish with high
proportions of inorganic mercury, suggesting an oxidative process in the liver resulting in
demethylation. Finally, the current study shows that liver melanomacrophage centers increase
in area with increasing hepatic mercury concentrations, and is the first to report this across fish
species.

60
CHAPTER 3
THE ROLE OF MACROPHAGE CENTERS IN MERCURY METABOLISM OF FISH: EVIDENCE FROM
LIVER AND SPLEEN
3.1 Introduction
Mercury is a widespread contaminant that impacts the health of human populations
and ecosystems. It is found in both inorganic and organic compounds, is environmentally
persistent, and biomagnifies in the food chain (NRC, 2000). In fish, mercury is thought to
accumulate in kidney, muscle, and liver resulting in signs of necrosis with inflammatory
infiltrate (Mela, et al., 2007a), apoptosis with upregulation of apoptotic signaling pathway
genes, and lesions in Disse’s space of the liver (Klaper, et al., 2008). Methylmercury exposure in
fish has been shown to impair coordination and swimming activity (Crump & Trudeau, 2009)
which can reduce species fitness by reducing successful hunting, evasion of predation, and
mating behaviors. Environmentally relevant concentrations of mercury have been shown to
impair reproduction in fish and are thought to act through induction of apoptosis in
steroidogenic cells and/or through disruption of the hypothalamic‐pituitary‐gonadal axis
(Crump & Trudeau, 2009; Drevnick, et al., 2008; Drevnick & Sandheinrich, 2003; Drevnick, et al.,
2006; Vieira, et al., 2009).
Mercury demethylating enzymes similar to those found in bacteria have not been found
in vertebrates. Demethylation of mercury in animals is thought to occur through a free radical
mechanism (Gailer, et al., 2000). Methymercury has been found to be demethylated by reactive
oxygen species (specifically superoxide) in liver Kupfer cells, lymph nodes, and in macrophage‐
rich parts of the spleen (Havarinasab, et al., 2007). The respiratory burst is an important

61
immune function of phagocytic cells that produces superoxide to destroy foreign cells. Ethyl‐
and methylmercury have been shown to be degraded to inorganic mercury in human, rat, and
rabbit polymorphonuclear leukocytes and ethylmercury is degraded in guinea pig macrophages
and human monocytes (Suda, et al., 1992). Blockade of the reticuloendothelial system in the rat
has been shown to inhibit biotransformation of methylmercury to inorganic mercury (Suda &
Takahashi, 1990). This leads to the possibility that a large proportion of mercury demethylation
in tissues may be due to the action of macrophages and other phagocytes.
Melanomacrophages, fixed tissue macrophages of amphibians and fish, have been used
as biomarkers of general pathology (Hartley, et al., 1996; Wolke, 1992) but are also thought to
occur in certain tissues as non‐pathologic germinal centers of fixed macrophages (C Agius,
1980; C Agius & Roberts, 2003a). In Caddo Lake, a freshwater wetland in Texas, increasing
concentrations of hepatic mercury have been observed correlate with increasing levels of
melanomacrophages and increased tissue pathology in the form of darkening of gross liver.
Mercury has also been found to accumulate in macrophage centers which may indicate an
active role for these structures in the demethylation of methylmercury (B. Barst, et al., 2011).
Melanomacrophage centers (MMCs) (the macrophage of fish) appear to follow an evolutionary
pattern in distribution and degree of organization with a trend from random distribution and
low levels of organization in Condrichthyes and Agantha, to highly organized structures in the
liver of the primitive bony fish, and finally to well‐organized structures in the spleens and
kidney of the Teleosts (C Agius, 1980).
Caddo Lake is a freshwater reservoir that spans the Louisiana and Texas border, and is
reported to have among the highest levels of mercury in fish in the state of Texas (TCEQ, 2004).

62
The Texas side of Caddo Lake is primarily shallow forested wetland while the Louisiana side a
more open water habitat. The mercury levels in fish are significantly higher on the wetland side
of the lake than the open water side of the lake (Chumchal MM, et al., 2008). The top predators
in this ecosystem include spotted gar and largemouth bass (M. M. Chumchal, et al., 2011).
In earlier studies (B. Barst, et al., 2011) (Chapter Two) a relationship was found between
macrophage center area and mercury concentration in largemouth bass, channel catfish,
spotted gar, and bowfin from Caddo Lake. This study examines (1) the distribution of
macrophage centers in tissue in relation to literature tissue tropisms based on phylogeny, (2)
explore the localization of mercury in liver tissue by LA‐ICP‐MS, and (3) examine relationships
between MMCs and mercury metabolism.
3.2 Materials and Methods
3.2.1 Fish Tissue Collection
Fish were collected in accordance with Texas Parks and Wildlife Scientific Research
Permit No. SPR‐0311‐092 and the University of North Texas Institutional Animal Care and Use
Committee Protocol #11005. Fish were collected from the wetland habitat in the Western edge
of Caddo lake, near to the city of Uncertain, Texas. The specific fish collection methods used
were electro‐shocking from a boat, gill netting, and line fishing. The target species for this
research were largemouth bass (Micropterus salmonides), channel catfish (Ictalurus punctatus),
spotted gar (Lepisosteus oculatus), and bowfin (Amia rostrata). Collected fish were kept alive in
aerated water until sacrifice.
Fish were sacrificed by placing them in tricane solution (MS222) until dead. For those
fish that were used for histologic analysis (n = 5 per species), biopsies of spleen and liver tissue

63
were taken immediately and were placed in 20‐ml histology vials pre‐filled with 10‐ml 10%
buffered formalin (Life Science Products HW1103). Liver and spleen were placed in labeled
quart Ziploc® plastic bags (SC Johnson) and placed on ice for later mercury analysis. Batches of
scintillation vial stored samples were removed from storage and freeze dried for 72 hours in a
lyophilizer (Labconco FreeZone 6‐Liter Console System 7753027) at ‐56○ C and a pressure of 3.5
pascals (3.45 x 10‐5 atmospheres). Dried samples were ground in the scintillation vial using
glass stir rods. Stir rods were washed three times between each sample in deionized water and
wiped clean before moving to the next sample. Ground samples were stored at ‐80○ C until
mercury content analysis was carried out.
3.2.2 Preparation of Histologic Slides
Tissue samples were grossed and placed in properly labeled cassettes. Tissue was
processed overnight in an Excelsior Advanced Tissue processor (Thermo Shandon A78410100).
The reagents used in processing the tissue were 10% neutral buffered formalin (Leica 3800598),
reagent alcohol (Leica 3803686), Sub‐X, an aliphatic hydrocarbon xylene substitute (Leica
3803670), and blue ribbon paraffin (Leica 3801360). All reagents addition was made at ambient
temperature, except for paraffin, which was held at 61○ C. The stir agitation function was held
at the intermediate 5 setting.
Slides stained for light microscopy image analysis were sectioned on a microtome to 4
m, mounted on glass slides (Leicha Surgepath glass slides 3800375), and stained with H&E
using an Shandon Varistain Gemini Slide Stainer (Thermo Shandon A78000014) and an Leica CV
5030 automated glass coversliper (Thermo Shandon). Slides for ICP‐MS imaging were cut at 20
m thickness and placed on charged microscope slides (Fischer Brand Probe on Plus 22‐230‐
64
900). Slides for LA‐ICP‐MS were stained with Prussian blue without counterstain but were left
uncoversliped and were placed in plastic slide containers until laser ablation to protect the
surfaces of the slides.
3.2.3 Image Analysis
Photography and Image Analysis: Slide imaging was carried out using a Motic
Instruments Microscope Camera (Moticam 2000 SP10‐0382) on an Olympus Bx40 microscope.
Image analysis of MMCs was performed on TIF images created through the Motic 2000
software on H&E stained slides. Processing of images for MMC count and percent area of MMC
in relation to the total captured field was carried out using Image J (NIH
http://rsbweb.nih.gov/ij/), a free Java based image processing and analysis software. Digital TIF
images were converted to binary images in Image J and the size and number of MMCs were
estimated through the Analyze Particles function in the software. Size of captured field was
adjusted based on the image, circularity was kept in the all‐inclusive range from 0‐10, outlines
were shown for comparison with H&E stain, and results were displayed and summarized.
3.2.4 Laser Ablation ICP‐MS Analysis
Relative mercury concentrations were analyzed in macrophage centers from microscope
slides produced from three randomly chosen individuals per species using laser ablation
inductively coupled plasma mass spectrometry. Microscope slides stained with Prussian blue
without counterstain to visualize macrophage centers. Slides were placed into the chamber of a
213 nm Nd:YAG (neodymium‐doped yttrium aluminum garnet) laser source (New Wave
Research, Fremont, CA) and laser ablated material was introduced into a Varian ICP‐MS coupled
to the laser source to monitor samples Mercury (202Hg isotope). Attempts were also made to

65
measure relative concentrations of selenium (78Se isotope), but interferences made noise levels
too high to produce adequate signal for analysis. A CCD camera allowed visualization of
macrophage centers on the slide and direction of the laser to areas of interest.
Areas of MC and adjacent liver parenchyma were compared for mercury content and
the total number of counts of MC and liver tissue was computed for each spot by subtracting
the average noise from each estimate of the number of counts while the laser fired. The
estimated number of counts was reported by the ICP software every 0.44 seconds. During the
first 10 seconds the laser was warming up and the estimates of counts per second during this
period are detector noise. After this period the laser is firing and the average counts per second
of the noise phase of each sampling period was subtracted from the each data point during the
firing of the laser. Negative net count values were treated as zero, and the counts per second
during the firing of the laser were summed for each sampling event as the relative measure of
mercury content for the ablated tissue (Figure 3.1).

66
Time (seconds)
Mer
cury
Co
un
ts (
Hg
202)
0 20 40 60 800
10000
20000
30000
40000
50000
Figure 3.1. Example of mercury signal in Caddo gar MC liver
3.2.5 Total Mercury Analysis in Liver by ICP‐MS
Mercury concentrations were determined by acid digestion and liquid introduction to an
Inductively Coupled Plasma Mass Spectrometer (ICP‐MS). Digestions were carried out with
modification and adaptation of the method used by Ashoka (Ashoka, et al., 2009), in which a
domestic microwave oven was used in closed vessel digestion with nitric acid and hydrogen
peroxide. All samples and standards were made up, digested, and analyzed in in molded
clarified homopolymer polypropylene screw cap digestion vessels (Environmental Express
SC475), which allowed sample preparation and analysis in one vessel and minimized
contamination or loss through vessel transfer. Lyophilized and ground samples were weighed
and placed screw cap digestion vessels and to each tube 1 ml 70% nitric acid (Fischer Scientific,
Trace Metal Grade) and 500 l 50% hydrogen peroxide (Fischer Scientific, certified, stabilized)
were added. A domestic style 700 watt microwave (Maytag Magic Chef, Model number
MCM770W) oven was used in all digestions. Digestions were carried out at 50% power for 1
67
minute followed by a 5 minute rest period; this microwave and rest cycle was carried out three
times on each sample. After digestion and cooling, internal standard and gold solution were
added to digestate and the volume of the samples was brought up to 50 ml with MiliQ water.
All standards and dilutions were made up in 18 M MiliQ water.
A multi‐element standard containing bismuth, holmium, indium, lithium 6, terbium, and
yttrium was used to determine proper dilution of digestate (Ricca Chemica CLISS‐1) by
monitoring the Terbium content during analysis. The final concentration of internal standard
was 50 ppb in each solution. Gold standard was also placed in all solutions to reduce carryover
of mercury (Ricca Chemical MSAU1KN‐100). Gold was also added to ICP wash solution (2% (v/v)
trace metal grade 70% nitric acid) and in both wash solution and analytical solutions the
concentration of gold was kept at 100 ppb. Single element mercury (MSHG1KN100) and
selenium (MSSE1KN100) standards were obtained to produce an external standard curve. To all
solutions 100 ppb gold standard and 50 ppb internal standard were added after digestion and
cooling and before dilution of digestate.
All analyses were conducted using a Varian 820 ICP‐MS with SPS3 Sample Preparation
System autosampler. Isotopic mass data for Mercury 202 were collected. Five estimates of each
measurement were made; percent relative standard deviations and mean counts per second at
each measured mass were reported by Varian Software. Development of standard curves,
calculation of solution and tissue concentrations, and variability in internal standards were
performed on exported data using Microsoft 2007 Excel software.

68
3.3 Results
3.3.1 Image Analysis
Table 3.1
Number and Total Size of Macrophage Centers in Liver and Spleen (Mean + SD)
Species Count Area Percent
Liver Bass 1.60 (1.34) 0.37 (0.43) Catfish 0.8 (0.67) 0.27 (0.21) Bowfin 123.4 (35.25) 6.0 (2.26) Gar 106.2 (8.27) 9.14 (7.50) Spleen
Bass 14.7 (6.35) 5.38 (6.21) Catfish 7.5 (6.35) 2.43 (1.83) Bowfin 2.4 (1.29) 0.12 (0.03) Gar 2.1 (1.48) 0.23 (0.10) The highest liver counts of macrophage center numbers were found in gar and bowfin
(Kruskal‐Wallis, Dunn’s post hoc test, p < 0.05), while those of bass and catfish were very low,
and in some fields none were counted (Table 3.1, Figure 3.2). In spleen, bass and catfish
macrophage numbers were higher than gar and bowfin, but the difference was less pronounced
than that observed in the liver and failed to achieve significance (Kruskal‐Wallis, Dunn’s post
hoc test) (Table 3.1, Figure 3.2).

69
Ave
rag
e N
um
ber
of
MM
C
Bowfin L
iver
Gar L
iver
Bass
Liver
Catfis
h Liv
er
Bowfin S
pleen
Gar S
pleen
Bass
Spleen
Catfis
h Sple
en
0
50
100
150
200
Figure 3.2. Average number of macrophage centers in livers and spleens of Caddo fish (n=5 for each group) (Mean + SD)
When macrophage center areas are compared, the morphologic differences noted in the
macrophage centers during H&E analysis of tissues become apparent. Catfish and bass
macrophage centers were found to be less numerous but significantly larger than those in gar
and bowfin. This difference is reflected in the fact that spleen macrophage center areas show a
greater difference in comparison with bowfin and gar spleen than was apparent when
comparing numbers of macrophages in this tissue (Table 3.1, Figure 3.3). Bowfin liver
macrophage center number was found to be significantly higher than those in the livers of
catfish or bass (Kruskal‐Wallis, p=0.0015, Dunn’s post hoc test), but no other differences were
found to be significant. In the spleen the number of macrophage centers was found to be

70
significantly higher in bass spleen than gar or bowfin (Kruskal‐Wallis, p=0.0032, Dunn’s post hoc
test). No other differences were found to be significant in the spleen.
Gar and bowfin liver MC total relative size is greater in bowfin and gar than it is in bass
and catfish, and that of bass and catfish are greater in than bowfin and gar in spleen. Gar liver
macrophage centers area was found to significantly higher than bass or catfish liver areas
(Kruskal‐Wallis p = 0.00240, Dunn’s post hoc test), no significance was found for any other
differences in area. In the spleen, bass and catfish macrophage center areas were found to be
significantly larger than bowfin (Kruskal‐Wallis, p=0.0014, Dunn’s post hoc test), but no other
difference achieved significance.
Per
cen
t A
rea
of
Liv
er
Bowfin L
iver
Gar L
iver
Bass
Liver
Catfis
h Liv
er
Bowfin S
pleen
Gar S
pleen
Bass
Spleen
Catfis
h Sple
en
0
5
10
15
Figure 3.3. Percentage areas of macrophage centers in liver and spleen of Caddo fish (n=5 for all groups) (Mean + SD)

71
3.3.2 Mercury Localization by ICP‐MS
3.3.2.1 Preliminary Testing
During histologic evaluation, it was found that only gar and bowfin have significant
melanin in macrophage centers, but that all macrophage centers contain iron deposits. Earlier
data showed that H&E staining did not affect mercury determination (data not shown) but the
centers of bass and catfish are very difficult to visualize with H&E stain under the CCD
microscope of the ICP, so a similar study was used to determine the effect of Prussian blue
staining on the determination of mercury in tissue. Two slides of bowfin were made, one
Prussian blue stained and one H&E stained, and laser ablation was performed on both slides at
9 pairs of macrophage centers and adjacent hepatic cells. No statistical significance was found
for differences between Prussian blue stained (ratio of macrophage center to hepatocyte
counts 1.3+ 1.3) and H&E slides (1.23 +0.87) (n=9 paired macrophage and hepatocyte centers,
two sample t‐test, p= 0.896) (figure 3.4). However, signals were relatively low and visualization
in Prussian blue stained slides with counterstain was difficult so modifications were made to
slide preparation in Caddo fish sample preparation. Difficulty in producing raster patterns of
the same uniform size in non‐adjacent pairs also lead to the use of spots in the determination
of mercury content in Caddo fish.

72
Mac
rop
hag
e to
Hep
ato
cyte
Rat
io
H&E Sta
in
Pruss
ian B
lue
Stain
0
1
2
3
Figure 3.4. Ratio of macrophage mercury to adjacent hepatocyte mercury in bowfin test by LA‐ICP‐MS (Mean + SD)
3.3.2.2 Caddo Fish Liver Sample Analysis
In order to increase Hg signal, thicker slides were prepared for LA‐ICP‐MS than those
that were used in the preliminary testing (20 m) and a series of spots rather than raster
patterns was used. As was mentioned in the preliminary testing section, the problem of
comparisons across macrophage‐hepatocyte pairs was reduced by changing from raster
patterns, which are hard to make uniform to dot patterns of specific size. An 80 m spot
diameter was determined to produce adequate signal for sampling of MC and hepatocyte areas
while still being within the range of sizes of macrophage centers.
Due to the thickness of the slides, the staining time for Prussian blue was reduced to
about half the time recommended in the kit (Sigma Aldrich Iron Stain Kit HT20) and the
Pararosaniline counterstain was not used. It was found during the preliminary testing that the

73
Pararosaniline counterstain was difficult to differentiate from Prussian blue on the CCD camera
and, since the goal of this section of the research was to investigate relative ratios of mercury in
macrophage centers and surrounding tissues, recognition of those macrophage centers from
other tissue was of paramount importance. The other tissues of the liver were found to stain
less intensely than macrophage centers and so relevant structures could be easily visualized.
Pairs of macrophage and adjacent hepatocyte pairs were measured for each individual
and the same three individuals that had been selected for determination of mercury speciation
were used for this analysis (Bass 1, 4, 5; Catfish 1, 2, 3; and Gar 2, 3, 5; Bowfin 1, 4, 5). Seven
pairs of macrophage centers and hepatocyte areas were selected from each species (bass, gar,
and bowfin) except for catfish, for which seven pairs were sampled for fish 1, six for fish 2, and
four for 3. Catfish have few, small macrophage centers in liver and in some cases less than
seven were found for sampling. For each pair of macrophage‐hepatocyte areas a ratio for
relative mercury concentration was calculated. The estimates of each of the three fish per
species are thus averages of seven measurements of macrophage counts, mercury counts, and
ratios of macrophage to hepatocyte mercury.
Mercury concentration were found to be significantly higher in bass (one‐tailed t‐test
p=0.0185) (Figure 3.5), Catfish (one‐tailed t‐test p=0.0002) (Figure 3.6) and bowfin (one‐tailed t‐
test p=0.0081) (Figure 3.7), but not in gar (one‐tailed t‐test, p=0.175) (Figure 3.8). Catfish
pancreatic tissue was also sampled for mercury, but levels in this tissue were not high enough
to distinguish from noise using the same conditions of slide preparation and laser settings as
those used to determine macrophage and hepatocyte mercury (n=10, data not shown).
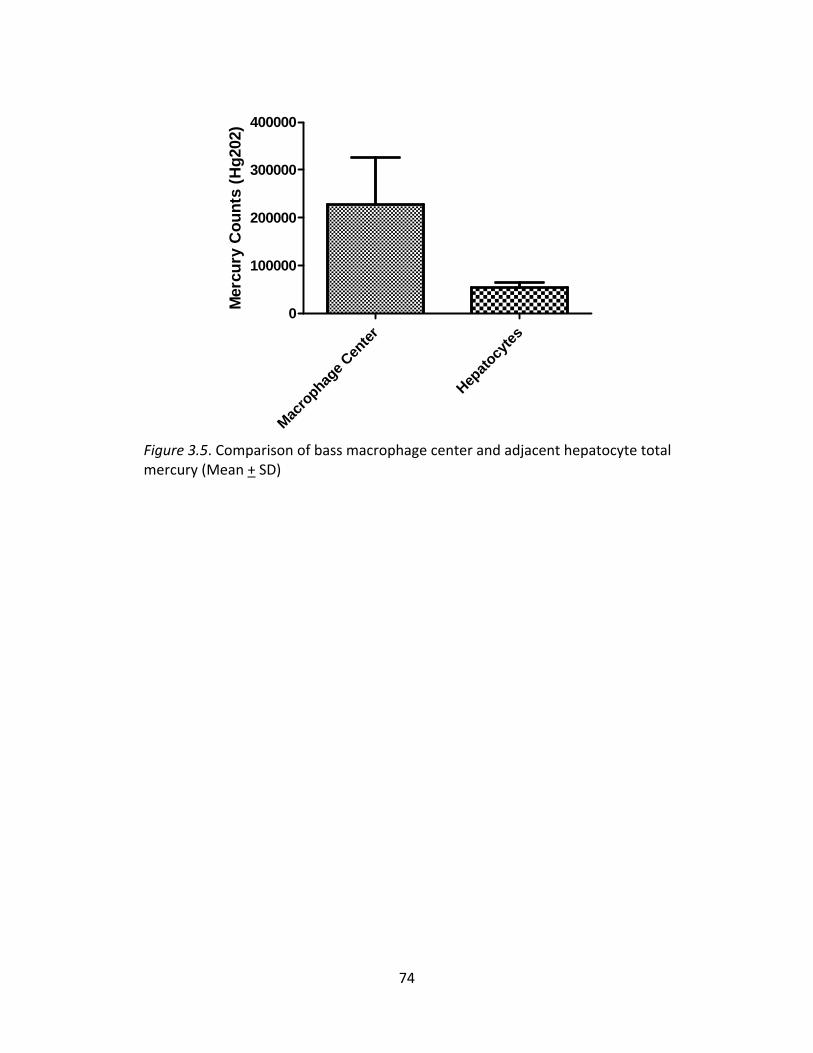
74
Mer
cury
Co
un
ts (
Hg
202)
Mac
rophag
e Cen
ter
Hepat
ocyte
s
0
100000
200000
300000
400000
Figure 3.5. Comparison of bass macrophage center and adjacent hepatocyte total mercury (Mean + SD)

75
Mer
cury
Co
un
ts (
Hg
202)
Mac
rophag
e Cen
ter
Hepat
ocyte
s
0
50000
100000
150000
200000
250000
Figure 3.6. Comparison of catfish macrophage center and adjacent hepatocyte total mercury (Mean + SD)
Mer
cury
Co
un
ts (
Hg
202)
Mac
rophag
e Cen
ter
Hepat
ocyte
s
0
20000
40000
60000
80000
100000
Figure 3.7. Comparison of bowfin macrophage center and adjacent hepatocyte total mercury (Mean + SD)

76
Mer
cury
Co
un
ts (
Hg
202)
Mac
rophag
e Cen
ter
Hepat
ocyte
s
0
100000
200000
300000
400000
500000
Figure 3.8. Comparison of gar macrophage center and adjacent hepatocyte total mercury (Mean + SD)
Neither macrophage center relative mercury counts (Figure 3.9, ANOVA, p=0.157) nor
hepatocyte mercury counts were found to be significantly different across groups, with the
exception of comparisons of hepatocyte counts in gar and catfish (Figure 3.10, ANOVA,
p=0.046).

77
Mer
cury
Co
un
ts (
Hg
202)
Bass
Bowfin Gar
Catfis
h
0
100000
200000
300000
400000
500000
Figure 3.9. Mercury signal in macrophage centers of fish from Caddo Lake (Mean + SD)
Mer
cury
Co
un
ts (
Hg
202)
Bass
Bowfin Gar
Catfis
h
0
100000
200000
300000
Figure 3.10. Mercury signal in hepatocytes of fish from Caddo Lake (Mean + SD)

78
However, when proportions of macrophage center to hepatocyte mercury were
compared, catfish were found to be significantly higher than any other group studied (ANOVA,
p<0.0001, followed by Tukey’s test) (Figure 3.11).
Rat
io o
f M
acro
ph
age
to H
epat
ocy
te T
ota
l Hg
Bass
Bowfin Gar
Catfis
h
0
5
10
15
20
Figure 3.11. Comparison of macrophage to hepatocyte total mercury in Caddo fish livers (Mean + SD) Mercury counts from hepatocyte sampling by LA‐ICP‐MS were found to be highly
correlated with liver total mercury by ICP‐MS liquid digestion (Pearson correlation r2 = 0.91, p
<0.001).
3.3.3 Liver Total Mercury
Total mercury concentrations in liver were determined by liquid introduction to ICP‐MS.
Mercury concentrations were highest in gar (11262 + 14508), followed by bass (3515 + 2997),
with bowfin (1887 + 1293) and catfish (1884 + 1181) having similar average concentrations
(figure 3.12). When total liver mercury was compared to the ratio of mercury signal in
macrophages and hepatocytes a suggestion of decreasing ratio with increasing total mercury
was found (Figure 3.13).

79
Liv
er T
ota
l Hg
(n
g/g
dw
)
Bass
Bowfin Gar
Catfis
h
0
10000
20000
30000
Figure 3.12. Total liver mercury estimated by liquid introduction ICP‐MS (Mean + SD)
Total Liver Mercury (ng/g)
Rat
io o
f M
acro
ph
age
to H
epat
ocy
te T
ota
l Hg
0 10000 20000 30000 400000
5
10
15
Figure 3.13. Total mercury relationship to localization ratio
(catfish, bass, gar, n=3/group)
N=10
N=7
N=9
N=9

80
3.4 Discussion
In this study, macrophage centers follow expected literature distributions across species
(C Agius, 1980) with high abundance in the livers of preteleostean gar and bowfin and much
lower abundances in the livers of the teleostean catfish and bass. The abundance in spleens
likewise was predicted in the literature, with high abundance in the spleens of teleostean fish
and lower levels in the spleens of preteleosts. Tissue tropisms of macrophage centers were thus
found to be consistent with the literature by phylogenetic group. The distribution is consistent
with the pattern of organic to inorganic mercury suggested in earlier studies in Caddo Lake for
spotted gar and largemouth bass (M. M. Chumchal, et al., 2011) under the hypothesis that
macrophage centers are the primary metabolizers of methylmercury in fish tissues.
Establishment of the prevalence of melanomacrophage centers in tissue is not only important
to confirm literature observations ,and to suggest the tissues in which one expects to find
mercury metabolism in a fish species, but is also important in individual fish since MMCs can be
primary germinal centers or may increase in number in pathologic conditions (C Agius, 1980; C
Agius & Roberts, 2003a). One might expect mercury metabolism in preteleostean liver, for
example, under conditions that favor melanomacrophage proliferation in that tissue.
LA‐ICP‐MS has been used to localize elements in animal tissues (Becker & Rubakhin,
2010; Becker, Zoriy, Dobrowolska, & Matusch, 2007; Becker, Zoriy, Dressler, & Wu, 2008) and
has been applied especially to brain research. Application of this technology to tissues derived
from environmental sources has also been carried out, although to a lesser extent than in the
medical sciences. LA‐ICP‐MS has been used to analyze elements from hard tissues of shellfish in
order to monitor environmental changes over time (Bellotto & Miekeley, 2000; Raith, Perkins,

81
Pearce, & Jeffries, 1996), in bark samples (Narewski, Werner, Schulz, & Vogt, 2000), in otoliths
from fish (Brophy, Danilowicz, & Jeffries, 2003; Brophy, Jeffries, & Danilowicz, 2004; Outridge,
Chenery, Babaluk, & Reist, 2002; Vincent, Norman, Yang, Evans, & Sterling, 2007), and most
recently from sides produced from environmental soft tissues (B. D. Barst et al., 2011).
In this study, LA‐ICP‐MS examination of macrophage centers found consistently higher
levels of mercury than adjacent hepatocytes in all fish species, although this difference failed to
achieve significance in the gar. In earlier studies from Caddo Lake, macrophage centers in gar
were found to be higher than adjacent liver tissue (B. Barst, et al., 2011), but in the current
study the general pattern is one of this ratio decreasing as total liver mercury increases. This
suggests that increasing mercury is increasingly portioned into the hepatocyte compartment
and that macrophage centers are slower to increase in mercury as total liver mercury increases.
Catfish, with the lowest liver mercury concentrations have the highest proportion of
macrophage to hepatocyte mercury levels, while gar and bass have higher levels of mercury
and low ratios of macrophage to hepatocyte mercury. The lowest ratios were found in gar with
the highest levels of total mercury. Bowfin do not fit this pattern, and are found to have
relatively low ratios of macrophage mercury to hepatocyte mercury, but in these fish the
concentration of mercury in macrophage centers seems to be lower than that experienced in
other fish. These findings suggest that the more dynamic pool of mercury with increasing
mercury concentrations may be in liver cells, and that macrophage centers may be much less
responsive to changing liver mercury concentrations. Few animal studies have sought to
localize mercury in relation to subcellular structures in environmentally derived liver tissue
(Anan, Kunito, Sakai, & Tanabe, 2002; Baatrup & Danscher, 1987; Ikemoto et al., 2004; Rawson,

82
Patton, Hofmann, Pietra, & Johns, 1993; Woshner et al., 2002) and even fewer have described
localization between cell types from environmental liver samples (Augier, Benkoël, Brisse,
Chamlian, & Park, 1993; M Nigro, 2009; Wagemann, Trebacz, Boila, & Lockhart, 2000). Only one
study found in the literature derived relative abundances between cell types within the liver of
fish (B. D. Barst, et al., 2011). To our knowledge, this is the first study to relate relative mercury
concentrations of macrophages and hepatocytes in liver across species, so further research will
be required to confirm this finding.
Some species of fish livers contain numerous rests of pancreatic cells leading to the
term hepatopancreas to describe the combined liver/pancreatic organ (Di Giulio & Hinton,
2008). In the current study this extensive presentation of pancreatic tissue was found in the
liver of the catfish. Mercury concentrations were found to be beneath detection for pancreatic
tissues in catfish despite the high levels of mercury in macrophage centers that are almost
universally embedded in pancreatic tissue in this species. This shows the specificity of mercury
accumulation into macrophage centers. Due to the lack of mercury concentration in pancreatic
tissues in catfish, this organ is not likely to participate in the metabolism of mercury in fish liver.
Many metals have been shown to accumulate in melanomacrophage centers, including
mercury and selenium (B. D. Barst, et al., 2011; Christensen, Morgensen, & Rungby, 1988; M
Nigro, 2009), cadmium (Grasseschi, Ramaswamy, Levine, Klaassen, & Wesselius, 2003), and iron
(C. Agius, 1979; Wolke, 1992). In this study, mercury was found to accumulate in
melanomacrophages to a greater extent than in other cells of the liver. Accumulation of
inorganic mercury occurs in the livers of animals and can become the predominant form of
mercury in liver with chronic exposure (Yasutake & Hirayama, 2001). Subcellular localization of

83
mercury in rat liver slices exposed to methylmercury by injection show compartmentalization in
hepatocyte mitochondria, which can become uncoupled with mercury exposure and produce
superoxide anion (Dare, Li, Zhivotovsky, Yuan, & Ceccatelli, 2001; Konigsberg, Lopez‐
Diazguerrero, Bucio, & Gutierrez‐Ruiz, 2001; Yasutake & Hirayama, 2001). Superoxide anion has
been shown to be an important mediator of demethylation of methyl mercury (Yasutake &
Hirayama, 2001). Some evidence was found for greater mercury localization in hepatocytes
with increasing liver total mercury which may suggest a greater role for hepatocytes in mercury
metabolism than that of macrophage centers.
This study suggests an accumulation of mercury in macrophage centers and shows that
these structures have tropisms for tissues suggested in the literature based on phylogeny. The
current study is the first to suggest two pools of mercury accumulation in the liver, with
hepatocytes being the more dynamic pool for mercury than melanomacrophages.

84
CHAPTER 4
MERCURY SPECIATION AND SELENIUM TO MERCURY RATIO OF TELEOSTEAN AND
PRETELEOSTEAN FISH FROM CADDO LAKE
4.1 Introduction
Mercury is a widespread contaminant that impacts the health of human populations
and ecosystems. It is found in both inorganic and organic compounds, is environmentally
persistent, and biomagnifies in the food chain (NRC, 2000). In fish, mercury is thought to
accumulate in kidney, muscle, and liver resulting in signs of necrosis with inflammatory
infiltrate (Mela, et al., 2007a), apoptosis with upregulation of apoptotic signaling pathway
genes, and lesions in Disse’s space of the liver (Klaper, et al., 2008). Methylmercury exposure in
fish has been shown to impair coordination and swimming activity (Crump & Trudeau, 2009)
which can reduce species fitness by reducing successful hunting, evasion of predation, and
mating behaviors. Environmentally relevant concentrations of mercury have been shown to
impair reproduction in fish and are thought to act through induction of apoptosis in
steroidogenic cells and/or through disruption of the hypothalamic‐pituitary‐gonadal axis
(Crump & Trudeau, 2009; Drevnick, et al., 2008; Drevnick & Sandheinrich, 2003; Drevnick, et al.,
2006; Vieira, et al., 2009).
Caddo Lake is a freshwater reservoir that spans the Louisiana and Texas border, and is
reported to have among the highest levels of mercury in fish in the state of Texas (TCEQ, 2004).
The Texas side of Caddo Lake is primarily shallow forested wetland while the Louisiana side a
more open water habitat. The mercury levels in fish are significantly higher on the wetland side

85
of the lake than the open water side of the lake (Chumchal MM, et al., 2008). The top predators
in this ecosystem include spotted gar and largemouth bass (M. M. Chumchal, et al., 2011).
Recent evidence from Caddo Lake has shown marked differences in liver mercury
speciation in largemouth bass and spotted gar (M. M. Chumchal, et al., 2011). Mercury in livers
from spotted gar in Caddo Lake have very low proportions of methylmercury, while in bass
almost all of the mercury in the liver is in the methyl form. This difference in predominant form
of mercury may be due to more extensive demethylation in the liver of gar.
Mercury demethylation is known to occur in the tissues of animals and has been
hypothesized to occur through at least two mechanisms. One proposed mechanism is thought
to involve the generation of reactive oxygen species and to be associated with tissues
containing large numbers of phagocytic leukocytes that are capable of producing oxidative
burst (Havarinasab, et al., 2007). Melanomacrophages, a form of fixed tissue macrophage, is
found to be differentially expressed in the different tissues of fish in a phylogenetically
consistent pattern (C Agius, 1980). Another proposed pathway involves ratios of selenium and
mercury that have been linked to mercury demethylation in birds and mammals, and selenium
and selenoproteins have been suggested to be directly related to the mechanism of
demethylation but this mechanism has not been fully described (Eagles‐Smith, et al., 2009; J.
Yang, et al., 2007; Yoneda & Suzuki, 1997).
Melanomacrophage centers (MMCs) (the melanomacrophages of fish) appear to follow
an evolutionary pattern in distribution and degree of organization with a trend from random
distribution and low levels of organization in Condrichthyes and Agantha, to highly organized
structures in the liver of the primitive bony fish, and finally to well‐organized structures in the

86
spleens and kidney of the Teleosts (C Agius, 1980). The presence or absence of such centers,
capable of carrying out oxidative burst activity, may explain the differences in accumulation of
inorganic mercury in the spotted gar and largemouth bass from Caddo Lake.
Selenium has long been associated with protection from mercury toxicity and evidence
for an association of increased inorganic mercury concentrations and selenium to mercury
ratios has been suggested in mammals and birds (Eagles‐Smith, et al., 2009; J. Yang, et al., 2007;
Yoneda & Suzuki, 1997). This association has been hypothesized to be related to the
mechanism of demethylation and evidence of a threshold for mercury demethylation based on
total mercury concentrations and selenium to mercury ratios have been derived. Selenium to
mercury ratios equal to or greater than 1 have been associated with a lack of demethylation
activity while ratios of less than one have been associated with demethylation in liver of birds
and marine mammals (Eagles‐Smith, et al., 2009; J. Yang, et al., 2007). Thresholds of total
mercury concentration for demethylation of methylmercury have been proposed to be 8.51
g/g in birds (Eagles‐Smith, et al., 2009), 20‐30 g/g in Dall porpoises (J. Yang, et al., 2007), and
100 g/g in stripped dolphins (Palmisano, et al., 1995).
This study analyzes mercury species and total mercury in the liver and spleens of
preteleostean and teleostean fish from Caddo Lake and investigates selenium to mercury ratios
and concentrations of mercury in livers of Caddo Lake fish to compare these to values those
observed in bird and mammal species that have been associated with mercury demethylation.
The expected finding of high proportions of inorganic mercury in livers of preteleostean and in
spleens of teleostean fish with predominance of organic mercury in spleens of preteleostean
and livers of teleostean fish would be considered evidence for a primary role of
87
melanomacrophage centers in the demethylation of methylmercury in fish tissue. Selenium to
mercury ratios in liver are also explored as an alternative mechanism for methylmercury
demethylation.
4.2 Materials and Methods
4.2.1 Fish Collection and Processing
Fish were collected in accordance with Texas Parks and Wildlife Scientific Research
Permit No. SPR‐0311‐092 and the University of North Texas Institutional Animal Care and Use
Committee Protocol #11005. Fish were collected from the wetland habitat in the Western edge
of Caddo Lake, near to the city of Uncertain, Texas. The specific fish collection methods used
were electro‐shocking from a boat, gill netting, and line fishing. The target species for this
research were largemouth bass (Micropterus salmonides), channel catfish(Ictalurus punctatus),
spotted gar (Lepisosteus oculatus), and bowfin (Amia rostrata). Collected fish were kept alive in
aerated water until sacrifice.
Fish were sacrificed by placing them in tricane solution (MS222) until dead. Liver and
spleen were placed in labeled quart Ziploc® plastic bags (SC Johnson) and placed on ice for later
mercury analysis. Batches of scintillation vial stored samples were removed from storage and
freeze dried for 72 hours in a lyophilizer (Labconco FreeZone 6‐Liter Console System 7753027)
at ‐56○ C and a pressure of 3.5 pascals (3.45 x 10‐5 atmospheres). Dried samples were ground in
the scintillation vial using glass stir rods. Stir rods were washed three times between each
sample in deionized water and wiped clean before moving to the next sample. Ground samples
were stored at ‐80○ C until mercury content analysis was carried out.

88
4.2.2 Determination of Tissue Mercury
4.2.2.1 Mercury Speciation by CVAFS
Samples for mercury speciation were weighed digested in 7ml of 4.57 N nitric acid in a
60○ C water bath for 12 hours. Digestates were separated into two subsamples: one for
detection of monomethylmercury and one for determination of total mercury. Speciation
digestates were analyzed for monomethylmercury with a mercury speciation analyzer (MSA) by
derivation with sodium tetraethylborate (NaTEB) and detection with flow‐injection gas
chromatographic atomic fluorescence spectrometry. The mercury species analyzer produces
ethylmethylmercury and diethylmercury by NaTEB derivatization of the aqueous sample. The
MSA then strips the derivatized methylmercury from the aqueous solution through gas‐liquid
separation with a nitrogen carrier gas, preconcentrates sample on Tenax cartridges and
thermally releases ethylated mercury species into an argon carrier gas. The concentrated
sample is then isothermally separated on a 30x3.2 mm column packed with Chromosorb
WAW‐DMSC coated with 15% OV‐3, and finally pyrolytically decomposes the ethylated mercury
species and detects the resulting mercury vapor with cold vapor atomic fluorescence
spectrometry (Tseng, Hammerschmidt, & Fitzgerald, 2004). The total mercury portion of the
digestate was treated with BrCl for 12 hours to oxidize mercury, followed by addition of
stannous chloride as a reductant at least one hour prior to mercury determination by dual‐Au
amalgamation CVAFS (Hammerschmidt & Fitzgerald, 2006).
Due to the cost of mercury speciation analysis three of the individuals for each species were
chosen randomly for mercury speciation analysis.

89
4.2.2.2 Total Mercury and Selenium by ICP‐MS
Mercury and selenium concentrations were determined in liver tissue by acid digestion
and liquid introduction to an Inductively Coupled Plasma Mass Spectrometer (ICP‐MS). Liver
subsamples of the three fish used for estimation of mercury speciation were analyzed for total
mercury and selenium along with other samples in this portion of the research. Digestions were
carried out with modification and adaptation of the method used by Ashoka (Ashoka, et al.,
2009), in which a domestic microwave oven was used in closed vessel digestion with nitric acid
and hydrogen peroxide. All samples and standards were made up, digested, and analyzed in in
molded clarified homopolymer polypropylene screw cap digestion vessels (Environmental
Express SC475), which allowed sample preparation and analysis in one vessel and minimized
contamination or loss through vessel transfer. Lyophilized and ground samples were weighed
and placed screw cap digestion vessels and to each tube 1 ml 70% nitric acid (Fischer Scientific,
Trace Metal Grade) and 500 l 50% hydrogen peroxide (Fischer Scientific, certified, stabilized)
were added. A domestic style 700 watt microwave (Maytag Magic Chef, Model number
MCM770W) oven was used in all digestions. Digestions were carried out at 50% power for 1
minute followed by a 5 minute rest period; this microwave and rest cycle was carried out three
times on each sample. After digestion and cooling, internal standard and gold solution were
added to digestate and the volume of the samples was brought up to 50 ml with MiliQ water.
All standards and dilutions were made up in 18 M MiliQ water.
4.2.2.3 Quality Control Samples for Speciation Method
In the mercury speciation method certified reference materials (DORM‐3, TORT‐2,
DOLT‐3 from National Research Council Canada) were run for confirmation of recovery, relative

90
percent differences between duplicates were calculated as estimates of analytical precision,
and relative standard deviations of replicate triplicate readings of the same digestate were
computed for estimation of procedural precision. Calibration curves were included with each
batch run and correlation coefficients were greater than 0.9995. Methylmercury percent
recovery in DORM‐3 and TORT‐2 were 94.1 and 102% respectively. Total mercury recovery was
101% and for TORT‐2 was 106%.
4.2.2.4 Quality Control Samples for Total Mercury/Selenium Method
In the total mercury/total selenium method multi‐element standard was used to
determine proper dilution of digestate (Ricca Chemica CLISS‐1) by monitoring the Terbium
content during analysis. The final concentration of internal standard was 50 ppb in each
solution. Gold standard was also placed in all solutions to reduce carryover of mercury (Ricca
Chemical MSAU1KN‐100). Gold was also added to ICP wash solution (2% (v/v) trace metal
grade 70% nitric acid) and in both wash solution and analytical solutions the concentration of
gold was kept at 100 ppb. Single element mercury (MSHG1KN100) and selenium (MSSE1KN100)
standards were obtained to produce an external standard curve. To all solutions 100 ppb gold
standard and 50 ppb internal standard were added after digestion and cooling and before
dilution of digestate.
All analyses were conducted using a Varian 820 ICP‐MS with SPS3 Sample Preparation
System autosampler. Isotopic mass data for Mercury 202 were collected. Five estimates of each
measurement were made; percent relative standard deviations and mean counts per second at
each measured mass were reported by Varian Software. Development of standard curves,

91
calculation of solution and tissue concentrations, and variability in internal standards were
performed on exported data using Microsoft 2007 Excel software.
Certified reference materials (DOLT‐3 and DORM‐3) were used to verify the accuracy of
the method and these samples were run in duplicate. Pre‐digestion and post digestion spiked
samples were used to test recovery and possible analyte loss during the digestion process. All
spike and duplicate recoveries were between 86 and 124%.
4.3 Results
4.3.1 Mercury Speciation in Liver and Spleen Tissues
Liver mercury raw data show high levels of variability between individuals and across
species in terms of total mercury, methylmercury, and the percent of liver mercury burden as
methylmercury. Total liver mercury was highest in gar, while methylmercury was found to be
highest in bass. Bass were also found to have high percentages of total liver mercury as
methylmercury. Spleen concentrations of mercury species were also variable, but were, in
general, much higher in methylmercury than liver tissue for any species except bass (Table 4.1).
Table 4.1
Caddo Tissue Total Mercury and Methylmercury Content (Mean + SD, n=3 all groups)
Sample Methylmercury (ng/g dw)
Total Mercury (ng/g dw)
Percentage of Total Mercury as Methylmercury
Liver
Bass 1943 (1049) 3650 (2688) 59 (13) Catfish 499 (113) 2927 (1182) 18 (5) Gar 1108 (533) 23090 (17832) 8 (6) Bowfin 632 (408) 3260 (2026) 19 (6) Spleen Bass 731 (731) 1190 (1197) 64 (8) Catfish 204 (62) 279 (93) 75 (20)

92
Sample Methylmercury (ng/g dw)
Total Mercury (ng/g dw)
Percentage of Total Mercury as Methylmercury
Gar 723 (451) 1017 (374) 74 (10) Bowfin 382 (261) 490 (465) 78 (8)
Total mercury concentrations in fish livers were found to be similar in all species except
the gar, which was at least 6 times higher than the other species tested. Despite the large
difference in gar total liver mercury in comparison with other species, differences failed to
achieve statistical significance due to small sample size and one gar that had about 10 times
less liver mercury than the other individuals analyzed (One‐way ANOVA, p= 0.067). The high
level of liver mercury in gar is consistent with the literature regarding bass in Caddo lake
(Chumchal MM, et al., 2008) (Figure 4.1).
To
tal L
iver
Mer
cury
(n
g/g
dw
)
Bass
Catfis
hGar
Bowfin
0
10000
20000
30000
40000
Figure 4.1. Liver total mercury (Mean + SD, n =3 for all groups)
Methylmercury values were similarly variable with being the highest concentrations in
bass at 1943 (+ 1049) ng/g dw, followed by gar with 1108 (+ 532.6), bowfin with 632.0 (+ 408.2)

93
and catfish with 499.3 (+ 112.9) ng/g dw. Differences in methylmercury content failed to
achieve statistical significance (One‐way ANOVA, p=0.0799) (Figure 4.2).
Met
hyl
mer
cury
(n
g/g
dw
)
Bass
Catfis
hGar
Bowfin
0
1000
2000
3000
Figure 4.2. Liver methylmercury (Mean + SD, n=3 for all groups)
The percentage of liver mercury burden as methylmercury was found to be different
among species, and was found to be significantly higher in the bass over other tested fish
species (ANOVA followed by Tukey’s Test, p= 0.0003), no other differences were found to be
significant between species (Figure 4.3).

94
Per
cen
t M
eth
ylm
ercu
ry
Bass
Catfis
hGar
Bowfin
0
20
40
60
80
Figure 4.3. Liver percent of total mercury as methylmercury (Mean + SD, n=3 for all groups)
Total spleen mercury was quite variable across individuals and was found to be highest
in bass 1190 (+ 1197), followed by gar 1017 (+ 647.3), bowfin 489.7 (+ 465.0) and catfish 278.2
(+ 92.92) ng/g dw (Figure 4.4). No significant differences were found between species for total
mercury in spleen.
b
a
b
b

95
To
tal L
iver
Mer
cury
(n
g/g
dw
)
Bass
Catfis
hGar
Bowfin
0
1000
2000
3000
Figure 4.4. Spleen total mercury (Mean + SD, n=3 for all groups)
Estimates of methylmercury concentrations in spleen tissue showed the same variability
and pattern as those for total mercury with bass and gar showing the highest concentrations:
730.7 (+ 730.8) and 723.3 (+ 451.4) ng/g dw, respectively. Bowfin 381.7 (+ 379.3) and gar 203.7
(+ 6.27) ng/g dw showed lower concentrations (Figure 4.5). No significant differences were
found for methylmercury concentrations in spleen across species.

96
Met
hyl
mer
cury
(n
g/g
dw
)
Bass
Catfis
hGar
Bowfin
0
500
1000
1500
2000
Figure 4.5. Spleen methylmercury (Mean + SD, n=3 for all groups)
The proportions of total mercury in spleen that were found to be methylmercury were
less variable than absolute mercury species concentrations, both among individuals and across
groups. All fish species tested had methylmercury as the predominant form of mercury in the
spleen (Figure 4.6). No significant differences were found across species for the percentage of
total mercury as methylmercury in spleen.

97
Per
cen
t M
eth
ylm
ercu
ry
Bass
Catfis
hGar
Bowfin
0
20
40
60
80
100
Figure 4.6. Spleen percent of total mercury as methylmercury (Mean + SD, n=3 for all groups)
Determination of percentage recoveries were very close to CRM published values and lend
confidence to the accuracy of mercury speciation analysis. Total liver mercury was found to be
highest in the gar and lowest in bowfin. Liver inorganic mercury proportions were highest in
gar, but were closely followed by catfish and bowfin, and were lowest in bass (significantly
lower than all other groups). Spleen total and methyl mercury concentrations mirrored each
other, with concentrations highest in bass and gar, and lower in bowfin and catfish. No
significant differences were found for proportions of methylmercury among groups in spleen.
Methylmercury was found to be the majority of total mercury in the spleens of all groups of
Caddo fish. Total mercury was found to be higher in the liver of all groups of fish than in spleen.
4.3.2 Total Mercury and Selenium Analysis in Liver
Gar show higher levels of total liver mercury than catfish, but all other comparisons of
groups failed to be associated with significant difference (ANOVA, p = 0.036, followed by

98
Tukey’s Test) (Figure 4.7). Bowfin were found to have significantly higher levels of selenium
than all other groups of fish (Figure 4.8, ANOVA p=0.001, followed by Tukey’s Test).
Liv
er M
ercu
ry (
ng
/g)
Bass
Catfis
hGar
Bowfin
0
10000
20000
30000
Figure 4.7. Fish liver mercury (Mean + SD, n)
Liv
er S
elen
ium
(n
g/g
)
Bass
Catfis
hGar
Bowfin
0
20000
40000
60000
80000
Figure 4.8. Fish liver selenium (Mean + SD, n)
10
9
9
7
9
910
7

99
The ratio of mercury liver concentrations to selenium concentrations were found to be
significantly lower for bowfin than all other fish (ANOVA, p=0.0006, followed by Tukey’s Test)
(Figure 4.9).
Mer
cury
to
Sel
eniu
m R
atio
Bass
Catfis
hGar
Bowfin
0
20
40
60
Figure 4.9. Ratio of selenium to mercury (Mean + SD, n)
99
10
7

100
Figure 4.10. Association between selenium and mercury Levels
No obvious pattern of association was found between total mercury and selenium
concentrations in fish livers across species (Pearson correlation, p = 0.35)(Figure 4.10), nor
within species except in the gar. In the gar increasing mercury was found to be associated with
increased selenium (Pearson correlation, p <0.0001, r = 0.9878)(figure 4.11). The lack of
apparent association of mercury and selenium concentrations in fish other than gar may be due
to the low variation in mercury levels in other fish. Gar have individuals with liver mercury
concentrations similar to those of other Caddo fish groups, but also have individuals with
mercury levels that are more than seven times higher.
0
10000
20000
30000
40000
50000
60000
70000
80000
90000
0 5000 10000 15000 20000 25000 30000 35000 40000
Selenium Concentration in
Cad
do Fish Liver (ng/g dw)
Mercury Concentration in Caddo Fish Liver (ng/g dw)
Bass
Catfish
Bowfin
Gar

101
Figure 4.11. Association of gar liver selenium and total mercury
Ratios of selenium to mercury of 1 or lower, that ratio often associated with
demethylation activity in the literature, are only achieved in two gar and one bass in this study.
Other fish range in selenium to mercury ratio from 1.45 in a bass to a high of 70.23 in a bowfin
and in general selenium concentration is higher in liver tissue from Caddo fish than is mercury
(Table 4.2).
0
5000
10000
15000
20000
25000
30000
35000
0 5000 10000 15000 20000 25000 30000 35000 40000
Gar Liver Selenium Concentration (ng/g)
Gar Liver Mercury Concentration (ng/g)
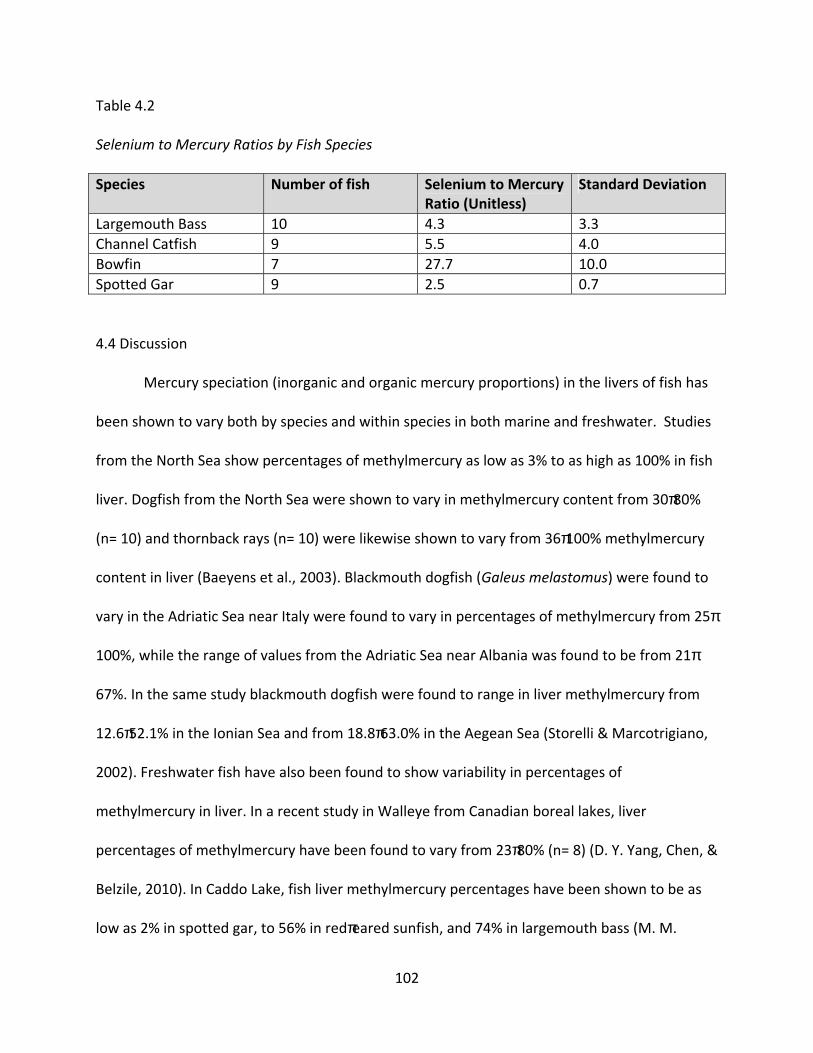
102
Table 4.2
Selenium to Mercury Ratios by Fish Species
Species Number of fish Selenium to Mercury Ratio (Unitless)
Standard Deviation
Largemouth Bass 10 4.3 3.3 Channel Catfish 9 5.5 4.0 Bowfin 7 27.7 10.0 Spotted Gar 9 2.5 0.7
4.4 Discussion
Mercury speciation (inorganic and organic mercury proportions) in the livers of fish has
been shown to vary both by species and within species in both marine and freshwater. Studies
from the North Sea show percentages of methylmercury as low as 3% to as high as 100% in fish
liver. Dogfish from the North Sea were shown to vary in methylmercury content from 30‐80%
(n= 10) and thornback rays (n= 10) were likewise shown to vary from 36‐100% methylmercury
content in liver (Baeyens et al., 2003). Blackmouth dogfish (Galeus melastomus) were found to
vary in the Adriatic Sea near Italy were found to vary in percentages of methylmercury from 25‐
100%, while the range of values from the Adriatic Sea near Albania was found to be from 21‐
67%. In the same study blackmouth dogfish were found to range in liver methylmercury from
12.6‐52.1% in the Ionian Sea and from 18.8‐63.0% in the Aegean Sea (Storelli & Marcotrigiano,
2002). Freshwater fish have also been found to show variability in percentages of
methylmercury in liver. In a recent study in Walleye from Canadian boreal lakes, liver
percentages of methylmercury have been found to vary from 23‐80% (n= 8) (D. Y. Yang, Chen, &
Belzile, 2010). In Caddo Lake, fish liver methylmercury percentages have been shown to be as
low as 2% in spotted gar, to 56% in red‐eared sunfish, and 74% in largemouth bass (M. M.

103
Chumchal, et al., 2011). Few studies in the literature detail the speciation of mercury in fish
spleen.
Despite the variability between individuals in absolute concentrations of mercury
species in tissues, the variability of the proportionality of total mercury as methylmercury (and
thus relative mercury speciation) is much lower and is consistent with a pattern of high
proportions of methylmercury in the livers of bass over catfish, gar, and bowfin. Caddo gar are
shown to be high in total mercury, as was shown in earlier work (M. Chumchal, Rainwater,
Cobb, & Smith, 2008; M. M. Chumchal, et al., 2011), but other fish, with lower levels of total
mercury show similar proportionality of organic to inorganic mercury in the liver. This suggests
that mercury content, itself, is not the prime driver for the difference in mercury species
proportionality. Spleen data seem to show that the mechanism responsible for increased
proportions of inorganic mercury in the livers of catfish, gar, and bowfin are not at work in this
tissue, and no evidence for species specific differences in mercury form is evident from analysis
of this tissue.
Melanomacrophages, fixed tissue macrophages of fish, are expected to follow specific
tissue tropisms based on phylogenetic relationships. These centers of macrophage aggregates
occur predominantly in spleen and kidney of teleostean fish, and in the livers of preteleostean
fish (C Agius, 1980). They are found in abundance in the spleen of teleostean fish, such as bass
and catfish, and in the livers of preteleostean fish, such as gar and bowfin. The findings from
this study are not consistent with the pattern expected in mercury speciation under the
hypothesis that the primary driver of demethylation of methyl mercury is melanomacrophage
centers. One would expect to find a predominance of inorganic mercury in the livers of the

104
preteleostean gar and bowfin, while in livers of teleostean catfish and bass, methylmercury
would be expected to dominate. The current findings reiterate those of Chumchal et al. (2011)
in that gar are found to have very high proportions of inorganic mercury in liver, while bass
have high proportions of methylmercury in liver, but the high proportion of inorganic mercury
in livers of catfish is unexpected.
One primary determinant of mercury concentration in fish is stable nitrogen isotopic
ratios, with higher trophic levels correlating with higher 15N (Cabana & Rasmussen, 1994),
which itself correlates with mercury content of fish tissues (Boudou & Ribeyre, 1997; K. Kidd, et
al., 1995). Some studies have also found that the nature of the base of the food chain from
which organisms are feeding affects mercury concentration. This can be estimated through the
measuring of the ratios of carbon stable isotopic ratios ( 13C and 12C). High 12C correlates
with feeding from a food chain based in phytoplankton, while high 13C indicates a carbon
source in periphyton (France, 1995; Hecky & Hesslein, 1995). Phytoplankton based food webs
have associated with higher mercury concentrations when compared with same trophic level
species that feed on periphyton‐based communities (Gorski, et al., 2003; K. A. Kidd, et al., 2003;
Power, et al., 2002). Work at Caddo Lake has failed to show stable carbon isotopic ratios as
significant determinants of mercury concentrations in fish tissues (Chumchal MM & Hambright
KD, 2009). In addition to the concentration of total mercury in fish tissue with trophic level, the
proportion of total mercury in animal tissue that is represented by methylmercury is thought to
increase with increasing trophic level (Bowles, Apte, Maher, Kawei, & Smith, 2001; M. M.
Chumchal, et al., 2011).

105
Catfish from Caddo Lake have been estimated to occupy as lower trophic level (3.3 +
0.4) than that of largemouth bass (4.1 + 0.1) or spotted gar (4.5 + 0.1) based on stable nitrogen
isotopic ratios (Chumchal MM & Hambright KD, 2009). While the predominance of inorganic
mercury in the liver of the catfish may be explained by feeding behavior and trophic level, the
findings from spleen are more difficult to explain.
This study finds no difference between proportions of methylmercury in the spleens of
the species tested. Under the hypothesis that macrophage centers are responsible for
demethylation of methylmercury one would expect to find high proportions of inorganic
mercury in the spleens of the teleostean bass and catfish and low proportions in the
preteleostean gar and bass. In the current study all fish tested had a predominance of
methylmercury in spleen tissue. The overall concentration of mercury was found to be lower in
the spleens than liver of all species tested, and it is possible that this low total mercury content
is below some threshold for active demethylation in the tissue. Thresholds for active
demethylation have been hypothesized to occur in the livers of seabirds and marine mammals
and the mechanism, and hence the threshold for demethylation of methylmercury may be
similar in liver and spleen tissue (Eagles‐Smith, et al., 2009; J. Yang, et al., 2007).
It is widely accepted that selenium has a protective effect against mercury toxicity, but
the underlying mechanisms for this protective effect are not known. Some studies have found
selenium exposure to increase mercury elimination but in others to be without effect. Recently,
high selenium diets have been found to decrease assimilation efficiency in fish orally exposed
to inorganic mercury, but not organic mercury (Dang & Wang, 2011). In the rat, co‐
administration of methylmercury and selenium has been found to decrease biliary mercury

106
elimination (Urano, et al., 1997). Increased levels of mercury have also been associated with
increased selenium in mammalian and bird tissues, and selenium:mercury ratios of 1:1 have
been specifically linked to increased demethylation (Eagles‐Smith, et al., 2009; J. Yang, et al.,
2007; Yoneda & Suzuki, 1997). Ratios of mercury and selenium with selenium in molar excess
have been associated with those individuals below the threshold for demethylation, while 1:1
or even mercury excess have been associated with demethylation (Eagles‐Smith, et al., 2009).
However, it has been suggested that this 1:1 ratio is more appropriately associated with
selenium:inorganic mercury than total mercury. Detoxification is thought to culminate in the
formation of complexes of inorganic mercury bound with selenoproteins or selenium salts in
crystals (Khan & Wang, 2009; J. Yang, et al., 2007). Selenoproteins include the important
antioxidant protein glutathione peroxidase which is upregulated in oxidative stress (Reeves &
Hoffmann, 2009).
High concentrations of selenium have been shown to be toxic in fish and recent
research suggests that excess selenium induces oxidative stress in trout hepatocytes (Misra &
Niyogi, 2009). A tissue‐based criterion for selenium in aquatic life of 4.0 g/g has been
suggested based on conservative extrapolation of health effects in fish from whole‐body
laboratory and field data (Hamilton, 2002). The proposed tissue‐based criterion is lower than
most of the liver concentrations in Caddo fish, however this health based estimated refers to
whole body burden and liver and kidneys are routinely found to have high concentrations
relative to other tissues. Liver concentrations in marine fish have been found to range from 2.6
to 150 g/g (30 g/g fresh weight) dry weight. Values in Largemouth bass have ranged from 4
g/g in relatively uncontaminated waters (<5 ppb) to 51 g/g in heavily contaminated waters

107
(22.6 ppb) (estimates converted from fresh weight to dry weight by factor of five). In carp the
proportion of liver to whole body selenium was found to be 3.6 times higher, so an estimate of
liver concentrations associated with a whole body burden of 4 g/g would be about 14.4 g/g
(Eisler, 1985). Selenium levels in bass and catfish are below the concentration estimated to be
associated with health effects, but gar and bowfin may be at risk from selenium related toxicity.
Selenium concentrations were found to be highest in the livers of gar and bowfin, and
these were estimated to be at a level that could be associated with selenium toxicity. Selenium
concentrations in bowfin are high despite relatively low levels of mercury, and selenium and
mercury were found to be correlated in the livers of the gar. This correlation may occur in other
fish, but only be appreciated in the gar due to the broad range of mercury concentrations in
this species, or may represent a threshold for selenium retention at higher levels of mercury.
Selenium to mercury rations of 1 or less were found only in one bass and the gar with the two
highest levels of mercury. Molar excess of selenium does not appear to be associated with the
predominance of inorganic mercury in the livers of Caddo Lake fish, as has been suggested in
birds and marine mammals. No evidence for a selenium‐driven mechanism for demethylation
of methylmercury was found in this study.
Concentrations of total mercury above the proposed 8.51 g/g for the threshold of
demethylation in birds were only achieved in two bass and two gar, threshold concentration
associated with demethylation in Dall’s porpoises (20‐30 g/g) (J. Yang, et al., 2007) were only
achieved in the two highest gar, and no fish in the present study achieved the liver total
mercury concentration of 100 g/g proposed as the demethylation threshold in striped
dolphins (Palmisano, et al., 1995). In general then, concentrations of mercury in liver tissues of

108
fish from Caddo Lake are not as high as those thought to be associated with demethylation of
methylmercury in birds and mammals. Nonetheless high proportions of inorganic mercury in
the livers of all fish except largemouth bass were found. It is unlikely that the mechanism
responsible for the predominance of inorganic mercury in the livers of gar, catfish, and bowfin
are driven by the same kinds of thresholds suggested in earlier studies in other species.
In general the pattern of mercury speciation in liver and spleen in fish from Caddo Lake
do not show the high proportions of methyl mercury in the livers and low proportions of
methylmercury in spleens of channel catfish and largemouth bass expected if
melanomacrophages are primary demethylators in these tissues. Channel catfish had significant
proportions of inorganic mercury in liver. Currently no evidence for a pattern of demethylation
consistent with a primary role of melanomacrophages in the tissues of fish was found.
This study shows, in gar, the fish species with the broadest range of mercury
concentration, a correlation between mercury concentration and selenium concentration. This
is also the fish with the highest proportion of inorganic mercury. This increasing selenium
concentration with increasing mercury may be directly related to the mechanism of
methylmercury demethylation, or it may be secondary to the binding and inactivation of
inorganic mercury in the liver. No evidence for mercury speciation association with selenium to
mercury ratio was found in the current study.
The current study fails to show a pattern of mercury speciation in liver and spleen
suggestive of a primary role for melanomacrophages in the demethylation of mercury. This
study is the first to show a departure in fish from the selenium to mercury ratio that has been
associated with mercury demethylation in birds and mammals. This difference in selenium to

109
mercury ratio in fish with high proportions of hepatic inorganic mercury may suggest
differences in mercury demethylation mechanisms or mechanisms of mercury retention in fish
from those active in birds and mammals.

110
CHAPTER 5
GENERAL DISCUSSION
The four fish species from Caddo Lake represent teleostean and preteleostean groups
and were chosen to test the hypothesis that inorganic mercury content in the tissues of fish is
directly related to the presence and number of macrophage centers in those tissues.
Teleostean bass and catfish were found to have lower numbers of macrophage centers in their
livers than the preteleostean bowfin and gar. Spleens of teleostean fish were found to have
more macrophage centers than those of preteleostean fish. These findings were expected,
were the basis of their choice for hypothesis testing, and are in agreement with the literature (C
Agius, 1980).
The morphology of macrophage centers in spleen and liver were found to vary based on
fish species. These differences are reflected in estimates of center number and relative surface
area of tissue sections. Bowfin and gar tended to have many small centers while bass and
catfish tended to have smaller numbers of larger macrophage centers.
Mercury speciation data showed that livers of catfish, gar, and bowfin were not
significantly different from one another in the percentage of total mercury as inorganic
mercury, but that bass were much lower in inorganic mercury fraction than the other species.
Two gar with the highest levels of liver total mercury were found to have higher proportions of
inorganic fraction than other gar. Gar and bowfin were expected to have a predominance of
inorganic mercury under the macrophage metabolism hypothesis, but the high inorganic
mercury fraction in catfish was not predicted and is at variance with this hypothesis. It could be

111
argued that this predominance of inorganic mercury is the result of dietary input of inorganic
mercury rather than methylmercury (prehepatic hypothesis).
In Caddo Lake, channel catfish have been shown to occupy a lower trophic position than
that of largemouth bass or spotted gar by stable nitrogen isotopic ratio but all feed from a
littoral foodweb (Chumchal MM & Hambright KD, 2009). As was discussed in Chapters 1 and 4,
the percentage of methylmercury in tissue is thought to increase with increasing trophic level.
The possibility remains that catfish oral exposures may be partially responsible for their high
proportion of inorganic to organic mercury.
All spleen tissues showed a predominance of organic mercury fraction despite
differences in macrophage content. Under the macrophage metabolism hypothesis inorganic
mercury fractions were expected to be higher in the spleens of bass and catfish than in gar and
bowfin. These findings fail to support the macrophage metabolism hypothesis. However, since
spleen total mercury concentrations (744+727) are significantly lower than those experienced
in the liver (8232+37800) on a ng/g basis (Welch‐corrected unpaired t‐test, p=0.0257, n=12,
speciation estimates), it is possible, if there is a threshold for demethylation as is suggestion in
some of the literature, that concentrations never reach a level consistent with significant
demethylation activity.
The current data do not support hypotheses I or II:
Hypothesis I: Methylmercury demethylation is much more active in the liver of preteleostean
fish than teleostean fish.

112
Hypothesis II: Methylmercury demethylation is much more active in the spleen of teleostean
fish than in preteleostean fish.
In Caddo Lake, channel catfish have been shown to occupy a lower trophic position than
that of largemouth bass or spotted gar by stable nitrogen isotopic ratio but according to stable
nitrogen isotopic ratio data they seem to all feed from a littoral foodweb (Chumchal MM &
Hambright KD, 2009). The possibility remains that catfish oral exposures may be partially
responsible for their high proportion of inorganic to organic mercury.
All spleen tissues showed a predominance of organic mercury fraction despite
differences in macrophage content. Under the macrophage metabolism hypothesis inorganic
mercury fractions were expected to be higher in the spleens of bass and catfish than in gar and
bowfin. These findings fail to support the macrophage metabolism hypothesis. However, since
spleen total mercury concentrations (744+727) are significantly lower than those experienced
in the liver (8232+37800) on a ng/g basis (Welch‐corrected unpaired t‐test, p=0.0257, n=12,
speciation estimates), it is possible, if there is a threshold for demethylation as is suggestion in
some of the literature, that concentrations never reach a level consistent with significant
demethylation activity.
The relative area of macrophage centers was found to increase with increasing mercury
in all species examined. The slope of increase in macrophage center area per unit mercury was
greater for gar and bowfin than for catfish and bass. The higher response in the preteleostean
fish over teleostean fish may reflect differences in physiology. For preteleostean fish, that have
primary fixed macrophages in their livers, response to mercury may produce hypertrophy in
centers already present. In the teleostean bass and bowfin the lower response slope may be

113
reflective of the recruitment of secondary or reactive macrophage centers as mercury levels
increase.
There was a suggestion that total mercury was found to be higher in gar liver than that
of the livers of other fish species, but this difference only achieved statistical significance when
compared to the concentrations in catfish liver. Higher levels of gar liver mercury were due
primarily to two fish that
The relative area of macrophage centers was found to increase with increasing mercury
in all species examined. The slope of increase in macrophage center area per unit mercury was
greater for gar and bowfin than for catfish and bass. The higher response in the preteleostean
fish over teleostean fish may reflect differences in physiology. For preteleostean fish, that have
primary fixed macrophages in their livers, response to mercury may produce hypertrophy in
centers already present. In the teleostean bass and bowfin the lower response slope may be
reflective of the recruitment of secondary or reactive macrophage centers as mercury levels
increase.
There was a suggestion that total mercury was found to be higher in gar liver than that
of the livers of other fish species, but this difference only achieved statistical significance when
compared to the concentrations in catfish liver. Higher levels of gar liver mercury were due
primarily to two fish that were found to have concentrations of mercury much higher than the
other gar tested.
The current data do not support hypothesis III:
Hypothesis III: The organic:inorganic mercury ratio is higher in tissue and fish with high
abundance of tissue macrophages.

114
Localization and comparison of relative mercury and selenium content was performed
on macrophage centers and surrounding liver parenchyma. All species, with the exception of
gar, showed significantly higher concentrations of mercury in macrophage centers than in
surrounding liver tissue. The ratio of macrophage to hepatocyte mercury seems to decrease
with increasing total liver mercury, suggesting that the hepatocyte mercury may be more
important in the metabolism of mercury than macrophages. These findings support hypothesis
IV, but tend to support a hepatic mechanism for methylmercury demethylation, rather than a
macrophage mechanism:
Hypothesis IV: tissue mercury levels are higher in areas of MMCs and deposits than in
surrounding parenchyma.
Histologic examination was carried out to determine possible signs of pathology in fish
in relation to the predominant species of mercury in the tissue. Predominance of inorganic
mercury was expected to be associated with increased liver pathology. Liver parenchymal tissue
was found to vary greatly based on species. Catfish were found to have significant inclusions of
pancreatic tissue in liver (hepatopancreas), while pancreatic tissue was rare in the livers of the
other fish species examined. Gar reference and Caddo fish were found to have germinal centers
in perivascular cuffs while these were not apparent in other fish species.
Macrophage centers were found to vary not only in size and number, but were also
different in pigment content. Gar and bowfin macrophages can truly be called
melanomacrophages and are characterized by having very high melanin content, with gar
melanin content higher than bowfin. Catfish and bass had very low levels of melanin in

115
macrophage centers. All macrophage centers were found to contain iron, and this was the
predominant pigment along with lipofuscin in bass and catfish macrophages.
No evidence of histopathology was observed in Caddo fish over reference fish with H&E
staining. As was discussed in Chapter two, this is not surprising since average liver
concentrations in the Caddo fish were than those found in the literature that were associated
with histopathologic lesions. Fish populations have also been found to develop tolerance to
mercury exposure in contaminated environments (Klerks & Weis, 1987; J. S. Weis & Weis, 1984,
1989; P. Weis, 1984). Incidental findings included a benign tumor in one bowfin liver,
consistent with biliary adenoma, and parasitic worm infection in Caddo and reference bass.
Vacuolation of reference fish livers was noted, but later found to be a likely result of increased
glycogen storage by PAS stain. Iron deposition (hemosiderin) was found in Caddo, but not
reference fish, hepatocytes. The severity of iron deposition by group appeared to be associated
with those groups having high proportions of inorganic mercury.
The data findings on hepatic hemosiderosis tend to support hypothesis V:
Hypothesis V: In the tissue of active methylmercury demethylation increased levels of
histopathology will be found.
Overall, the data analyzed support a lack of primary role for macrophages in the
demethylation of methylmercury in the liver. Little evidence was found for thresholds for
demethylation similar to those found in aquatic mammals or birds in the ratio of selenium to
mercury or total mercury. Suggestive evidence supports a possible role of hepatocytes in the
demethylation of methylmercury in the form of increasing proportions of total mercury in

116
hepatocytes with increasing total liver mercury and hemosiderosis in hepatocytes that may be
linked to oxidative stress in those cells.
Continued research into the underlying cause of differences in the proportionality of
mercury in livers of different fish species continues to be warranted. The possibility that
demethylation of mercury in the liver reduces mercury burden in edible portions and other
tissues of fish is important for human health risk assessment and through presumptive
protection of gonads and CNS to ecological risk assessment. These studies found evidence of a
reduction in liver to muscle tissue total mercury proportions with increasing liver proportions of
inorganic mercury (Figure 5.1). The ratio of muscle to liver total mercury was found to decrease
significantly as the percentage of liver inorganic mercury increased in gar, catfish, and bass
(Pearson correlation r2= 0.876, p=0.0002). In bowfin this trend was not found (Pearson
correlation for all fish r2= 0.076, p=0.387) and may point to species specific differences in
mercury absorption. The finding of strong correlation between liver mercury speciation ratios
and muscle to liver total mercury ratios in some species may indicate sequestration of orally
absorbed mercury in liver tissue over time.
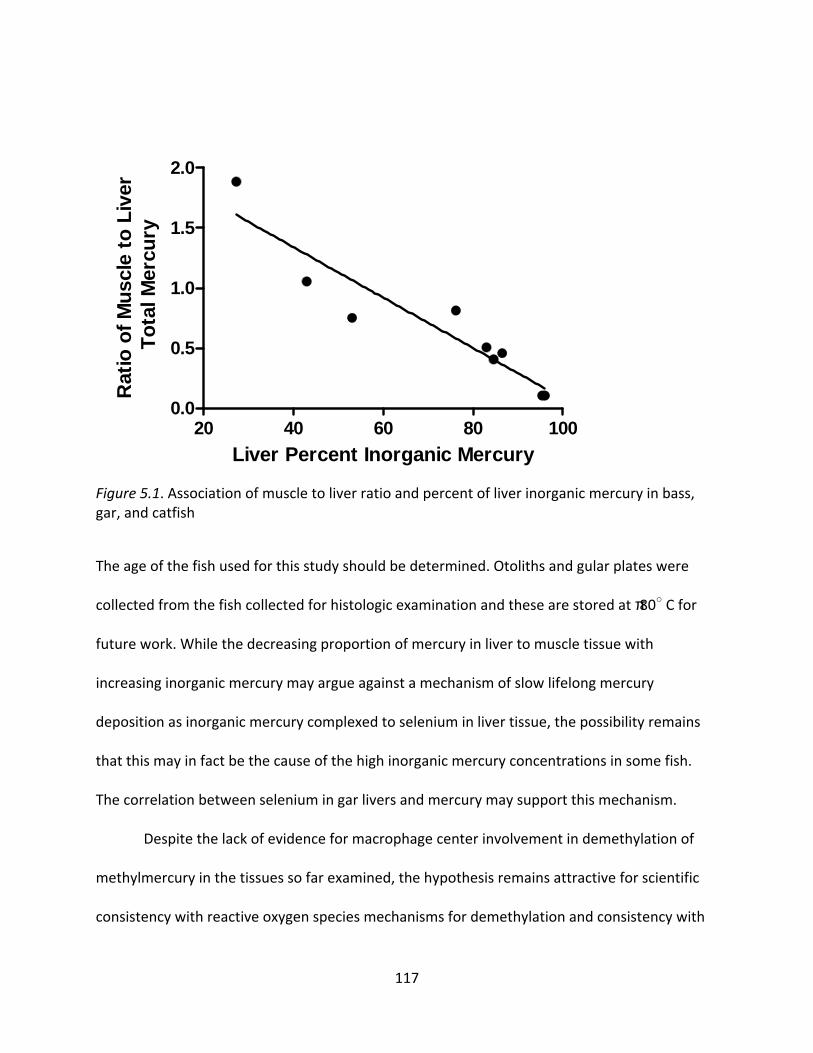
117
Liver Percent Inorganic Mercury
Rat
io o
f M
usc
le t
o L
iver
To
tal M
ercu
ry
20 40 60 80 1000.0
0.5
1.0
1.5
2.0
Figure 5.1. Association of muscle to liver ratio and percent of liver inorganic mercury in bass, gar, and catfish
The age of the fish used for this study should be determined. Otoliths and gular plates were
collected from the fish collected for histologic examination and these are stored at ‐80○ C for
future work. While the decreasing proportion of mercury in liver to muscle tissue with
increasing inorganic mercury may argue against a mechanism of slow lifelong mercury
deposition as inorganic mercury complexed to selenium in liver tissue, the possibility remains
that this may in fact be the cause of the high inorganic mercury concentrations in some fish.
The correlation between selenium in gar livers and mercury may support this mechanism.
Despite the lack of evidence for macrophage center involvement in demethylation of
methylmercury in the tissues so far examined, the hypothesis remains attractive for scientific
consistency with reactive oxygen species mechanisms for demethylation and consistency with

118
demethylation in tissue types containing phagocytes. Comparison of speciation values from
CVAFS with the DMA method developed by Ben Barst, and recently submitted for publication,
should be made on the samples collected for this study and the number of individuals could be
greatly extended. The current speciation is based on only three individuals per species due to
the cost of CVAFS methodology, but verification of those samples and extension to all liver
samples taken from Caddo Lake would increase the sample number to 10 catfish, 10 bass, 9 gar,
and 7 bowfin.
Continued research should focus on speciation of mercury and selenium in situ. This has
been done using x‐ray absorbance near edge structure (XANES) in the tissues of wales and fish
(George et al., 2011; Kuwabara, Arai, Topping, Pickering, & George, 2007). The technique
requires the use of a synchrotron light source to produce soft, tunable x‐rays (Cooke Andrews,
2006; C. Kim, 2005), but these light sources are free to use with petition since they were paid
for by US tax dollars. The localization and speciation of mercury in liver frozen sections would
allow much greater identification of structures associated with different mercury species and
may suggest a mechanism of mercury demethylation. This technique would allow the
identification of inorganic mercury ion, mercury metal, mercurial cysteine, ethylmercury, and
other forms, as well as allowing scanning and image production in whole tissue slices.
Use of frozen section would give results that would most closely mimic the forms and
locations of mercury species at the time of sacrifice of the animal. The production of
microscope slides and even drying or freeze drying of tissues for species analysis has some
chance of altering the form of mercury in tissues. Certainly the form of mercury extracted from
tissues in mercury speciation methods is an approximation of what is found natively in the

119
living tissue due to the chemical process of extraction, and the possibility that this may affect
mercury speciation. The XANES method is also non‐destructive and allows other methods to be
used after this method has been applied. Light microscopic images of tissues could be made
after XANES imaging, for example.
120
REFERENCES
Adams, D. H., Sonne, C., Basu, N., Dietz, R., Nam, D. H., Leifsson, P. S., & Jensen, A. L. (2010). Mercury contamination in spotted seatrout, Cynoscion nebulosus: An assessment of liver, kidney, blood, and nervous system health. Science of the Total Environment, 408(23), 5808‐5816.
Adedeji, O., & Kakulu, F. (2011). Carbon trapping in the lymphoid tisues of African catfish (Clarias gariepinus). International Journal of Biotechnology and Biochemistry,7(2), 199‐ 207.
Agius, C. (1979). The role of melano‐macrophage centres in iron storage in normal and diseased fish. Journal of Fish Diseases, 2(4), 337‐343.
Agius, C. (1980). Phylogenetic development of melano–macrophage centres in fish. Journal of zoology, 191(1), 11‐31.
Agius, C., & Roberts, R. (2003a). Melano‐macrophage centres and their role in fish pathology. Journal of Fish Diseases, 26(9), 499‐509.
Agius, C., & Roberts, R. (2003b). Melano macrophage centres and their role in fish pathology. Journal of Fish Diseases, 26(9), 499‐509.
Anan, Y., Kunito, T., Sakai, H., & Tanabe, S. (2002). Subcellular distribution of trace elements in the liver of sea turtles. Marine pollution bulletin, 45(1‐12), 224‐229.
Ashoka, S., Peake, B., Bremner, G., Hageman, K., & Reid, M. (2009). Comparison of digestion methods for ICP‐MS determination of trace elements in fish tissues. Analytica Chimica Acta, 653(2), 191‐199.
ATSDR. (1999). Toxicological Profle for Mercury. Agency For Toxic Substances and Disease Registry. U.S. Departement of Health and Human Services, Public Health Service.Available online at http://www.atsdr.cdc.gov/toxprofiles/tp46.pdf.
Augier, H., Benkoël, L., Brisse, J., Chamlian, A., & Park, W. (1993). Microscopic localization of mercury‐selenium interaction products in liver, kidney, lung and brain of Mediterranean striped dolphins (Stenella Coeruleoalba) by silver enhancement kit. Cellular and molecular biology (Noisy‐le‐Grand, France), 39(7), 765.
Baatrup, E., & Danscher, G. (1987). Cytochemical demonstration of mercury deposits in trout liver and kidney following methyl mercury intoxication: differentiation of two mercury pools by selenium. Ecotoxicology and Environmental Safety, 14(2), 129‐141.
Baeyens, W., Leermakers, M., Papina, T., Saprykin, A., Brion, N., Noyen, J., . . . Goeyens, L. (2003). Bioconcentration and biomagnification of mercury and methylmercury in North

121
Sea and Scheldt estuary fish. Archives of environmental contamination and toxicology, 45(4), 498‐508.
Barst, B. D., Gevertz, A. K., Chumchal, M. M., Smith, J. D., Rainwater, T., Drevnick, P., . . . Roberts, A. P. (2011). Laser Ablation ICP‐MS Co‐localization of Mercury and Immune Response in Fish. Environmental science & technology. 45(20), 8982‐8988.
Batts, K. P. (2007). Iron overload syndromes and the liver. Modern Pathology, 20, S31‐S39.
Becker, J. S., & Rubakhin, S. (2010). Imaging of Metals, Metalloids, and Non‐metals by Laser Ablation Inductively Coupled Plasma Mass Spectrometry(LA‐ICP‐MS) in Biological Tissues. Methods in Molecular Biology, 656, 51‐82.
Becker, J. S., Zoriy, M., Dobrowolska, J., & Matusch, A. (2007). Laser ablation inductively coupled plasma mass spectrometry (LA‐ICP‐MS) in elemental imaging of biological tissues and in proteomics. Journal of Analytical Atomic Spectrometry, 22(7), 736‐744.
Becker, J. S., Zoriy, M., Dressler, V. L., & Wu, B. (2008). Imaging of metals and metal‐containing species in biological tissues and on gels by laser ablation inductively coupled plasma mass spectrometry (LA‐ICP‐MS): A new analytical strategy for applications in life sciences. Pure and Applied Chemistry, 80(12), 2643‐2655.
Bellotto, V., & Miekeley, N. (2000). Improvements in calibration procedures for the quantitative determination of trace elements in carbonate material (mussel shells) by laser ablation ICP‐MS. Fresenius' journal of analytical chemistry, 367(7), 635‐640.
Borum, D., Manibusan, M., Schoeny, R., & Winchester, E. (2001). Water Quality Criterion for the Protection of Human Health: Methylmercury. EPA‐823‐R‐01‐001.
Boudou, A., & Ribeyre, F. (1997). Mercury in the food web: accumulation and transfer mechanisms. New York, New York: Marcel Dekker, Inc.
Bowles, K., Apte, S., Maher, W., Kawei, M., & Smith, R. (2001). Bioaccumulation and biomagnification of mercury in Lake Murray, Papua New Guinea. Canadian Journal of Fisheries and Aquatic Sciences. 58, 888‐897.
Brophy, D., Danilowicz, B., & Jeffries, T. (2003). The detection of elements in larval otoliths from Atlantic herring using laser ablation ICP‐MS. Journal of Fish Biology, 63(4), 990‐1007.
Brophy, D., Jeffries, T., & Danilowicz, B. (2004). Elevated manganese concentrations at the cores of clupeid otoliths: possible environmental, physiological, or structural origins. Marine Biology, 144(4), 779‐786.
Brusle, J., Anadon, G., Datta, J., & Dutta, H. (1996). The structure and function of fish liver. Fish morphology: horizon of new research, 77–93.

122
Cabana, G., & Rasmussen, J. B. (1994). Modelling food chain structure and contaminant bioaccumulation using stable nitrogen isotopes. Nature, 372(6503), 255‐257.
Chang, L. W., Reuhl, K. R., & Dudley, A. W. (1974). Effects of methylmercury chloride on Rana pipiens tadpoles. Environmental Research, 8(1), 82‐91.
Christensen, M., Morgensen, S., & Rungby, J. (1988). Toxicity and utrastructural localization of mercuric chloride in cultured murine macrophages. Archieves of Toxicology, 62(6), 440‐446.
Chumchal, M., Rainwater, T., Cobb, G., & Smith, P. (2008). Assessment of Mercury Contamination and Biomagnification in the Food Web of Caddo Lake.
Chumchal MM, Drenner RW, Fry B, Hambright KD, & LW, N. (2008). Habitat‐specific Differences in Mercury Concentrations in a Top Preditor from a Shallow Lake. Transactions of the American Fisheries Society, 137, 195‐208.
Chumchal MM, & Hambright KD. (2009). Ecological Factors Regulating Mercury Contamination of Fish from Caddo Lake, Texas, USA. Environmental Toxicology and Chemistry, 28(5), 962‐997.
Chumchal, M. M., Rainwater, T. R., Osborn, S. C., Roberts, A. P., Abel, M. T., Cobb, G. P., . . . Bailey, F. C. (2011). Mercury speciation and biomagnification in the food web of Caddo Lake, Texas and Louisiana, USA, a subtropical freshwater ecosystem. Environmental toxicology and chemistry, 30(35), 1153‐1162.
Cooke Andrews, J. (2006). Mercury speciation in the environment using X‐ray absorption spectroscopy. Recent Developments in Mercury Science, 1‐35.
Cotran, R., Kumar, V., & Collins, T. (1999). Robbins: Pathologic Basis of Disease (6th edition ed.). Philadelphia: W.B. Saunders Company.
Crump, K. L., & Trudeau, V. L. (2009). Mercury‐induced reproductive impairment in fish. Environmental Toxicology and Chemistry, 28(5), 895‐907.
Dang, F., & Wang, W. X. (2011). Antagonistic Interaction of Mercury and Selenium in a Marine Fish Is Dependent on Their Chemical Species. Environmental science & technology, 45(7), 3116‐3122.
Dare, E., Li, W., Zhivotovsky, B., Yuan, X., & Ceccatelli, S. (2001). Methylmercury and H(2)O(2) provoke lysosomal damage in human astrocytoma D384 cells followed by apoptosis. Free Radical Biology and Medicine, 30(12), 1347‐1356.
Di Giulio, R. T., & Hinton, D. E. (Eds.). (2008). The toxicology of fishes. Boca Raton, FL: CRC.
123
Dillon, T., Beckvar, N., & Kern, J. (2010). Residue based mercury dose–response in fish: An analysis using lethality equivalent test endpoints. Environmental Toxicology and Chemistry, 29(11), 2559‐2565.
Drevnick, P. E., Roberts, A. P., Otter, R. R., Hammerschmidt, C. R., Klaper, R., & Oris, J. T. (2008). Mercury toxicity in livers of northern pike (Esox lucius) from Isle Royale, USA. Comparative Biochemistry Physiology Part C: Toxicology and Pharmacology, 147(3), 331‐338.
Drevnick, P. E., & Sandheinrich, M. B. (2003). Effects of dietary methylmercury on reproductive endocrinology of fathead minnows. Environmental Science and Technology, 37(19), 4390‐4396.
Drevnick, P. E., Sandheinrich, M. B., & Oris, J. T. (2006). Increased ovarian follicular apoptosis in fathead minnows (Pimephales promelas) exposed to dietary methylmercury. Aquatic Toxicology, 79(1), 49‐54.
Eagles‐Smith, C. A., Ackerman, J. T., Yee, J., & Adelsbach, T. L. (2009). Mercury demethylation in waterbird livers: dose‐response thresholds and differences among species. Environmental Toxicology and Chemistry, 28(3), 568‐577.
Eisler, R. (1985). Selenium hazards to fish, wildlife, and invertebrates: A synoptic review. US Fish and Wildlife Service Biological Report, 85(1.5), 90.
Eisler, R. (1987). Mercury hazards to fish, wildlife, and invertebrates: A synoptic review. US Fish and Wildlife Service Biological Report, 85(1.10), 90.
Engström, K., Strömberg, U., Lundh, T., Johansson, I., Vessby, B., Hallmans, G., . . . Broberg, K. (2008). Genetic variation in glutathione‐related genes and body burden of methylmercury. Environmental health perspectives, 116(6), 734.
France, R. L. (1995). Differentiation between littoral and pelagic food webs in lakes using stable carbon isotopes. Limnology and Oceanography, 1310‐1313.
Freitas, M., Lima, J., Porto, G., & Fernandes, E. (2010). Metal‐induced oxidative burst in isolated human neutrophils. Microchemical Journal, 96, 167‐171.
Gailer, J., George, G. N., Pickering, I. J., Madden, S., Prince, R. C., Yu, E. Y., . . . Aposhian, H. V. (2000). Structural basis of the antagonism between inorganic mercury and selenium in mammals. Chemical Research in Toxicology, 13(11), 1135‐1142.
George, G. N., MacDonald, T. C., Korbas, M., Singh, S. P., Myers, G. J., Watson, G. E., . . . Pickering, I. J. (2011). The chemical forms of mercury and selenium in whale skeletal muscle. Metallomics, 3(11), 1232‐1237.

124
Gorski, P. R., Cleckner, L. B., Hurley, J. P., Sierszen, M. E., & Armstrong, D. E. (2003). Factors affecting enhanced mercury bioaccumulation in inland lakes of Isle Royale National Park, USA. The Science of the Total Environment, 304(1‐3), 327‐348.
Grasseschi, R. M., Ramaswamy, R. B., Levine, D. J., Klaassen, C. D., & Wesselius, L. J. (2003). Cadmium Accumulation and Detoxification by Alveolar Macrophages of Cigarette Smokers. Chest, 124(5), 1924‐1928.
Hamilton, S. J. (2002). Rationale for a tissue‐based selenium criterion for aquatic life. Aquatic toxicology, 57(1‐2), 85‐100.
Hammerschmidt, C. R., & Fitzgerald, W. F. (2006). Bioaccumulation and trophic transfer of methylmercury in Long Island Sound. Archives of environmental contamination and toxicology, 51(3), 416‐424.
Hartley, W., Thiyagarajah, A., & Treinies, A. (1996). Liver lesions in the gar fish (Lepisosteidae) as biomarkers of exposure. Marine Environmental Research, 42(1‐4), 217‐221.
Haugarvoll, E., Thorsen, J., Laane, M., Huang, Q., & Koppang, E. O. (2006). Melanogenesis and evidence for melanosome transport to the plasma membrane in a CD83+ teleost leukocyte cell line. Pigment cell research, 19(3), 214‐225.
Havarinasab, S., Björn, E., Nielsen, J., & Hultman, P. (2007). Mercury species in lymphoid and non‐lymphoid tissues after exposure to methyl mercury: correlation with autoimmune parameters during and after treatment in susceptible mice. Toxicology and applied pharmacology, 221(1), 21‐28.
Hecky, R., & Hesslein, R. (1995). Contributions of benthic algae to lake food webs as revealed by stable isotope analysis. North American Benthological Society 14, 631‐653.
Hotchkiss, R. S., Bowling, W. M., Karl, I. E., Osborne, D. F., & Flye, M. W. (1997). Calcium antagonists inhibit oxidative burst and nitrite formation in lipopolysaccharide‐stimulated rat peritoneal macrophages. Shock, 8(3), 170.
Ikemoto, T., Kunito, T., Tanaka, H., Baba, N., Miyazaki, N., & Tanabe, S. (2004). Detoxification mechanism of heavy metals in marine mammals and seabirds: interaction of selenium with mercury, silver, copper, zinc, and cadmium in liver. Archives of environmental contamination and toxicology, 47(3), 402‐413.
Iles, K., & Forman, H. (2002). Macrophage signaling and respiratory burst. Immunologic research, 26(1), 95‐105.
IRIS. (2002). Integrated Risk Information System. IRIS Summary for Methylmercury (CASRN 229‐92‐6). Available at: http://www.epa.gov/NCEA/iris/subst/0073.htm.

125
Jansson, G., & Harms‐Ringdahl, M. (1993). Stimulating effects of mercuric‐and silver ions on the superoxide anion production in human polymorphonuclear leukocytes. Free Radical Research, 18(2), 87‐98.
Kasper, D., Palermo, E. F. A., Dias, A. C. M. I., Ferreira, G. L., Leitão, R. P., Branco, C. W. C., & Malm, O. (2009). Mercury distribution in different tissues and trophic levels of fish from a tropical reservoir, Brazil. Neotropical Ichthyology, 7(4), 751‐758.
Kehrig, H. A., Seixas, T. G., Palermo, E. A., Baêta, A. P., Castelo‐Branco, C. W., Malm, O., & Moreira, I. (2009). The relationships between mercury and selenium in plankton and fish from a tropical food web. Environmental Science and Pollution Research, 16(1), 10‐24.
Khan, M. A. K., & Wang, F. (2009). Mercury selenium compounds and their toxicological significance: Toward a molecular understanding of the mercury selenium antagonism. Environmental Toxicology and Chemistry, 28(8), 1567‐1577.
Kidd, K., Hesslein, R., Fudge, R., & Hallard, K. (1995). The influence of trophic level as measured by δ 15 N on mercury concentrations in freshwater organisms. Water, Air, & Soil Pollution, 80(1), 1011‐1015.
Kidd, K. A., Bootsma, H. A., Hesslein, R. H., Lyle Lockhart, W., & Hecky, R. E. (2003). Mercury concentrations in the food web of Lake Malawi, East Africa. Journal of Great Lakes Research, 29, 258‐266.
Kim, C. (2005). Speciation of mercury using synchrotron radiation. Mercury, sources, measurements, cycles and effects, 95–122.
Kim, S. H., & Sharma, R. P. (2004). Mercury‐induced apoptosis and necrosis in murine macrophages: role of calcium‐induced reactive oxygen species and p38 mitogen‐activated protein kinase signaling. Toxicology and applied pharmacology, 196(1), 47‐57.
Klaper, R., Carter, B. J., Richter, C. A., Drevnick, P., Sandheinrich, M. B., & Tillit, D. E. (2008). Use of a 15 k gene microarray to determine gene expression changes in response to acute and chronic methylmercury exposure in the fathead minnow Pimephales promelas Rafinesque. Journal of Fish Biology, 72, 207‐2280.
Klerks, P. L., & Weis, J. S. (1987). Genetic adaptation to heavy metals in aquatic organisms: a review. Environmental Pollution, 45(3), 173‐205.
Konigsberg, M., Lopez‐Diazguerrero, N. E., Bucio, L., & Gutierrez‐Ruiz, M. C. (2001). Uncoupling effect of mercuric chloride on mitochondria isolated from an hepatic cell line. Journal of Applied Toxicology, 21(4), 323‐329.
Koppang, E., Fischer, U., Satoh, M., & Jirillo, E. (2007). Inflammation in fish as seen from a morphological point of view with special reference to the vascular compartment. Current pharmaceutical design, 13(36), 3649‐3655.

126
Kuwabara, J., Arai, Y., Topping, B., Pickering, I., & George, G. (2007). Mercury speciation in piscivorous fish from mining‐impacted reservoirs. Environmental Science and Technology, 41(8), 2745‐2749.
Leaner, J., & Mason, R. (2004). Methylmercury uptake and distribution kinetics in sheepshead minnows, Cyprinodon variegatus, after exposure to CH3Hg‐spiked food. Environmental Toxicology and Chemistry, 23(9), 2138‐2146.
Mateo, R., Beyer, W. N., Spann, J., Hoffman, D., & Ramis, A. (2003). Relationship between oxidative stress, pathology, and behavioral signs of lead poisoning in mallards. Journal of Toxicology and Environmental Health Part A, 66(14), 1371‐1389.
McCloskey, J., Schultz, I., & Newman, M. (1998). Estimating the oral bioavailability of methylmercury to channel catfish (Ictalurus punctatus). Environmental Toxicology and Chemistry, 17(8), 1524‐1529.
Meinelt, T., Krüger, R., Pietrock, M., Osten, R., & Steinberg, C. (1997). Mercury pollution and macrophage centres in pike (Esox lucius) tissues. Environmental Science and Pollution Research, 4(1), 32‐36.
Mela, M., Randi, M., Ventura, D., Carvalho, C., Pelletier, E., & Oliveira Ribeiro, C. (2007a). Effects of dietary methylmercury on liver and kidney histology in the neotropical fish Hoplias malabaricus. Ecotoxicology and environmental safety, 68(3), 426‐435.
Mela, M., Randi, M. A., Ventura, D. F., Carvalho, C. E., Pelletier, E., & Oliveira Ribeiro, C. A. (2007b). Effects of dietary methylmercury on liver and kidney histology in the neotropical fish Hoplias malabaricus. Ecotoxicology and Environmental Safety, 68(3), 426‐435.
Misra, S., & Niyogi, S. (2009). Selenite causes cytotoxicity in rainbow trout (Oncorhynchus mykiss) hepatocytes by inducing oxidative stress. Toxicology In Vitro, 23(7), 1249‐1258.
Morel, F., Karaepiel, A., & Amyot, M. (1998). The Chemical Cycle and Bioaccumulation of Mercury. Annual Review Ecology, Evolution, and Systematics, 29(543‐566).
Narewski, U., Werner, G., Schulz, H., & Vogt, C. (2000). Application of laser ablation inductively coupled mass spectrometry (LA‐ICP‐MS) for the determination of major, minor, and trace elements in bark samples. Fresenius' journal of analytical chemistry, 366(2), 167‐170.
Nigro, M. (2009). Mercury and selenium localization in macrophages of the striped dolphin, Stenella coeruleoalba. Journal of the Marine Biological Association of the UK, 74(04), 975‐978.
Nigro, M., Campana, A., Lanzillotta, E., & Ferrara, R. (2002). Mercury exposure and elimination rates in captive bottlenose dolphins. Marine pollution bulletin, 44(10), 1071‐1075.

127
NRC. (2000). Toxicological effects of methylmercury. National Academy Press, Washington D.C.
Outridge, P., Chenery, S., Babaluk, J., & Reist, J. (2002). Analysis of geological Sr isotope markers in fish otoliths with subannual resolution using laser ablation‐multicollector‐ICP‐mass spectrometry. Environmental geology, 42(8), 891‐899.
Palmisano, F., Cardellicchio, N., & Zambonin, P. (1995). Sepeciation of Mercury in Dolphin Liver: A Two‐Stage Mechanism for the Demethylation Accumulation Process and Role of Selenium. Marine Environmental Research, 40(2), 109‐121.
Power, M., Klein, G., Guiguer, K., & Kwan, M. (2002). Mercury accumulation in the fish community of a sub‐Arctic lake in relation to trophic position and carbon sources. Journal of Applied Ecology, 39(5), 819‐830.
Raith, A., Perkins, W., Pearce, N. J. G., & Jeffries, T. (1996). Environmental monitoring on shellfish using UV laser ablation ICP‐MS. Fresenius' journal of analytical chemistry, 355(7), 789‐792.
Rawson, A., Patton, G., Hofmann, S., Pietra, G., & Johns, L. (1993). Liver Abnormalities Associated with Chronic Mercury Accumulation in Stranded Atlantic Bottlenosed Dolphins. Ecotoxicology and Environmental Safety, 25(1), 41‐47.
Reeves, M. A., & Hoffmann, P. R. (2009). The human selenoproteome: recent insights into functions and regulation. Cellular and Molecular Life Sciences, 66(15), 2457‐2478.
Richter, G. (1978). The iron‐loaded cell‐‐the cytopathology of iron storage. A review. The American Journal of Pathology, 91(2), 362.
Roberts, R. J. (Ed.). (1975). Melanin‐containing cells of teleost fish and their relation to disease. In: The Pathology of fishes: proceedings of a symposium, Part 3. Madison, Wisconsin: Univ of Wisconsin Press.
Sandheinrich, M. B., & Miller, K. M. (2006). Effects of dietary methylmercury on reproductive behavior of fathead minnows (Pimephales promelas). Environmental Toxicology and Chemistry, 25(11), 3053‐3057.
Schultz, I., & Newman, M. (1997). Methyl mercury toxicokinetics in channel catfish (Ictalurus punctatus) and largemouth bass (Micropterus salmoides) after intravascular administration. Environmental Toxicology and Chemistry, 16(5), 990‐996.
Schwindt, A. R., Fournie, J. W., Landers, D. H., Schreck, C. B., & Kent, M. L. (2008). Mercury concentrations in salmonids from western US national parks and relationships with age and macrophage aggregates. Environmental science & technology, 42(4), 1365‐1370.
Sheehan, H., & Hrapchak, B. (Eds.). (1980). The Theory and Practice of Histotechnology (2 ed.). St. Louis: Batelle Press.

128
Storelli, M., & Marcotrigiano, G. (2002). Mercury speciation and relationship between mercury and selenium in liver of Galeus melastomus from the Mediterranean Sea. Bulletin of environmental contamination and toxicology, 69(4), 516‐522.
Suda, I., & Takahashi, H. (1990). Effect of reticuloendothelial system blockade on the biotransformation of methyl mercury in the rat. Bulletin of environmental contamination and toxicology, 44(4), 609‐615.
Suda, I., Totoki, S., Uchida, T., & Takahashi, H. (1992). Degradation of methyl and ethyl mercury into inorganic mercury by various phagocytic cells. Archives of Toxicology, 66(1), 40‐44.
TCEQ. (2004). Strategy for addressing mercury contamination in fish tissue in Caddo Lake. Texas Commission on Environmental Quality.
Terman, A., & Brunk, U. T. (2004). Lipofuscin. Int J Biochem Cell Biol, 36(8), 1400‐1404.
Thiyagarajah, A., Hartley, W., & Abdelghani, A. (1998). Hepatic hemosiderosis in buffalo fish (Ictiobus spp.). Marine Environmental Research, 46(1‐5), 203‐207.
Tseng, C. M., Hammerschmidt, C. R., & Fitzgerald, W. F. (2004). Determination of methylmercury in environmental matrixes by on‐line flow injection and atomic fluorescence spectrometry. Analytical chemistry, 76(23), 7131‐7136.
Ullrich, S., Tanton, T., & Abdrashitova, S. (2001). Mercury in the aquatic environment: a review of factors affecting methylation. Critical Reviews in Environmental Science and Technology, 31(3), 241‐293.
Urano, T., Imura, N., & Naganuma, A. (1997). Inhibitory effect of selenium on biliary secretion of methyl mercury in rats. Biochemistry Biophysics Research Community, 239(3), 862‐867.
USEPA. (1987). Peer Review Workshop on Mercury Issues. Summary Report. Environmental Criteria and Assessment Office, Cincinnati, OH. October 26‐27. As cited by IRIS 2002.
USEPA. (1997). Mercury study report to Congress. Vol. I‐VIII. U.S. Environmental Protection Agency. December 1997. As cited by Borum, Manisbusan et al. 2001.
Vahter, M. E., Mottet, N. K., Friberg, L. T., Lind, S. B., Charleston, J. S., & Burbacher, T. M. (1995). Demethylation of methyl mercury in different brain sites of Macaca fascicularis monkeys during long‐term subclinical methyl mercury exposure. Toxicology and Applied Pharmacology, 134(2), 273‐284.
Vieira, L. R., Gravato, C., Soares, A. M., Morgado, F., & Guilhermino, L. (2009). Acute effects of copper and mercury on the estuarine fish Pomatoschistus microps: linking biomarkers to behaviour. Chemosphere, 76(10), 1416‐1427.
Vincent, P., Norman, M., Yang, P., Evans, R. E., & Sterling, G. (2007). Determining residence patterns of rainbow trout using laser ablation inductively coupled plasma mass

129
spectrometry (LA‐ICP‐MS) analysis of selenium in otoliths. Environmental science & technology, 41(10), 3679‐3683.
Wagemann, R., Trebacz, E., Boila, G., & Lockhart, W. (2000). Mercury species in the liver of ringed seals. The Science of the Total Environment, 261(1‐3), 21‐32.
Wang, S., Wang, Y., Zhang, Z., Xie, F., Lin, P., & Tai, Z. (2009). Tyrosinase, a new innate humoral immune parameter in large yellow croaker (Pseudosciaena crocea R). Chinese Journal of Oceanology and Limnology, 27(3), 527‐535.
Weis, J. S., & Weis, P. (1984). A rapid change in methylmercury tolerance in a population of killifish, Fundulus heteroclitus, from a golf course pond. Marine environmental research, 13(3), 231‐245.
Weis, J. S., & Weis, P. (1989). Tolerance and stress in a polluted environment. BioScience, 39(2), 89‐95.
Weis, P. (1984). Metallothionein and mercury tolerance in the killifish, Fundulus heteroclitus. Marine environmental research, 14(1‐4), 153‐166.
Wolke, R. E. (1992). Piscine macrophage aggregates: A review. Annual Review of Fish Diseases, 2, 91‐108.
Woshner, V. M., O'Hara, T. M., Eurell, J. A., Wallig, M. A., Bratton, G. R., Suydam, R. S., & Beasley, V. R. (2002). Distribution of inorganic mercury in liver and kidney of beluga and bowhead whales through autometallographic development of light microscopic tissue sections. Toxicologic pathology, 30(2), 209‐215.
Yang, D. Y., Chen, Y. W., & Belzile, N. (2010). Inverse relationships between selenium and mercury in tissues of young walleye (Stizosedion vitreum) from Canadian boreal lakes. Science of the Total Environment, 408(7), 1676‐1683.
Yang, J., Kunito, T., Tanabe, S., & Miyazaki, N. (2007). Mercury and its relation with selenium in the liver of Dall's porpoises (Phocoenoides dalli) off the Sanriku coast of Japan. Environmental Pollution, 148(2), 669‐673.
Yasutake, A., & Hirayama, K. (2001). Evaluation of methylmercury biotransformation using rat liver slices. Arch Toxicol, 75(7), 400‐406.
Yoneda, S., & Suzuki, K. T. (1997). Detoxification of mercury by selenium by binding of equimolar Hg‐Se complex to a specific plasma protein. Toxicol Appl Pharmacol, 143(2), 274‐280.