A cohesive zone model for fracture initiation and ...
12
HAL Id: hal-02277738 https://hal.archives-ouvertes.fr/hal-02277738 Submitted on 24 Oct 2019 HAL is a multi-disciplinary open access archive for the deposit and dissemination of sci- entific research documents, whether they are pub- lished or not. The documents may come from teaching and research institutions in France or abroad, or from public or private research centers. L’archive ouverte pluridisciplinaire HAL, est destinée au dépôt et à la diffusion de documents scientifiques de niveau recherche, publiés ou non, émanant des établissements d’enseignement et de recherche français ou étrangers, des laboratoires publics ou privés. A cohesive zone model for fracture initiation and propagation of fused silica direct bonding interface Aurelien Maurel-Pantel, M. Voisin, Q. Bui, N. Cocheteau, Frédéric Lebon, C. Hochard To cite this version: Aurelien Maurel-Pantel, M. Voisin, Q. Bui, N. Cocheteau, Frédéric Lebon, et al.. A cohesive zone model for fracture initiation and propagation of fused silica direct bonding interface. Engineering Fracture Mechanics, Elsevier, 2019, pp.106649. 10.1016/j.engfracmech.2019.106649. hal-02277738
Transcript of A cohesive zone model for fracture initiation and ...

HAL Id: hal-02277738https://hal.archives-ouvertes.fr/hal-02277738
Submitted on 24 Oct 2019
HAL is a multi-disciplinary open accessarchive for the deposit and dissemination of sci-entific research documents, whether they are pub-lished or not. The documents may come fromteaching and research institutions in France orabroad, or from public or private research centers.
L’archive ouverte pluridisciplinaire HAL, estdestinée au dépôt et à la diffusion de documentsscientifiques de niveau recherche, publiés ou non,émanant des établissements d’enseignement et derecherche français ou étrangers, des laboratoirespublics ou privés.
A cohesive zone model for fracture initiation andpropagation of fused silica direct bonding interface
Aurelien Maurel-Pantel, M. Voisin, Q. Bui, N. Cocheteau, Frédéric Lebon, C.Hochard
To cite this version:Aurelien Maurel-Pantel, M. Voisin, Q. Bui, N. Cocheteau, Frédéric Lebon, et al.. A cohesive zonemodel for fracture initiation and propagation of fused silica direct bonding interface. EngineeringFracture Mechanics, Elsevier, 2019, pp.106649. �10.1016/j.engfracmech.2019.106649�. �hal-02277738�
Contents lists available at ScienceDirect
Engineering Fracture Mechanics
journal homepage: www.elsevier.com/locate/engfracmech
A cohesive zone model for fracture initiation and propagation offused silica direct bonding interface
A. Maurel-Pantel⁎, M. Voisin, Q. Bui, N. Cocheteau, F. Lebon, C. HochardAix Marseille Univ, CNRS, Centrale Marseille, LMA, Marseille, France
A R T I C L E I N F O
Keywords:Direct bondingFracture initiationFracture propagationCohesive zone modelFinite elements model
2018 MSC:00-0174R1074S0574M15
A B S T R A C T
Fused silica direct bonding is of particular interest for optical system manufacturing for spatialapplications. However, in order to validate the European Space Agency standards, a better un-derstanding of the assemblies mechanical behavior is required. Therefore, it is important todevelop some predictive tools to determine numerically mechanical strength of complex as-semblies. In this paper, a cohesive zone model is proposed to model the direct bonding interfacebehavior. In order to determine the mechanical strength of the interface, a propagation test, andan initiation test on a free edge the cleavage test have been performed on direct bonded fusedsilica samples. The FIT test (Flexible Initiation Test) is also used to identify the properties of thedirect bonding joint. At the end, a comparative analyses is proposed between experimental re-sults and finite elements models of the propagation and initiation tests.
1. Introduction
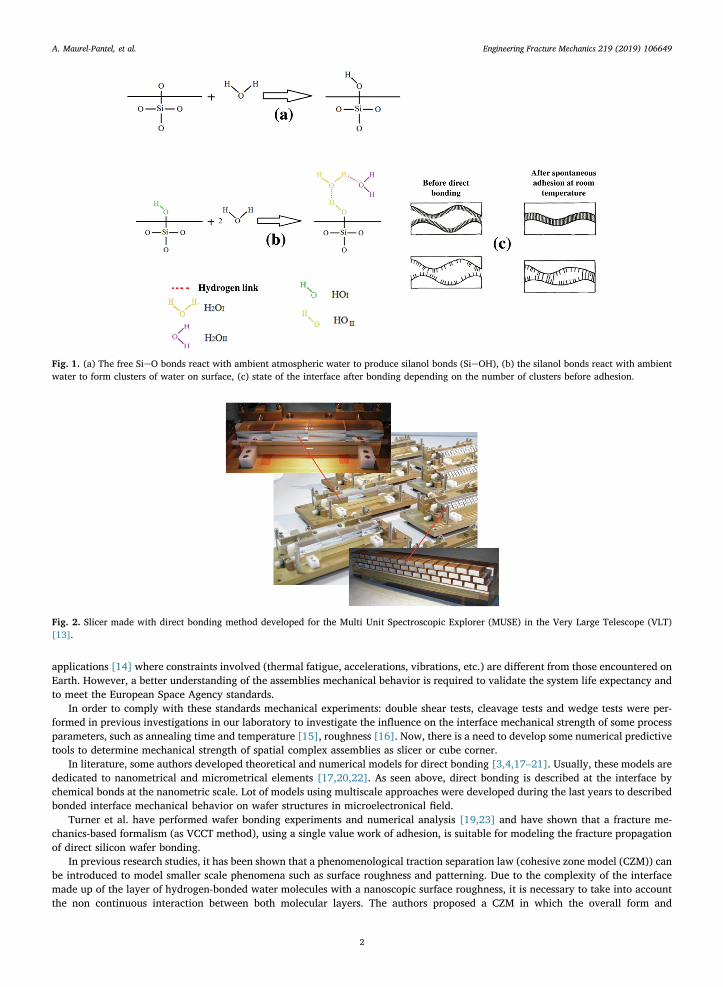
Direct bonding consists in joining two surfaces without using any adhesive or additional materials [1,2]. The first step of thedirect bonding process is a polishing of surfaces to be bonded. Indeed, a high level of roughness results in a weak contacted zone andthus in the occurrence of defects at the interface during bonding (Fig. 1(a)) [3–5]. If the roughness is too high, bonding is impossible.In a second step, surfaces undergo a surface cleaning treatment. During this last step, contamination particles are removed from thesurfaces [6,7]. As described in Fig. 1(b), by reacting with ambient atmospheric water, the free silicon surfaces are recovered by silanolgroups according to the following equation:
− + → −Si O H O Si OH2 (1)
Then surfaces will be recovered by clusters of water [8,9]. The silanol groups are the precursor of the bonding [8] (Fig. 1(c)). Theywill generate bonds responsible of the adhesion during the room temperature bonding. In this case, adhesion is performed via clustersof waters. Direct wafer bonding emerged as a technology for Silicon based microelectronic systems [10–12]. Now, this bondingprocess is also used in the manufacturing of high performance optical systems for terrestrial applications. For instance, Fig. 2 shows1152 slices bonded together to give form to the larger optical slicer ever used for the MUSE project [13]. Nowadays, they are ofparticular interest for spatial instruments applications. Indeed, this is a high-precision production process. The assemblies obtainedby this process exhibit a dimensional stability because no mechanical parts or polymer adhesive are required. Moreover, since noadhesive materials are used in these processes, the risks of contamination associated with degassing are avoided, which is a bigbenefit in spatial applications. A first prototype has successfully completed the mechanical and thermal environment tests for space
https://doi.org/10.1016/j.engfracmech.2019.106649Received 28 October 2018; Received in revised form 27 August 2019; Accepted 28 August 2019
⁎ Corresponding author.E-mail address: [email protected] (A. Maurel-Pantel).
Engineering Fracture Mechanics 219 (2019) 106649
Available online 03 September 20190013-7944/ © 2019 Elsevier Ltd. All rights reserved.
T
applications [14] where constraints involved (thermal fatigue, accelerations, vibrations, etc.) are different from those encountered onEarth. However, a better understanding of the assemblies mechanical behavior is required to validate the system life expectancy andto meet the European Space Agency standards.
In order to comply with these standards mechanical experiments: double shear tests, cleavage tests and wedge tests were per-formed in previous investigations in our laboratory to investigate the influence on the interface mechanical strength of some processparameters, such as annealing time and temperature [15], roughness [16]. Now, there is a need to develop some numerical predictivetools to determine mechanical strength of spatial complex assemblies as slicer or cube corner.
In literature, some authors developed theoretical and numerical models for direct bonding [3,4,17–21]. Usually, these models arededicated to nanometrical and micrometrical elements [17,20,22]. As seen above, direct bonding is described at the interface bychemical bonds at the nanometric scale. Lot of models using multiscale approaches were developed during the last years to describedbonded interface mechanical behavior on wafer structures in microelectronical field.
Turner et al. have performed wafer bonding experiments and numerical analysis [19,23] and have shown that a fracture me-chanics-based formalism (as VCCT method), using a single value work of adhesion, is suitable for modeling the fracture propagationof direct silicon wafer bonding.
In previous research studies, it has been shown that a phenomenological traction separation law (cohesive zone model (CZM)) canbe introduced to model smaller scale phenomena such as surface roughness and patterning. Due to the complexity of the interfacemade up of the layer of hydrogen-bonded water molecules with a nanoscopic surface roughness, it is necessary to take into accountthe non continuous interaction between both molecular layers. The authors proposed a CZM in which the overall form and
Fig. 1. (a) The free SieO bonds react with ambient atmospheric water to produce silanol bonds (SieOH), (b) the silanol bonds react with ambientwater to form clusters of water on surface, (c) state of the interface after bonding depending on the number of clusters before adhesion.
Fig. 2. Slicer made with direct bonding method developed for the Multi Unit Spectroscopic Explorer (MUSE) in the Very Large Telescope (VLT)[13].
A. Maurel-Pantel, et al. Engineering Fracture Mechanics 219 (2019) 106649
2

parameters are obtained from molecular dynamics (MD) simulations [20,24].But these previous works are limited to wafer applications in the field of microelectronics and only concerns fracture propagation
modelling. The cohesive zone models, proposed in literature, are not validated with implementation in a finite elements code tomodel the mechanical strength of a complex assembly. In this paper the considered optical assemblies are large structures from one tomany millimeters as described in Fig. 2. To help engineers in designing the strength and durability of these optical assemblies, a newapproach seems to be necessary to model the mechanical behavior (fracture propagation and initiation) of the direct bonded in-terface.
To provide a solution, we choose in this investigation as Kubair et al. [24] to develop a cohesive zone model (CZM). Indeed,according to Khoramishad et al. [25] the CZM have the advantage of:
• considering finite strains and stresses at the adhesive crack tip,
• indicating both damage initiation and propagation as direct outputs of the model,
• advancing the crack tip as soon as the local energy release rate reaches its critical value with no need of complex moving meshtechniques.
Based on Continuum Damage Mechanics and Fracture Mechanics, the CZM enables a diagnostic of the current state of theadhesive interface damage along the overlap. The damage, associated to micro-cracks and/or voids coalescence, results in a pro-gressive degradation of the material stiffness before failure. An idealization of a CZM bilinear stress–strain relationship or CZMbilinear traction separation law is a well-established interface behavior that first assumes a linearly dependency relationship betweenthe interface separation (deformation) and the resulting traction (stress) as related in Fig. 3. Once a prescribed value of separation isreached by the adhesive, the damage initiation is described in the shape of a linearly decreasing resulting traction stress. Finally, thepropagation of the damage is described by voluntarily fixing the resulting traction stress to zero, hence modeling the creation of twotraction-free surfaces (i.e.: physical cracking). Both damage initiation and damage propagation phases are addressed in the modelwith no need of assuming any initial crack in the material.
In this paper, we develop a phenomenological cohesive zone model whose the parameters are identified on experimental results tomodel the fracture propagation and fracture initiation of elementary direct bonded assemblies. The first section presents threemechanical tests performed to characterize fracture propagation and initiation on a free edge: the wedge test [26], the flexibleinitiation test [27] and the cleavage test. For all samples tested, the confidential industrial bonding process is considered. Meaningthat all surfaces underwent several specific polishing and a chemical treatment, followed by a room temperature bonding without anythermal treatment. The second section introduced the atomistically motivated macroscopic cohesive zone model and values of modelparameters identified on experimental tests. The last section describes the cohesive zone model implemented in the finite elementscommercial code Abaqus, and compared prediction capability on fracture initiation and propagation simulations face to cleavage andwedge tests experimental results.
2. Mechanical experiments
In this section, we present three experimental tests performed on direct bonding samples to determine the following properties:the critical strain energy release rate, the critical stress in the joint on a straight free edge, and the critical initiation load on achamfered free edge (i.e. first load drop in the load–displacement curve).
2.1. Wedge test to characterize propagation
The bonding energy W is classically used to characterize adhesion [26]. The bonding energy can be related to the critical strain
Fig. 3. CZM bilinear traction separation law used to model normal behavior of the direct bonding interface with the confidential initial Winlightprocess.
A. Maurel-Pantel, et al. Engineering Fracture Mechanics 219 (2019) 106649
3

energy release rate [28]. The crack propagation method or wedge test is the most popular method to measure the bonding energy. Asrelated in Fig. 4, a razor blade is inserted at the interface between two slices bonded together. Then a crack appears and propagatesalong the bonded interface until the establishment of the equilibrium between the elasticity of slices and the chemical bonds re-sponsible for the adhesion (hydrogen bonds in this case). The length of the crack L is measured with a camera using interferencefringes due to the small thickness of air trapped at the open interface. At the equilibrium, the critical strain energy release rate GC isequal toW and related to the crack length using linear elastic fracture mechanics [29]. When both surfaces are identical, we can writein mode I:
= =G W γ2C (2)
where γ is the surface energy. Moreover, the critical strain energy release rate, thus the bonding energy W can be approximatelyrelated to the length L using the following equation [29]:
=G Et yL
316C
3 2
4 (3)
where E is the Young modulus of slices (in the case of fused silica glass, =E 72700 MPa), t the slice thickness; y the razor bladethickness and L the length of the crack. The wedge tests sample is composed with two slices of fused silica glass with 500 μm ofthickness t, 10 mm of width and 80 mm of length bonded together. The razor blade 100 μm of thickness y is always inserted by thesame length using a micrometric mobile plate and the insertion is controlled with a camera above the slices as shown in Fig. 4.Table 1 summarizes the wedge test results.
2.2. FIT Tests to identify properties of the joint
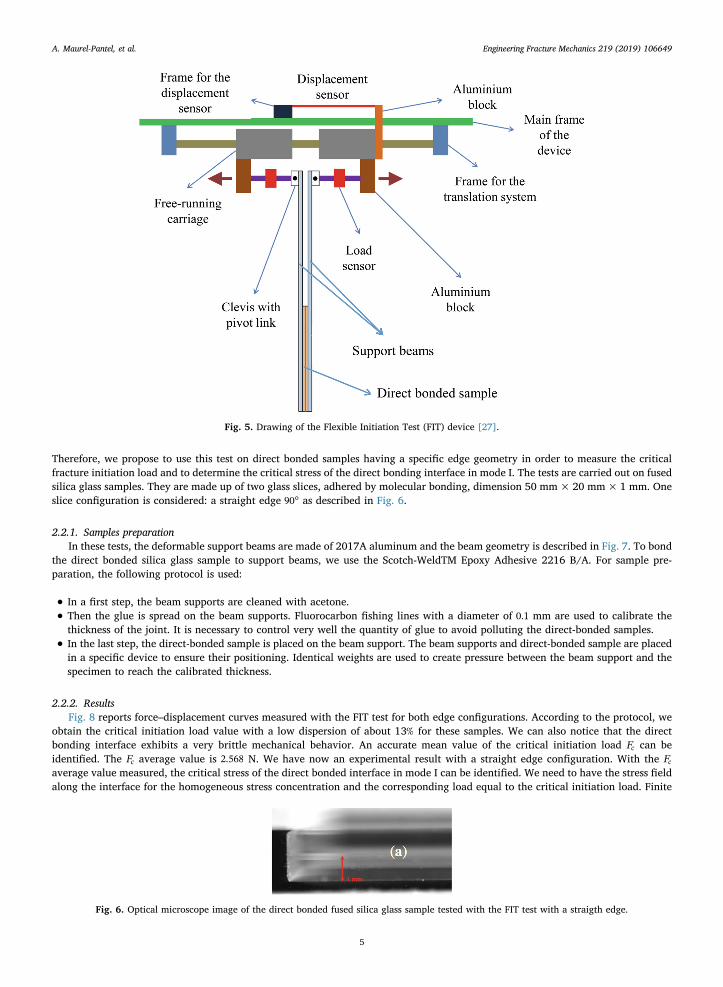
In previous investigations on direct bonding interface, we proposed the Flexible Initiation Test (FIT) to reduce the scattering ofcritical fracture initiation load measurements [27]. The FIT test uses deformable support beams bonded to sample (the sampleincludes the substrate and the adhesive). The load is symmetrically imposed at the tip of support beams, and load and displacementare measured as related in Fig. 5. Results show that a long support beam allows to reduce the scattering of critical fracture initiationload measurements, in particular for the adhesives with a brittle mechanical behavior (Araldite, Cyanoacrylate and Direct Bonding).
Fig. 4. Principe of Wedge test for direct bonding interface.
Table 1Wedge test results for fused silicate directbonding interface.
L (mm)exp −G (J m )C 2
28.6 0.0255
A. Maurel-Pantel, et al. Engineering Fracture Mechanics 219 (2019) 106649
4
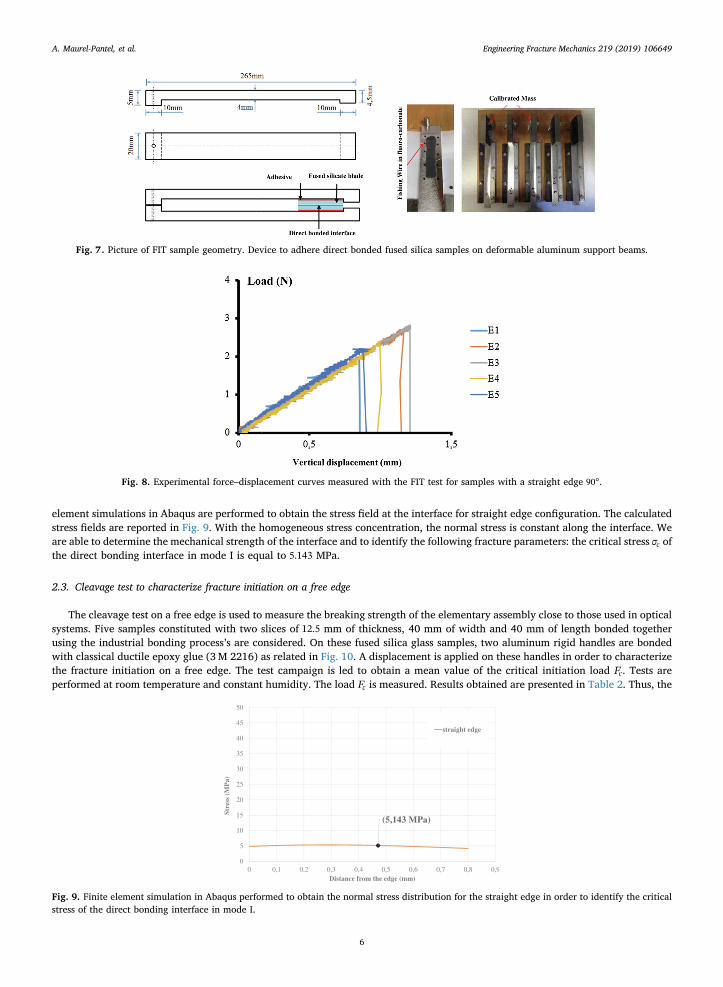
Therefore, we propose to use this test on direct bonded samples having a specific edge geometry in order to measure the criticalfracture initiation load and to determine the critical stress of the direct bonding interface in mode I. The tests are carried out on fusedsilica glass samples. They are made up of two glass slices, adhered by molecular bonding, dimension 50 mm×20 mm×1 mm. Oneslice configuration is considered: a straight edge °90 as described in Fig. 6.
2.2.1. Samples preparationIn these tests, the deformable support beams are made of 2017A aluminum and the beam geometry is described in Fig. 7. To bond
the direct bonded silica glass sample to support beams, we use the Scotch-WeldTM Epoxy Adhesive 2216 B/A. For sample pre-paration, the following protocol is used:
• In a first step, the beam supports are cleaned with acetone.
• Then the glue is spread on the beam supports. Fluorocarbon fishing lines with a diameter of 0.1 mm are used to calibrate thethickness of the joint. It is necessary to control very well the quantity of glue to avoid polluting the direct-bonded samples.
• In the last step, the direct-bonded sample is placed on the beam support. The beam supports and direct-bonded sample are placedin a specific device to ensure their positioning. Identical weights are used to create pressure between the beam support and thespecimen to reach the calibrated thickness.
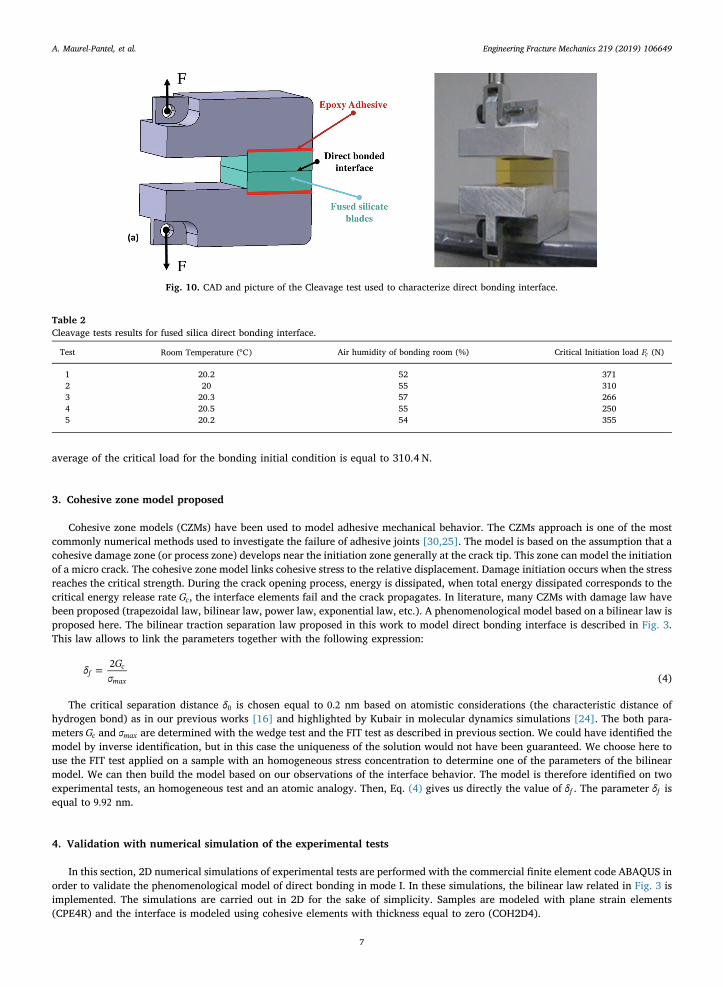
2.2.2. ResultsFig. 8 reports force–displacement curves measured with the FIT test for both edge configurations. According to the protocol, we
obtain the critical initiation load value with a low dispersion of about 13% for these samples. We can also notice that the directbonding interface exhibits a very brittle mechanical behavior. An accurate mean value of the critical initiation load Fc can beidentified. The Fc average value is 2.568 N. We have now an experimental result with a straight edge configuration. With the Fcaverage value measured, the critical stress of the direct bonded interface in mode I can be identified. We need to have the stress fieldalong the interface for the homogeneous stress concentration and the corresponding load equal to the critical initiation load. Finite
Fig. 5. Drawing of the Flexible Initiation Test (FIT) device [27].
Fig. 6. Optical microscope image of the direct bonded fused silica glass sample tested with the FIT test with a straigth edge.
A. Maurel-Pantel, et al. Engineering Fracture Mechanics 219 (2019) 106649
5
element simulations in Abaqus are performed to obtain the stress field at the interface for straight edge configuration. The calculatedstress fields are reported in Fig. 9. With the homogeneous stress concentration, the normal stress is constant along the interface. Weare able to determine the mechanical strength of the interface and to identify the following fracture parameters: the critical stress σc ofthe direct bonding interface in mode I is equal to 5.143 MPa.
2.3. Cleavage test to characterize fracture initiation on a free edge
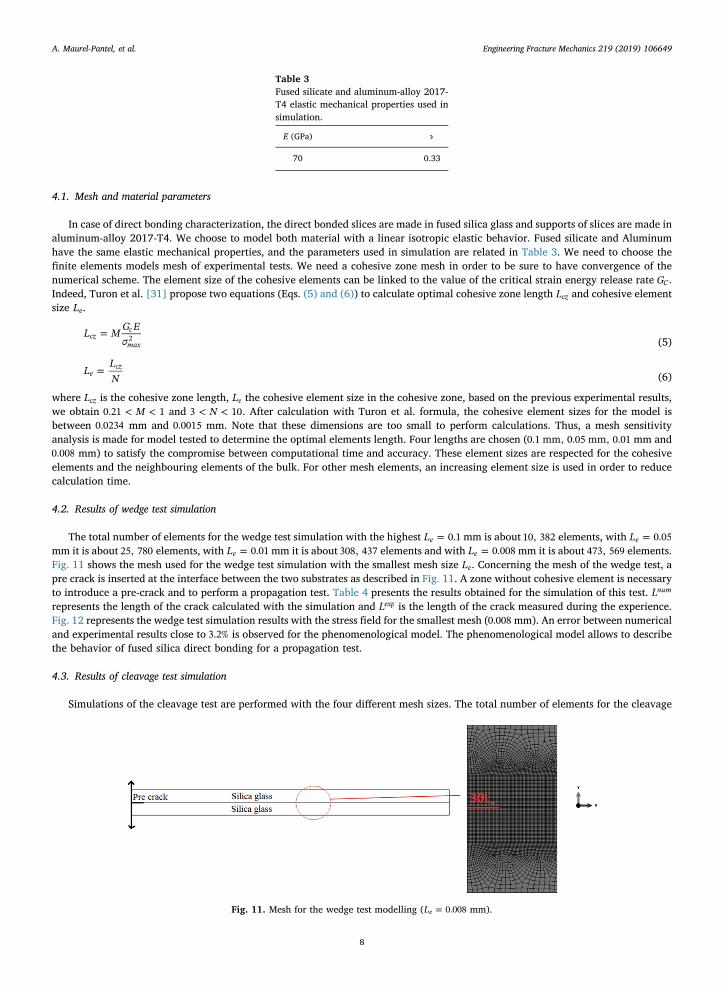
The cleavage test on a free edge is used to measure the breaking strength of the elementary assembly close to those used in opticalsystems. Five samples constituted with two slices of 12.5 mm of thickness, 40 mm of width and 40 mm of length bonded togetherusing the industrial bonding process’s are considered. On these fused silica glass samples, two aluminum rigid handles are bondedwith classical ductile epoxy glue (3M 2216) as related in Fig. 10. A displacement is applied on these handles in order to characterizethe fracture initiation on a free edge. The test campaign is led to obtain a mean value of the critical initiation load Fc. Tests areperformed at room temperature and constant humidity. The load Fc is measured. Results obtained are presented in Table 2. Thus, the
Fig. 7. Picture of FIT sample geometry. Device to adhere direct bonded fused silica samples on deformable aluminum support beams.
Fig. 8. Experimental force–displacement curves measured with the FIT test for samples with a straight edge °90 .
Fig. 9. Finite element simulation in Abaqus performed to obtain the normal stress distribution for the straight edge in order to identify the criticalstress of the direct bonding interface in mode I.
A. Maurel-Pantel, et al. Engineering Fracture Mechanics 219 (2019) 106649
6
average of the critical load for the bonding initial condition is equal to 310.4 N.
3. Cohesive zone model proposed
Cohesive zone models (CZMs) have been used to model adhesive mechanical behavior. The CZMs approach is one of the mostcommonly numerical methods used to investigate the failure of adhesive joints [30,25]. The model is based on the assumption that acohesive damage zone (or process zone) develops near the initiation zone generally at the crack tip. This zone can model the initiationof a micro crack. The cohesive zone model links cohesive stress to the relative displacement. Damage initiation occurs when the stressreaches the critical strength. During the crack opening process, energy is dissipated, when total energy dissipated corresponds to thecritical energy release rate Gc, the interface elements fail and the crack propagates. In literature, many CZMs with damage law havebeen proposed (trapezoidal law, bilinear law, power law, exponential law, etc.). A phenomenological model based on a bilinear law isproposed here. The bilinear traction separation law proposed in this work to model direct bonding interface is described in Fig. 3.This law allows to link the parameters together with the following expression:
=δ Gσ2
fc
max (4)
The critical separation distance δ0 is chosen equal to 0.2 nm based on atomistic considerations (the characteristic distance ofhydrogen bond) as in our previous works [16] and highlighted by Kubair in molecular dynamics simulations [24]. The both para-meters Gc and σmax are determined with the wedge test and the FIT test as described in previous section. We could have identified themodel by inverse identification, but in this case the uniqueness of the solution would not have been guaranteed. We choose here touse the FIT test applied on a sample with an homogeneous stress concentration to determine one of the parameters of the bilinearmodel. We can then build the model based on our observations of the interface behavior. The model is therefore identified on twoexperimental tests, an homogeneous test and an atomic analogy. Then, Eq. (4) gives us directly the value of δf . The parameter δf isequal to 9.92 nm.
4. Validation with numerical simulation of the experimental tests
In this section, 2D numerical simulations of experimental tests are performed with the commercial finite element code ABAQUS inorder to validate the phenomenological model of direct bonding in mode I. In these simulations, the bilinear law related in Fig. 3 isimplemented. The simulations are carried out in 2D for the sake of simplicity. Samples are modeled with plane strain elements(CPE4R) and the interface is modeled using cohesive elements with thickness equal to zero (COH2D4).
Fig. 10. CAD and picture of the Cleavage test used to characterize direct bonding interface.
Table 2Cleavage tests results for fused silica direct bonding interface.
Test Room Temperature (°C) Air humidity of bonding room (%) Critical Initiation load Fc (N)
1 20.2 52 3712 20 55 3103 20.3 57 2664 20.5 55 2505 20.2 54 355
A. Maurel-Pantel, et al. Engineering Fracture Mechanics 219 (2019) 106649
7
4.1. Mesh and material parameters
In case of direct bonding characterization, the direct bonded slices are made in fused silica glass and supports of slices are made inaluminum-alloy 2017-T4. We choose to model both material with a linear isotropic elastic behavior. Fused silicate and Aluminumhave the same elastic mechanical properties, and the parameters used in simulation are related in Table 3. We need to choose thefinite elements models mesh of experimental tests. We need a cohesive zone mesh in order to be sure to have convergence of thenumerical scheme. The element size of the cohesive elements can be linked to the value of the critical strain energy release rate GC.Indeed, Turon et al. [31] propose two equations (Eqs. (5) and (6)) to calculate optimal cohesive zone length Lcz and cohesive elementsize Le.
=L M G Eσcz
c
max2 (5)
=LLNe
cz(6)
where Lcz is the cohesive zone length, Le the cohesive element size in the cohesive zone, based on the previous experimental results,we obtain < <M0.21 1 and < <N3 10. After calculation with Turon et al. formula, the cohesive element sizes for the model isbetween 0.0234 mm and 0.0015 mm. Note that these dimensions are too small to perform calculations. Thus, a mesh sensitivityanalysis is made for model tested to determine the optimal elements length. Four lengths are chosen (0.1 mm, 0.05 mm, 0.01 mm and0.008 mm) to satisfy the compromise between computational time and accuracy. These element sizes are respected for the cohesiveelements and the neighbouring elements of the bulk. For other mesh elements, an increasing element size is used in order to reducecalculation time.
4.2. Results of wedge test simulation
The total number of elements for the wedge test simulation with the highest =L 0.1e mm is about 10, 382 elements, with =L 0.05emm it is about 25, 780 elements, with =L 0.01e mm it is about 308, 437 elements and with =L 0.008e mm it is about 473, 569 elements.Fig. 11 shows the mesh used for the wedge test simulation with the smallest mesh size Le. Concerning the mesh of the wedge test, apre crack is inserted at the interface between the two substrates as described in Fig. 11. A zone without cohesive element is necessaryto introduce a pre-crack and to perform a propagation test. Table 4 presents the results obtained for the simulation of this test. Lnum
represents the length of the crack calculated with the simulation and Lexp is the length of the crack measured during the experience.Fig. 12 represents the wedge test simulation results with the stress field for the smallest mesh (0.008 mm). An error between numericaland experimental results close to 3.2% is observed for the phenomenological model. The phenomenological model allows to describethe behavior of fused silica direct bonding for a propagation test.
4.3. Results of cleavage test simulation
Simulations of the cleavage test are performed with the four different mesh sizes. The total number of elements for the cleavage
Table 3Fused silicate and aluminum-alloy 2017-T4 elastic mechanical properties used insimulation.
E (GPa) ν
70 0.33
Fig. 11. Mesh for the wedge test modelling ( =L 0.008e mm).
A. Maurel-Pantel, et al. Engineering Fracture Mechanics 219 (2019) 106649
8
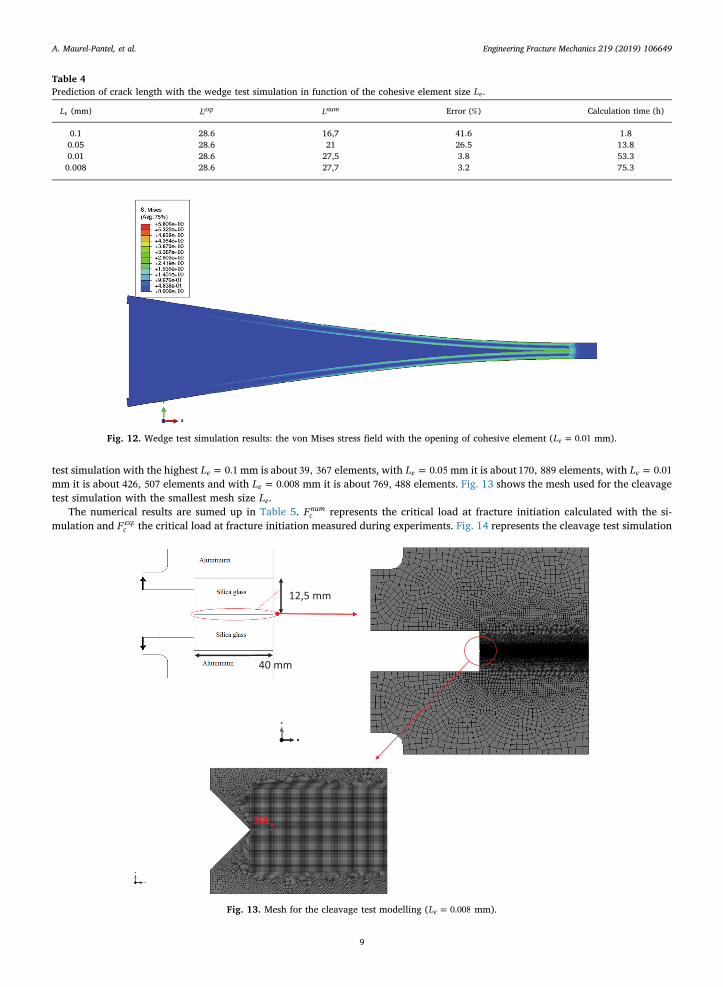
test simulation with the highest =L 0.1e mm is about 39, 367 elements, with =L 0.05e mm it is about 170, 889 elements, with =L 0.01e
mm it is about 426, 507 elements and with =L 0.008e mm it is about 769, 488 elements. Fig. 13 shows the mesh used for the cleavagetest simulation with the smallest mesh size Le.
The numerical results are sumed up in Table 5. Fcnum represents the critical load at fracture initiation calculated with the si-
mulation and Fcexp the critical load at fracture initiation measured during experiments. Fig. 14 represents the cleavage test simulation
Table 4Prediction of crack length with the wedge test simulation in function of the cohesive element size Le.
Le (mm) Lexp Lnum Error (%) Calculation time (h)
0.1 28.6 16,7 41.6 1.80.05 28.6 21 26.5 13.80.01 28.6 27,5 3.8 53.30.008 28.6 27,7 3.2 75.3
Fig. 12. Wedge test simulation results: the von Mises stress field with the opening of cohesive element ( =L 0.01e mm).
Fig. 13. Mesh for the cleavage test modelling ( =L 0.008e mm).
A. Maurel-Pantel, et al. Engineering Fracture Mechanics 219 (2019) 106649
9

with the stress field for the largest mesh. When the mesh is refined, a decrease of the critical load at fracture initiation Fcnum is
observed. Concerning the phenomenological model proposed the relative difference is close to 1.6%. The phenomenological modelallows to describe the behavior of fused silica direct bonding for an initiation test.
5. Conclusions
In this paper, a phenomenological model based on a bilinear law of cohesive zone model describing the fused silica direct bondingis proposed. The CZM is implemented in a finite elements software to simulate an initiation test (cleavage test) and a propagation test(wedge test). The phenomenological model well describes the normal behavior of the interface for the initiation and propagation test.These first results give us an available tool to simulate the behavior of fused silica direct bonding assemblies. The final aim consists indesigning large optical direct bonded structures as related in Fig. 2. However, it is important to note the fineness of the mesh sizerequired for simulation results convergence. It will be necessary to try to optimize the mesh sizes of complex assemblies to limitcomputation times. But this calculation issue remains a limitation of the cohesive element modeling approach.
In order to improve the model, it could be possible to take into account more precisely the nanometric characteristic size of thedirect bonding phenomenon and to insure a better change scale scheme in order to avoid a loss of information such as roughness [16],defects, nature of bonds. As prospects, multiscale methods could be developed and compared with experiments. These approachescould be based as Kubair et al. [24] on small-scale molecular dynamic calculations to describe the presence of different chemicalbonds at the interface. On the other hand, more sophisticated numerical methods - such as multi grid methods [32,33] or local defectcorrection method [34] - could be studied and implemented to predict initiation at the direct bonded interface in order to reduce thetime of calculation.
Acknowledgement
This work took place in the MATIOMA (Modelling and Technological improvement of Molecular Adhesion) project and has beencarried out thanks to the support of the A*MIDEX project (n ANR-11-IDEX-0001-02) funded by the Investissements d Avenir FrenchGovernment program, managed by the French National Research Agency (ANR). We would also like to thank the WinLight OpticsCompany for technical and financial support in these investigations.
Appendix A. Supplementary material
Supplementary data associated with this article can be found, in the online version, at https://doi.org/10.1016/j.engfracmech.2019.106649.
Table 5Prediction of critical load at fracture initiation with the cleavage test simulation in function of the cohesive element size Le.
Le (mm) Fcexp Fc
num Error (%) Calculation time (h)
0.1 310.4 549.3 77 2.60.05 310.4 426.4 37.4 12.50.01 310.4 317.4 2.2 14.60.008 310.4 315.5 1.6 16.2
Fig. 14. Cleavage test simulation results: kidney shape of the normal stress field with due to opening of cohesive element at the initiation ( =L 0.008e
mm).
A. Maurel-Pantel, et al. Engineering Fracture Mechanics 219 (2019) 106649
10

References
[1] Tong Q-Y, Gösele U. Semiconductor wafer bonding: recent developments. Mater Chem Phys 1994;37(2):101–27. https://doi.org/10.1016/0254-0584(94)90080-9.
[2] Kendall K. Molecular adhesion and its applications. Kluwer Academic Publishers.; 2004. https://doi.org/10.1007/b100328.[3] Tang Z, Shi T, Liao G, Liu S. Modeling the formation of spontaneous wafer direct bonding under low temperature. Microelectron Eng 2008;85(8):1754–7. https://
doi.org/10.1016/j.mee.2008.04.038.[4] Johnson K. The adhesion of two elastic bodies with slightly wavy surfaces. Int J Solids Struct 1995;32(3–4):423–30. https://doi.org/10.1016/0020-7683(94)
00111-9.[5] Galanov B. Models of adhesive contact between rough elastic solids. Int J Mech Sci 2011;53(11):968–77. https://doi.org/10.1016/j.ijmecsci.2011.07.010.[6] Lai S-I, Lin H-Y, Hu C-T. Effect of surface treatment on wafer direct bonding process. Mater Chem Phys 2004;83(2–3):265–72. https://doi.org/10.1016/j.
matchemphys.2003.09.024.[7] Klier K, Zettlemoyer A. Water at interfaces: molecular structure and dynamics. J Colloid Interface Sci 1977;58(2):216–29. https://doi.org/10.1016/0021-
9797(77)90139-4.[8] Stengl R, Tan T, Gösele U. A model for the silicon wafer bonding process. Jpn J Appl Phys 1989;28(Part 1, No. 10):1735–41. https://doi.org/10.1143/jjap.28.
1735.[9] Kissinger G, Kissinger W. Void-free silicon-wafer-bond strengthening in the 200–400 °C range. Sen Actuat. A: Phys 1993;36(2):149–56. https://doi.org/10.1016/
0924-4247(93)85009-5.[10] Ventosa C, Rieutord F, Libralesso L, Morales C, Fournel F, Moriceau H. Hydrophilic low-temperature direct wafer bonding. J Appl Phys 2008;104(12):123524.
https://doi.org/10.1063/1.3040701.[11] Nakanishi H, Nishimoto T, Nakamura R, Yotsumoto A, Yoshida T, Shoji S. Studies on SiO2–SiO2 bonding with hydrofluoric acid. room temperature and low stress
bonding technique for MEMS. Sens Actuat A: Phys 2000;79(3):237–44. https://doi.org/10.1016/s0924-4247(99)00246-0.[12] Berthold A, Vellekoop M. IC-compatible silicon wafer-to-wafer bonding. Sens Actuat A: Phys 1997;60(1–3):208–11. https://doi.org/10.1016/s0924-4247(97)
01355-1.[13] Laurent F, Renault E, Kosmalski J, Adjali L, Boudon D, Bacon R, et al. MUSE image slicer: test results on largest slicer ever manufactured. In: Atad-Ettedgui E,
Lemke D, editors. Advanced optical and mechanical technologies in telescopes and instrumentation SPIE; 2008. https://doi.org/10.1117/12.789285.[14] Pamplona T, Rossin C, Martin L, Moreaux G, Prieto E, Laurent P, et al. Three bipods slicer prototype: tests and finite element calculations. In: Atad-Ettedgui E,
Lemke D, editors. Advanced Optical and Mechanical Technologies in Telescopes and Instrumentation SPIE; 2008. https://doi.org/10.1117/12.789243.[15] Cocheteau N, Maurel-Pantel A, Lebon F, Rosu I, Prieto E, Ait-Zaid S, et al. Process parameters influence on mechanical strength of direct bonded surfaces for both
materials: silica and zerodurglasses. J Adhes Sci Technol 2014;28(10):915–34. https://doi.org/10.1080/01694243.2013.876138.[16] Cocheteau N, Maurel-Pantel A, Lebon F, Mazerolle F, Rosu I, Ait-Zaid S, et al. Influence of roughness on mechanical strength of direct bonded silica and zerodur
glasses. Int J Adhes Adhes 2016;68:87–94. https://doi.org/10.1016/j.ijadhadh.2016.02.006.[17] Scheerschmidt K, Conrad D, Belov A, Gsele U. Molecular dynamics modelling of silicon wafer bonding. Comput Mater Sci 1997;9(1–2):108–15. https://doi.org/
10.1016/s0927-0256(97)00064-5.[18] Yu H. A model of wafer bonding by elastic accommodation. J Mech Phys Solids 1998;46(5):829–44. https://doi.org/10.1016/s0022-5096(97)00100-2.[19] Turner K, Spearing S. Mechanics of direct wafer bonding. Proc Roy Soc A: Math, Phys Eng Sci 2005;462(2065):171–88.[20] Kubair DV, Spearing SM. Cohesive zone model for direct silicon wafer bonding. J Phys D: Appl Phys 2007;40(10):3070–6. https://doi.org/10.1088/0022-3727/
40/10/010.[21] Liao G, Shi T, Lin X, Ma Z. Effect of surface characteristic on room-temperature silicon direct bonding. Sens Actuat A: Phys 2010;158(2):335–41. https://doi.org/
10.1016/j.sna.2010.01.025.[22] Alfano M, Furgiuele F, Leonardi A, Maletta C, Paulino GH. Cohesive zone modeling of mode i fracture in adhesive bonded joints. Key Eng Mater
2007;348–349:13–6. https://doi.org/10.4028/www.scientific.net/kem.348-349.13.[23] Turner KT, Spearing SM. Accurate characterization of wafer bond toughness with the double cantilever specimen. J Appl Phys 2008;103(1):013514.[24] Kubair DV, Cole DJ, Ciacchi LC, Spearing SM. Multiscale mechanics modeling of direct silicon wafer bonding. Scripta Mater 2009;60(12):1125–8. https://doi.
org/10.1016/j.scriptamat.2009.02.058.[25] Khoramishad H, Crocombe A, Katnam K, Ashcroft I. A generalised damage model for constant amplitude fatigue loading of adhesively bonded joints. Int J Adhes
Adhes 2010;30(6):513–21.[26] Maszara WP, Goetz G, Caviglia A, McKitterick JB. Bonding of silicon wafers for silicon-on-insulator. J Appl Phys 1988;64(10):4943–50. https://doi.org/10.1063/
1.342443.[27] Bui Q, Maurel-Pantel A, Mazerolle F, Hochard C. The flexible initiation test (FIT): a new experimental test to characterize fracture initiation in mode i at the free
edge of bonded assemblies. Int J Adhes Adhes 2018;84:291–300. https://doi.org/10.1016/j.ijadhadh.2018.02.037.[28] Plßl A. Wafer direct bonding: tailoring adhesion between brittle materials. Mater Sci Eng: R: Rep 1999;25(1–2):1–88. https://doi.org/10.1016/s0927-796x(98)
00017-5.[29] Cognard J. The mechanics of the wedge test. J Adhes 1986;20(1):1–13. https://doi.org/10.1080/00218468608073236.[30] Elices M, Guinea G, Gomez J, Planas J. The cohesive zone model: advantages, limitations and challenges. Eng Fracture Mech 2002;69(2):137–63.[31] Turon A, Dávila C, Camanho P, Costa J. An engineering solution for mesh size effects in the simulation of delamination using cohesive zone models. Eng Fract
Mech 2007;74(10):1665–82. https://doi.org/10.1016/j.engfracmech.2006.08.025.[32] Barbié L, Ramière I, Lebon F. An automatic multilevel refinement technique based on nested local meshes for nonlinear mechanics. Comput Struct
2015;147:14–25. https://doi.org/10.1016/j.compstruc.2014.10.008.[33] Lebon F. Two—grid method for regularized frictional elastostatics problems. Eng Comput 1995;12(7):657–64. https://doi.org/10.1108/02644409510799839.[34] Barbié L, Ramière I, Lebon F. Strategies involving the local defect correction multi-level refinement method for solving three-dimensional linear elastic problems.
Comput Struct 2014;130:73–90. https://doi.org/10.1016/j.compstruc.2013.10.008.
A. Maurel-Pantel, et al. Engineering Fracture Mechanics 219 (2019) 106649
11