A Cluster Strategy Study of Printing and Publishing in...
58
A Cluster Strategy Study of Printing, Publishing and Advertising in Minnesota December 2010 Kane Bechstein Sasha Bergman Peter Jannett Lindsey Wollschlager
Transcript of A Cluster Strategy Study of Printing and Publishing in...

A Cluster Strategy Study of Printing, Publishing and Advertising in Minnesota
December 2010
Kane Bechstein Sasha Bergman Peter Jannett Lindsey Wollschlager

2
Table of Contents Economic Analysis of Minnesota’s Regional Economy ................................................................................. 4
Early Beginnings ........................................................................................................................................ 4
Roots of Minnesota’s Modern Economy .................................................................................................. 4
Challenges on the Horizon: Impact of the Great Recession .................................................................... 6
Character of Minnesota’s Export Markets ................................................................................................ 7
Investments in Education and Workforce Development.......................................................................... 8
Cluster Analysis ........................................................................................................................................... 10
Overview of the Printing, Publishing and Advertising Cluster in Minnesota .......................................... 11
Analysis of Economic Indicators for Statewide Cluster........................................................................... 12
Analysis of Printing .................................................................................................................................. 16
Analysis of Publishing .............................................................................................................................. 18
Analysis of Advertising ............................................................................................................................ 20
Underlying Economic Activity within the Cluster ................................................................................... 22
Analysis of Diamond of Advantage ............................................................................................................. 25
Firm Strategy, Structure and Rivalry ....................................................................................................... 26
Factor (Input) Conditions ........................................................................................................................ 27
Demand Conditions ................................................................................................................................ 27
Related and Supporting Industries ......................................................................................................... 28
SWOT Analysis............................................................................................................................................. 29
Strengths: ................................................................................................................................................ 29
Weaknesses: ........................................................................................................................................... 30
Opportunities: ......................................................................................................................................... 31
Threats: ................................................................................................................................................... 31
Emerging Trends in Printing, Publishing and Advertising ........................................................................... 32
Conclusion ................................................................................................................................................... 34
Recommendations to Increase Competitiveness: .................................................................................. 34
Organizing as a Cluster: ....................................................................................................................... 34
Collaborations with Related Industries or Institutions: ...................................................................... 35
Education and Workforce Development: ........................................................................................... 36
Special Thanks and Acknowledgements: .................................................................................................... 38

3
Works Cited ................................................................................................................................................. 39
Appendix A: State Location Quotients for Industry Sub-Fields .................................................................. 42
Appendix B: 2008 Advertising Employment by County ............................................................................. 44
Appendix C: 2008 Publishing Employment by County ............................................................................... 47
Appendix D: 2008 Printing Employment by County .................................................................................. 50
Printing Overall, Digital Printing and Book Printing ................................................................................ 50
Lithographic, Flexographic, Screen and Blank Book Printing .................................................................. 53
Manifold and Other Commercial Printing, Pre Press Services ................................................................ 56

4
Economic Analysis of Minnesota’s Regional Economy
Early Beginnings On May 11th, 1858, Minnesota officially became the 32nd state of the United States. The state
encompasses 86,943 square miles in north central United States. The physical composition includes
more than 11,000 lakes and a rich natural environment. Forests blanket the northern reaches of
Minnesota, while fertile prairie land extends across central and southern Minnesota. Despite being the
12th largest state geographically, Minnesota’s relatively low population places it at it 21st in the United
States with60% of Minnesotans living in the Twin Cities metro area. Rural counties are sparsely
populated except for areas near regional centers like Rochester, Duluth or Mankato.
Minnesota’s early economy was supported by natural endowments including lumber, large iron ore
deposits, and cultivatable land for agriculture. With easy access to waterways like the Mississippi River
and the Great Lakes, early millers such as the Northwestern Milling Company and Pillsbury benefitted
from the convenient shipping within the Twin Cities’ and Duluth harbors. Additionally, the University of
Minnesota began as a land-grant university in the 1850’s and provided early research support for
agriculture and other local industries.
In the early 1900’s, industrial development began to pull resources into urban areas to feed a growing
manufacturing industry. Companies like 3M and the Blandin Paper Company were founded at the turn
of the century and helped transform Minnesota’s economy through the introduction of advanced
production technologies. Following World War II, Minnesota’s economy quickly evolved with
innovations in farming practices and expansion into the food processing and biomedical technology
industries. Minnesota has continued to grow into a strong and diverse regional economy in the United
States.
The roots of the printing, publishing and advertising cluster are tied to some of these early industries.
As Minnesota developed a strong paper manufacturing sector, printing and publishing companies
appeared on the scene as well. Blandin Paper Company, for example, was established independently as
the Itasca Paper Company, but was soon bought by Charles Blandin, then owner of the St. Paul Pioneer
Press and Dispatch Printing Company (Blandin). Blandin Paper eventually transitioned away from
making newsprint paper to making magazine paper, and the company (now known as UPM) is one of
the largest producers of coated magazine paper in the world (UPM). Not coincidentally, Minnesota now
has a strong magazine publishing sector.
Roots of Minnesota’s Modern Economy Minnesota put this new prosperity to good use. Between 1929 and 1959, per capita income in
Minnesota was just average, ranking 25th in the United States (Grunewald 2010). Above average
investments in education during the 1940’s and 1950’s set the stage for “The Minnesota Miracle,” which

5
was enacted in 1971 and restructured education funding mechanisms to make it more equitable for all
school districts throughout the state (MHS). By the 1990’s, per capita income in Minnesota ranked 10th
nationally, and the state had built a strong reputation as “The State That Works” according to a Time
Magazine article written in 1973, highlighting Minnesota’s strong quality of life, low crime rate, and a
highly educated workforce (Time Magazine).
Today’s economy continues to outpace national averages. The mean personal income statewide has
remained approximately $2,500 above the U.S. average for the last decade, which indicates stable and
high productivity. Additionally, Minnesota outpaces the national average in labor force participation
and unemployment rates and is currently trending to further the gap. Ranking 10th nationally in patents
in 2008, it should come as no surprise that this innovative region is ahead of the curve.
Demographically, challenges are on the horizon for Minnesota. Population growth in the state is slightly
lower than national trends. Our workforce is aging faster than some other regions as well. Although
Minnesota is known for its highly productive workforce, a challenging transition may be ahead as Baby
Boomers retire and Minnesota employers turn to younger workers to fill in the gaps. This will be
particularly true for the printing industry, where the average age of employees is 57 and the average
length of employment within the industry is nearly 20 years (K. Davis). Interview sources suggest a
similar trend is playing out within publishing as well, though data is not available to confirm this
observation. As a result, future workforce training is a dominant concern among firms in publishing,
printing and advertising.
Table 1: Economic and Demographic Characteristics of Minnesota Compared to the U.S.
Source: U.S. Census and MN DEED
Basic Demographics & Performance
Minnesota U.S.
2008 Population 5,220,000 304,060,000
2007-08 Growth Rate 0.73% 0.92%
2008 Personal Income/Capita $43,037 $40,208
2008-09 Growth 3.05% 1.97%
2009 Labor Force Participation 71.90% 64.90%
2008-09 Growth Rate 0.56% -1.52%
2010 Unemployment Rate 6.90% 9.50%
2009-10 Change -0.90 pts -0.10 pts
Persons Below Poverty 9.60% 13.20%

6
As in other states, most jobs in Minnesota exist to serve local needs. According to Joe Cortright, an
economist and president of the Oregon consulting firm Impresa, most of the jobs in a given geographic
area serve the local economy. Cortright finds that about two-thirds of economic activity is the same
everywhere and is primarily local in nature. The other one-third to one-fourth of an area’s economic
activity is “unique” from other economies and primarily export-driven (Cortright).
In 2007, about a quarter of jobs in Minnesota were in “traded clusters,” or in other words, economic
sectors that produce goods and services primarily for export (Bryden). The Minneapolis-St. Paul
metropolitan region has a slightly larger share of jobs involved with export activity. In 1998, however,
the share of jobs in the traded sector was nearly 30%, suggesting that the traded sector has contracted
(Bryden). Both these measurements are snap-shots in time, so caution should be taken when trying to
infer a precise trendline for export activity. It would appear, however, that attention should be paid to
the potential weakening of our traded sectors. Michael Porter, of the Harvard Business School, suggests
that export activity is a good way to track the health of a regional economy since exports reflect an
ability to draw new money into a region to stimulate new growth.
Challenges on the Horizon: Impact of the Great Recession The “Great Recession” hit Minnesota hard. From 2008 to 2009 the state lost over 103,000 jobs
(-2.9%) (BEA). The big losses came from a 36,000 job decline in the manufacturing industry as well as a
19,500 job decline in construction. As seen in Table 2, 13 of the top 20 industries in Minnesota saw
declines in employment from 2008 to 2009. Only farming, utilities, and health care saw employment
increase above two percent during this period. Recent statistics from the Department of Employment
and Economic Development (DEED) note that Minnesota’s jobless rate is holding steady at 7% (DePass).
Overall, Minnesota performed better than the nation did in 12 of the 20 categories and by 0.3
percentage points overall.
One challenge in identifying trends within the printing, publishing and advertising cluster is that each
has subsector industries that are tracked within separate categories by governmental economic
agencies. Printing is included within manufacturing, as are the related industries of paper, inks, and
printing equipment such as engraved printing plates. Publishing is included within the information
sector, and advertising is included within the designation of “professional, scientific and technology”
services. Advertising is further split into categories that track the actual design work of advertising, as
well as marketing consulting and the sales and distribution of advertising materials.
Manufacturing employment in MN declined 10% in 2009, compared to 3-4% for the information and
professional services industries. Although the information below in Table 1 is a high level summary of
industry sectors in Minnesota, the relative declines in manufacturing versus information and
professional services reflects trends within the smaller printing, publishing and advertising cluster. Job
losses during the recession occurred across the cluster, but printing was impacted most severely. While
publishers and advertisers expect their work to pick up after the recession, uncertainty exists within the

7
printing sector. However, printing will remain an important industry for Minnesota. As technology
continues to change the face of printing it will likely increase its ties to advertising while distancing even
further from publishing. Direct mail advertising and packaging will increasingly become important
regional specializations for printers, as well as for advertisers.
Table 2: Changes in Minnesota Employment by Industry, 2008 to 2009
Minnesota Industry Employment
2008 2009 Change Change %
Farm employment 81,796 87,074 5,278 6.45%
Mining 9,002 9,076 74 0.82%
Utilities 13,253 13,550 297 2.24%
Construction 179,790 160,319 -19,471 -10.83%
Manufacturing 348,577 312,726 -35,851 -10.28%
Wholesale trade 144,258 137,240 -7,018 -4.86%
Retail trade 364,052 345,599 -18,453 -5.07%
Transportation and warehousing 108,316 102,406 -5,910 -5.46%
Information 67,188 64,545 -2,643 -3.93%
Finance and insurance 199,219 207,173 7,954 3.99%
Real estate and rental and leasing 134,773 132,025 -2,748 -2.04%
Professional, scientific, and technology 209,577 202,744 -6,833 -3.26%
Management of companies 72,697 71,492 -1,205 -1.66%
Administrative and waste services 167,999 154,722 -13,277 -7.90%
Educational services 78,712 79,507 795 1.01%
Health care and social assistance 430,576 440,818 10,242 2.38%
Arts, entertainment, and recreation 78,844 79,656 812 1.03%
Accommodation and food services 220,146 213,394 -6,752 -3.07%
Other services 182,899 177,288 -5,611 -3.07%
Government 419,931 416,473 -3,458 -0.82%
Source: U.S. Bureau of Economic Analysis
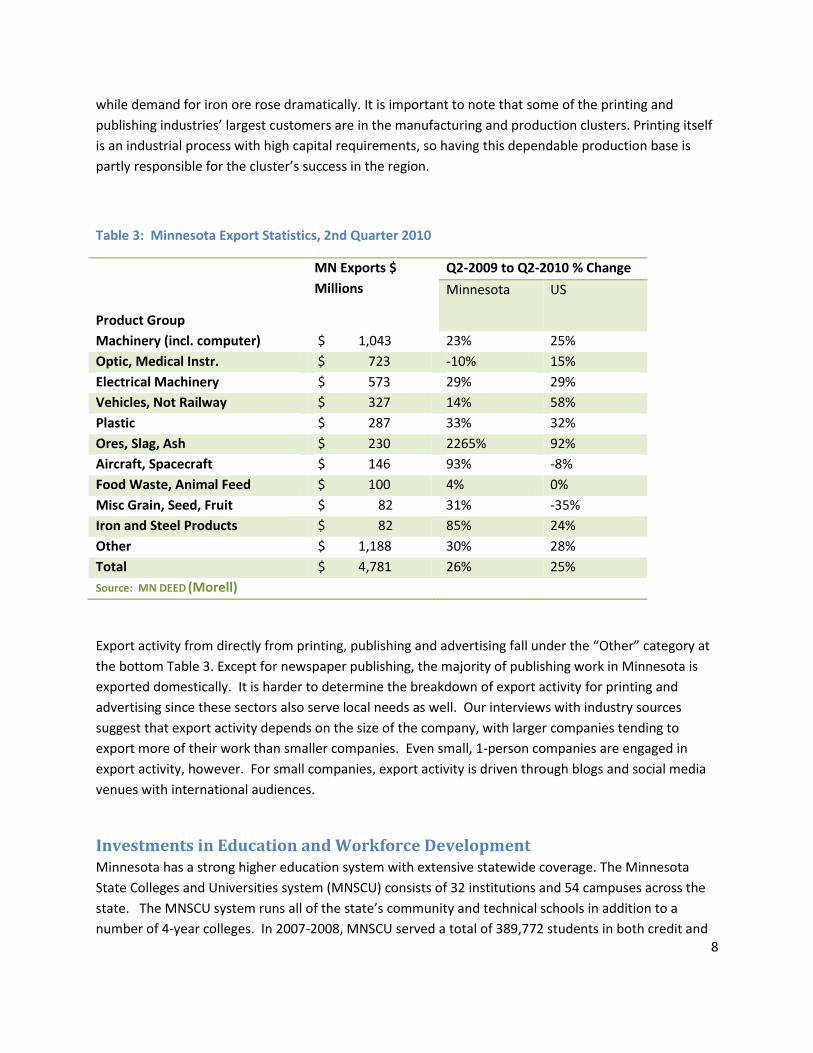
Character of Minnesota’s Export Markets Most recently there has been a strong upward trend in exports at both the state and national levels.
Exports for the US and Minnesota have increased 25% and 19% respectively in the past year. At almost
$5 billion in the second quarter alone, exports are a crucial piece of Minnesota’s economy and
competitive position. As demonstrated in Table 3 below, machinery was the largest export product in
2009, amounting to more than 20% of total export dollars. Minnesota’s biomedical industries
accounted for 15%of exports over this time and Ores, Slag, and Ash had tremendous gains as overseas
8
while demand for iron ore rose dramatically. It is important to note that some of the printing and
publishing industries’ largest customers are in the manufacturing and production clusters. Printing itself
is an industrial process with high capital requirements, so having this dependable production base is
partly responsible for the cluster’s success in the region.
Table 3: Minnesota Export Statistics, 2nd Quarter 2010
Product Group
MN Exports $
Millions
Q2-2009 to Q2-2010 % Change
Minnesota US
Machinery (incl. computer) $ 1,043 23% 25%
Optic, Medical Instr. $ 723 -10% 15%
Electrical Machinery $ 573 29% 29%
Vehicles, Not Railway $ 327 14% 58%
Plastic $ 287 33% 32%
Ores, Slag, Ash $ 230 2265% 92%
Aircraft, Spacecraft $ 146 93% -8%
Food Waste, Animal Feed $ 100 4% 0%
Misc Grain, Seed, Fruit $ 82 31% -35%
Iron and Steel Products $ 82 85% 24%
Other $ 1,188 30% 28%
Total $ 4,781 26% 25%
Source: MN DEED (Morell)
Export activity from directly from printing, publishing and advertising fall under the “Other” category at
the bottom Table 3. Except for newspaper publishing, the majority of publishing work in Minnesota is
exported domestically. It is harder to determine the breakdown of export activity for printing and
advertising since these sectors also serve local needs as well. Our interviews with industry sources
suggest that export activity depends on the size of the company, with larger companies tending to
export more of their work than smaller companies. Even small, 1-person companies are engaged in
export activity, however. For small companies, export activity is driven through blogs and social media
venues with international audiences.
Investments in Education and Workforce Development Minnesota has a strong higher education system with extensive statewide coverage. The Minnesota
State Colleges and Universities system (MNSCU) consists of 32 institutions and 54 campuses across the
state. The MNSCU system runs all of the state’s community and technical schools in addition to a
number of 4-year colleges. In 2007-2008, MNSCU served a total of 389,772 students in both credit and

9
non-credit courses, and the system graduated 33,722 students in 2008. Additionally, the University of
Minnesota system operates 5 campuses, 16 regional extension offices, and 16 research and outreach
centers statewide, with an enrolled student population of over 65,000.
Due in part to the educational achievements of its residents, 67% of jobs in Minnesota currently require
a post-secondary education. A report sponsored by the Georgetown University Center on Education and
the Workforce projects that the number of jobs requiring a college education will continue to rise,
possibly as high as 70% by 2018 (Carnevale). This positions Minnesota to continue growing its
knowledge-based economy, as well as to continue attracting well-educated workers to the state.
Minnesota’s continued demand for college-educated workers brings good tidings for our local publishing
and advertising sectors as they rely on highly literate and creative employees. However, Minnesota’s
shift towards a “knowledge economy” stands in contrast to the workforce needs of the manufacturing
sector. The 2010 State of Manufacturing report produced by Enterprise Minnesota finds that only 50%
of manufacturing jobs in Minnesota require training beyond high school, and the vast majority do not
require a full 4-year degree (Enterprise Minnesota). Further, in our interviews we learned that two-year
technical degrees are in demand by printing employers, since printing is a high-skill occupation requiring
specialized knowledge.
Minnesota’s economic future depends largely on whether or not its education system can provide the
necessary number of workers to meet future demands. Among Minnesota schools, few colleges offer
courses related to the printing, publishing and advertising industry cluster. A brief survey of current
course offerings in the UofMN and MnSCU systems found 10 campuses offering classes related to the
cluster. Most of these programs emphasize teaching desktop software skills, but these are not the skills
needed to fill current and projected job openings within the cluster. Only three colleges statewide
(Hennepin Technical College, Mesabi Technical College, and South Central College) offer programs and
courses in shop-floor production techniques that are critical to the printing industry, such as binding. In
addition, there is not a single college in MN that offers a degree program in publishing (Wallek). Book
publishers, in particular, spoke of the need for employees who are trained in layout, fact-checking, and
design for digital media like e-readers and social media applications.
In recent years there have been significant drop-offs in job-placement rates for these training programs.
This perhaps explains why there are many open seats in the technical and floor operation classes
offered by MnSCU. These technical and floor operation print skills are the most in-demand from
employers, however. Because of high demand for these skills from employers in the printing industry,
the inability to achieve full enrollment is troubling. The enrollment statistics in Table 4 detail the
difficulties in filling seats in shop-floor classes.

10
Table 4: Yearly Enrollment Statistics for MNSCU Printing Courses
Year College Program Seats Available
Seats Filled
Percent Filled
2007 Mesabi Graphic and Printing Equipment 480 259 54%
2008 Mesabi Graphic and Printing Equipment 480 307 64%
2009 Mesabi Graphic and Printing Equipment 480 266 55%
2010 Mesabi Graphic and Printing Equipment 588 394 67%
2007 Hennepin Graphic and Printing Equipment 61 47 77%
2008 Hennepin Graphic and Printing Equipment 53 34 64%
2009 Hennepin Graphic and Printing Equipment 65 46 71%
2010 Hennepin Graphic and Printing Equipment 56 34 61%
2007 Hennepin Operator 394 204 52%
2008 Hennepin Operator 351 164 47%
2009 Hennepin Operator 322 140 43%
2010 Hennepin Operator 292 118 40%
Source: MNSCU Academic Director Tamara Aarnodt
Cluster Analysis Traditional cluster definitions separate advertising from printing and publishing. The reasons for this are
historical. The printing and publishing industries have long-standing ties to each other. The first printing
and publishing companies in Minnesota date back to the late 1800s, and these early companies were
often vertically integrated with paper companies. For example, Charles Blandin purchased the Itasca
Paper Company in 1916 to secure a reliable source of newsprint paper for the St. Paul Pioneer Press /
Dispatch Printing Company (Blandin). Blandin later sold the Pioneer Press / Dispatch Printing Company,
but kept the paper mill, which became world famous under the Blandin name (Blandin). Similar
arrangements existed for book and periodical publishers as well. For example, the University of MN
Press developed as a joint printing and publishing operation to produce and disseminate the work of
University professors. Historically newspaper and periodical publishers played the role of local
advertisers as well. Around the 1950s, advertising developed as a mature industry in Minnesota.
Specialized firms emerged and operated independently of existing publishers. Yet, advertisers remained
an integral partner in the success of local printers and publishers. Because these new advertising
agencies were not vertically integrated with printers and publishers, the advertising industry has been
considered a separate entity. Economic development specialists have been slow to recognize that these
three industries operate together as one cluster.
This report began as a study of printing and publishing, but our interview subjects identified advertising
as an important component. In our analysis, the inclusion of advertising came late in the progress of this
study. Because we were operating under a limited timeline, we were not able to fully explore the
degree to which the advertising industry plays a role in the publishing and printing industry cluster. In

11
many ways, advertising is a distinctly different economic activity from publishing, and the skill sets
involved tend to be very different. Yet in Minnesota, publishers and advertising agencies draw upon
many of the same freelance writers, graphic designers and illustrators. These phenomena may be due
to strong occupational spillover. Further, innovations in printing are driven by customer demands from
publishing and advertising alike. Our research shows that these three industries are intricately bound
together in an interdependent customer-supplier network. Figure 1 provides a visual description for the
way we began to view the cluster.
Figure 1: Paradigm Shift in Defining Cluster
Overview of the Printing, Publishing and Advertising Cluster in Minnesota Minnesota is a hub for several industry clusters that have a competitive edge over other regions,
including medical devices, forest products, and many others. Depending on the region of focus within
the state, the presence and performance of industry clusters varies. The printing, publishing and
advertising cluster is one of the strongest in Minnesota, though the reach of these sectors do not spread
evenly across the state. Printing and publishing firms can be found in nearly every county of the state,
but advertising is generally concentrated in regional urban centers like Duluth, St. Cloud, Rochester and
the Twin Cities. In 2009, 68,000 people were employed in these three industries, representing more
than 3% of all jobs in Minnesota (BLS). More than 18,000 jobs have been lost since 2001, however,
reflecting the impact of the “Great Recession” but also some larger structural shifts in the economy
(BLS).
The University of Minnesota published an industry cluster report in 1995 that examined the
performance of printing and publishing, among other clusters located in the Minneapolis-St. Paul
metropolitan area (Munnich). The study found that the publishing and printing cluster in Minnesota had

12
the highest cluster employment concentration in the country, reflected by the presence of several large
firms in this market (Deluxe Corporation, West Publishing, and Quebecor). In the mid-1990s, the
printing industry in Minnesota ranked 5th in the United States behind Chicago, Los Angeles, New York
City and Philadelphia. According to the organization Printing Industry of Minnesota (PIM), Minneapolis
is now ranked 4th behind New York City, Los Angeles and Chicago (D. Radzeij, K. Davis).
This ranking should not cause over-confidence, however. Even as our local competitive advantage
increases, other regions continue to challenge us. Pennsylvania remains a competitive region for
printing, as is Dallas, TX (Bijnagte). Highly specialized printers in Colorado and Florida are also making
their mark, according to interviews with publishing and advertising sources. Silicon Valley is becoming a
new supply chain destination for publishers seeking talent to design online applications for digital
content. Outside the United States, printers in Winnipeg, CN, draw a lot of business away from
Minnesota, as do printers located in China. Minnesota is becoming known for producing high-quality
products with “artisanal touches.” Our reputation is positive, but it poses special challenges for local
companies trying to attract orders from companies who are primarily concerned with obtaining low
prices. Minnesota companies are price-competitive, but our region is not always perceived as being so.
Analysis of Economic Indicators for Statewide Cluster For the state as a whole, each sector of this cluster demonstrates a regional comparative advantage
compared to other states. Later sections will dive into the particular details of printing, publishing and
advertising, but for now it is worth noting that within each industry, Minnesota has developed niche
specializations that are highly concentrated here in Minnesota as compared to elsewhere. In the table
below, statewide location quotients are provided for the major industries involved in this cluster.
Generally, Minnesota’s regional competitiveness in printing, publishing and advertising has grown over
time, but qualifiers must be placed on this statement. For example, advertising in general is losing
regional competitiveness, but direct mail advertising is experiencing strong growth. Book publishing, is
also increasing growing more geographically concentrated, but Minnesota is losing competitiveness in
periodical publishing. The decline in specialized design services could be a worrying trend since
designers support the creative aspects of publishing and advertising.

13
Table 5: Specialization of MN Employment Compared to National Employment per Industry, 2001 and 2009
Industry 2009 Jobs
2001 LQ^
2009 LQ^
Change in LQ
Printing and Related Support Activities 26,374 2.06 2.46 0.40
Printing 24,280 2.08 2.44 0.36
Support Activities for Printing 2,094 1.90 2.78 0.88
Paper manufacturing 10,679 1.27 1.28 0.01
Pulp, paper, and paperboard mills 3,145 1.33 1.32 -0.01
Converted paper product manufacturing 7,533 1.24 1.27 0.03
Publishing Industries 22,647 1.32 1.39 0.07
Newspaper Publishers 6,517 1.10 1.14 0.04
Periodical Publishers 1,724 1.06 0.67 -0.39
Book Publishers 7,932 4.13 5.11 0.98
Advertising, PR, and related services 10,310 1.33 1.20 -0.13
Advertising agencies 3,763 1.14 1.08 -0.06
Direct mail advertising 1,924 1.40 1.72 0.32
Specialized design services 2,004 1.03 0.79 -0.24
Other professional and technical services 12,416 0.90 1.06 0.16 Data Source: U.S. Bureau of Labor Statistics Quarterly Census of Employment and Wages (QCEW)
^ A location quotient greater than 1.00 signifies greater local specialization in the industry than the nation as a whole. Positive changes between 2001 and 2009 means the industry is becoming more geographically concentrated in Minnesota. Negative changes between 2001 and 2009 means that the industry is shifting geographically towards other regions.
*2008 data
A location quotient greater than 1 indicates that the industry has a higher concentration of employment
relative to the nation. This indicator suggests that firms in these industries are more competitive than
other firms nationally due to the higher concentration of employment. A high location quotient also
indicates that the industry may produce a significant amount of exports to other regions.
As mentioned earlier, the printing, publishing and advertising industries have experienced job losses in
recent years. The “Great Recession” played a large role, but so did changing dynamics within each
industry. New printing technologies drive efficiency gains on the printing side, leading to reduced
employment. Additionally, the internet and growth of smart phones and other devices is transforming
the way people access information, leading to reduced demand for printed materials.

14
A few major trends can be noted. Minnesota’s regional competitiveness in printing has been growing
over time, though this trend is offset by declining employment. Comparatively, other states have lost
more jobs than Minnesota has. Book publishing has an extremely strong regional advantage in
Minnesota, but our regional competitiveness in periodical publishing is declining. Within advertising,
our state is developing a dominant position in direct mail advertising. Specialized design services
include graphic design, an important input for both advertising and publishing. Other professional
services include industries like private mail houses and packaging and labeling services.
Within the larger narrative of job losses, there is a silver lining. When local job loss rates are analyzed
against national industry trends and the performance of the U.S. economy as a whole, the particular
impact of the local industry is revealed. The shift-share table below “decomposes” job losses by parsing
out the effect of national employment trends, employment trends within the industry as a whole, and
employment trends within the local industries. This type of analysis shows that local job losses in
printing and publishing are largely driven by national factors. Advertising did not see any positive effect
from local trends. Without the strong performance of local firms, regional job losses over the past
decade would have been much higher.
Table 6: Analysis of Employment Changes in MN by Industry, 2001 - 2009
Changes in total employment
due to
Industry
National Economic
Trends
Local Industry Trends
National Industry Trends
Total Job Growth/ Loss
% Change in Jobs
Printing and Related Support Activities -697 4,356 -9,577 -5,917 -18.%
Paper manufacturing -324 132 -4,140 -4,332 -29%
Publishing Industries -596 1,045 -5,414 -4,965 -18%
Advertising, PR, and related services -281 -1,159 -1,256 -2,696 -21%
Specialized design services -59 -608 -69 -736 -27%
Other professional and technical services -189 1,883 1,956 3,650 42%
Business support services -334 -3,820 1,205 -2,949 -19% Data Source: MN Department of Employment and Economic Development and U.S. Bureau of Labor Statistics Quarterly Census of Employment and Wages (QCEW)

15
Printing and publishing firms are competitive across most regions of the state, except for the
northeastern corner by Duluth. As shown in Table 7 below, Southwest Minnesota has the highest
location quotient for publishing and printing, though to some degree this is a function of the low
population density in this region of the state. Southwest MN is also home to Mankato’s Taylor
Corporation, one of the country’s largest privately held firms (Taylor). Taylor Corporation owns more
than 80 subsidiaries in the United States and internationally, and on the whole, the company employs
more than 9,000 people. The Twin Cities metropolitan region has the next highest concentration of
printing and publishing jobs in the state. The major player in this region is Thomson Reuters. Thomson
Reuters employs tens of thousands people in over 400 locations worldwide, and the company traces its
roots back to 1799 with the founding of Sweet & Maxwell legal publishing company in London (Thomson
Reuters). West Publishing, a subsidiary of Thomson Reuters, is headquartered in Eagan, MN, and
employs about 8,500 people across the United States (West).
It should be noted that this table was drawn from work done by the MN Department of Employment
and Economic Development, and it only includes information for printing and publishing. Advertising
employment is not included in these calculations because advertising is generally concentrated in the
Twin Cities region.
Table 7: Regional Location Quotients for Publishing and Printing (Advertising Not Included)
Region Location Quotient for Publishing and Printing Cluster
(2008)
Northeast Minnesota 0.8
Northwest Minnesota 1.1
Southeast Minnesota 1.1
Central Minnesota 1.4
Twin Cities Metro Area 1.99*
Southwest Minnesota 3.2 Source: MN Department of Employment and Economic
Development (DEED)
*2006 data.
Some organizations we interviewed expressed doubt about the validity of using location quotients as a
basis for measuring the regional competitiveness of industries. Since location quotients are measuring
relative concentrations of employment, a high location quotient could indicate lower relative
productivity, since other regions may have higher capital investment rates that lead to reduced
employment. This is a valid question, and our existing data cannot entirely address this concern. With
location quotients close to 1, it would be difficult to rule out the confounding factor of capital
investment rates. Location quotients much higher than 1, however, are extremely difficult to achieve
without a true concentration of employment here.

16
Analysis of Printing Printing has a broad impact on Minnesota’s statewide economy. In 2009, there were over 900
companies located in most counties of the state and employing more than 26,000 people. Printing firms
paid a collective $1.2 billion in wages and generated more than $5.5 billion in sales (BLS, PIM). Average
annual wages for a printer is about $45,000, while average annual wages for prepress services is closer
to $58,000. This industry provides well-paying jobs, reflective of the skills demanded by the work
involved. Employment has declined 18% since 2001, however (BLS).
The printing industry is in an important period of transition. Some firms are starting to identify as being
in the “graphic communications industry” rather than “printing” (Taylor). The printing industry has a
strong presence across the state stemming from its historic relationship to the newspaper publishing
industry. Printing is a highly specialized industry, however. Without getting too bogged down in the
details, it is worth noting that new printing technologies have emerged over time without necessarily
replacing previous technologies. Some printing processes are better suited for certain types of
materials, while other processes are better suited for different size capacities. Even some printing
processes that could have been left for dead a generation ago are experiencing a revival. Letterpress
technology is on the rise again, as are engraving and etching processes. Thinking about what kinds of
policies could benefit the printing industry is a challenge. Official definitions don’t capture everything
the printing industry does or is capable of doing. This is a dynamic industry that is evolving with the
times, though they are facing challenges as the economy moves away from a dependence on printed
information. Direct mail advertising and packaging represent important growth sectors for Minnesota
printers. Other firms that focus solely on printing brochures and other materials are having a more
difficult time transitioning to the new era of digital media.
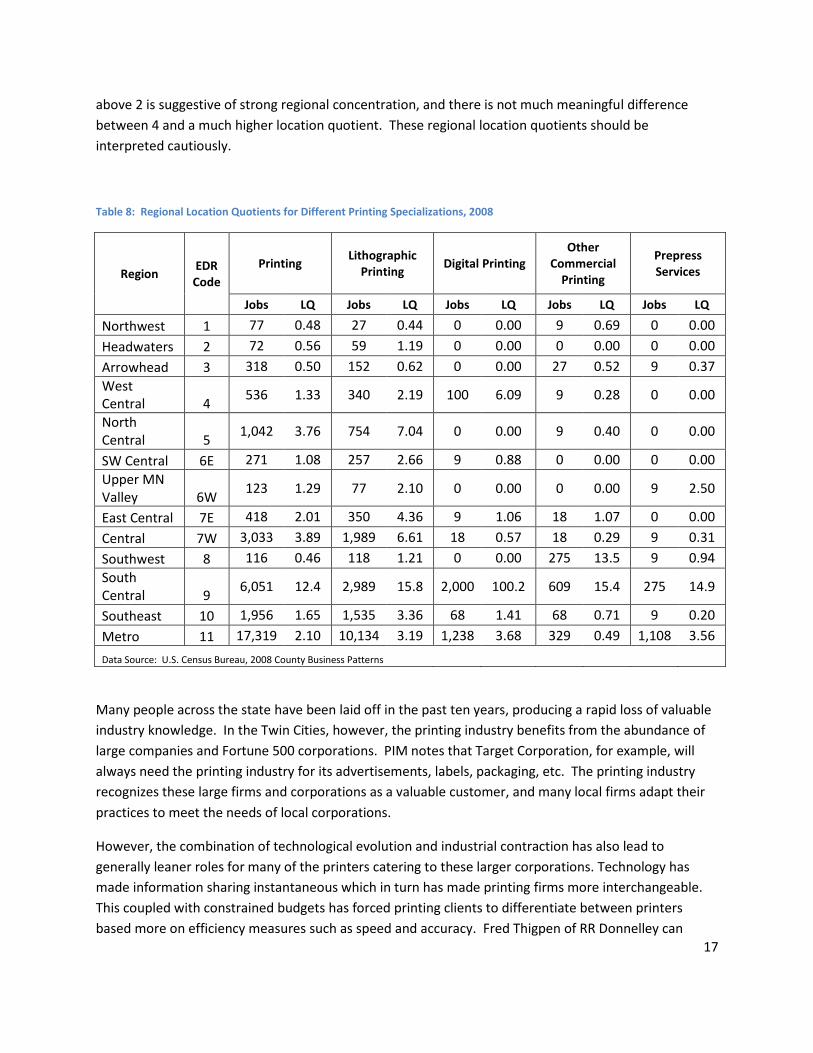
Table 8 compares the major printing specialties by economic development region. Lithographic printing
(also known as offset printing) is the most common type of printing done in Minnesota. Lithographic
printing is best suited for large print jobs, on the order of 50,000+ pieces (Westerlund). This type of
printing process is used for a wide range of products, including magazines, cardboard packaging and
some kinds of books. While large firms all have some degree of lithographic production capacity,
lithographic technology is also used by small community newspaper printers. In 2009, there were 85
newspaper printers in Minnesota, down from 219 newspaper printers in 2000 (PIA). Digital printing is
the fastest growing specialization, and these printers so far are concentrated in Mankato and the Twin
Cities (BLS). Taylor Corporation is the major player in this emerging sub-field. Prepress services are also
growing quickly, though these jobs are also largely concentrated in the Twin Cities and Mankato. Screen
printing and “other commercial printing” encompass products like clothing, labels, printing on products
like water bottles and casino chips, etc.
It should be noted that Table 8 below uses 2008 data, which is the most recently available data for
breakouts by individual counties. Job numbers have changed since 2008, but the relative geographic
distribution of these companies has not changed substantially. It must also be noted that location
quotients for small areas, like counties, have wide variance and are extremely sensitive to small changes
in quantity. We conducted sensitivity testing on this data and determined that a location quotient
17
above 2 is suggestive of strong regional concentration, and there is not much meaningful difference
between 4 and a much higher location quotient. These regional location quotients should be
interpreted cautiously.
Table 8: Regional Location Quotients for Different Printing Specializations, 2008
Region EDR Code
Printing Lithographic
Printing Digital Printing
Other Commercial
Printing
Prepress Services
Jobs LQ Jobs LQ Jobs LQ Jobs LQ Jobs LQ
Northwest 1 77 0.48 27 0.44 0 0.00 9 0.69 0 0.00
Headwaters 2 72 0.56 59 1.19 0 0.00 0 0.00 0 0.00
Arrowhead 3 318 0.50 152 0.62 0 0.00 27 0.52 9 0.37
West Central 4
536 1.33 340 2.19 100 6.09 9 0.28 0 0.00
North Central 5
1,042 3.76 754 7.04 0 0.00 9 0.40 0 0.00
SW Central 6E 271 1.08 257 2.66 9 0.88 0 0.00 0 0.00
Upper MN Valley 6W
123 1.29 77 2.10 0 0.00 0 0.00 9 2.50
East Central 7E 418 2.01 350 4.36 9 1.06 18 1.07 0 0.00
Central 7W 3,033 3.89 1,989 6.61 18 0.57 18 0.29 9 0.31
Southwest 8 116 0.46 118 1.21 0 0.00 275 13.5 9 0.94
South Central 9
6,051 12.4 2,989 15.8 2,000 100.2 609 15.4 275 14.9
Southeast 10 1,956 1.65 1,535 3.36 68 1.41 68 0.71 9 0.20
Metro 11 17,319 2.10 10,134 3.19 1,238 3.68 329 0.49 1,108 3.56
Data Source: U.S. Census Bureau, 2008 County Business Patterns
Many people across the state have been laid off in the past ten years, producing a rapid loss of valuable
industry knowledge. In the Twin Cities, however, the printing industry benefits from the abundance of
large companies and Fortune 500 corporations. PIM notes that Target Corporation, for example, will
always need the printing industry for its advertisements, labels, packaging, etc. The printing industry
recognizes these large firms and corporations as a valuable customer, and many local firms adapt their
practices to meet the needs of local corporations.
However, the combination of technological evolution and industrial contraction has also lead to
generally leaner roles for many of the printers catering to these larger corporations. Technology has
made information sharing instantaneous which in turn has made printing firms more interchangeable.
This coupled with constrained budgets has forced printing clients to differentiate between printers
based more on efficiency measures such as speed and accuracy. Fred Thigpen of RR Donnelley can

18
recall when his printing job used to include meeting with publishers monthly and assisting with creative
solutions, but today this aspect of mass printing is being phased out.
In the context of relative competitiveness, it’s important to benchmark the local printing industry
against the national. According to the Printing Industry of America (PIA), printing has been in a state of
decline and consolidation for nearly two decades. Since 1993 the number of plants nationally has
declined from over 54,000 to under 34,000. With larger firms better set to weather tough times, the
lion’s share of firm closures have been from smaller firms. From 2000 to 2009, the largest total losses
came from firms with 9 or fewer employees (7,916 closures) while the largest relative decline came from
firms with 10-49 employees (35.9%) (PIA). This has in turn lead to mass consolidation industry-wide as
the average firm size based on the number of employees has leapt from 17 in 1993 to 27 in 2009 (PIA).
As a result of these consolidations, however, the industry as a whole has seen growth in productivity
from new equipment and processes. In general, PIA believes the industry will continue to contract in
the coming years, though the surviving firms will remain diverse in size with a majority family-owned.
The diversity of customers for the printing industry will maintain the high degree of niche specialization
evident within the industry (PIA).
Analysis of Publishing Publishing is commonly described as “creating and delivering a message.” This definition can blur the
lines a bit with the role advertising plays in the economy. The U.S. Department of Labor officially defines
publishing as the “distribution of information,” noting that publishers work with copyrighted material.
This distinction creates conceptual clarity, but it should be noted that there are some firms that do not
fall cleanly into either the publishing or advertising label.
Publishing has a broad impact on Minnesota’s statewide economy, though most publishing firms are
located in the Twin Cities, Duluth and Mankato. In 2009, there were 930 firms located in most counties
of the state and employing more than 23,000 people (BLS). Most of the publishers located in rural
counties are newspaper publishers employing fewer than 10 people, however. Publishing firms paid a
collective $1.5 billion in wages in 2009 (BLS). Average annual wages for a publisher varies widely
depending on the specialization, but the average salary in 2009 was about $65,000 (BLS). Other average
salaries:
Software publishers: $94,000
Book publishers: $71,000
Periodical publishers: $52,000
Newspaper publishers: $38,000
Each of these publishing specializations pays more than the average wage in Minnesota, with the
exception of newspaper publishing. Since newspaper publishing is the most broadly distributed in rural
counties, however, it is possible that newspapers pay a competitive local wage relative to the other
types of jobs available in rural counties. Like printing, publishing employment has declined 18% since

19
2001 (BLS). Most of the job losses are concentrated in newspapers (-21% with 4,400 jobs lost) and
periodicals (-53% and 1,900 jobs lost) (BLS).
Table 9 breaks down the regional specialization of publishing employment. As with the regional printing
location quotients, the regional breakouts for publishing express wide variance and high sensitivity to
small changes in quantities. Nonetheless, Table 9 gives a representative snapshot of regional
distribution of publishing activity in Minnesota. Newspapers represent the majority of jobs statewide,
with the distribution of newspapers largely following population density patterns. Periodical publishing
is mostly clustered in Duluth, Mankato and Twin Cities. Periodical publishers in MN tend to produce
extremely specialized magazines dedicated to niche interests, like powersports, boating and horse
training.1 The Minneapolis-St. Paul region claims the lion’s share of jobs in book publishing. National
brands like Lerner, Llewellyn and Cengage are headquartered in the Twin Cities, as well as smaller
nonprofit publishers like Milkweed and Graywolf Press. The region is also home to a few newer “DIY”
book publishers, like Beaver’s Pond Press, that help authors self-publish their work.
Table 9: Regional Specialization of Publishing Employment vs. National Employment per Industry, 2008
Region EDR All Publishing Book Publishing Newspaper Publishing
Periodical Publishing
Jobs LQ Jobs LQ Jobs LQ Jobs LQ
Northwest 1 205 0.86 0 0.00 117 1.34 68 1.79
Headwaters 2 260 1.37 0 0.00 159 2.27 18 0.59
Arrowhead 3 948 1.00 9 0.10 516 1.48 284 1.87
West Central 4
251 0.42 9 0.17 217 0.99 59 0.62
North Central 5
334 0.81 9 0.24 293 1.93 18 0.27
SW Central 6E 236 0.64 0 0.00 152 1.11 50 0.84
Upper MN Valley 6W
60 0.43 0 0.00 60 1.16 0 0.00
East Central 7E 127 0.41 0 0.00 118 1.04 18 0.36
Central 7W 611 0.53 50 0.48 503 1.18 27 0.15
Southwest 8 444 1.19 0 0.00 401 2.91 18 0.30
South Central 9
1,203 1.66 259 3.94 515 1.93 77 0.66
Southeast 10 1,297 0.74 68 0.43 841 1.30 186 0.66
Metro 11 23,648 1.94 7,923 7.17 3,243 0.72 1,320 0.68
Data Source: U.S. Census
1 See, for example, the membership directory of the MN Magazine and Publishers Association:
http://www.mmpa.net/directory.html

20
The publishing industry in Minnesota is largely broken into three specializations, each operating
independently from the others: books, newspapers and periodicals. Software publishers also have a
presence in the state, though to a lesser degree. Additionally, within each sub-field, publishers are
highly specialized within distinct niches (Schiffman). As a result, publishers find they have more in
common with their vendors and customers than with fellow publishers. Unlike printing, which is unified
under a single strong industry organization (PIM), the publishing industry in Minnesota has developed
multiple industry organizations, including three separate organizations for book publishers. Periodical
publishers are mainly unified through the MN Magazine and Publishing Association, while the MN
Newspaper Association is the main newspaper publishing organization.
Publishing has been impacted by new technologies, but not to the severe degree witnessed in printing.
There has been a 10% contraction in the number of publishing firms in MN since 2001, compared to a
contraction rate of 14% in printing (BLS). Most of the publishers that went out of business were
newspaper and software publishers (BLS). The new technologies causing the most disruption in
publishing are e-readers and various social media applications. Many publishers are embracing the new
technologies, however, and rushing to adapt their content delivery modes. Mary Hennessy, with the
Industrial Fabrics Association International (IFAI) described their transition into digital products, and she
noted that the use of digital applications, such as PDFs, offers IFAI the potential for greater profitability
due to quicker turnaround times. Looking ahead, Hennessy notes that social media technologies should
not to be ignored and is likely the key to the future of the industry.
Publishing firms seem to be embracing the winds of change and continue to look ahead to the future to
see how they will fit in. Innovation tends to be driven by introduction of new devices (iPad, Kindle,
Nook, etc) or by updates to a key software program, like Adobe (Wallek, Schiffman). However, the
publishing industry in Minnesota is typified by a variety of niche firms, from children’s books to online
higher education publications. Competition within these niches appears to be less fierce than what is
experienced by companies seeking to meet a broader readership market. Kevin Coghlan, President of
The Coghlan Group, notes that his firm specializes in the marketing and production of local higher
education publications, a niche that few other periodical publishers pursue. Mary Hennessy, Vice
President of Communications for the Industrial Fabrics Association International (IFAI) also describes a
niche in the business-to-business publications produced for their members. Because of the lack of direct
competition, IFAI demonstrates a willingness to collaborate with other firms within the publishing
industry.
Analysis of Advertising
Like the printing and publishing industry sectors, the advertising industry has changed significantly in
recent years. Since we incorporated advertising into the study fairly late in the game, we have less
analysis pertaining to this industry. Like publishing, the advertising industry is difficult to pin down and
fit neatly into a box. The U.S. Department of Labor defines advertising as “creating an advertising
campaign.” (NAICS). For the purposes of this report, we will use the definition of “messaging intended
21
to sell something.” Advertising firms are diverse and broadly work to satisfy the needs of their clients.
This means that advertising work tends to be both digital and print, depending on the audience that is
targeted for the product promotion. Advertising agencies provide a range of services to their clients,
including: “advice, creative services, account management, production of advertising material, media
planning, and buying (i.e., placing advertising) (NAICS).”
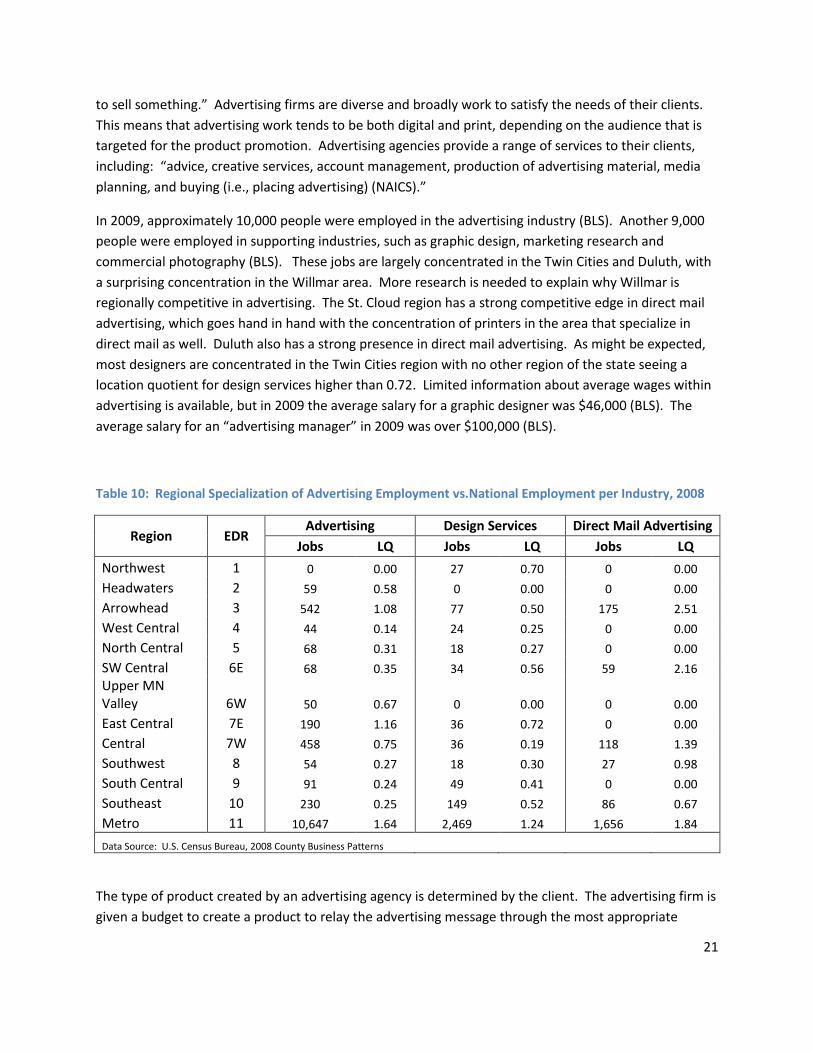
In 2009, approximately 10,000 people were employed in the advertising industry (BLS). Another 9,000
people were employed in supporting industries, such as graphic design, marketing research and
commercial photography (BLS). These jobs are largely concentrated in the Twin Cities and Duluth, with
a surprising concentration in the Willmar area. More research is needed to explain why Willmar is
regionally competitive in advertising. The St. Cloud region has a strong competitive edge in direct mail
advertising, which goes hand in hand with the concentration of printers in the area that specialize in
direct mail as well. Duluth also has a strong presence in direct mail advertising. As might be expected,
most designers are concentrated in the Twin Cities region with no other region of the state seeing a
location quotient for design services higher than 0.72. Limited information about average wages within
advertising is available, but in 2009 the average salary for a graphic designer was $46,000 (BLS). The
average salary for an “advertising manager” in 2009 was over $100,000 (BLS).
Table 10: Regional Specialization of Advertising Employment vs.National Employment per Industry, 2008
Region EDR Advertising Design Services Direct Mail Advertising
Jobs LQ Jobs LQ Jobs LQ
Northwest 1 0 0.00 27 0.70 0 0.00
Headwaters 2 59 0.58 0 0.00 0 0.00
Arrowhead 3 542 1.08 77 0.50 175 2.51
West Central 4 44 0.14 24 0.25 0 0.00
North Central 5 68 0.31 18 0.27 0 0.00
SW Central 6E 68 0.35 34 0.56 59 2.16
Upper MN Valley 6W 50 0.67 0 0.00 0 0.00
East Central 7E 190 1.16 36 0.72 0 0.00
Central 7W 458 0.75 36 0.19 118 1.39
Southwest 8 54 0.27 18 0.30 27 0.98
South Central 9 91 0.24 49 0.41 0 0.00
Southeast 10 230 0.25 149 0.52 86 0.67
Metro 11 10,647 1.64 2,469 1.24 1,656 1.84
Data Source: U.S. Census Bureau, 2008 County Business Patterns
The type of product created by an advertising agency is determined by the client. The advertising firm is
given a budget to create a product to relay the advertising message through the most appropriate

22
medium that will allow the advertisement to reach its targeted audience (Olson, Yantes). There has been
a shift over the years in the types of advertising products being produced due to the social networking
and technological shifts over time. Entire positions have been eliminated over time due to the improved
technology and software, decreasing the need for an actual human to complete a task (Walker).
Advertising firms face different challenges related to new technologies than printers and publishers do.
For some businesses, the increased use of technologies like GoogleMaps and consumer-level GPS
systems draw viewers away from traditional advertising venues. Multiple advertising interview sources
see a continued need for printed products, however, particularly for the tourism and hospitality sectors.
Hedberg Maps specializes in creating customized promotional maps for events like Holidazzle, industry
conventions, and key destination corridors like the Midtown Greenway (Jordan). Companies see value
in Hedberg’s products because a customized printed map allows companies the opportunity to put their
branding front and center. Given the fickle nature of technology trends, the challenge for the
advertising industry lies in anticipating which technology trends are fads and which trends will become
permanent features of the new advertising landscape. Some advertising sources remembered the
“multi-media” fad of the 1990s when providing promotional CDs and DVDs was projected to remake the
industry. Those efforts did not have nearly the impact with consumers that advertisers hoped.
Underlying Economic Activity within the Cluster The connections within the cluster remained obtuse until we considered the basic economic activity
underlying printing, publishing and advertising. Each industry responds to this chain of activity. There is
an idea that goes through a design phase and then distributed by an entity in a specific product form.
When considering the roles that publishing and advertising play in the economy, this basic chain of
activity takes on different characteristics. Figure 2 below identifies some of the interconnected
processes involved in the value chain for printing, publishing and advertising. Interview sources
identified three economic drivers that stimulate activity in the PPA cluster: the knowledge creation
sector, as in research generated by the University system; the arts and creative sector, as in the
Minneapolis College of Art and Design (MCAD); and general business needs, as in demand for products
that fluctuates with the standard business cycle. The top chain of activity relates mostly to publishing,
while the bottom row relates mostly to advertising. At the top, an idea is developed by an author or
IDEA DESIGN PHASEDISTRIBUTION
AGENTPRODUCT
FORM

23
journalist, which then goes through an editing phase, and is then distributed in print or online by a
publisher. A similar process happens with advertising. A product generates need for an advertisement
or packaging, which goes through a graphic design phase and is distributed through various print and
online platforms. In reality, this process is much more complicated, but this concept map helps
elucidate some of the basic activities involved in this cluster.
Figure 2: Value Chain for Printing, Publishing and Advertising. Source: Author created using information from interview sources.
We showed the above value chain map to a group of graphic designers, and they respectfully disagreed
(Tolsma, Westerlund). They felt that a value chain filled with boxes and arrows wrongly gives equal
weight to all aspects of the production chain. In reality, they argued, the market success of these
products ultimately rests on the strength of the idea. Does that idea have a compelling design? Is it
produced in a quality and affordable way? Only then, they argued, should the distribution method be
worried about. According to the graphic designers we interviewed, the printing industry is primarily
concerned with the production and distribution of products in a physical form, while the advertising and
publishing industries are concerned with the design and production phases. To help illustrate their
argument, the designers crafted a “value pyramid,” included below in Figure 3 (Tolsma, Westerlund).

24
Figure 3: Value Pyramid Proposed by Graphic Designers for Printing, Publishing and Advertising Cluster
We then shared this value pyramid with a group of printers, who respectfully disagreed with the graphic
designers (PIM). Printers often have to adjust designs because they are not aligned with production
standards. The printers argued that consideration should first be given to the production process, and
only then should the design be finalized. Figure 4 below illustrates the value chain proposed by printers.
Figure 4: Value Pyramid Proposed by Printers
The purpose of this report is not to declare a winner or loser in this friendly debate, but the
disagreement between printers and graphic designers perhaps highlights an opportunity for
collaboration within the industry. If the local companies involved in this cluster found a way to
Distribution
Design Execution
Production Process
Idea

25
strengthen the institutional linkages between designers and printers, our region could create a
competitive advantage that perhaps does not exist in other locations. The printers, publishers and
advertisers interviewed for this study identified time as a crucial element for competitive success.
Nationally, companies are competing on turn-around time. Eliminating the need for printers to
reconfigure design could help speed up the production process, helping our local cluster distinguish
itself from other regions.
The intersection of these three industries highlights an unusual inter-dependency between the creative
sector and manufacturing. Without a comprehensive evaluation of these industries together, policy
makers may not recognize the state’s mutual reliance on fine and industrial arts.
Analysis of Diamond of Advantage
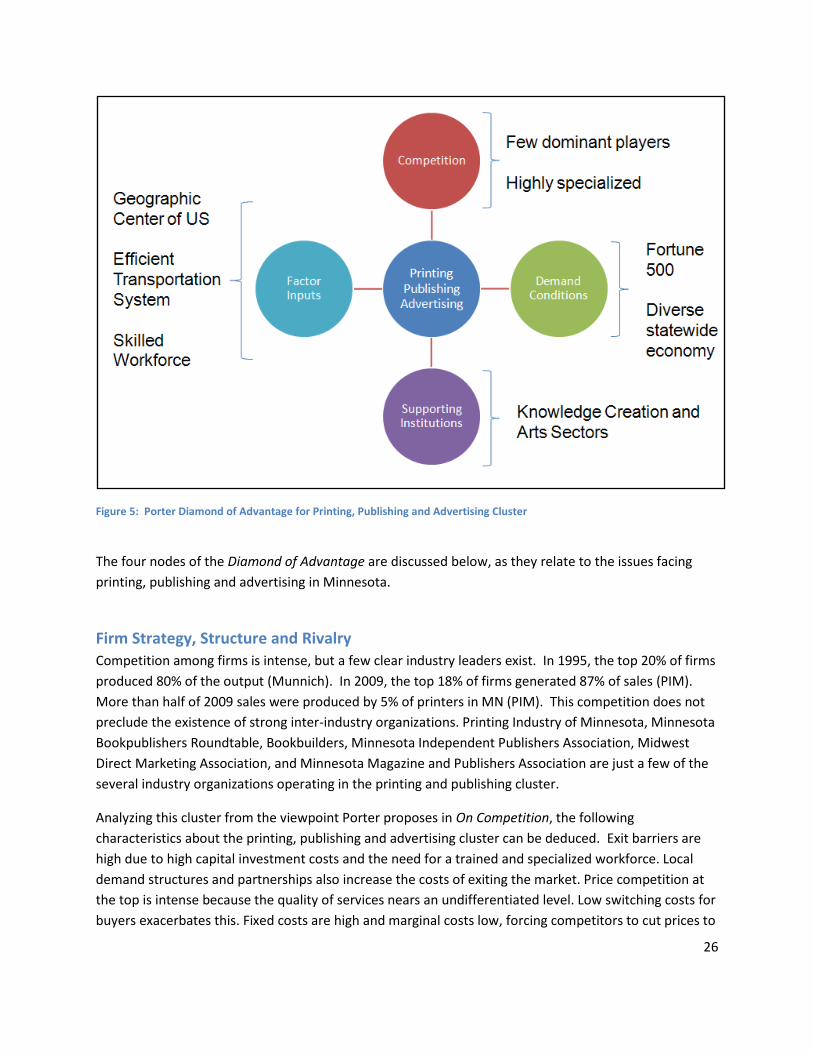
Using the Porter Diamond, an assessment tool for cluster analysis to evaluate the interplay among four
“broad attributes” that Porter argues are key determinants of competitive advantage (Porter: 227).
1. Factor Inputs: factor (input) quantity, costs, quality and specialization – natural resources,
human resources, capital resources, physical infrastructure, administrative infrastructure,
information infrastructure, scientific and technological infrastructure.
2. Competition: a local context that encourages appropriate forms of investment and
sustained upgrading. Also includes competition among locally-based rivals.
3. Demand Conditions: sophisticated and demanding local customers who have needs that
anticipate those elsewhere. Could also include unusual local demand in specialized
segments that can be served globally.
4. Supporting Institutions: presence of capable, locally-based suppliers, as well as the presence
of competitive related industries.
A notable feature of the Diamond of Advantage is that it focuses on the characteristics of the business
environment. The role of government is deemphasized, but evident on the margins. The schematics of
the Diamond serve to emphasize that many of the issues related to competitive advantage are best
solved by the private sector, yet government has an important role to play in promoting policies that
support broad needs, such as workforce and infrastructure development.
26
Figure 5: Porter Diamond of Advantage for Printing, Publishing and Advertising Cluster
The four nodes of the Diamond of Advantage are discussed below, as they relate to the issues facing
printing, publishing and advertising in Minnesota.
Firm Strategy, Structure and Rivalry
Competition among firms is intense, but a few clear industry leaders exist. In 1995, the top 20% of firms
produced 80% of the output (Munnich). In 2009, the top 18% of firms generated 87% of sales (PIM).
More than half of 2009 sales were produced by 5% of printers in MN (PIM). This competition does not
preclude the existence of strong inter-industry organizations. Printing Industry of Minnesota, Minnesota
Bookpublishers Roundtable, Bookbuilders, Minnesota Independent Publishers Association, Midwest
Direct Marketing Association, and Minnesota Magazine and Publishers Association are just a few of the
several industry organizations operating in the printing and publishing cluster.
Analyzing this cluster from the viewpoint Porter proposes in On Competition, the following
characteristics about the printing, publishing and advertising cluster can be deduced. Exit barriers are
high due to high capital investment costs and the need for a trained and specialized workforce. Local
demand structures and partnerships also increase the costs of exiting the market. Price competition at
the top is intense because the quality of services nears an undifferentiated level. Low switching costs for
buyers exacerbates this. Fixed costs are high and marginal costs low, forcing competitors to cut prices to

27
steal incremental customers. Larger firms exhibit economies of scale and require new entrants to enter
the industry on a large scale, which is complicated by the capital requirements of the industry. Supply-
side economies of scale can exist anywhere in the value chain: the most vital value chain links in Printing
and Publishing are transportation and logistics, telecommunications and IT, and manufacturing facilities
(Munnich). According to Porter, supply side economies of scale greatly reduce the threat of new
entrants.
Factor (Input) Conditions
Favorable factor conditions for the Printing and Publishing cluster are due in large part to geographic
location, strong infrastructure, natural resource endowments, and human capital. Minnesota is very
near to the center of the North American continent, linked to the east, west, and gulf coasts by major
interstate highways and rail lines. The Twin Cities also have exceptional telecommunications
infrastructure, which has created a very favorable environment for several of Printing’s biggest
customers, including the computer software industry and the advertising and design industry (Hackler).
The Printing and Publishing cluster benefits greatly from Minnesota’s extensive natural resources and
from its legacy industries. Minneapolis was at one time a premier mill-city and its acquisition of capital
and industrial investment lead to diversification in manufacturing and production. Access to timber, iron
ore, and water prompted expansion into metalworking and production technology (Munnich).
Having a skilled and highly educated workforce is typically seen as an advantage to the printing and
publishing cluster, but this disproportionately benefits publishing. The printing industry depends on a
stream of skilled factory and shop floor workers, usually in positions that require 2-year technical
degrees. The number of degree programs has been shrinking in recent years due to a lack of student
interest and the high costs associated with acquiring up-to-date training equipment. Hennepin Technical
College has the largest program in the MNSCU system, but staff with the program admits that it does
not train enough students to fulfill even local employer demand.
Demand Conditions
Minnesota has considerable regional markets for printing and publishing services. Several of Printing
and Publishing’s biggest customers have a heavy presence in the Twin Cities region: ad agencies, graphic
design firms, IT software, and machine and metalworking to name a few (Munnich). The Twin Cities are
one of a select few national hubs for direct mail advertising and magazine distribution, both of which
benefit from Minnesota’s central location (Bijnagte, Hennessey). Network effects exist across industries
for the services provided by Thomson Reuters, which is both a major publisher and provider of legal
services. Major local purchasers include: accounting and financials, universities, machinery and
metalworking, corporate headquarters, hospitality businesses, advertising and graphic design firms,
telecommunications and the IT industry (Munnich). The Twin Cities has one of the 10 highest

28
concentrations of advertising agencies in the nation, and local demand is anchored by a diverse base of
customers, but the printing and publishing cluster still manages to sell 50% of total sales outside of the
Twin Cities (Munnich).
The existence of several printing and publishing rivals creates cost savings opportunities for buyers.
Several large-volume buyers exist in the local market, and printing and publishing has high-fixed costs
(Munnich). High costs and low marginal costs amplify the pressure on rivals to keep capacity filled
through discounting (Munnich). High levels of competition over time have created a sector that has
consistently high quality. This means that the industry’s products are at least somewhat standardized. If
buyers believe they can find equivalent products across providers they can play rivals against one
another (Munnich). Buyers also most likely do not face high switching costs, and so prices are held down
(Munnich).
Related and Supporting Industries
Printing and Publishing take advantage of several strong supporting industries and institutions.
Minneapolis is a central transportation hub for the region, and so logistics and transportation industries
are very strong (Munnich). Printing especially depends on these companies, and Minneapolis’ position
as a national hub for direct mail and magazine distribution is evidence of the strength of these
companies. Direct inputs like timber and paper are also strong industries in Minnesota, both of which
benefit from the state’s plentiful natural resources and historical economy (Munnich). The existence of
several large law firms and financial firms has also lead to horizontal diversification: Thomson Reuters
purchased WESTLAS in the 1990s, and has established that division as both a legal publisher and as a
legal services provider (Munnich). Along with major finance companies comes availability and access to
financing opportunities (Munnich). Because of the capital intensive nature of printing, local companies
benefit from the existence of multiple potential funding sources (Munnich).
Minnesota also has the second highest recycling rate in the nation, and the recycling industry employs
over 20,000 people (MPCA).2 Linkages between timber harvesting, paper production, printing, and
recycling, all lead to greater efficiency and mitigate possible negative environmental externalities of the
printing and publishing industry (Munnich). Suppliers of other production inputs are found throughout
the state. Specialty ink and paper companies have strong ties to the printing industry, and a few have
members on the board of PIMN.
2 MN Pollution Control Agency. Retrieved from: http://www.pca.state.mn.us/index.php/living-green/living-green-
citizen/reduce-reuse-recycle/recycling-more-ways.html

29
SWOT Analysis A common way to summarize the business environment of a firm, or in this case the printing and
publishing cluster, is to utilize a SWOT (strengths, weaknesses, opportunities, and threats) analysis
approach. For this analysis strengths and weaknesses are defined as the internal characteristics that
place the firm, relative to others, at an advantage or disadvantage, respectively. Opportunities and
threats are then the external factors. Opportunities are chances to grow or become more profitable
within the environment while threats are potential obstacles to success. The SWOT tool can be
beneficial for decision makers within a cluster as it presents the current environment in a manner
conducive to identifying areas for improvement and advantages to build upon.
Strengths:
To reiterate from above, Minnesota’s printing and publishing cluster has a number of local advantages
that help maintain its national competitiveness. Minnesota’s emphasis on the value of education has
created a reputation for productivity that draws companies to the region, which is not unique to the
printing industry. Our interview subjects commented repeatedly that despite the challenges facing the
printing industry, the strong work ethic of employees has helped keep local companies afloat.
The natural endowments of lumber in the area coupled with very efficient paper producing firms afford
local printers easy access to a key input. Having this resource locally available provides Minnesota
printers with the ability to make last minute changes to paper orders which can be….
Minnesota’s central location and well developed infrastructure provide an additional edge to local
manufacturers. Despite rush-hour congestion, our extensive network of highways is cited as one of the
prime reasons the local printing industry is more efficient than places like New York City or Los Angeles,
where nearly constant gridlock prevents easy movement of inputs through the production process
(Radzeij). When time is of the essence, being able to print and deliver material to a mail house within
the same day gives Minnesota printers a competitive advantage. The central location has also been
historically beneficial for timely shipping to customers on both coasts. For this reason Minnesota has
developed a niche specialization in direct mail advertising because national corporations are able to
time the delivery of direct mail promotions so that they arrive on both coasts on the same day. The
promotions are designed and printed here in Minnesota, then delivered to households across the
country. Minnesota has also developed a specialization in magazine publishing and printing for similar
reasons.
The local industries have also differentiated themselves from others nationally both with their more
holistic approaches and specialized customer bases. In general, Minnesota printers and publishers have
both claimed to take on more responsibilities and a larger role in total production to differentiate
themselves from the competition. Many of the publishers have also found more specific niches and
which may be isolating from much of the competition.

30
Weaknesses:
Although Minnesota’s printing and publishing cluster has many tangible advantages, in some ways these
differentiating characteristics have also put the cluster at a disadvantage. For example, the central
location and ability to serve large demand on both coasts has always been an advantage, but our
location makes it tougher to attract talent to the area from other areas with strong printing and
publishing labor supplies such as New York or Los Angeles. This inability to bring in qualified workers
would not be such a big issue if as a state Minnesota was training its own labor force to fill these
positions, but unfortunately there are areas in which it comes up short.
At a time when the strong education system is cited as one of the prime reasons for our regional
competitive edge, its limited specialization in printing and publishing also poses problems for the
cluster. Within Minnesota there in an absence of publishing degrees, so many firms are content with
Journalism and English majors to fill roles. However, others admit that finding workers prolific in writing,
design, and newer technologies can be difficult with recent graduates and they are forced to contract
out to freelance workers more familiar with cutting edge technologies from places like New York.
For printing, only three public higher education institutions in Minnesota provide training on using the
printing press and other shop floor equipment (Mesabi, Mankato and Anoka-Hennepin technical
colleges). Budget shortfalls in the MNSCU system has led to a redirection of course offerings towards
computer-based skills for desk-top publishing rather than skills associated with printing equipment, such
as robotics programming. Rumors abound that Mankato is considering closing the doors on its printing
program, despite the large philanthropic support over the years from printers like Glen Taylor (Kenney-
Fine). Public technical colleges have not had the resources in recent years to invest in new capital
equipment. Dunwoody Institute, a private technical education school, has helped fill the gap to some
extent.
A related concern expressed by the printing industry is the lack of emphasis on printing as a vocation in
the K-12 education system in Minnesota. Davis notes that there may be only two high schools in the
state that are actively introducing students to careers in print. This trend follows a shift away from
vocational training in general, as the state has placed greater emphasis on preparing students to attend
a 4-year college (Kenney-Fine).
Further, there lacks a culture of collaboration and unity within publishing that printing has established
with the help of PIM. The increased specialization into more granular niches by publishers in the state
have helped isolate firms from broad competition, but it’s also made it increasingly difficult for
publishers to identify one another and track the state of the industry as a whole. Within the metro area
alone there exist at least three separate organizations for publishers within book publishing. Making
things even tougher is the perception many industry workers had that different forms of publishing –
such as magazine, book, etc. – are too different from one another to make collaboration across these
forms as not being worthwhile. This segregation within the industry limits the influence it may have on
promoting favorable policies and industry-wide knowledge spillovers.

31
Opportunities:
It’s no secret the printing and publishing industries are in periods of transition. For printers, the main
focus today tends to be on increasing efficiency through avenues such as customer customization in
commercial printing or co-mailing practices to save on postage costs. By partnering with equipment
manufacturers, printers have been able to drive innovation towards what is most important to their
clients. The recently developed ProteusJet printing system used by RR Donnelley is one example of
industry-motivated innovation capable of the high levels of personalization and speed being demanded
for printers to maintain efficiency advantages.
In addition to being an affluent area, Minnesota also has a very strong relationship with local arts and
the creative community. Thriving creative and knowledge creation clusters are economic drivers for the
printing and publishing industries. Collaborating with these other industries can provide an opportunity
to grow local demand for the printing and publishing services. For example, self-publishing is becoming
increasingly more established as printers such as Beaver Pond Press have begun to work one on one
with local writers to get their works published and as a result develop more printing work.
Although technological innovation has provided challenges to the printing and publishing industries
within the cluster, the presence of social media has been acknowledged by several industry workers as
having incredible potential. The full impacts social media will play are still up in the air, but printers have
foreseen opportunities to gain more information on individuals to facilitate more personalization in
mass advertising.
Also, as digital forms of periodicals and books becoming cheaper and more accessible, the remaining
demand for books has been shifting to higher quality products and more gift-like books. Some trends
observed by publisher are the use of more tactile covers for decoration or including pop-out sections.
Through these special touches, physical print can still differentiate itself from online forms of
information dissemination. Minnesota’s creative endowment Minnesota may again be useful as some
printing companies begin utilizing more creative methods such as scented inks and 3-D textures.
Threats:
The biggest threat to the printing and publishing today is definitely the increased role of technology.
With the introduction of technologies like the iPad, Kindle, and smart phones, great demand is shifting
to digital content, but consumers expect to pay less for digital version than for printed material. This
not only shifts large business towards lower revenue-generating products, but stretches firms’ resources
thin by having to redesign the same material for different mediums while also trying to keep up with
rapid technological changes.
Although it may seem counterintuitive in a time of contraction, printing in Minnesota is at risk of lacking
the skilled labor to fill necessary vacancies within the industries on the horizon. Although current
printing programs are well below capacity and still unable to completely place classes into limited

32
vacancies after graduation, printers within the state feel like this is only a temporary state. With the
significantly older workforce currently within printing, there is unavoidably going to be large industry
turnover within the next decade. Also, as the economy continues to grow out of the recent recession,
printing is expecting sizeable rebound with the reemergence of advertising and manufacturing.
Unfortunately as the printing industry is weathering the storm MnSCU and the state have been forced to
cut back on capital contributions and resources used to train new generations of print operators. If there
lacks the labor, and in turn the capacity, to fill the vacancies that will inevitably be present in the
industry’s near future, then the state will be at risk of losing a manufacturing industry not only beneficial
for its economic contributions to the area, but also the benefits its local convenience provided to all
other manufacturers in Minnesota which utilize printing services.
Emerging Trends in Printing, Publishing and Advertising Each of these industries is undergoing tremendous change. It is never wise to attempt to predict the
future, but a few emerging trends are worth featuring. These emerging trends offer opportunities for
printing, publishing and advertising to collaborate within the cluster to create a stronger regional
competitive advantage.
Increased Interactivity: One fascinating idea proposed by Steve Deger, of Fairview Press: “in the
future, being a publisher will mean thinking like a game developer.” He was referring to the
intricate ways in which print and digital content are being tied together. “Thinking like a game
developer” suggests increased levels of interaction between content platforms, but also a
reimagining of what a book is.
Richer Physical Materials: The MN Center for Book Arts has also been a leader in refashioning
the traditional meaning of books, and the Center supports a growing cadre of artisans who
produce hand-crafted fine art books that push the boundaries of what a book is. Do books need
to be rectangular with pages that turn individually? Books created by artists at the Center for
Book Arts might be better described as sculptural. These creations point towards a future
where printed books increasingly become more lavish and tactile. This trend is also expressed
as limited edition hardcover books featuring special artwork or paper types. Several book
publishers in Minnesota have picked up on this trend and are selectively pursuing it as a
strategy.
Increased Cross-Media Marketing: Several advertisers and printers spoke about the growing use
of personalized URLs. New technologies allow for greater cross-media marketing campaigns
that hold the potential for greater ROI for customers. One advertiser told us that one well
placed direct mail piece, carrying a personalized URL, means more than an entire online
advertising campaign that depends on random click-throughs.

33
Increased Personalization: Jostens announced a new pilot program this fall that will allow high
school students to create personalized pages for their yearbooks (Ziegler). The pilot will be
offered in 40 Minnesota high schools this year, and about 1,000 schools nationally. The
program allows students to upload their own pictures and content, and these extra pages will
then be bound into their own copy of the yearbook. (www.yearbookyourself.com)
Segmentation of Social Media Venues: Although Facebook reigns supreme for the current
moment, many predict it will not stay that way (Suster). One new imaginative, publisher-driven
social media venue is called Figment (www.figment.com). It is being billed as a “literary
Facebook” (Bosman). Although the website is just now being officially unveiled, over the past
year Figment has built a national network of schools that are willing to promote the website to
their students. A New York Times review of the new product noted that teenaged beta testers
have shown enthusiasm in using the venue to publish their own writings and engage with other
readers about books they enjoyed. The value to publishers was also made clear:
“Teenagers and their reading habits have been the subject of much fascination in the
publishing industry lately. They were a huge driving force behind best-selling books like
the “Twilight” series by Stephenie Meyer and the crop of paranormal-romance books
that followed. Publishers are eager to learn more about their reading habits and
introduce books to them” (Bosman). (emphasis added by author)
Geographic-based Advertising for Smart Phones. The technology is not perfected yet, but
multiple sources speculated that within the next two years we will see rollouts of phone apps
that will deliver coupons and other promotions to phones as people pass by stores, or even as
people pass by specific products. Technology blogs have picked up on this idea as well. Two
companies being promoted by TechCrunch are SimpleGeo (www.simplegeo.com) and PlaceIQ
(www.placeiq.com) (Suster). This concept could pose a threat to printers, but not necessarily.
Several interview sources spoke about the power of advertising campaigns that pair online and
print delivery methods. Taking advantage of this opportunity, however, will likely only possible
for printers who offer prepress services. (TechCrunch is a technology-themed “media property”
dedicated to profiling new startups and internet trends.)
Groupon: Not all social media venues are created equal. Groupon is a company that offers daily
coupons to specific cities. The catch is that the coupons are only available if a certain number
of people commit to buying the coupon within a specified time frame, hence the “group” in
Groupon. The company has exploded in popularity in the past two years. In 2008, the company
had 400,000 email subscribers. Now, they have closer to 40 million subscribers (Carlson). As
the company grows, it is branching into new product lines. In December 2010, Groupon carried
a promotion for Minnesota Monthly, the first time the authors of this report recall seeing a
magazine being promoted through Groupon. Given the national scope of periodical publishers

34
in MN, perhaps there are opportunities to utilize social media markets to promote local
publications in other markets?
Conclusion In the 15 years since the original University of MN cluster study, printing and publishing firms in MN
have confronted new challenges and identified new opportunities. The pace of technological change
has quickened, challenging the ability of printers and educational institutions to stay current on
equipment models. The availability of free content on the Internet has eroded profit margins for
printing and publishing firms alike. Consolidation trends in the industry threaten the survival of local
firms, many of which are independent family-owned businesses. At the same time, online commerce
has allowed local companies to identify new customers across the globe. Adaptation to new
technologies has expanded customer prospects as local firms have entered new fields like creative pre-
press and fulfillment services. As firms in the printing-publishing-advertising cluster prepare for future
trends, the following recommendations may be considered.
Recommendations to Increase Competitiveness:
Organizing as a Cluster:
Although it’s difficult to say definitively if Minnesota publishers should be organized under the
umbrella of a single organization, clear advantages to collaboration emerged from our
interviews. The process of organizing the publishing industry as a cohesive unit will require
initiative and input from the firms themselves, but before firms are willing to invest the time and
resources into collaboration there needs to be motivation for doing so. Uncertainty about the
future health of publishing in Minnesota which can only be resolved with full industry
collaboration. A professional organization can afford to hire staff to research some of the
questions that were raised during interviews: what are the competitive wage rates for designers
who handle e-reader content? How can smaller firms in rural Minnesota be identified and
incorporated? The unity of such an organization is also advantageous in leveraging the industry’s
size for lobbying influential policies. Publishing firms together account for 1% of the state’s
employment and more than 1% of wages paid.
Strengthen institutional linkages between designers and printers in order to reduce delays
caused by reworking designs to fit production capabilities. The publishers and advertisers
interviewed for this study identified time as a crucial element in their industries. Nationally,
companies are competing on turn-around time. Eliminating the need for printers to reconfigure
design could help speed up the production process, helping our local cluster distinguish itself
from other regions.

35
Both printers and publishers have expressed interest in expanding their reaches to strengthen
the industry. Publishers wish to reach out beyond the metro area and expand into rural areas. In
an effort to spark interest in the industry early, PIM wants to promote printing curriculum in
high schools within the state. In both instances it may be most natural and effective to focus
efforts where concentration is already high. For publishing this would include the rural area in
Mankato and Winona, and for printing the high schools in southwest Minnesota and the metro
area would be ideal places to start.
This cluster could perhaps be envisioned as two separate clusters. Book publishing as one
cluster with advertising, printing and the rest of publishing in another cluster. Printers in
Minnesota are more closely aligned with the needs of periodical publishers and advertisers
(through packaging, product promotions and direct mail) than with book publishers.
Collaborations with Related Industries or Institutions:
One specific area the cluster can tap into the strong relationship the state has with its creative
community is through the Minnesota Arts and Culture Heritage Fund. The state’s Legacy
Amendment allocates a set portion of these funds to go directly to state arts and arts
education. Currently part of the funding is being used by libraries to hold events promoting
reading. There can be an opportunity here for the publishing industry – assuming they can
come together – to collaborate with these libraries and expand their scope of these funds
beyond just the consumption of literature, and into its creation with events supporting local
writers, illustrators and other themes related to book publishing.
There is a real need for loan programs tailored to businesses with fewer than 4 employees – a
Minnesota version of micro-lending perhaps? If these programs already exist, more could be
done to promote awareness. Could DEED partner with the Secretary of State, where many
businesses have to file yearly paperwork, to promote information on economic development
tools?
We were told that a lot of printing innovations are driven by technological improvements from
the equipment manufacturers. Is there a venue where printers, equipment manufacturers and
“customers” can all collaborate on customer needs? If the big corporations in MN are driving
direct mail activity, is there a venue for collaboration there? This is inspired by an article in the
Sept. 2010 PIA Magazine, “A Business Examined Is Full of Opportunities,” where the author
recommends that printers think carefully about the needs of the customers that provide 80% of
revenue (PIA Magazine: 27).

36
Education and Workforce Development:
The MnSCU and Dunwoody programs for equipment training are generally well-regarded by
printers, but the industry is facing a challenge in their efforts to develop a pipeline of future
workers. Industry professionals have expressed belief that with the aging workforce and the
eventual economic upturn, there will be significant future job vacancies in printing. However,
without education and training to encourage younger generations to pursue this profession, it is
uncertain whether Minnesota will be able to maintain its competitive edge. PIM is currently
working to promote the printing industry to high schools. How could the state be a better
partner in this effort?
Interview sources from all three industries commented on the need for both creative education
and technical training. Graphic designers, surprisingly, see a role for “mechanical arts” because
it appeals to some people’s desires to work with their hands, solve problems, and see a finished
product. The design entrepreneurs we spoke with suggested they would be unsuccessful
without training in both the fine arts and the industrial arts. With the stronger focus on math
and science curriculum at the high school level, is the state unwittingly undercutting the
economic basis for three historic industries? Interview sources warned that the state should not
take these jobs for granted. The pipeline of future workers is a strong concern within each
industry.
Due to the nature of the value chain, the main drivers of innovation and economic value in the
Printing, Publishing, and Advertising cluster are creative individuals and enterprises. Therefore,
the state of Minnesota should increase funding for the arts in all levels of public education.
Developing artistic talent from an early age could lead to greater innovation and growth in not
only the printing, publishing, and advertising cluster, but in many associated clusters as well.
A principal issue in securing more funding for classes and the necessary equipment to teach
shop floor classes is the lack of full-enrollment in shop floor courses and programs. Hennepin
Tech does an admirable job making its case to students that shop floor printing careers are in
demand and offer living wages at minimal educational cost. However, Hennepin Tech still
struggles to fill more than 60% of its open seats. We propose a partnership between PIMN and
MNSCU for a joint marketing campaign to increase class enrollment. Internship offerings
internally could help sway students, as well as publications for on-campus distribution
explaining the value of a shop floor education. On-campus presence from industry
representatives is another marketing tool that could bolster enrollment. PIMN and other
industry members must ultimately decide how to go about making themselves attractive
destinations for future workers, but the crucial first step should be marketing themselves jointly
with MNSCU as they both share a need for increased enrollment in crucial shop floor classes.

37
Capital equipment funding for classrooms is another issue where cooperation between MNSCU
and PIMN or other industry leaders could benefit the cluster overall. Identifying what kinds of
equipment should be purchased for classes by MNSCU, and which should be on-the-job training
kinds of equipment could both reduce the costs of maintaining up to date classrooms for
MNSCU, and provide an opportunity for internship training within the industry. A common
complaint amongst industry executives is the lack of preparation of recent graduates of
technical programs. We recommend that MNSCU take on the costs of classroom capital that has
a longer shelf-life and focus on courses utilizing that equipment. Software and equipment with a
quick turnover rate should be the focus of internships or on-the-job training, which MNSCU
could possibly fund at a lower rate of investment than required to obtain the equipment on its
own.

38
Special Thanks and Acknowledgements:
Tamara Arnott, Patricia Barnum, Brenda Bijnagte, Kevin Coghlan, Kris Davis, Steve Deger, Lola Faufau,
Kerry Kenney-Fine, Mary Hennessey, Mark Jessen, Dorothy Jordan, Amy Mars, Tricia King Meredith,
Kaitlin Olson, David Radziej, Rep. Tom Rukavina, Steve Schiffman, Ashley Stibal, Fred Thigpen, Todd
Thyberg, Adam Tolsma, Dan Wallek, John Walker, Tim Welle, Heather Parker Westerlund, Mike
Westerlund, Ashley Yantes, and Keith Zwack

39
Works Cited
Blandin Foundation. Strengthening Rural Minnesota. 2010. Web. 22 December 2010
<http://www.blandinfoundation.org/about/our-founder.php>
Bosman, Julie. “Website for Teenagers with Literary Leanings.” New York Times. 5 Dec. 2010. Web.
5 Dec. 2010.
<http://www.nytimes.com/2010/12/06/books/06figment.html?_r=1&src=me&ref=general>
Bryden, Richard & Michael Porter. Cluster Mapping Project.Institute for Strategy and
Competitiveness, Harvard Business School. 2007. Web. 18 Sept. 2010.
<http://www.isc.hbs.edu/econ-clusters.htm>
Bureau of Economic Analysis (BEA). United States Department of Commerce. 2010.
Web. 19 Oct. 2010. <http://bea.gov>
Bureau of Labor Statistics (BLS). Quarterly Census of Employment and Wages. 19 Oct. 2010.
< http://www.bls.gov/cew/>
Carlson, Nicholas. December 8, 2010. “Why Groupon Said No to Google’s $6 Billion.” Business Insider
SAI. 8 Dec. 2010. Web. 8 Dec. 2010.
http://www.businessinsider.com/why-groupon-said-no-to-google-2010-12
Carnevale, Anthony P., Nicole Smith, and Jeff Strohl. “Help Wanted: Projections of Jobs and
Education Requirements Through 2018.” Center on Education and the Workforce,
Georgetown University: Washington DC. June 2010.
< http://www9.georgetown.edu/grad/gppi/hpi/cew/pdfs/FullReport.pdf>
Cortright, Joe. PA5590 Guest Lecture. Humphrey Institute of Public Affairs. 16 Sept. 2010
Davis, Kris. Re: Printing Industry of Minnesota Interview. Message to David Radziej. 29 Oct.
2010.
Davis, Dr. Ronnie H. “Emerging Forces: Printing Industry Structure.” Economic and Print
Market Flash Report. Printing Industries of America. Nov. 2010.
DePass, Dee. “State’s Jobless Rate Holds Steady at 7%.” Star Tribune. 21 Oct 2010. Web. 21
Oct. 2010.
<http://www.startribune.com/business/105434008.html?elr=KArksLckD8EQDUoaEyqyP4O:DW3
ckUiD3aPc:_Yyc:aUac8HEaDiaMDCinchO7DU>

40
Enterprise Minnesota. 2010 State of Manufacturing. Minneapolis, MN: Mason Public Affairs, 2010:
21-22.
Finney-Fine, Kerry. Personal Interview. 16 Nov. 2010.
Grunewald, Rob. PA 5490 Guest Lecture. Humphrey Institute of Public Affairs. 18 Oct. 2010.
Hackler, Darrene. “Information Technology Industry and Telecommunications: An
Emprical Analysis of Cities in the Minneapolis-St. Paul and Phoenix
Metropolitan Areas.” Journal of Urban Technology. 2004.
Jordan, Dorothy. Personal Interview. 11 November 2010.
Minnesota Historical Society (MHS). Public Education, The Minnesota Miracle. Minnesota
Historical Society. 2010. Web. 22 December 2010.
<http://www.mnhs.org/library/tips/history_topics/18public.html>
MN Pollution Control Agency (MPCA). “Recycling: More Ways.” 2010. Web.
http://www.pca.state.mn.us/index.php/living-green/living-green-citizen/reduce-reuse-
recycle/recycling-more-ways.html
Morell, Kirsten. “Exports from Manufacturing Industries: Second Quarter 2010.” Positively
Minnesota. Sept. 2010.
<http://www.positivelyminnesota.com/Data_Publications/Data/Export_Statistics/2010_Stats/Se
cond_Quarter_2010.pdf>
Munnich, Lee, et al. Twin Cities Industry Cluster Study. Metropolitan Council and University of
Minnesota. 1995.
<http://www.hhh.umn.edu/centers/slp/economic_development/documents/twincities_industr
y_cluster.pdf>
North American Industry Classification System (NAICS). “2007 NAICS Code Definition.” 2010. Web. http://www.census.gov/cgi- bin/sssd/naics/naicsrch?code=541810&search=2007%20NAICS%20Search
Olson, Kaitlin. Personal Interview. 3 December 2010.
Porter, Michael. On Competition. Cambridge, MA: Harvard Business School Press, Sept 2008: 227
Printing Industries of America. Printing Industries of America: The Magazine. Sept. 2010: 27.

41
Printing Industries of America (PIA). Print Market Atlas. 3 June 2010.
<http://www.printing.org/page/6272>
Radziej, David. Personal Interview. 29 Oct. 2010.
Schiffman, Steve. “Re: Interview.” Message to Sasha Bergman. 2 Dec. 2010. e-mail.
Suster, Mark. “Social Networking: The Future.” TechCrunch. 5 Dec. 2010. Web. 5 Dec. 2010.
< http://techcrunch.com/2010/12/05/social-networking-future/>
Taylor Corporation. “About Us.” 2010. Web. http://www.taylorcorp.com/company/Pages/about-
us.aspx
Thigpen, Fred. Personal Interview. 12 November 2010.
Thomson Reuters. “Company History.” 2010. Web.
http://thomsonreuters.com/about/company_history/#1890_1790
Thyberg, Todd. Personal Interview. 19 November 2010.
Time Magazine. Minnesota: A State That Works. Time Magazine. 13 Aug. 1973. Web. 22 Dec. 2010
<. http://www.time.com/time/magazine/article/0,9171,907665,00.html>
Tolsma, Adam. Personal Interview. 23 November 2010.
UPM. 2010. Web. 22 December 2010
<http://w3.upmkymmene.com/upm/internet/cms/upmcms.nsf/$all/7388BB0644C42687C2256
DA9002314F9?Open&qm=menu,0,0,0>
Walker, John. Personal Interview. 3 December 2010.
West Publishing. “Company Overview.” 2010. Web.
http://west.thomson.com/about/overview/default.aspx
Westerlund, Michael. Personal Interview. 23 November 2010.
Yantes, Ashley. Personal Interview. 3 December 2010.
Ziegler, Suzanne. “Yearbooks Getting More Personal.” Star Tribune. 14 Nov. 2010. Sec. E, p. 1. Print.

42
Appendix A: State Location Quotients for Industry Sub-Fields
Table 10: Specialization of MN Employment Compared to National Employment per Industry, 2001 and 2009
Industry 2009 Jobs
2001 LQ^
2009 LQ^
Change in LQ
Printing and Related Support Activities 26,374 2.06 2.46 0.40
Printing 24,280 2.08 2.44 0.36
Commercial Lithographic Printing 12,218 2.25 3.00 0.75
Commercial Gravure Printing 205* 1.38 0.72* -0.66
Commercial Flexographic Printing 3,786 5.39 5.30 -0.09
Commercial Screen Printing 2,417 1.76 1.95 0.19
Quick Printing 1,923 1.65 1.70 0.05
Digital Printing 390 0.30 0.83 0.53
Manifold Business Forms Printing 1,086 1.36 1.98 0.62
Books Printing 332 0.35 0.58* 0.23
Blankbook and Looseleaf Binder Mfg 676 4.44 4.91 0.47
Other Commercial Printing 1,310 1.48 1.49 0.01
Support Activities for Printing 2,094 1.90 2.78 0.88
Tradebinding and Related Work 455 1.48 1.24 -0.24
Prepress Services 1,638 2.16 4.22 2.06
Paper manufacturing 10,679 1.27 1.28 0.01
Pulp, paper, and paperboard mills 3,145 1.33 1.32 -0.01
Converted paper product manufacturing 7,533 1.24 1.27 0.03
Publishing Industries 22,647 1.32 1.39 0.07
Software Publishers 5,552 1.10 1.06 -0.04
Newspaper Publishers 6,517 1.10 1.14 0.04
Periodical Publishers 1,724 1.06 0.67 -0.39
Book Publishers 7,932 4.13 5.11 0.98
Directory and Mailing List Publishers 323 0.56 0.40 -0.16
Greeting Card Publishers 40 ND ND NC
All Other Publishers 556 ND ND NC
Internet publishing and broadcasting NC 0.55 NC NC
Advertising, PR, and related services 10,310 1.33 1.20 -0.13
Advertising agencies 3,763 1.14 1.08 -0.06
Public relations agencies 824 0.95 0.82 -0.13

43
Media buying agencies 245 1.41 1.16 -0.25
Media representatives 437 0.69 0.77 0.08
Display advertising 379 0.79 0.57 -0.22
Direct mail advertising 1,924 1.40 1.72 0.32
Advertising material distribution services 191 0.65 0.66 0.01
Other services related to advertising 2,547 3.01 1.98 -1.03
Specialized design services 2,004 1.03 0.79 -0.24
Industrial design services 145 0.54 0.59 0.05
Graphic design services 1,404 1.29 1.07 -0.22
Other specialized design services 84 0.48 0.29 -0.19
Other professional and technical services 12,416 0.90 1.06 0.16
Marketing research and public opinion polling 1,241 0.66 0.61 -0.05
Photographic services 1,900 1.30 1.26 -0.04
Photography studios, portrait 1,773 1.39 1.33 -0.06
Commercial photography 127 0.78 0.70 -0.08
Translation and interpretation services 474 0.86 1.14 0.28
Data Source: U.S. Bureau of Labor Statistics Quarterly Census of Employment and Wages (QCEW)
^ A location quotient greater than 1.00 signifies greater local specialization in the industry than the nation as a whole.
*2008 data

44
Appendix B: 2008 Advertising Employment by County
EDR County Name Total Jobs Adv Adv LQ Design
Design LQ
Direct Mail
Direct Mail LQ
Northwest Kittson 1,084 0 0.00 0 0.00 0 0.00
1 Marshall 1,695 0 0.00 0 0.00 0 0.00
Norman 1,351 0 0.00 9 5.27 0 0.00
Pennington 8,194 0 0.00 0 0.00 0 0.00
Polk 9,717 0 0.00 0 0.00 0 0.00
Red Lake 835 0 0.00 9 8.53 0 0.00
Roseau 7,752 0 0.00 9 0.92 0 0.00
TOTAL NW 30,628 0 0.00 27 0.70 0 0.00
Headwaters Beltrami 14,201 9 0.15 0 0.00 0 0.00
2 Clearwater 2,252 0 0.00 0 0.00 0 0.00
Hubbard 5,188 50 2.34 0 0.00 0 0.00
Lake of the Woods 1,202 0 0.00 0 0.00 0 0.00
Mahnomen 1,644 0 0.00 0 0.00 0 0.00
TOTAL HW 24,487 59 0.58 0 0.00 0 0.00
Arrowhead Aitkin 3,267 0 0.00 0 0.00 0 0.00
3 Carlton 9,471 0 0.00 9 0.75 0 0.00
Cook 2,244 0 0.00 9 3.17 0 0.00
Itasca 13,794 249 4.38 9 0.52 0 0.00
Koochiching 4,506 9 0.48 0 0.00 0 0.00
Lake 3,107 9 0.70 0 0.00 0 0.00
St. Louis 85,819 275 0.78 50 0.46 175 3.57
TOTAL AH 122,208 542 1.08 77 0.50 175 2.51
West Central Becker 12,564 0 0.00 0 0.00 0 0.00
4 Clay 16,449 10 0.15 6 0.29 0 0.00
Douglas 16,920 9 0.13 9 0.42 0 0.00
Grant 1,649 0 0.00 0 0.00 0 0.00
Otter Tail 19,052 16 0.20 9 0.37 0 0.00
Pope 3,528 0 0.00 0 0.00 0 0.00
Stevens 3,991 9 0.55 0 0.00 0 0.00
Traverse 780 0 0.00 0 0.00 0 0.00
Wilkin 1,845 0 0.00 0 0.00 0 0.00
TOTAL WC 76,778 44 0.14 24 0.25 0 0.00
North Central Cass 7,059 9 0.31 0 0.00 0 0.00

45
5 Crow Wing 25,991 50 0.47 9 0.27 0 0.00
Morrison 9,329 9 0.23 0 0.00 0 0.00
Todd 5,159 0 0.00 9 1.38 0 0.00
Wadena 5,435 0 0.00 0 0.00 0 0.00
TOTAL NC 52,973 68 0.31 18 0.27 0 0.00
SW Central Kandiyohi 19,011 9 0.11 7 0.29 9 0.83
6E McLeod 17,436 50 0.70 9 0.41 50 5.02
Meeker 6,151 9 0.36 9 1.16 0 0.00
Renville 5,177 0 0.00 9 1.38 0 0.00
TOTAL SWC 47,775 68 0.35 34 0.56 59 2.16
Upper MN Valley Big Stone 1,639 50 7.40 0 0.00 0 0.00
6W Chippewa 5,708 0 0.00 0 0.00 0 0.00
Lac qui Parle 2,014 0 0.00 0 0.00 0 0.00
Swift 3,306 0 0.00 0 0.00 0 0.00
Yellow Medicine 5,500 0 0.00 0 0.00 0 0.00
TOTAL UMV 18,167 50 0.67 0 0.00 0 0.00
East Central Chisago 13,063 175 3.25 9 0.55 0 0.00
7E Isanti 8,564 6 0.17 9 0.83 0 0.00
Kanabec 3,331 0 0.00 9 2.14 0 0.00
Mille Lacs 7,858 0 0.00 9 0.91 0 0.00
Pine 6,916 9 0.32 0 0.00 0 0.00
TOTAL EC 39,732 190 1.16 36 0.72 0 0.00
Central Benton 15,675 30 0.46 9 0.45 9 1.00
7W Sherburne 20,438 41 0.49 9 0.35 50 4.28
Stearns 80,097 298 0.90 9 0.09 9 0.20
Wright 32,646 89 0.66 9 0.22 50 2.68
TOTAL CENTRAL 148,856 458 0.75 36 0.19 118 1.39
Southwest Cottonwood 4,403 9 0.50 0 0.00 0 0.00
8 Jackson 5,307 0 0.00 0 0.00 0 0.00
Lincoln 1,423 0 0.00 0 0.00 0 0.00
Lyon 12,730 9 0.17 9 0.56 9 1.24
Murray 2,297 9 0.95 0 0.00 9 6.86
Nobles 9,830 9 0.22 0 0.00 9 1.60
Pipestone 4,175 0 0.00 0 0.00 0 0.00
Redwood 5,396 9 0.40 9 1.32 0 0.00
Rock 2,572 9 0.85 0 0.00 0 0.00
TOTAL SW 48,133 54 0.27 18 0.30 27 0.98
South Blue Earth 34,328 47 0.33 6 0.14 0 0.00

46
Central
9 Brown 12,671 8 0.15 9 0.56 0 0.00
Faribault 4,228 9 0.52 0 0.00 0 0.00
Le Sueur 6,524 9 0.33 9 1.09 0 0.00
Martin 8,800 9 0.25 0 0.00 0 0.00
Nicollet 12,771 9 0.17 16 0.99 0 0.00
Sibley 3,222 0 0.00 0 0.00 0 0.00
Waseca 7,194 0 0.00 9 0.99 0 0.00
Watonwan 3,679 0 0.00 0 0.00 0 0.00
TOTAL SC 93,417 91 0.24 49 0.41 0 0.00
Southeast Dodge 4,337 9 0.50 9 1.64 0 0.00
10 Fillmore 5,093 9 0.43 0 0.00 0 0.00
Freeborn 12,176 9 0.18 9 0.58 9 1.29
Goodhue 19,672 21 0.26 9 0.36 9 0.80
Houston 4,288 9 0.51 9 1.66 0 0.00
Mower 13,995 50 0.87 9 0.51 0 0.00
Olmsted 93,067 50 0.13 9 0.08 0 0.00
Rice 23,158 24 0.25 50 1.71 9 0.68
Steele 20,498 9 0.11 9 0.35 9 0.77
Wabasha 6,066 0 0.00 9 1.17 0 0.00
Winona 23,803 40 0.41 27 0.90 50 3.68
TOTAL SE 226,153 230 0.25 149 0.52 86 0.67
Metro Anoka 111,783 172 0.37 175 1.24 9 0.14
11 Carver 35,282 550 3.78 9 0.20 550 27.28
(7 County Area) Dakota 172,842 422 0.59 50 0.23 175 1.77
Hennepin 839,168 8,720 2.52 1,634 1.54 796 1.66
Ramsey 303,515 577 0.46 405 1.06 108 0.62
Scott 40,383 65 0.39 21 0.41 9 0.39
Washington 70,237 141 0.49 175 1.97 9 0.22
TOTAL METRO 1,573,210 10,647 1.64 2,469 1.24 1,656 1.84

47
Appendix C: 2008 Publishing Employment by County
EDR County Name Total Jobs Publ. PublLQ
Book Publ.
Book Publ LQ
Newsp Publ
Newsp Publ LQ
Perio Publ
Peri LQ
Northwest Kittson 1,084 9 1.07 0 0.00 9 2.90 0 0.00
1 Marshall 1,695 9 0.69 0 0.00 9 1.86 0 0.00
Norman 1,351 39 3.73 0 0.00 50 12.95 9 5.37
Pennington 8,194 50 0.79 0 0.00 0 0.00 50 4.92
Polk 9,717 42 0.56 0 0.00 40 1.44 0 0.00
Red Lake 835 9 1.39 0 0.00 0 0.00 9 8.68
Roseau 7,752 47 0.78 0 0.00 9 0.41 0 0.00
TOTAL NW 30,628 205 0.86 0 0.00 117 1.34 68 1.79
Headwaters Beltrami 14,201 151 1.37 0 0.00 50 1.23 9 0.51
2 Clearwater 2,252 50 2.87 0 0.00 50 7.77 9 3.22
Hubbard 5,188 50 1.24 0 0.00 50 3.37 0 0.00
Lake of the Woods 1,202 0 0.00 0 0.00 0 0.00 0 0.00
Mahnomen 1,644 9 0.71 0 0.00 9 1.91 0 0.00
TOTAL HW 24,487 260 1.37 0 0.00 159 2.27 18 0.59
Arrowhead Aitkin 3,267 50 1.98 0 0.00 50 5.35 0 0.00
3 Carlton 9,471 9 0.12 0 0.00 9 0.33 0 0.00
Cook 2,244 9 0.52 0 0.00 9 1.40 0 0.00
Itasca 13,794 29 0.27 0 0.00 26 0.66 9 0.53
Koochiching 4,506 50 1.43 0 0.00 50 3.88 0 0.00
Lake 3,107 9 0.37 0 0.00 9 1.01 0 0.00
St. Louis 85,819 792 1.19 9 0.15 363 1.48 275 2.58
TOTAL AH 122,208 948 1.00 9 0.10 516 1.48 284 1.87
West Central Becker 12,564 50 0.51 0 0.00 50 1.39 0 0.00
4 Clay 16,449 50 0.39 0 0.00 50 1.06 0 0.00
Douglas 16,920 50 0.38 0 0.00 50 1.03 9 0.43
Grant 1,649 9 0.70 0 0.00 9 1.91 0 0.00
Otter Tail 19,052 65 0.44 9 0.67 31 0.57 50 2.11
Pope 3,528 9 0.33 0 0.00 9 0.89 0 0.00
Stevens 3,991 9 0.29 0 0.00 9 0.79 0 0.00
Traverse 780 9 1.49 0 0.00 9 4.04 0 0.00
Wilkin 1,845 0 0.00 0 0.00 0 0.00 0 0.00
TOTAL WC 76,778 251 0.42 9 0.17 217 0.99 59 0.62
North Central Cass 7,059 50 0.91 0 0.00 9 0.45 9 1.03
5 Crow Wing 25,991 175 0.87 9 0.49 175 2.36 9 0.28
Morrison 9,329 50 0.69 0 0.00 50 1.87 0 0.00
Todd 5,159 9 0.23 0 0.00 9 0.61 0 0.00
Wadena 5,435 50 1.19 0 0.00 50 3.22 0 0.00
TOTAL NC 52,973 334 0.81 9 0.24 293 1.93 18 0.27
SW Central Kandiyohi 19,011 50 0.34 0 0.00 50 0.92 0 0.00

48
6E McLeod 17,436 114 0.84 0 0.00 71 1.42 50 2.31
Meeker 6,151 50 1.05 0 0.00 9 0.51 0 0.00
Renville 5,177 22 0.55 0 0.00 22 1.49 0 0.00
TOTAL SWC 47,775 236 0.64 0 0.00 152 1.11 50 0.84
Upper MN Valley Big Stone 1,639 9 0.71 0 0.00 9 1.92 0 0.00
6W Chippewa 5,708 9 0.20 0 0.00 9 0.55 0 0.00
Lac qui Parle 2,014 9 0.58 0 0.00 9 1.56 0 0.00
Swift 3,306 24 0.94 0 0.00 24 2.54 0 0.00
Yellow Medicine 5,500 9 0.21 0 0.00 9 0.57 0 0.00
TOTAL UMV 18,167 60 0.43 0 0.00 60 1.16 0 0.00
East Central Chisago 13,063 9 0.09 0 0.00 9 0.24 0 0.00
7E Isanti 8,564 50 0.75 0 0.00 50 2.04 9 0.85
Kanabec 3,331 9 0.35 0 0.00 0 0.00 9 2.18
Mille Lacs 7,858 50 0.82 0 0.00 50 2.23 0 0.00
Pine 6,916 9 0.17 0 0.00 9 0.46 0 0.00
TOTAL EC 39,732 127 0.41 0 0.00 118 1.04 18 0.36
Central Benton 15,675 8 0.07 0 0.00 9 0.20 0 0.00
7W Sherburne 20,438 43 0.27 0 0.00 39 0.67 9 0.35
Stearns 80,097 412 0.66 50 0.89 337 1.47 9 0.09
Wright 32,646 148 0.59 0 0.00 118 1.26 9 0.22
TOTAL CENTRAL 148,856 611 0.53 50 0.48 503 1.18 27 0.15
Southwest Cottonwood 4,403 50 1.47 0 0.00 50 3.97 0 0.00
8 Jackson 5,307 50 1.22 0 0.00 50 3.30 0 0.00
Lincoln 1,423 9 0.82 0 0.00 9 2.21 0 0.00
Lyon 12,730 85 0.86 0 0.00 83 2.28 9 0.57
Murray 2,297 50 2.81 0 0.00 50 7.61 0 0.00
Nobles 9,830 50 0.66 0 0.00 50 1.78 0 0.00
Pipestone 4,175 50 1.55 0 0.00 50 4.19 9 1.74
Redwood 5,396 50 1.20 0 0.00 50 3.24 0 0.00
Rock 2,572 50 2.51 0 0.00 9 1.22 0 0.00
TOTAL SW 48,133 444 1.19 0 0.00 401 2.91 18 0.30
South Central Blue Earth 34,328 359 1.35 200 8.29 175 1.78 0 0.00
9 Brown 12,671 64 0.65 0 0.00 61 1.68 9 0.57
Faribault 4,228 28 0.85 0 0.00 20 1.65 9 1.71
Le Sueur 6,524 50 0.99 0 0.00 50 2.68 0 0.00
Martin 8,800 53 0.78 0 0.00 50 1.99 9 0.82
Nicollet 12,771 499 5.04 50 5.57 9 0.25 0 0.00
Sibley 3,222 50 2.00 0 0.00 50 5.43 0 0.00
Waseca 7,194 50 0.90 9 1.78 50 2.43 50 5.60
Watonwan 3,679 50 1.75 0 0.00 50 4.75 0 0.00
TOTAL SC 93,417 1,203 1.66 259 3.94 515 1.93 77 0.66
Southeast Dodge 4,337 50 1.49 0 0.00 50 4.03 9 1.67
10 Fillmore 5,093 50 1.27 0 0.00 50 3.43 0 0.00

49
Freeborn 12,176 175 1.86 0 0.00 50 1.44 50 3.31
Goodhue 19,672 169 1.11 0 0.00 132 2.35 0 0.00
Houston 4,288 9 0.27 0 0.00 9 0.73 9 1.69
Mower 13,995 50 0.46 0 0.00 50 1.25 9 0.52
Olmsted 93,067 466 0.65 9 0.14 175 0.66 50 0.43
Rice 23,158 50 0.28 9 0.55 50 0.76 0 0.00
Steele 20,498 50 0.31 0 0.00 50 0.85 0 0.00
Wabasha 6,066 65 1.38 0 0.00 50 2.88 50 6.64
Winona 23,803 163 0.88 50 2.99 175 2.57 9 0.30
TOTAL SE 226,153 1,297 0.74 68 0.43 841 1.30 186 0.66
Metro Anoka 111,783 88 0.10 8 0.10 50 0.16 9 0.06
11 Carver 35,282 183 0.67 50 2.02 50 0.50 9 0.21
(7 County Area) Dakota 172,842 10,000 7.47 7,000 57.62 81 0.16 114 0.53
Hennepin 839,168 9,238 1.42 660 1.12 2,000 0.83 1,079 1.04
Ramsey 303,515 3,765 1.60 175 0.82 960 1.11 50 0.13
Scott 40,383 190 0.61 9 0.32 50 0.43 9 0.18
Washington 70,237 184 0.34 21 0.43 52 0.26 50 0.57
TOTAL METRO 1,573,210 23,648 1.94 7,923 7.17 3,243 0.72 1,320 0.68

50
Appendix D: 2008 Printing Employment by County
Printing Overall, Digital Printing and Book Printing
EDR County Name
Total County Jobs Printing
Printing LQ
Digital Printing
Digital LQ
Books Printing
Books Printing LQ
Northwest Kittson 1,084 0 0.00 0 0.00 0 0.00
1 Marshall 1,695 9 1.01 0 0.00 0 0.00
Norman 1,351 0 0.00 0 0.00 0 0.00
Pennington 8,194 50 1.17 0 0.00 0 0.00
Polk 9,717 9 0.18 0 0.00 0 0.00
Red Lake 835 0 0.00 0 0.00 0 0.00
Roseau 7,752 9 0.22 0 0.00 0 0.00
TOTAL NW 30,628 77 0.48 0 0.00 0 0.00
Headwaters Beltrami 14,201 63 0.85 0 0.00 0 0.00
2 Clearwater 2,252 0 0.00 0 0.00 0 0.00
Hubbard 5,188 9 0.33 0 0.00 0 0.00
Lake of the Woods 1,202 0 0.00 0 0.00 0 0.00
Mahnomen 1,644 0 0.00 0 0.00 0 0.00
TOTAL HW 24,487 72 0.56 0 0.00 0 0.00
Arrowhead Aitkin 3,267 9 0.53 0 0.00 0 0.00
3 Carlton 9,471 9 0.18 0 0.00 0 0.00
Cook 2,244 0 0.00 0 0.00 0 0.00
Itasca 13,794 77 1.07 0 0.00 0 0.00
Koochiching 4,506 0 0.00 0 0.00 0 0.00
Lake 3,107 0 0.00 0 0.00 0 0.00
St. Louis 85,819 223 0.50 0 0.00 0 0.00
TOTAL AH 122,208 318 0.50 0 0.00 0 0.00
West Central Becker 12,564 275 4.18 0 0.00 9 2.86
4 Clay 16,449 50 0.58 0 0.00 0 0.00
Douglas 16,920 41 0.46 50 13.82 0 0.00
Grant 1,649 0 0.00 0 0.00 0 0.00
Otter Tail 19,052 120 1.20 50 12.28 0 0.00
Pope 3,528 50 2.71 0 0.00 0 0.00
Stevens 3,991 0 0.00 0 0.00 0 0.00
Traverse 780 0 0.00 0 0.00 0 0.00
Wilkin 1,845 0 0.00 0 0.00 0 0.00
TOTAL WC 76,778 536 1.33 100 6.09 9 0.47
North Central Cass 7,059 9 0.24 0 0.00 0 0.00

51
5 Crow Wing 25,991 383 2.82 0 0.00 175 26.86
Morrison 9,329 50 1.02 0 0.00 0 0.00
Todd 5,159 550 20.38 0 0.00 0 0.00
Wadena 5,435 50 1.76 0 0.00 0 0.00
TOTAL NC 52,973 1,042 3.76 0 0.00 175 13.18
SW Central Kandiyohi 19,011 78 0.78 9 2.21 0 0.00
6E McLeod 17,436 175 1.92 0 0.00 0 0.00
Meeker 6,151 9 0.28 0 0.00 0 0.00
Renville 5,177 9 0.33 0 0.00 0 0.00
TOTAL SWC 47,775 271 1.08 9 0.88 0 0.00
Upper MN Valley Big Stone 1,639 9 1.05 0 0.00 0 0.00
6W Chippewa 5,708 55 1.84 0 0.00 0 0.00
Lac qui Parle 2,014 0 0.00 0 0.00 0 0.00
Swift 3,306 50 2.89 0 0.00 0 0.00
Yellow Medicine 5,500 9 0.31 0 0.00 0 0.00
TOTAL UMV 18,167 123 1.29 0 0.00 0 0.00
East Central Chisago 13,063 50 0.73 0 0.00 0 0.00
7E Isanti 8,564 9 0.20 0 0.00 0 0.00
Kanabec 3,331 175 10.04 0 0.00 0 0.00
Mille Lacs 7,858 175 4.26 0 0.00 0 0.00
Pine 6,916 9 0.25 9 6.09 0 0.00
TOTAL EC 39,732 418 2.01 9 1.06 0 0.00
Central Benton 15,675 550 6.71 0 0.00 50 12.73
7W Sherburne 20,438 50 0.47 9 2.06 0 0.00
Stearns 80,097 2,193 5.23 9 0.53 0 0.00
Wright 32,646 240 1.41 0 0.00 0 0.00
TOTAL CENTRAL 148,856 3,033 3.89 18 0.57 50 1.34
Southwest Cottonwood 4,403 9 0.39 0 0.00 0 0.00
8 Jackson 5,307 0 0.00 0 0.00 0 0.00
Lincoln 1,423 0 0.00 0 0.00 0 0.00
Lyon 12,730 39 0.59 0 0.00 0 0.00
Murray 2,297 50 4.16 0 0.00 0 0.00
Nobles 9,830 9 0.18 0 0.00 0 0.00
Pipestone 4,175 0 0.00 0 0.00 0 0.00
Redwood 5,396 0 0.00 0 0.00 0 0.00
Rock 2,572 9 0.67 0 0.00 0 0.00
TOTAL SW 48,133 116 0.46 0 0.00 0 0.00
South Central Blue Earth 34,328 205 1.14 0 0.00 0 0.00
9 Brown 12,671 632 9.53 0 0.00 0 0.00

52
Faribault 4,228 30 1.36 0 0.00 0 0.00
Le Sueur 6,524 0 0.00 0 0.00 0 0.00
Martin 8,800 9 0.20 0 0.00 0 0.00
Nicollet 12,771 3,000 44.90 2,000 732.63 0 0.00
Sibley 3,222 0 0.00 0 0.00 0 0.00
Waseca 7,194 2,000 53.14 0 0.00 0 0.00
Watonwan 3,679 175 9.09 0 0.00 0 0.00
TOTAL SC 93,417 6,051 12.38 2,000 100.16 0 0.00
Southeast Dodge 4,337 50 2.20 0 0.00 0 0.00
10 Fillmore 5,093 9 0.34 0 0.00 0 0.00
Freeborn 12,176 47 0.74 0 0.00 0 0.00
Goodhue 19,672 550 5.34 9 2.14 0 0.00
Houston 4,288 0 0.00 0 0.00 0 0.00
Mower 13,995 114 1.56 0 0.00 0 0.00
Olmsted 93,067 514 1.06 9 0.45 9 0.39
Rice 23,158 78 0.64 0 0.00 0 0.00
Steele 20,498 249 2.32 50 11.41 0 0.00
Wabasha 6,066 9 0.28 0 0.00 0 0.00
Winona 23,803 336 2.70 0 0.00 0 0.00
TOTAL SE 226,153 1,956 1.65 68 1.41 9 0.16
Metro Anoka 111,783 1,133 1.94 175 7.32 0 0.00
11 Carver 35,282 550 2.98 50 6.63 0 0.00
(7 County Area) Dakota 172,842 762 0.84 175 4.74 50 1.15
Hennepin 839,168 9,716 2.21 241 1.34 175 0.83
Ramsey 303,515 3,735 2.35 372 5.73 0 0.00
Scott 40,383 1,148 5.43 175 20.27 0 0.00
Washington 70,237 275 0.75 50 3.33 0 0.00
TOTAL METRO 1,573,210 17,319 2.10 1,238 3.68 225 0.57
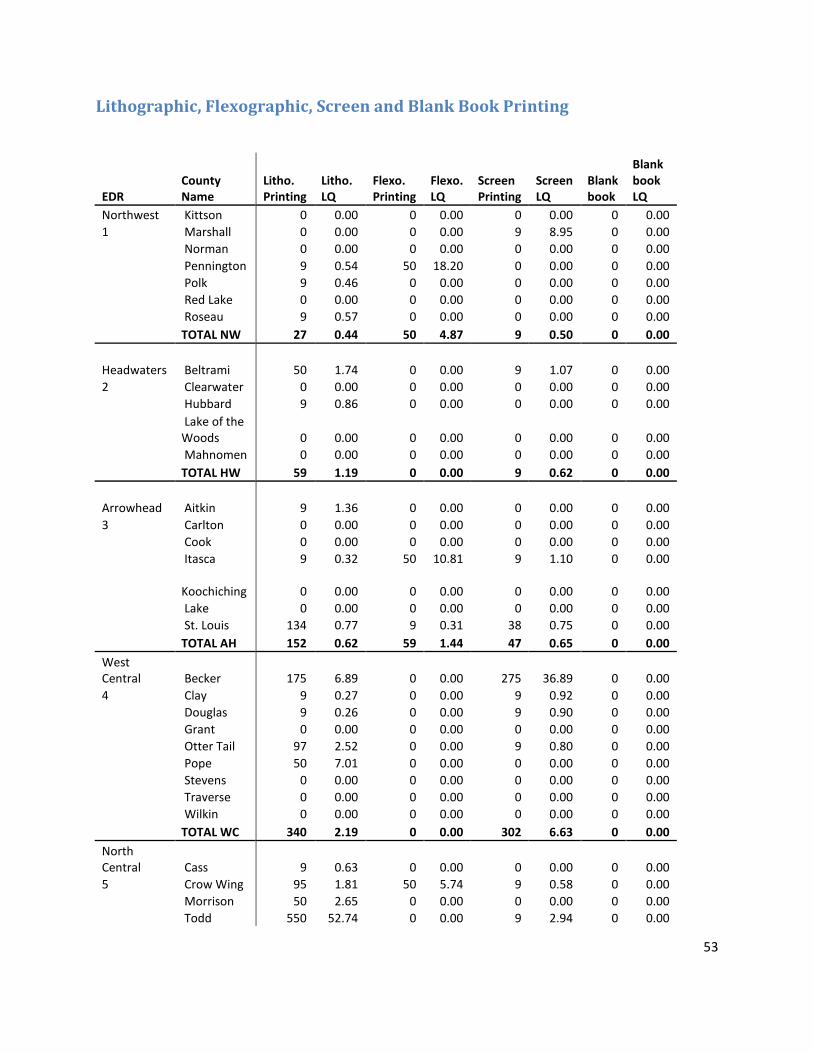
53
Lithographic, Flexographic, Screen and Blank Book Printing
EDR County Name
Litho. Printing
Litho. LQ
Flexo. Printing
Flexo. LQ
Screen Printing
Screen LQ
Blank book
Blank book LQ
Northwest Kittson 0 0.00 0 0.00 0 0.00 0 0.00
1 Marshall 0 0.00 0 0.00 9 8.95 0 0.00
Norman 0 0.00 0 0.00 0 0.00 0 0.00
Pennington 9 0.54 50 18.20 0 0.00 0 0.00
Polk 9 0.46 0 0.00 0 0.00 0 0.00
Red Lake 0 0.00 0 0.00 0 0.00 0 0.00
Roseau 9 0.57 0 0.00 0 0.00 0 0.00
TOTAL NW 27 0.44 50 4.87 9 0.50 0 0.00
Headwaters Beltrami 50 1.74 0 0.00 9 1.07 0 0.00
2 Clearwater 0 0.00 0 0.00 0 0.00 0 0.00
Hubbard 9 0.86 0 0.00 0 0.00 0 0.00
Lake of the Woods 0 0.00 0 0.00 0 0.00 0 0.00
Mahnomen 0 0.00 0 0.00 0 0.00 0 0.00
TOTAL HW 59 1.19 0 0.00 9 0.62 0 0.00
Arrowhead Aitkin 9 1.36 0 0.00 0 0.00 0 0.00
3 Carlton 0 0.00 0 0.00 0 0.00 0 0.00
Cook 0 0.00 0 0.00 0 0.00 0 0.00
Itasca 9 0.32 50 10.81 9 1.10 0 0.00
Koochiching 0 0.00 0 0.00 0 0.00 0 0.00
Lake 0 0.00 0 0.00 0 0.00 0 0.00
St. Louis 134 0.77 9 0.31 38 0.75 0 0.00
TOTAL AH 152 0.62 59 1.44 47 0.65 0 0.00
West Central Becker 175 6.89 0 0.00 275 36.89 0 0.00
4 Clay 9 0.27 0 0.00 9 0.92 0 0.00
Douglas 9 0.26 0 0.00 9 0.90 0 0.00
Grant 0 0.00 0 0.00 0 0.00 0 0.00
Otter Tail 97 2.52 0 0.00 9 0.80 0 0.00
Pope 50 7.01 0 0.00 0 0.00 0 0.00
Stevens 0 0.00 0 0.00 0 0.00 0 0.00
Traverse 0 0.00 0 0.00 0 0.00 0 0.00
Wilkin 0 0.00 0 0.00 0 0.00 0 0.00
TOTAL WC 340 2.19 0 0.00 302 6.63 0 0.00
North Central Cass 9 0.63 0 0.00 0 0.00 0 0.00
5 Crow Wing 95 1.81 50 5.74 9 0.58 0 0.00
Morrison 50 2.65 0 0.00 0 0.00 0 0.00
Todd 550 52.74 0 0.00 9 2.94 0 0.00

54
Wadena 50 4.55 0 0.00 0 0.00 0 0.00
TOTAL NC 754 7.04 50 2.82 18 0.57 0 0.00
SW Central Kandiyohi 64 1.67 0 0.00 9 0.80 0 0.00
6E McLeod 175 4.97 0 0.00 0 0.00 0 0.00
Meeker 9 0.72 0 0.00 0 0.00 0 0.00
Renville 9 0.86 0 0.00 0 0.00 0 0.00
TOTAL SWC 257 2.66 0 0.00 9 0.32 0 0.00
Upper MN Valley Big Stone 9 2.72 0 0.00 0 0.00 0 0.00
6W Chippewa 50 4.33 0 0.00 0 0.00 0 0.00
Lac qui Parle 0 0.00 0 0.00 0 0.00 0 0.00
Swift 9 1.35 0 0.00 0 0.00 0 0.00
Yellow Medicine 9 0.81 0 0.00 0 0.00 0 0.00
TOTAL UMV 77 2.10 0 0.00 0 0.00 0 0.00
East Central Chisago 0 0.00 0 0.00 0 0.00 0 0.00
7E Isanti 0 0.00 0 0.00 9 1.77 0 0.00
Kanabec 175 25.99 0 0.00 9 4.55 0 0.00
Mille Lacs 175 11.02 0 0.00 0 0.00 0 0.00
Pine 0 0.00 0 0.00 0 0.00 0 0.00
TOTAL EC 350 4.36 0 0.00 18 0.76 0 0.00
Central Benton 275 8.68 0 0.00 0 0.00 0 0.00
7W Sherburne 9 0.22 50 7.30 0 0.00 0 0.00
Stearns 1,483 9.16 0 0.00 121 2.55 700 122.44
Wright 222 3.36 0 0.00 14 0.72 0 0.00
TOTAL CENTRAL 1,989 6.61 50 1.00 135 1.53 700 65.88
Southwest Cottonwood 0 0.00 0 0.00 0 0.00 0 0.00
8 Jackson 0 0.00 0 0.00 0 0.00 0 0.00
Lincoln 0 0.00 0 0.00 0 0.00 0 0.00
Lyon 50 1.94 0 0.00 0 0.00 0 0.00
Murray 50 10.77 0 0.00 0 0.00 0 0.00
Nobles 9 0.45 0 0.00 0 0.00 0 0.00
Pipestone 0 0.00 0 0.00 0 0.00 0 0.00
Redwood 0 0.00 0 0.00 0 0.00 0 0.00
Rock 9 1.73 0 0.00 0 0.00 0 0.00
TOTAL SW 118 1.21 0 0.00 0 0.00 0 0.00
South Central Blue Earth 175 2.52 0 0.00 50 2.45 0 0.00
9 Brown 50 1.95 0 0.00 50 6.65 0 0.00
Faribault 30 3.51 0 0.00 0 0.00 0 0.00
Le Sueur 0 0.00 0 0.00 0 0.00 0 0.00
Martin 9 0.51 0 0.00 0 0.00 0 0.00
Nicollet 550 21.30 175 40.87 0 0.00 0 0.00
Sibley 0 0.00 0 0.00 0 0.00 0 0.00
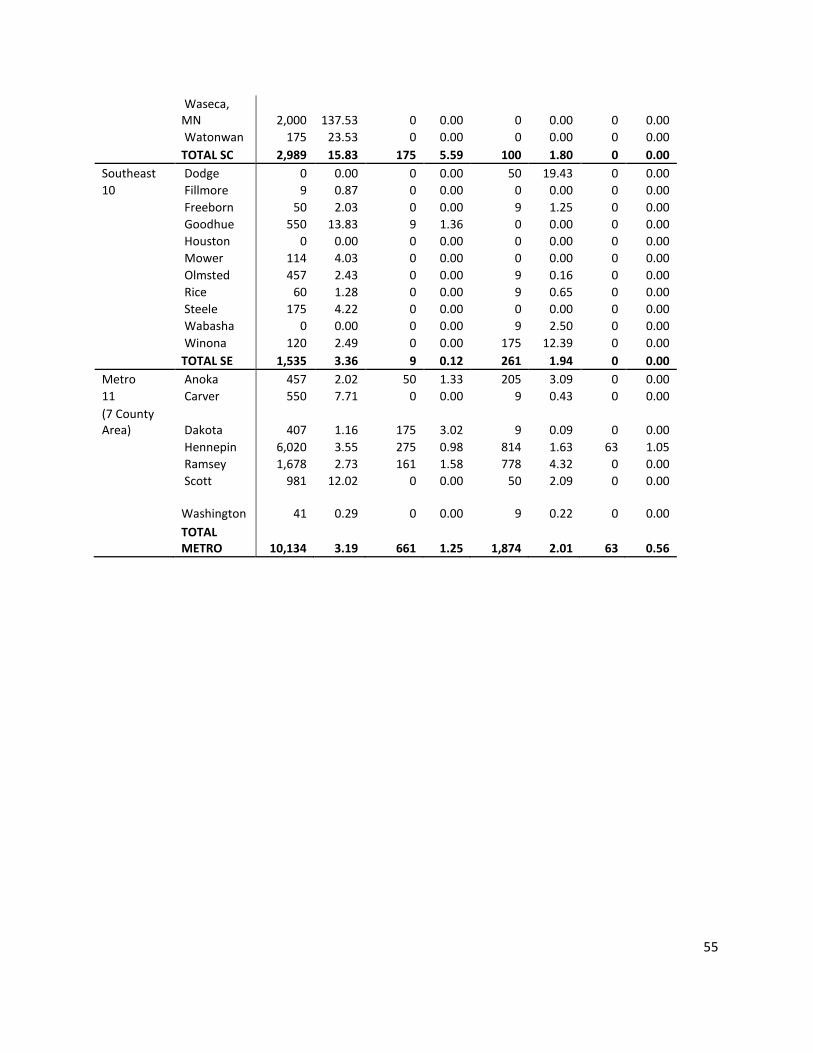
55
Waseca, MN 2,000 137.53 0 0.00 0 0.00 0 0.00
Watonwan 175 23.53 0 0.00 0 0.00 0 0.00
TOTAL SC 2,989 15.83 175 5.59 100 1.80 0 0.00
Southeast Dodge 0 0.00 0 0.00 50 19.43 0 0.00
10 Fillmore 9 0.87 0 0.00 0 0.00 0 0.00
Freeborn 50 2.03 0 0.00 9 1.25 0 0.00
Goodhue 550 13.83 9 1.36 0 0.00 0 0.00
Houston 0 0.00 0 0.00 0 0.00 0 0.00
Mower 114 4.03 0 0.00 0 0.00 0 0.00
Olmsted 457 2.43 0 0.00 9 0.16 0 0.00
Rice 60 1.28 0 0.00 9 0.65 0 0.00
Steele 175 4.22 0 0.00 0 0.00 0 0.00
Wabasha 0 0.00 0 0.00 9 2.50 0 0.00
Winona 120 2.49 0 0.00 175 12.39 0 0.00
TOTAL SE 1,535 3.36 9 0.12 261 1.94 0 0.00
Metro Anoka 457 2.02 50 1.33 205 3.09 0 0.00
11 Carver 550 7.71 0 0.00 9 0.43 0 0.00
(7 County Area) Dakota 407 1.16 175 3.02 9 0.09 0 0.00
Hennepin 6,020 3.55 275 0.98 814 1.63 63 1.05
Ramsey 1,678 2.73 161 1.58 778 4.32 0 0.00
Scott 981 12.02 0 0.00 50 2.09 0 0.00
Washington 41 0.29 0 0.00 9 0.22 0 0.00
TOTAL METRO 10,134 3.19 661 1.25 1,874 2.01 63 0.56

56
Manifold and Other Commercial Printing, Pre Press Services
EDR County Name Manifold
Manifold LQ
Other Comm.l Printing
Other Comm. LQ
Pre press
Pre press LQ
Northwest Kittson 0 0.00 0 0.00 0 0.00
1 Marshall 0 0.00 0 0.00 0 0.00
Norman 0 0.00 0 0.00 0 0.00
Pennington 0 0.00 0 0.00 0 0.00
Polk 0 0.00 9 2.18 0 0.00
Red Lake 0 0.00 0 0.00 0 0.00
Roseau 0 0.00 0 0.00 0 0.00
TOTAL NW 0 0.00 9 0.69 0 0.00
Headwaters Beltrami 0 0.00 0 0.00 0 0.00
2 Clearwater 0 0.00 0 0.00 0 0.00
Hubbard 0 0.00 0 0.00 0 0.00
Lake of the Woods 0 0.00 0 0.00 0 0.00
Mahnomen 0 0.00 0 0.00 0 0.00
TOTAL HW 0 0.00 0 0.00 0 0.00
Arrowhead Aitkin 0 0.00 0 0.00 0 0.00
3 Carlton 0 0.00 9 2.24 0 0.00
Cook 0 0.00 0 0.00 0 0.00
Itasca 0 0.00 9 1.54 0 0.00
Koochiching 0 0.00 0 0.00 0 0.00
Lake 0 0.00 0 0.00 0 0.00
St. Louis 0 0.00 9 0.25 9 0.53
TOTAL AH 0 0.00 27 0.52 9 0.37
West Central Becker 0 0.00 0 0.00 0 0.00
4 Clay 0 0.00 0 0.00 0 0.00
Douglas 0 0.00 9 1.25 0 0.00
Grant 0 0.00 0 0.00 0 0.00
Otter Tail 0 0.00 0 0.00 0 0.00
Pope 0 0.00 0 0.00 0 0.00
Stevens 0 0.00 0 0.00 0 0.00
Traverse 0 0.00 0 0.00 0 0.00
Wilkin 0 0.00 0 0.00 0 0.00
TOTAL WC 0 0.00 9 0.28 0 0.00
North Central Cass 0 0.00 0 0.00 0 0.00
5 Crow Wing 0 0.00 9 0.82 0 0.00
Morrison 0 0.00 0 0.00 0 0.00
Todd 0 0.00 0 0.00 0 0.00
Wadena 0 0.00 0 0.00 0 0.00
TOTAL NC 0 0.00 9 0.40 0 0.00

57
SW Central Kandiyohi 0 0.00 0 0.00 0 0.00
6E McLeod 0 0.00 0 0.00 0 0.00
Meeker 0 0.00 0 0.00 0 0.00
Renville 0 0.00 0 0.00 0 0.00
TOTAL SWC 0 0.00 0 0.00 0 0.00
Upper MN Valley Big Stone 0 0.00 0 0.00 0 0.00
6W Chippewa 0 0.00 0 0.00 9 7.97
Lac qui Parle 0 0.00 0 0.00 0 0.00
Swift 0 0.00 0 0.00 0 0.00
Yellow Medicine 0 0.00 0 0.00 0 0.00
TOTAL UMV 0 0.00 0 0.00 9 2.50
East Central Chisago 0 0.00 9 1.62 0 0.00
7E Isanti 0 0.00 0 0.00 0 0.00
Kanabec 0 0.00 0 0.00 0 0.00
Mille Lacs 0 0.00 9 2.70 0 0.00
Pine 0 0.00 0 0.00 0 0.00
TOTAL EC 0 0.00 18 1.07 0 0.00
Central Benton 0 0.00 0 0.00 0 0.00
7W Sherburne 0 0.00 9 1.04 0 0.00
Stearns 0 0.00 0 0.00 9 0.57
Wright 0 0.00 9 0.65 0 0.00
TOTAL CENTRAL 0 0.00 18 0.29 9 0.31
Southwest Cottonwood 0 0.00 0 0.00 0 0.00
8 Jackson 0 0.00 0 0.00 0 0.00
Lincoln 0 0.00 0 0.00 0 0.00
Lyon 0 0.00 0 0.00 9 3.57
Murray 0 0.00 0 0.00 0 0.00
Nobles 0 0.00 275 65.95 0 0.00
Pipestone 0 0.00 0 0.00 0 0.00
Redwood 0 0.00 0 0.00 0 0.00
Rock 0 0.00 0 0.00 0 0.00
TOTAL SW 0 0.00 275 13.47 9 0.94
South Central Blue Earth 0 0.00 0 0.00 0 0.00
9 Brown 0 0.00 600 111.63 0 0.00
Faribault 0 0.00 0 0.00 0 0.00
Le Sueur 0 0.00 0 0.00 0 0.00
Martin 0 0.00 9 2.41 0 0.00
Nicollet 0 0.00 0 0.00 275 108.81
Sibley 0 0.00 0 0.00 0 0.00
Waseca, MN 0 0.00 0 0.00 0 0.00

58
Watonwan 0 0.00 0 0.00 0 0.00
TOTAL SC 0 0.00 609 15.37 275 14.88
Southeast Dodge 0 0.00 0 0.00 0 0.00
10 Fillmore 0 0.00 0 0.00 0 0.00
Freeborn 0 0.00 0 0.00 0 0.00
Goodhue 0 0.00 0 0.00 0 0.00
Houston 0 0.00 0 0.00 0 0.00
Mower 0 0.00 0 0.00 0 0.00
Olmsted 0 0.00 9 0.23 0 0.00
Rice 0 0.00 0 0.00 0 0.00
Steele 0 0.00 9 1.04 0 0.00
Wabasha 0 0.00 0 0.00 0 0.00
Winona 0 0.00 50 4.95 9 1.91
TOTAL SE 0 0.00 68 0.71 9 0.20
Metro Anoka 9 0.30 9 0.19 50 2.26
11 Carver 50 5.29 9 0.60 0 0.00
(7 County Area) Dakota 0 0.00 9 0.12 9 0.26
Hennepin 50 0.22 68 0.19 793 4.78
Ramsey 50 0.61 175 1.36 247 4.11
Scott 0 0.00 9 0.53 0 0.00
Washington 0 0.00 50 1.68 9 0.65
TOTAL METRO 159 0.38 329 0.49 1,108 3.56