A case study of Carp seed production farm in Bangladesh
56
A CASE STUDY OF CARP SEED PRODUCTION FARM IN BANGLADESH: FEASIBILITY ANALYSIS M. M. Mahbub Alam Department of Fisheries Matshya Bhaban, 1000 Dhaka, Bangladesh E-mail: [email protected] Supervisor Páll Jensson, Professor Department of Industrial Engineering University of Iceland 101 Reykjavik, Iceland E-mail: [email protected] Abstract This report represents an analytical tool developed for the purposes of evaluating the feasibility of a carp seed production farm in Bangladesh. The analyses were based on the assumptions of secondary data, which were collected from both printed and web publications. The financial feasibility of the farm was studied using the Profitability Assessment Model, which utilized some indicators of investment returns such as Net Present Value (NPV), Internal Rate of Return (IRR), Payback Period, Financial Ratios, Modified Internal Rate of Return (MIRR), etc. The risk of the investment was assessed through Impact Analysis, Scenario Analysis and Monte Carlo Simulation. Similarly, technical feasibility was studied by analysing the possible outcomes of a selective breeding programme and the scope of improving existing practices. Finally, environmental feasibility was analysed on the basis of the environmental factors and related acts or rules. The findings of the analyses indicate that the proposed carp seed production farm is financially, technically and environmentally feasible. Total financing of the project is calculated as 15 MBDT of which equity is 30%. The results obtained from the study show positive NPV, i.e. 26 MBDT of capital and 25 MBDT of equity from a 10-year-operation, which are acceptable. The IRR of capital and the IRR of equity are found to be 37% and 60% respectively, which are also adequate because the Marginal Attractive Rate of Return is determined as 10%. The discounted payback period of the investment is measured at only 4 years. As a result, the project is recommended as financially feasible even if it is operated only for 5 years. Further, the results of risk assessment present that there is 98% probability of getting profit from the investment. However, the project is sensitive to sales price followed by sales quantity. Similar to other fish selective breeding programmes, the project is also considered feasible both technically and environmentally. It is concluded that the planned investment is highly feasible to operate in Bangladesh. Key Words: Feasibility analysis, freshwater carps, quality of seeds Skúlagata 4, 121 Reykjavik, Iceland Final Project 2010
Transcript of A case study of Carp seed production farm in Bangladesh

A CASE STUDY OF CARP SEED PRODUCTION FARM IN
BANGLADESH: FEASIBILITY ANALYSIS
M. M. Mahbub Alam Department of Fisheries
Matshya Bhaban, 1000 Dhaka, Bangladesh
E-mail: [email protected]
Supervisor
Páll Jensson, Professor Department of Industrial Engineering
University of Iceland
101 Reykjavik, Iceland
E-mail: [email protected]
Abstract
This report represents an analytical tool developed for the purposes of evaluating the feasibility of
a carp seed production farm in Bangladesh. The analyses were based on the assumptions of
secondary data, which were collected from both printed and web publications. The financial
feasibility of the farm was studied using the Profitability Assessment Model, which utilized some
indicators of investment returns such as Net Present Value (NPV), Internal Rate of Return (IRR),
Payback Period, Financial Ratios, Modified Internal Rate of Return (MIRR), etc. The risk of the
investment was assessed through Impact Analysis, Scenario Analysis and Monte Carlo Simulation.
Similarly, technical feasibility was studied by analysing the possible outcomes of a selective
breeding programme and the scope of improving existing practices. Finally, environmental
feasibility was analysed on the basis of the environmental factors and related acts or rules. The
findings of the analyses indicate that the proposed carp seed production farm is financially,
technically and environmentally feasible. Total financing of the project is calculated as 15 MBDT
of which equity is 30%. The results obtained from the study show positive NPV, i.e. 26 MBDT of
capital and 25 MBDT of equity from a 10-year-operation, which are acceptable. The IRR of
capital and the IRR of equity are found to be 37% and 60% respectively, which are also adequate
because the Marginal Attractive Rate of Return is determined as 10%. The discounted payback
period of the investment is measured at only 4 years. As a result, the project is recommended as
financially feasible even if it is operated only for 5 years. Further, the results of risk assessment
present that there is 98% probability of getting profit from the investment. However, the project is
sensitive to sales price followed by sales quantity. Similar to other fish selective breeding
programmes, the project is also considered feasible both technically and environmentally. It is
concluded that the planned investment is highly feasible to operate in Bangladesh.
Key Words: Feasibility analysis, freshwater carps, quality of seeds
Skúlagata 4, 121 Reykjavik, Iceland
Final Project 2010

Alam
ii
UNU-Fisheries Training Programme
List of Abbreviations
BB Bangladesh Bank
BDT Bangladeshi Taka
DoF Department of Fisheries
DSCR Debt Service Coverage Ratio
EBITDA Earnings Before Interests, Taxes, Depreciation and Amortization
EBT Earnings Before Taxes
FAO Food and Agriculture Organization
FSYB Fisheries Statistical Year Book
GoB Government of Bangladesh
GDP Gross Domestic Production
HCG Human Chorionic Gonadotropin
ICIMFA Information Centre of the Icelandic Ministry of Fisheries and
Agriculture
IMC Indian Major Carp
IRR Internal Rate of Return
LLCR Loan Life Coverage Ratio
MARR Marginal Attractive Rate of Return
MBDT Million Bangladeshi Taka
MIRR Modified Internal Rate of Return
NBR National Board of Revenue
NPV Net Present Value
PG Pituitary Gland
ROE Return on Equity
ROI Return on Investment
TPM Three Point Method

Alam
iii
UNU-Fisheries Training Programme
Table of Contents
1 INTRODUCTION................................................................................................................. 1
2 LITERATURE AND REVIEW ............................................................................................ 4
2.1 Review of Profitability of Carp Seed Production.............................................................. 5
2.2 Review of Carp Breeding Technology .............................................................................. 7 2.2.1 Benefits of Selective Breeding Programme ..................................................................... 7 2.2.2 Brood Stock Management ............................................................................................... 7 2.2.3 Hatchery Operation ........................................................................................................ 9 2.2.4 Nursery Management................................................................................................... 10
2.3 Review of Environmental Factors ................................................................................... 10
3 MATERIALS AND METHODS ........................................................................................ 11
3.1 Collection and Review of Data ....................................................................................... 11
3.2 Estimation of Cost and Main Assumptions ..................................................................... 11
3.3 Financial Feasibility Study .............................................................................................. 12 3.3.1 Net Present Value (NPV) .............................................................................................. 13 3.3.2 Internal Rate of Return (IRR) ....................................................................................... 14 3.3.3 Modified Internal Rate of Return (MIRR) ..................................................................... 14 3.3.4 Financial Ratios ............................................................................................................ 14
3.4 Risk Analysis .................................................................................................................. 15 3.4.1 Impact Analysis ............................................................................................................. 15 3.4.2 Scenario Analysis .......................................................................................................... 15 3.4.3 Monte Carlo Simulation ................................................................................................ 15
3.5 Analysis of Technical Feasibility .................................................................................... 16
3.6 Analysis of Environmental Feasibility ............................................................................ 18
4 RESULTS ........................................................................................................................... 19
4.1 Cost Estimation and Main Assumptions ......................................................................... 19
4.2 Market Plan ..................................................................................................................... 22
4.3 Financial Analysis ........................................................................................................... 22 4.3.1 Assumptions Summary .................................................................................................. 22 4.3.2 Investment and Financing ............................................................................................. 23 4.3.3 Operating Statement ..................................................................................................... 23 4.3.4 Balance Sheet ................................................................................................................ 23 4.3.5 Cash Flow ..................................................................................................................... 23 4.3.6 Source and Allocation of Funds .................................................................................... 24 4.3.7 Profitability Measures .................................................................................................. 24 4.3.8 Results and Sensitivity .................................................................................................. 28
4.4 Risk Analysis .................................................................................................................. 29 4.4.1 Impact Analysis ............................................................................................................. 29 4.4.2 Scenario Analysis .......................................................................................................... 29 4.4.3 Monte Carlo Simulation ................................................................................................ 30
5 DISCUSSION ..................................................................................................................... 31
5.1 Analysis of Financial Feasibility ..................................................................................... 31 5.1.1 Profitability Assessment ................................................................................................ 31 5.1.2 Risk Analysis ................................................................................................................. 33
5.2 Analysis of Technical Feasibility .................................................................................... 34
5.3 Analysis of Environmental Feasibility ............................................................................ 35
6 RECOMMENDATIONS .................................................................................................. 37
7 CONCLUSION ................................................................................................................... 38

Alam
iv
UNU-Fisheries Training Programme
8 REFERENCES .................................................................................................................... 39
9 APPENDICES..................................................................................................................... 43
ACKNOWLEDGEMENTS .................................................................................................... 51
List of Figures
Figure 1: Production from aquaculture and capture fisheries in Bangladesh from 1971 to 2008
(FAO, 2010). ............................................................................................................................. 1
Figure 2: Sector-wise fisheries production in Bangladesh in 2008-09 (FSYB, 2010). ............. 2
Figure 3: Contribution of different fish groups in national production in 2008-09
(FSYB, 2010). ........................................................................................................................... 2
Figure 4: The main components of the Profitability Assessment Model (Jensson, 2006). .... 13
Figure 5: Process flow chart of brood stock management. ...................................................... 16
Figure 6: Process flow chart of hatchery operation (modified from Ahmed, 2005). .............. 17
Figure 7: Process flow chart of nursery management ............................................................. 18
Figure 8: A beta probability distribution (or triangular) of cost estimation. ........................... 19
Figure 9: Cash flow series of a carp seed production farm from 2010 to 2020....................... 25
Figure 10: Accumulated Net Present Value from 2010 to 2020. ............................................ 25
Figure 11: IRR of total cash flow and IRR of net cash flow from 2010 to 2020. ................... 26
Figure 12: Cash flow ratios of the project from 2010-2020. ................................................... 27
Figure 13: Cash flow ratios of the project from 2010 to 2020. ............................................... 27
Figure 14: Return on investment and return on equity from 2011 to 2020. ............................ 28
Figure 15: Breakdown of costs of a carp seed production farm in Bangladesh. ..................... 28
Figure 16: Impact analysis of IRR of equity. .......................................................................... 29
Figure 17: A histogram of IRR of equity. ............................................................................... 30
Figure 18: Correlation coefficients of IRR of equity............................................................... 31

Alam
v
UNU-Fisheries Training Programme
List of Tables
Table 1: The price of Aquaculture Ingredients in Bangladesh in 2010 ........................... 5
Table 2: Doses and nutritive values of ingredients used in Supplementary feeds for
brood fishes (Sarder, 2007, Islam, 2009 and Khandaker, 2007) ........................................ 9
Table 3: Assumptions of Investment and Operational Costs ......................................1920
Table 4: Other Operational Assumptions ......................................................................... 21
Table 5: Scenario Analysis of NPV of Equity and IRR of Equity ................................... 30
List of Appendices
Appendix 1: Estimation of Costs...……………………………………………………... 41
Appendix 2: Assumptions and Results……………………………………...………... 42
Appendix 3: Investment and Financing…………………………………..…………... 43
Appendix 4: Operating Statement…………………………………………………….. 44
Appendix 5: Balance Sheet………………………………………………………............ 45
Appendix 6: Cash Flow……………………………..…………………………………... 46
Appendix 7: Source and Allocation of Funds………….………………….…………... 47
Appendix 8: Profitability Measures...……………………………………………………48

Alam
1
UNU-Fisheries Training Programme
1 INTRODUCTION
Today, fisheries, including aquaculture, is a well-established technology and
economic activity in the world. It provides a dynamic source of food, employment,
recreation and economic benefits both for present and future generations all over the
world (FAO, 1995). The fisheries of Bangladesh play an important role in alleviating
animal protein shortage, providing jobs for millions of people and earning foreign
currencies. Total fish production in 2008-09 was about 2.7 million mt contributing
3.74% to the GDP and over 22% to the agricultural GDP. Bangladesh earned more
than 32 billion BDT by exporting about 73 thousand mt of fish and fish products and
contributed 3% to the country’s total export earnings in 2008-09. The average growth
rate of Bangladesh fisheries is 5.4%. Per capita annual fish intake is about 17.5 kg
supplementing about 60% of the animal protein of the daily national diet. About 10%
of the total population is directly or indirectly employed in the fisheries sector (DoF,
2010).
Bangladesh is endowed with diversified fisheries resources. These are divided into
three groups, i.e., inland capture, marine capture and aquaculture. Inland fisheries
cover an area of about 4.6 million hectares of which aquaculture comprises more than
0.5 million hectares (DoF, 2010). Production from both aquaculture and capture
fisheries of Bangladesh is gradually increasing (FAO, 2010; Figure 1). However,
inland capture fisheries have been under heavy pressure as a result of worsening
environmental conditions; siltation in river beds; water pollution from agricultural,
industrial and municipal wastes; construction of embankments for flood
protection;irresponsible and destructive fishing practices; and loss of natural breeding
grounds through habitat degradation.
Figure 1: Production from aquaculture and capture fisheries in Bangladesh from 1971
to 2008 (FAO, 2010).
Therefore, Bangladesh has focused its attention on aquaculture, which has a high
potential for development (Hussain and Mazid, 2005). The country aquaculture
contributes more than 39% (Figure 2) to total fish production in 2008-09 (FSYB,
2010).
0
200
400
600
800
1.000
1.200
1.400
1.600
1.800
1971 1976 1981 1986 1991 1996 2001 2008
Pro
duct
ion (
'00
0 m
t)
Year
Capture Fisheries
Aquaculture

Alam
2
UNU-Fisheries Training Programme
Figure 2: Sector-wise fisheries production in Bangladesh in 2008-09 (FSYB, 2010).
Carp aquaculture is rising sharply in Asia. Carp production from Asia contributed
95% to the world total carp production in 2001. In this region, there are more than 20
main inherent carp species, contributing to about 80% of the total freshwater fish
production. The most carp production in Asia is contributed by China, India,
Bangladesh and Indonesia. Carps are basically the most important species to
aquaculture in Bangladesh. In 2001, carp production was estimated as 89% of the total
freshwater fish production in the country (Dey et al., 2005). The proportion of
freshwater carps in total fish production is about 35% (Figure 3) in 2008-09 followed
by small indigenous species, hilsha, marine fish, shrimp and prawn, and cat fish
(FSYB, 2010).
Figure 3: Contribution of different fish groups in national production in 2008-09
(FSYB, 2010).
Aquaculture of Bangladesh is enriched with a significant number of indigenous and
exotic carp fishes. There are at least 13 endemic and 8 introduced species of carps,
which are of interest to aquaculture in Bangladesh (Hussain and Mazid, 2005). The
species of fish included in this study, either individually or as a group, are normally
known as carps. The species referred to as carps are generally seven in number and
are grouped on the basis of the geographical locations as the Chinese Carps, which
include the grass carp, Ctenopharyn godonidella; the silver carp, Hypophthalmichthys
molitrix and the bighead carp, Aristichthys nobilis and the Indian Major Carps, which
comprise of catla, Catla catla; rohu, Labeo rohita; and mrigal, Cirrhinus mrigala. The
seventh species is the common carp, Cyprinus carpio (Jhingran and Pullin, 1985).
Inland Capture
42%
Marine Capture
19%
Aquaculture
39%
Freshwater Carp
35% Hilsha
11%
Cat Fish
12%
Small Indigenous
Fish 24% Shrimp & Prawn
9%
Marine Fish
9%

Alam
3
UNU-Fisheries Training Programme
The tradition of natural origin seeds of these fishes is becoming a thing of the past in
Bangladesh. During the sixties and early seventies the state aquaculture was
absolutely dependent on natural carp spawns collected from different rivers. In the
course of time, the production of fish spawns in the rivers has been reduced due to
habitat destruction and environmental change and, alternatively, induced spawning
has started to fill the shortage of seeds (Sarder, 2007). In 2009, natural source
contributed only 0.5% to total spawn production, whereas the private sector hatcheries
98.5% and public farms added only 1%. The country produced 9.6 billion carp
fingerlings in 2008-09 from 466 mt carp spawns accumulated from 931 hatcheries and
natural sources (FSYB, 2010). However, the hatchery-produced stocks, including
carps, have presented lower growth and poor breeding performance, morphological
deformities, susceptibility to diseases and high mortalities, which result in poor
quality of seeds (Hussain and Mozid, 2005).
The quality of fish seeds in Bangladesh has declined over the years. The quality
reduction is mostly observed in private hatcheries. There are many reasons for the low
quality, for instance, inbreeding, inter-specific hybridization, negative selection,
improper broodstock management, which lead to poor performance in aquaculture
production (Sarder, 2007). Furthermore, hybridization and cross breeding are
threatening the genetic diversity of indigenous wild stocks of Indian Major Carps
(IMC), which may result in irreparable damage to their gene pool (Khan, 2008).
However, quality artificial seed production is necessary to fill the shortage of natural
seeds and to satisfy the growing demand for quality fish fingerlings in aquaculture.
Therefore, new investment is needed to escalate the supply of good quality fish seed,
which can improve the performance of cultivated species (Davy and Chouinard,
1981). Moreover, carps are the main species for the aquaculture system in
Bangladesh, and the production of these species completely depends on timely and
adequate supply of quality seeds (Sarder, 2007). Presently, both public and private
hatcheries and nurseries are producing fish seeds, but there has been a growing
concern over the availability of good quality seeds for sustainable fish production
(Sattar and Das, 2002). For that reason, the production of quality carp spawns and
fingerlings are essential for desired production of fish in Bangladesh (GoB, 2010).
Carp seed production is a profitable business in Bangladesh. As a result, many
investors are coming forward to invest in aquaculture. Before making an investment
in a carp seed production farm, it is necessary to determine whether the planned
investment idea is feasible or not. Through this study the solution to the following
research question will be found out.
Is it financially, technically and environmentally feasible to establish a carp seed
production farm for the improvement of carp seed quality in Bangladesh?
Carrying out a feasibility analysis is, therefore, the most important step in the
decision-making process for any investment. The goal of this study is to conduct a
feasibility analysis and to develop a decision for whether to support establishment of a
carp seed production farm for the improvement of carp seed quality in Bangladesh.
The objectives of the study comprise the development of a profitability model through
analysis of the financial feasibility and analyses of the technical and environmental
feasibility of carp seed production farm in Bangladesh.

Alam
4
UNU-Fisheries Training Programme
The methodology developed during this study will be a useful tool to analyse the
feasibility of aquaculture farms. It will be an important pathway for profitability
assessment of initial investment in carp seed farms, which will provide information
about profit and risk of the investment. This model will be a valuable management
tool for farm owners, investors, financial institutions and banks. Moreover, the
profitability model can be used in planning as well as during the operations of the
farm. The tool developed here can also be applied in evaluation of any other
investment and operations. Furthermore, this study will assist fish farmers to know
what they require before starting fish farming. Governmental agencies can also use
the information to formulate policies and programmes for the development of
fisheries in the country. Thus, the fisheries of Bangladesh would advance in a
sustainable way.
This report is written to provide the basic ideas and the business plan that are needed
to start a carp seed farm in order to improve the quality of seeds. The information in
Chapter 2 is presented to give some background evidence that helps to explain the
feasibility analysis. The materials and methods are discussed in Chapter 3, which
include the necessary formula and tools used during the study. Chapter 4, which
presents the results of feasibility analysis, illustrates the profitability of carp seed
production. Chapter 5, which gives a detailed discussion of feasibility analysis,
includes the financial feasibility of the investment, technology to be followed and
environmental factors to be considered during establishment of a carp seed production
farm in Bangladesh. Chapter 4 and chapter 5 are the heart and soul of the report.
Chapter 6, which outlines the recommendations based on the study, discusses the
possibility of research and government initiatives to be taken for further development
of fish seed quality in Bangladesh. Chapter 7 characterises the conclusion of the
feasibility analysis. Following chapter 7, a list of cited references is provided. Some
important appendices are also added at the end of the report for understanding the
profitability calculation in greater detail. Abbreviations are defined in the text when
they are first used. Moreover, there is a list of abbreviations in the beginning of the
report for reference.
2 LITERATURE AND REVIEW
A feasibility study is a tool which investigates the viability of a prospective project.
Investors with a business idea should conduct a feasibility study to determine the
suitability of their idea before proceeding with the establishment of a business.
Conducting a feasibility study is a good business practice. If it is properly conducted,
it may be the best investment one ever makes (Hofstrand and Holz-Clause, 2009). The
purpose of the feasibility study is to reveal the practicality of the project. A feasibility
study assists decision makers in considering alternative development opportunities. It
also permits planners to outline their ideas on paper before implementing them. This
can expose errors in project design before their implementation affects the project
negatively. Applying the lessons gained from a feasibility study can significantly
lower the project costs (Matson, 2000). Moreover, feasibility study is an analytical
tool used during project planning, which includes financial feasibility, technical
feasibility and environmental aspects.

Alam
5
UNU-Fisheries Training Programme
2.1 Review of profitability of carp seed production
Today, fish seed production is a widespread commercial activity in Bangladesh. The
recent development of aquaculture is increasingly taking advantage of the continual
production of fish seed. The profitability of existing carp seed farms in Bangladesh is
reviewed here.
Firstly, the excellence of carp seeds greatly depends on quality and source of brood
fishes. To meet the rising demand of brood fishes, public hatcheries of Bangladesh are
producing river and hatchery origin quality brood fishes. The price per kilogram of
natural origin brood fish in public farms is 120 BDT (Hamid, 2010).
The price of ingredients used in farm management varies with season and quality.
Table 1 shows the price of aquaculture ingredients in Bangladesh. The value of
hatchery products such as spawns and fingerlings is also variable depending on
several factors, viz. species, supply, demand, season, transportation and quality of
spawns. It is reported that the price of spawns of Indian Major carp and Chinese carp
varies both in private and public farms from 1,000 to 3,000 BDT per kg (Sarder,
2007). On the other hand, the average price of quality carp spawns produced in public
farms is 4,000 BDT per kg with a price reduction by 1,000 BDT per kg from July of
the year (Ullah, 2010). Similarly, the price of 2 to 3 inch-sized carp fingerlings varies
from 200 to 1,000 BDT per 1,000 individuals (Sarder, 2007). The average price of 2-
15 cm-sized quality carp fingerlings from public farms is 500 BDT per 1000
individuals (Ullah, 2010).
Table 1: The price of aquaculture ingredients in Bangladesh in 2010.
Ingredients Price (BDT) References
Wheat bran 24 per kg (Ullah,2010)
Mustard oil cake 28 per kg
Wheat flour 25 per kg
Cow-dung 1.5 per kg
Urea 15 per kg
Triple super phosphate 25 per kg
Lime 16 per kg
Plastic bag/Jute sac 10 per piece
Wheat bran 15 per kg (Islam, 2010)
Mustard oil cake 20 per kg
Rice bran 10 per kg
Pituitary Gland 2,500 per g
Human Chorionic Gonadotropin 200 per vial
Furthermore, other farm management costs, i.e. labour cost, also vary with season and
locality. On average, the cost of aquaculture labour in Bangladesh is 150 BDT per day
(Ullah, 2010). One favourable thing for aquaculture is that the income of fisheries is
exempted from tax, but listed companies are entitled to pay 5% tax as corporations
(NBR, 2010). However, monetary inflation can adversely affect the profitability of
any company. It was recorded by Bangladesh Bank that Bangladesh's inflation
(general) rate was 7.31% during a 12-month average in 2009-10 (Akhtaruzzaman,
2010). Finally, the bank loan interest rate for agriculture was 13% in Bangladesh in
2010 (BB, 2010).

Alam
6
UNU-Fisheries Training Programme
However, profitability assessment is essential for the feasibility study of a new
investment. According to Park (2002), the profitability of any project is measured by
some indicators such as Net Present Value (NPV), Internal Rate of Return (IRR),
Return on Investment (ROI), Return on Equity (ROE), Financial Ratios, etc. As it is
described, if the NPV is positive for a single project, the project should be accepted.
This means that the project has greater equivalent value of inflows than outflows, and
therefore makes a profit. The decision rule for NPV (Park, 2002) is: if NPV>0, the
investment is accepted; if NPV=0 the investment remains indifferent; and if NPV< 0 the investment is rejected.
Presently, profitability assessment is a pervasive tool used by many researchers. For
instance, the profitability of Trawl Fleet Investment in Liberia was analysed by Togba
(2008). From the study it was found that the proposed investment achieved 15%
Internal Rate of Return (IRR) of net cash flow and a positive Net Present Value
(NPV). The payback period was found to be 8 years. The ROI and the ROE were
calculated as 51% and 56% respectively at the end of a 10-year operation. Both net
current ratio and liquidity ratio were 5.5. The internal value of shares was calculated
as 4.3 times and debt service coverage ratio was 3.0, whereas the acceptable minimum
was decided to be 1.5. It was concluded the investment in trawl fishery was
acceptable based on NPV and IRR (Togba, 2008).
Further, the profitability of African Catfish farming in Kenya was studied by Okechi
(2005) to determine financial feasibility of the enterprise. The study found a payback
period of 4 years and a positive Net Present Value (NPV). The Internal Rate of Return
(IRR) was computed as 34% and 60% for total cash flow and net cash flow
respectively. As it was described, the IRR for the farm was above the Marginal
Attractive Rate of Return (MARR). As a result the investment was found profitable to
operate. The report also stated that debt service coverage ratio was above 1.5 showing
the cash flow well above the repayment and interest of loans. Moreover, net current
ratio was also above 1.0. Thus, the current assets were more than the current
liabilities. Therefore, the investment was recommended.
Finally, projects are rarely financed independently. A combination of sources is
usually needed. For instance, the equity for new investment is provided by the
different commercial banks as well as by the Central Bank of Bangladesh. The central
bank of Bangladesh, the Bangladesh Bank, is authorized by the Government to
manage the Equity and Entrepreneurship Fund. According to Bangladesh Bank, the
project should have to be viable technically and financially to obtain equity fund. As
is reported, the project must offer minimum 15% Internal Rate of Return (IRR), 15%
Return on Equity (ROE), 1.5 Debt Service Coverage Ratio and 1.5 Liquid Current
Ratio (BB, 2003).

Alam
7
UNU-Fisheries Training Programme
2.2 Review of carp breeding technology
A carp breeding programme comprises three major activities: brood stock
management, hatchery operation and nursery management. The data and information
related to the study collected from different sources are described at this point.
2.2.1 Benefits of selective breeding programmes
Selective breeding programmes are common both for plants and animals throughout
the world. Selective breeding in fishes is also gaining in popularity in many countries.
It is an effective method of increasing yields, which has long-term benefits (Tave,
1995). The selective breeding of Atlantic salmon in Norway, the Channel catfish in
the USA and the Nile tilapia in the Philippines, for instance, are improving qualities
like survival rate, growth rate, resistance to disease, meat quality etc. through
selection (Reddy, 1999).
In India, for example, selective breeding work was performed at the Central Institute
of Freshwater Aquaculture, Bhubaneswar. The study was performed in collaboration
with the Institute of Aquaculture Research, Norway. Rohu (Labeo rohita) was chosen
as the model species among Indian Major Carps (IMC). It was reported that after four
generations of selection, an average of 17% higher growth per generation was
observed in improved rohu (Mahapatra et al., 2011).
An Atlantic salmon selective breeding programme was undertaken by Elliott et al.,
(2007) in Tasmania. The programme was conducted with the objectives to increase
growth traits of fish, to improve feed conversion efficiency and to reduce the length of
production cycle. It was predicted that the growth rate would be improved by 10% per
generation. The report also stated that the period of Atlantic salmon ‘grow-out’ was
reduced from 4 to 3 years through selective breeding in Norway (Elliott et al., 2007).
Likewise, selective breeding programmes have been initiated by several private
companies and public institutions in Iceland (ICIMFA, 2011). For example, selective
breeding programmes for Atlantic salmon by Stofnfiskur, for Arctic charr by the
Holar University College and for Atlantic cod by the company Icecod are in operation
with the objectives of achieving faster growth, later sexual maturity, higher survival
rate, better flesh quantity and more resistance to disease.
2.2.2 Brood stock management
Management of brood stock is the prime way to improve the quality of carp seeds.
Brood stock is the heart of the fish seed production farm. The success of induced
breeding depends on the availability of sufficient number of brood fish and their
proper management (Sarder, 2007). It was observed that most of the hatcheries or
farms in Bangladesh used under weighted and sized fishes for breeding. However, for
the improvement of seed quality, 2-3 year old mature males and females of natural
origin are recommended as brood fish. Brood stock of the same age may also be
collected from culture ponds. For exotic species the culture pond is the only source of
brood stock (Sarder et al., 2002).

Alam
8
UNU-Fisheries Training Programme
Pedigree recording is an essential task in spawning for the improvement of carp seed
quality. It is reported that no brood stocks having pedigree are found in existing fish
farms in Bangladesh except two government carp hatcheries, where brood fishes are
nurtured in species-specific ponds. In these hatcheries, they recruit their brood stock
every year through collecting spawn from natural sources. Alternatively, in most
private hatcheries, the existing and newly recruited brood fishes are stocked in the
same pond due to shortage of ponds without any pedigree record. Therefore, the fishes
collected as brood stock should be pedigreed prior to starting a fish hatchery (Khan,
2008).
Before stocking brood fish, ponds should be well prepared. The usual practice of
brood fish pond preparation is the removal of predators and weed fishes through
drying the pond. Sometimes toxins such as rotenone are used to kill the unwanted
fishes. Afterwards, aquatic weeds are removed manually. Then, lime is applied at the
rate of 1-2 kg per decimal (Sarder, 2007). The stocking density is vital for proper
development of brood fishes. It is often observed that fishes with high density are
reared in a small pond resulting in poor quality of broods. The size of brood ponds
should range from 0.25 to 0.5 hectares. For good quality brood, the stocking density
should be maintained at 1.5 to 2.0 mt per hectare with an equal ratio of male and
female (Islam, 2009).
The post-stocking management of brood fish ponds can also affect the quality of
seeds. For example, fertilization in ponds is an important post-stocking management
measure to ensure natural food production. The brood fish pond should be fertilized
with cow-dung, urea and triple super phosphate (TSP) at the rate of 500 kg, 12.5 kg
and 6.25 kg per hectare per week, respectively, for producing natural food (Islam,
2009).
The success of induced breeding is greatly dependent on the brood stock’s reaching
the right stage of gonadal development (Davy and Chouinard, 1981). It is reported
that the broods of most farms in Bangladesh are not provided with a sufficiently
balanced diet. As a result, the spawns produced from these broods are poor in quality
(Khan, 2008). Aside from the availability of natural food, most farm owners offer the
brood fish supplementary feed with 25-30% protein level. The feed is applied at 2-3%
body weight of brood fish stocked. In addition, cut pieces of soft grass are supplied to
the pond for grass carp and silver barb (Sarder, 2007).
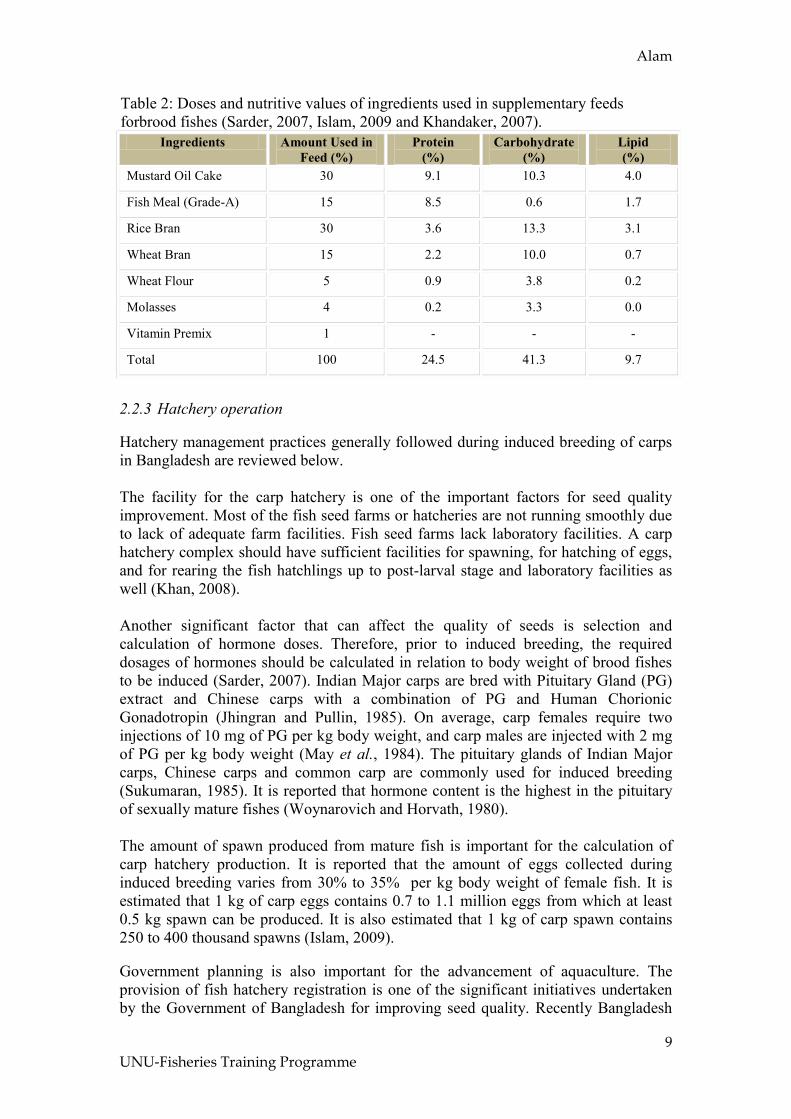
The ingredients of supplementary feed used for feed formulation in Bangladesh
contain different amount of nutrients. Doses and nutritive values of ingredients used
for fish feed formulation are shown in Table 2.
Alam
9
UNU-Fisheries Training Programme
Table 2: Doses and nutritive values of ingredients used in supplementary feeds
forbrood fishes (Sarder, 2007, Islam, 2009 and Khandaker, 2007).
Ingredients Amount Used in
Feed (%)
Protein
(%)
Carbohydrate
(%)
Lipid
(%)
Mustard Oil Cake 30 9.1 10.3 4.0
Fish Meal (Grade-A) 15 8.5 0.6 1.7
Rice Bran 30 3.6 13.3 3.1
Wheat Bran 15 2.2 10.0 0.7
Wheat Flour 5 0.9 3.8 0.2
Molasses 4 0.2 3.3 0.0
Vitamin Premix 1 - - -
Total 100 24.5 41.3 9.7
2.2.3 Hatchery operation
Hatchery management practices generally followed during induced breeding of carps
in Bangladesh are reviewed below.
The facility for the carp hatchery is one of the important factors for seed quality
improvement. Most of the fish seed farms or hatcheries are not running smoothly due
to lack of adequate farm facilities. Fish seed farms lack laboratory facilities. A carp
hatchery complex should have sufficient facilities for spawning, for hatching of eggs,
and for rearing the fish hatchlings up to post-larval stage and laboratory facilities as
well (Khan, 2008).
Another significant factor that can affect the quality of seeds is selection and
calculation of hormone doses. Therefore, prior to induced breeding, the required
dosages of hormones should be calculated in relation to body weight of brood fishes
to be induced (Sarder, 2007). Indian Major carps are bred with Pituitary Gland (PG)
extract and Chinese carps with a combination of PG and Human Chorionic
Gonadotropin (Jhingran and Pullin, 1985). On average, carp females require two
injections of 10 mg of PG per kg body weight, and carp males are injected with 2 mg
of PG per kg body weight (May et al., 1984). The pituitary glands of Indian Major
carps, Chinese carps and common carp are commonly used for induced breeding
(Sukumaran, 1985). It is reported that hormone content is the highest in the pituitary
of sexually mature fishes (Woynarovich and Horvath, 1980).
The amount of spawn produced from mature fish is important for the calculation of
carp hatchery production. It is reported that the amount of eggs collected during
induced breeding varies from 30% to 35% per kg body weight of female fish. It is
estimated that 1 kg of carp eggs contains 0.7 to 1.1 million eggs from which at least
0.5 kg spawn can be produced. It is also estimated that 1 kg of carp spawn contains
250 to 400 thousand spawns (Islam, 2009).
Government planning is also important for the advancement of aquaculture. The
provision of fish hatchery registration is one of the significant initiatives undertaken
by the Government of Bangladesh for improving seed quality. Recently Bangladesh
Alam
10
UNU-Fisheries Training Programme
passed Fish Hatchery Act 2010 (GoB, 2010). It states that no hatcheries can operate
without registration. Further, hatcheries cannot apply hybridization technique, except
government-authorized Fish Research and Extension Centre or Organizations.
Moreover, every hatchery must take initiative during induced or artificial breeding to
stop inbreeding in fish.
2.2.4 Nursery management
Nursery management is an integral part of a fish seed production farm. The significant
aspects of nursery management are reviewed here.
The management of nursery ponds is an important part of fish seed production to
improve the survival rate, growth rate and health of fish fry (Jhingran and Pullin,
1985). There are two types of ponds in Bangladesh: seasonal and perennial ponds. In
general, preparation of seasonal ponds is started through pond drying. Perennial ponds
are prepared through dewatering or applying poisons such as Rotenone, Phostoxin,
etc. After drying or poisoning, lime is applied at 1-2 kg per decimal and cow-dung at
5-7 kg per decimal. In addition, inorganic fertilizers viz., urea and triple super
phosphate (TSP) are also used. Insecticides, for example, Dipterex or Sumothion are
used for removing insects 24 hours before spawn release.
The stocking of nursery ponds varies with nursing stages. In single-stage nursing, the
stocking density is maintained at 1.0 to 2.0 million spawns per hectare and 2-3 inch-
sized fingerlings are obtained within 4 to 6 weeks. In two-stage nursing, hatchlings
are stocked with a density of 6.0 million per hectare. Then the fries are reared for
about 6 to 8 weeks for growing up to 2 to 3 inch-sized fingerlings (Sarder, 2007).
The proper feeding of fish fry is vital for quality. During nursing, spawns should be
provided with boiled-egg yolks for 2-3 days and then overnight wet mustard oil cake
mixed with fishmeal should be supplied for the next 7 days. After that a common
supplementary feed consisting of 25-30% protein are allocated at 5% body weight
(Khan, 2008). Regular fertilization with TSP and urea is performed at 25 and 50
kg/ha/month, respectively (Sarder, 2007). The survival rate of spawn is found to be
32% during fingerling production by fry traders (Rahman et al., 1987).
2.3 Review of environmental factors
It is of great concern to prevent pollution of the environment. Aquaculture can be
harmful to the environment if it is not properly planned and managed. To that end
national and overseas organizations have formulated various acts and rules. According
to the Rule for the Conservation of the Environment of 1997, establishment of farms
or companies in ecologically critical areas such as mangroves, game reserves,
marshes, and forest areas is restricted (GoB, 1997). Similarly, the provisions of the
Bangladesh Environment Act of 1995 are directed to protect the environment from
any pollutants (GoB, 1995).
According to the Bangladesh Environment Act of 1995, ‘pollution’ means the
contamination or alteration of the physical, chemical or biological properties of air,
water or soil; and ‘waste’ means any solid, liquid, gaseous, radioactive substance, the
discharge, disposal and dumping of which may result in harmful change to the

Alam
11
UNU-Fisheries Training Programme
environment (GoB, 1995). According to Khan (2008) hatcheries should have
necessary treatment facilities which could facilitate the treatment of wastewater
produced during the production period. Effluents should be discharged from
hatcheries in a manner so that it could not pollute the environment. Hatcheries should
have an internal composting facility in order to process the solid waste.
Moreover, the Food and Agriculture Organization (FAO, 2008) developed
Aquaculture Certification Guidelines to avoid possible hazards to the environment
from aquaculture farms. According to the guidelines, aquaculture should ensure the
health and welfare of farmed fishes. Management should be aimed to reduce stress,
optimize health, reduce disease risks and maintain a healthy environment during all
phases of the culture system (FAO, 2008). The guidelines also mention that fish
farming should be conducted in a socially responsible manner, which will abide by
the state rules and regulations beneficial to the employees, farmers, local people,
investors and the state. Therefore, it is important to investigate the environmental
parameters available at the site before farm construction to make it successful
(Jhingran and Pullin, 1985).
3 MATERIALS AND METHODS
3.1 Collection and review of data
Secondary data and information on carp seed production in Bangladesh were collected
and reviewed from different sources, i.e., printed documents, online documents and
publications, etc. Other information was also collected by the author based on his
personal experience with carp seed production in Bangladesh.
3.2 Estimation of cost and main assumptions
The cost of operations was estimated using the Three Point Method (TPM), which
includes the following formulations:
The expected value of each cost item was calculated as:
The standard deviation of each cost item was found by:
The variance of each cost item was then found as:
Where, t=expected value, a=optimistic value, m=most likely value, p=pessimistic
value, s=standard deviation and v=variance.

Alam
12
UNU-Fisheries Training Programme
Then the standard deviation of the total cost was calculated as the square root of the
total variance. Finally, the total cost was estimated using the following formula,
Where, Z was determined as 1.65 at the confidence level (95%) using the standardized
normal distribution.
3.3 Financial feasibility study
The financial feasibility of the carp seed farm was studied through the development of
a Profitability Assessment Model. The main components performed for the
profitability model (Jensson, 2006) are shown in Figure 4. Each component was
implemented in a separate Excel sheet in the same workbook. In this case study, it
was assumed one year of construction and investment and 10 years of operational
lifetime.

Alam
13
UNU-Fisheries Training Programme
Figure 4: The main components of the Profitability Assessment Model (Jensson,
2006).
Then, profitability of the carp seed production farm was analysed by using the results
of investment. The following measures were used as indicators for analysing
Financial Feasibility in the model.
3.3.1 Net Present Value (NPV)
The Net Present Value with a 10% discount factor was calculated for the cash flow
series: i) total capital invested and cash flow after taxes and ii) equity and net cash
flow. NPV was calculated for all years through the lifetime. The formula for
calculating NPV is:
Where,
An = Net cash flow at the end of period n, i = Marginal Attractive Rate of
Return and N = Planning horizon of the project.
Investment & Financing
Investment
Depreciation
Financing
Graphs and Charts
Profitability (NPV, IRR)
Financial Ratios
Cost Breakdown
Cash Flow
Operating Surplus
Paid Taxes
Repayment & Interest Paid
Dividend
Balance Sheet
Assets
Debt
Equity
Profitability Measures
Project, Equity:
Net Present Value
Internal Rate of Return
Operating Statement
Revenue & Costs
Taxation
Appropriation of Profit
Investment Revenue and Costs
Repayment Interest
Interest
Depreciation
Taxes
Dividend
Net Profit
or Loss
Stock
Cash Flow
IRR
NPV
Financial
Ratios
Cash
Movements
Working Capital
Assumptions Summary
Investment
Revenue
Operating Costs
Results and Sensitivity
Scenario Summary
Sensitivity Chart

Alam
14
UNU-Fisheries Training Programme
3.3.2 Internal Rate of Return (IRR)
The Internal Rate of Return was estimated for the cash flow series: i) total capital and
cash flow after taxes and ii) equity and net cash flow. The IRR was calculated using
the Excel built-in formula for all years through the lifetime. As it is stated by Park
(2002), the decision rule for a simple project is: if , the project is
accepted; if , it remains indifferent; and if , the project is
rejected.
3.3.3 Modified Internal Rate of Return (MIRR)
Modified Internal Rate of Return is a measure which provides a different and more
accurate measure of financial feasibility. The decision rule for MIRR is: if , the project is accepted; if , it remains
indifferent; and if , the project is rejected.
3.3.4 Financial ratios
Financial ratios were calculated to assess the risk of the investment. The following
financial ratios were analysed in this study.
Liquid Current Ratio is a liquidity ratio which shows the relationship between liquid
assets and current liabilities. The formula for the liquid current ratio is:
Return on Investment (ROI) is a profitability ratio which measures the performance
of the capital involved. The formula for the return on investment is:
Return on Equity (ROE) is a profitability ratio which represents the rate of return to
shareholders’ equity. The higher ratio presents the more efficient use of the investors’
equity.The formula for the return on equity ratio is:
Internal value of shares is a market trend ratio which describes the relationship
between equity and capital. The formula for the internal value of shares is:
Debt Service Coverage Ratio (DSCR) is a cash flow ratio showing the cash
available for paying the interest and repayments of loans which is used by financiers

Alam
15
UNU-Fisheries Training Programme
to assure that the borrowers will have sufficient funds to pay the debts. The formula
for Debt Service Coverage Ratio is:
Loan Life Coverage Ratio (LLCR) is one of the most commonly used debt ratios
which considers the whole lifetime of the loan, not just year-to-year bases like the
DSCR. The formula for the Loan Life Coverage Ratio is:
3.4 Risk analysis
Risk analysis was performed in different ways for exploring and better understanding
the effects of uncertainties. These are as follows:
3.4.1 Impact Analysis
Impact Analysis was performed using one uncertain item at a time, for example, sales
price, sales quantity, cost of equipment and cost of building. To facilitate this, so-
called impact factors, which were used on Assumptions Summary sheet (Appendix 2)
of Profitability Model, were inserted as the default value 100%. These were
multiplied with the uncertain items. Then the Data Table in Excel What-if Analysis
was applied in order to analyse the results such as Internal Rate of Return on Equity
for a range of impact factors, for instance, from 50% to 150%. The same process was
followed for each of the uncertain items.
3.4.2 Scenario Analysis
Scenario Analysis deals with simultaneous changes in more than one uncertain item.
The Scenario Manager of Excel What-if Analysis was used for this purpose. The
changing cells were selected and their values for each scenario, for example, the costs
of buildings, equipment, sales price and sales quantity were examined in both the best
case and the worst case. The scenarios were named, for example, Optimistic Scenario
and Pessimistic Scenario, respectively. In this study, the IRR of Equity was selected
as a Result cell.
3.4.3 Monte Carlo Simulation
Monte Carlo Simulation is the most advanced method of the sensitivity analysis. The
Excel software @Risk was used for this purpose. This simulation tool allowed
specifying a probability distribution for each of the uncertain items. The built-in
random number generators tool was then used to make as many observations of these
items as found necessary. As it is described by Albright and Winston (2009), the
random numbers and the number of simulations were set to 1000 and 1 respectively,
and then the simulation was run as usual. The result was a histogram of a selected
output item, in this case the IRR of Equity. It was decided that IRR=10% was critical,
i.e. values under this threshold were considered insufficient. Further, the sensitivity of

Alam
16
UNU-Fisheries Training Programme
all cost items was estimated by using correlation coefficients (Spearman Rank)
through @Risk software and the result was a Tornado Chart.
3.5 Analysis of technical feasibility
Initially, the carp breeding technology was reviewed using information on existing
practices collected from literatures. Then, the process flows of recommended
practices necessary to improve the quality of seeds were incorporated as shown in
Figure 5, Figure 6 and Figure 7. Finally, the technical feasibility was studied
considering the possible outcomes of the selective breeding programme and
possibility to overcome the weaknesses of the existing technologies followed, such as
brood stock management, hatchery operation and nursery management.
River Source
A
Pond Dike & Bottom
Repairing
Pedigree Recording
Marking/Tagging
Application of Lime
Application of Fertilizers
Removal of Aquatic Weeds
& Shrubs
River Source
B
Hatchery
Source B
Hatchery
Source A
Sources of
Brood Fish
Transportation of Brood
Fishes
Monitoring of
Fish Health
Application of
Supplementary Feed
Monitoring of
Water Quality
Application of
Fertilizers
Matured Fish for
Breeding
Pond Preparation
Stocking in Pond
Post Stocking
Management
Figure 5: Process flow chart of brood stock management.

Alam
17
UNU-Fisheries Training Programme
Ovary
Figure 6: Process flow chart of hatchery operation (modified from Ahmed, 2005).
Testis
Favourable Environment
in Pond
Gonad otropin
Releasing Hormone
Fertilized
Eggs
Blo
od
Cir
cula
tio
n
Go
nad
otr
op
in
Ho
rmo
ne
Estrogen Hormone
Release of Eggs
Androgen Hormone
Release of Milts
Hatchery having
Favourable Environment
Hypothalamus
Activate
Breeding Plan or Selection
of Brood Fish
Transportation of Brood
Fish
Calculation & Preparation of
Inducing Agents
Injection of Inducing
Agents to Fishes
Pituitary Gland
Temperature
Light Rainfall
Hatching of Eggs
Rearing of Larvae
Sale/Stocking of Spawns

Alam
18
UNU-Fisheries Training Programme
3.6 Analysis of environmental feasibility
The environmental considerations for establishing of the carp seed production farm
were analysed using the information based on Draft FAO guidelines for aquaculture
certification (FAO, 2008), DoF Proposed Guidelines on Genetic Improvement of Carp
Seeds and Brood Stock Management (Khan, 2008) and Fish Hatchery Act 2010 (GoB,
2010). The possible impact of a carp seed production farm on surrounding
environment was analyzed. On the other hand, environmental factors affecting the
success of quality carp seed production were also considered during the study.
Post Stocking
Management
Removal of
Insects
Pond
Preparation
Conditioning & Release
of Spawns
Selection of Stocking
Density
Monitoring of
Fry Health
Application of
Supplementary Feed
Monitoring of Water
Quality
Application of
Fertilizers
Single Stage
Stocking
Double Stage
Stocking
Selection of Stocking
Density
Conditioning &
Release of Spawns
Post Stocking
Management
Fingerlings
for Sale
Figure 7: Process flow chart of nursery management
Alam
19
UNU-Fisheries Training Programme
4 RESULTS
4.1 Cost estimation and main assumptions
Initially, the costs and assumptions for investment in a carp seed production farm are
estimated on the basis of planned project dimension. It is assumed that the planned
farm will be established in 10 hectares of land having 15 brood fish ponds of 0.5
hectare area each and 5 nursery ponds of 0.2 hectare area each. Besides, the farm will
comprise of a hatchery complex and adequate infrastructural facilities. The costs
involved with the establishment are divided into three groups such as investment
costs, variable costs and fixed costs. Further, investment costs comprise of cost of
buildings, equipment and others. Similarly, variable costs and fixed costs are also
divided into different cost items. Then the most likely costs in the optimistic and
pessimistic case for each item are assumed on the basis of reviewed (Chapter 2)
quantity and unit price of items required for the establishment and operation of the
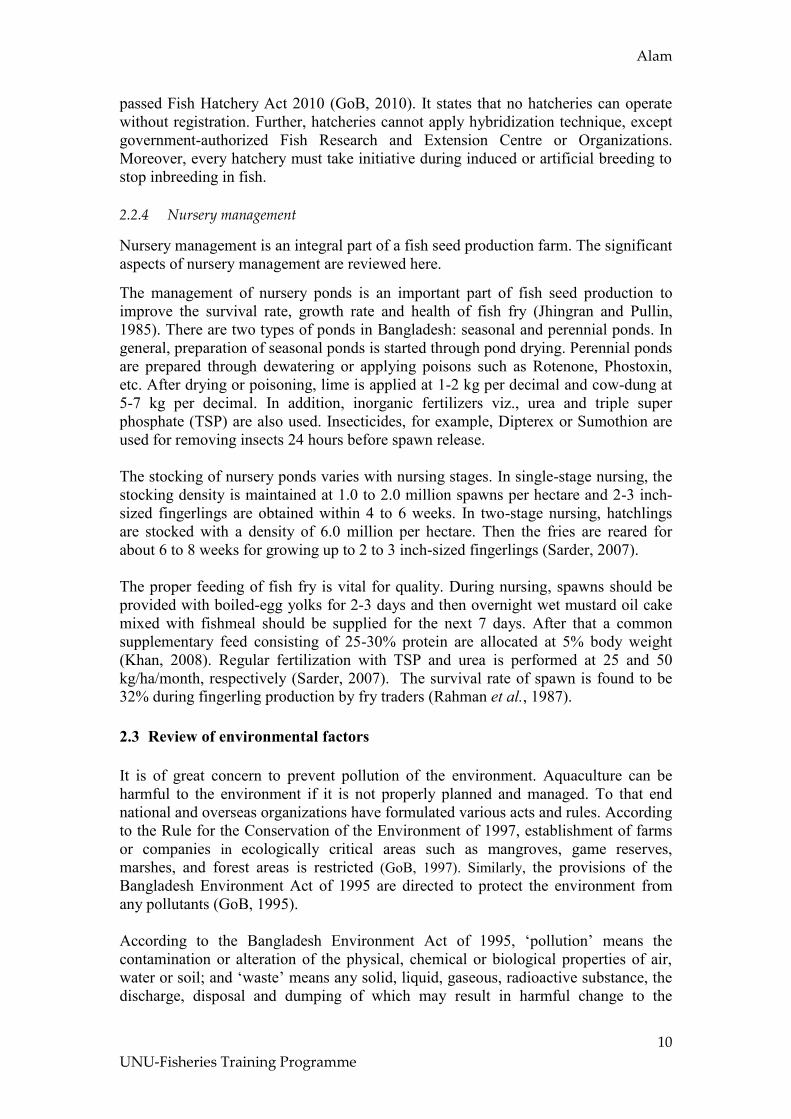
farm. Finally, the costs of each item are estimated using the Three Point Method
(Appendix 1). The estimation of building costs using Three Point Method is shown
below:
Figure 8: A beta probability distribution (or triangular) of cost estimation.
Here, the optimistic value of building is a=8.3 MBDT; the pessimistic value is b=11.5
MBDT; the most likely value is m=10 MBDT and at 95% confidence level, Z=1.65.
Thus, the total expected value (t) of buildings is calculated as about 10 MBDT using
the following formula:
=10 MBDT
The variance of the buildings is estimated as 0.10, thus the standard deviation is the
square root of variance, i.e. 0.31. Finally, the total building cost is calculated by
adding the standard deviation multiplied by 1.65 with the expected value. It gives a
higher value than the expected value, which is 10.5 MBDT. Similarly, other costs are
estimated following the same method.
The results of the cost estimation are shown in Table 3. Other operational costs
presumed are also shown in Table 4.
Table 3: Assumptions of investment and operational costs.
Probability
Values
a m b

Alam
20
UNU-Fisheries Training Programme
Item of Cost Amount
Investment
Buildings 10.5 MBDT
Equipment 2.0 MBDT
Other 0.5 MBDT
Variable Costs (MBDT/mt) 0.50
Labour 0.08
Suplementary Feed 0.35
Fertilizers 0.03
Inducing Agents 0.03
Chemicals 0.005
Other 0.005
Fixed Costs (MBDT/year) 0.50
Maintenance 0.25
Insurance 0.05
Management 0.1
Sales 0.05
Other 0.05
Financing
Equity 30%
Loans 70%
Loan Repayments 6 Years
Interest 13%
Loan Management Fees 2%
Depreciation
Depreciation Buildings 4%
Depreciation Equipment 15%
Depreciation Other 20%
Working Capital (MBDT) 2.0
Inventory (MBDT)-Brood Stock 2.0
Income Tax Nil
Dividend 20%

Alam
21
UNU-Fisheries Training Programme
Table 4: Other operational assumptions.
Components Amount
Total Farm Area 10 hectares
A. Spawn Production
Pond Used 15 Nos. (0.5 hectare each)
Total Brood fish used 15 mt
Stocking Density of Brood Fish 2 mt/hectare
Price of Brood fish (2-3 years old) 120 BDT/kg
Application of Supplementary Feed 2% body weight
Price of Supplementary Feed 25 BDT/kg
Spawn (2-3 days old) Production > 50% body weight of female brood fish
Spawn (2-3 days old) Production 125 kg/week
Period of Production 10 months/year
B. Fingerling (3-5 cm) Production
Pond Used 5 Nos.(0.2 hectare each)
Stocking with Spawn 5 kg/hectare
Fingerling (3-5 cm) Production 2.5mt/hectare/cycle
Length of Cycle 2 months
No. of Cycle 2 per year
Alam
22
UNU-Fisheries Training Programme
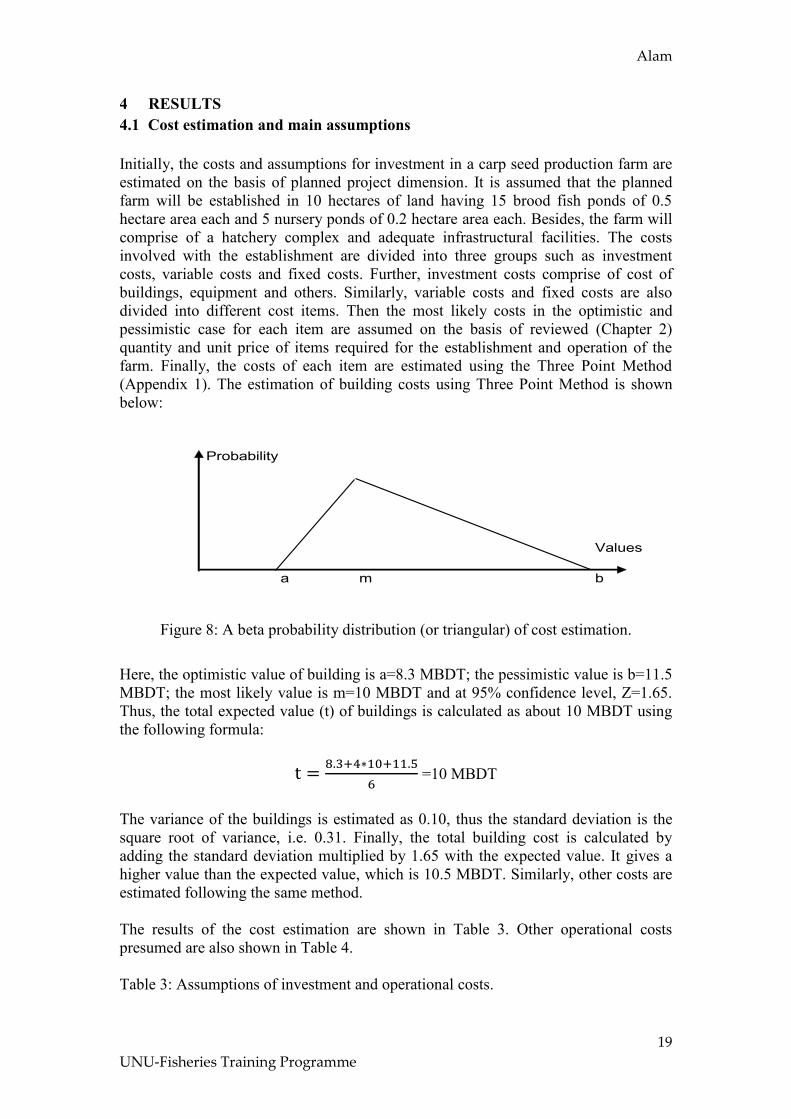
4.2 Market plan
The market plan is anticipated on the basis of production capacity of the suggested
farm and the existing price of carp seeds reviewed in Chapter 2. Finally, the sales and
prices are presumed for the five production years and are shown in Table 5.
Table 5: Market plan of sales and revenues from 2011 to 2015.
Item Year of Operation
2011 2012 2013 2014 2015
Sales of Spawn
(mt)
4 5 5 6 6
Price (MBDT/mt) 2.0 2.5 2.7 2.0 2.0
Sales of Fingerling
(mt)
5 5 5 5 5
Price (MBDT/mt) 0.2 0.2 0.2 0.2 0.2
Average Revenue
(MBDT/mt)
1.00 1.35 1.45 1.25 1.25
4.3 Financial analysis
Financial analysis is an integral part of the feasibility study. The financial analysis of
the proposed venture is performed using the Profitability Model which is a simulation
model of an initial investment and subsequent operations. The main components of
the model developed during the study are shown in Figure 4. Each element of the
model is executed in a separate Excel sheet in the same workbook. The results of each
component are shown in below.
4.3.1 Assumptions summary
The assumptions summary accumulates all necessary information and assumptions of
the project estimated, which are needed for the financial feasibility. It is stated that all
subsequent components are based on it and contain only formulas but no direct input
cells at all. All input cells of the assumptions summary (Appendix 2) are coloured
with blue. Assumptions generally comprise of sales and revenues (Table 5) and all
associated expenses, such as investment costs, financing, working capital, taxes,
depreciation rates, dividend payments (Table 3), variable and fixed costs (Table 3),
the Marginal Attractive Rate Return (MARR) and equity of the project. The working
capital, which is the capital needed to pay short-term debts and continue operations,
which is 2 MBDT determined by looking at the cash account of the cash flow
(Appendix 6) that cannot be negative. The MARR of the project, which is 10%, is
determined on the basis of the inflation rate of Bangladesh. The summary also
contains the planning horizon of the project. In this study, it is planned as 10 years.
An additional assumption sheet has been used in the study case for details of
Investment and Operational Costs (Appendix 1).

Alam
23
UNU-Fisheries Training Programme
4.3.2 Investment and financing
The investment and financing component calculates the financial need of the venture,
which includes the investment, depreciations and financing of the project (Appendix
3). First, there is the assumed breakdown of the investment cost into buildings,
equipment and other investment. The investment, which is copied from the
assumptions summary and estimated as 13 MBDT in the year of establishment, 2010,
which will reduce up to about 6.5 MBDT in 2020 due to depreciations. Depreciation
is calculated mainly with the purpose of getting an accurate estimate of income tax.
The equity is determined as 30% of the total project financing, which is 15 MBDT,
whereas loans comprise 70%. The loan is payable by 6 years with a year grace period.
The interest of the loans is firmed as 13% on the basis of bank loan interest rate in
Bangladesh with a loan management fee of 2%.
4.3.3 Operating statement
The operating statement (Appendix 4) represents the performance of the project in
each period, i.e. it reveals the profit or loss generated by the project. The purpose of
the component is to calculate the revenue and costs annually, which are then used to
calculate the EBITDA (Earnings Before Interests, Taxes, Depreciation and
Amortization), which is 2 MBDT in the first year of operation. EBT (Earnings Before
Taxes) is then calculated as about 2 MBDT by subtracting interest expenses,
depreciation and amortization from the EBITDA. In this case study, profit before tax
is equivalent to profit after tax as aquaculture of Bangladesh is exempted from tax
except corporation (NBR, 2010). In the case study, the total dividend, which is called
appropriation of profit, is 20% of the profit after tax. Finally, the net profit is
calculated as 1.5 MBDT after appropriation, which is added to the profit and loss
balance on the balance sheet.
4.3.4 Balance sheet
The balance sheet (Appendix 5) gives a more complete picture to be able to follow the
forecasted development, which includes total assets and debts and capital. In this case
study, total assets is calculated as 15 MBDT in the year of establishment, 2010, and
57 MBDT in 2020. The debts and capital is also calculated as same as the total assets
which verifies no logical errors. Thus, the balance sheet is used as a verification tool
between total assets and total debt and capital. Moreover, financial ratios are also
calculated on the basis of the data on the balance sheet, which are presented
graphically in Figure 12, Figure 13 and Figure 14.
4.3.5 Cash flow
The cash flow (Appendix 6) represents the actual cash flows of the project, i.e. the
incoming and outgoing flow of cash and cash equivalents to and from the farm
respectively. The cash flow calculation originates with the operating surplus copied
from the operating statement. Debtor and creditor changes are calculated on the basis
of debtors and creditors on the balance sheet, giving cash flow before taxes. It is
stated that debtor and creditor changes cannot be calculated until the balance sheet is
ready. Cash flow after tax and before tax is equal as there is no income tax in the

Alam
24
UNU-Fisheries Training Programme
planned project. Then, free or net cash flow is calculated by subtracting interest and
repayment. Finally, cash movements are found by adding working capital with net
cash flow after paying the dividend. In the study case, the cash movement will be
negative only in the first year of operation, i.e. 2011 but positive in the other years
including the establishment year. The cash movement is the highest, which will be
more than 6 MBDT, in the year of 2020. The cash movements are then added to the
cash account on the balance sheet.
4.3.6 Source and allocation of funds
An alternative method of cash flow analysis is the “Source and Allocation of Funds”
(Appendix 7). This approach comprises three sections: source of funds, allocation of
funds and changes in net current assets. The first section represents the generation of
cash from different sources such as operations, drawdown of loan and equity. The
second section, allocation of funds, calculates the total allocation. Similarly, the final
section, analysis of changes, includes current assets and liabilities. According to the
analysis, the total funds for allocation is calculated as approximately 15 MBDT and
the total allocation is 13 MBDT in the year of investment. Thus, changes in net
current assets are estimated by subtracting the total allocation from the funds for
allocation, which is about 2 MBDT in 2010. Likewise, changes in net current assets
are computed by subtracting liabilities from changes in current assets, which is also
approximately 2 MBDT in the year of investment. Thus, changes in net current assets
are found to be similar in both methods of calculation for all the years of the project
lifetime, which represents the accuracy of cash balance.
4.3.7 Profitability measures
The component profitability measures (Appendix 8) estimates the profitability of the
investment. The most important measures used in this model are the Net Present
Value (NPV) with a 10% discounting factor and the Internal Rate of Return (IRR).
These measures are calculated for the following cash flow series:
i) Total Cash Flow and Capital
ii) Net Cash Flow and Equity
In general, both the total cash flow and capital and net cash flow and equity will
increase up to 8 MBDT during the operation period (Figure 9). The total cash flow
and capital will be negative only in the year of project construction, after that it will
gradually increase up to 9 MBDT in 2013. After that there is a slight drop in the next
year and then it remains constant at 8 MBDT for the rest of the operation period. On
the other hand, net cash flow and equity will be negative in the year of farm
establishment and the first year of production. After that it will moderately increase
up to 8 MBDT in the year 2018 and will reach a plateau for rest of the project period.

Alam
25
UNU-Fisheries Training Programme
Figure 9: Cash flow series of a carp seed production farm from 2010 to 2020.
Net Present Value (NPV)
The NPV of total cash flow and net cash flow are measured with a 10% discounting
factor for all the years of the project lifetime and the results are shown in Figure 10.
The NPV of total cash flow as well as NPV of net cash flow will rise steadily
throughout the project lifetime (Figure 10). The NPV of total cash flow will be
negative for the initial 4 years up to 2013 but it will gradually increase during the
operation period passing parallel just over the NPV of net cash flow after 2016. The
NPV of total cash flow will be at its maximum, which will be 26 MBDT, in 2020. On
the other hand, NPV of net cash flow will be much higher than NPV of total cash flow
in 2010, being negative up to 2012, but it will maintain a moderate growth to reach
the highest value of 25 MBDT in 2020. As can be seen, the discounted payback
period will be below 4 years on the basis of accumulated NPV of total cash flow.
Figure 10: Accumulated Net Present Value from 2010 to 2020.
-20
-15
-10
-5
0
5
10
2010 2011 2012 2013 2014 2015 2016 2017 2018 2019 2020
MB
DT
Year
Total Cash Flow & Capital
Net Cash Flow & Equity
-20
-15
-10
-5
0
5
10
15
20
25
30
2010 2011 2012 2013 2014 2015 2016 2017 2018 2019 2020
MB
DT
NPV Total Cash Flow
NPV Net Cash Flow

Alam
26
UNU-Fisheries Training Programme
4.3.7.1 Internal Rate of Return (IRR)
The IRR of total cash flow and IRR of net cash flow are computed for the whole
project period using Excel’s built in IRR formula and the results are presented in
Figure 11.
Both IRR of total cash flow and NPV of net cash flow will climb exponentially over
the project period (Figure 11). No IRR of total cash flow will be found during the
early 3 years up to 2012, but after that it will follow an increasing trend for the rest of
the planned period to reach the maximum IRR of 37% in 2020. Likewise, IRR of net
cash flow will be well over the IRR of total cash flow from the fourth year through the
rest of the operation period. It will grow exponentially from 2012 having the highest
value of 60% in 2020.
Figure 11: IRR of total cash flow and IRR of net cash flow from 2010 to 2020.
4.3.7.2 Financial ratios
Financial ratios are determined to assess the profitability and the risk of investment.
The results of some important financial ratios are presented in Figure 12, Figure 13
and Figure 14.
In particular, the Liquid Current Ratio (LCR) gradually escalates throughout the
operation life (Figure 12). LCR will be just over 1 in 2011, the first year of operation.
Then it will slightly grow in the next 5 years to reach more than 6 in 2016. After that,
it will rise gradually to reach the peak in 2020, which will be 21. In the instance of the
study case, the acceptable minimum is decided as 1.5.
0%
10%
20%
30%
40%
50%
60%
70%
2010 2011 2012 2013 2014 2015 2016 2017 2018 2019 2020
Year
IRR Total Cash Flow
IRR Net Cash Flow
Alam
27
UNU-Fisheries Training Programme
Figure 12: Cash flow ratios of the project from 2010-2020.
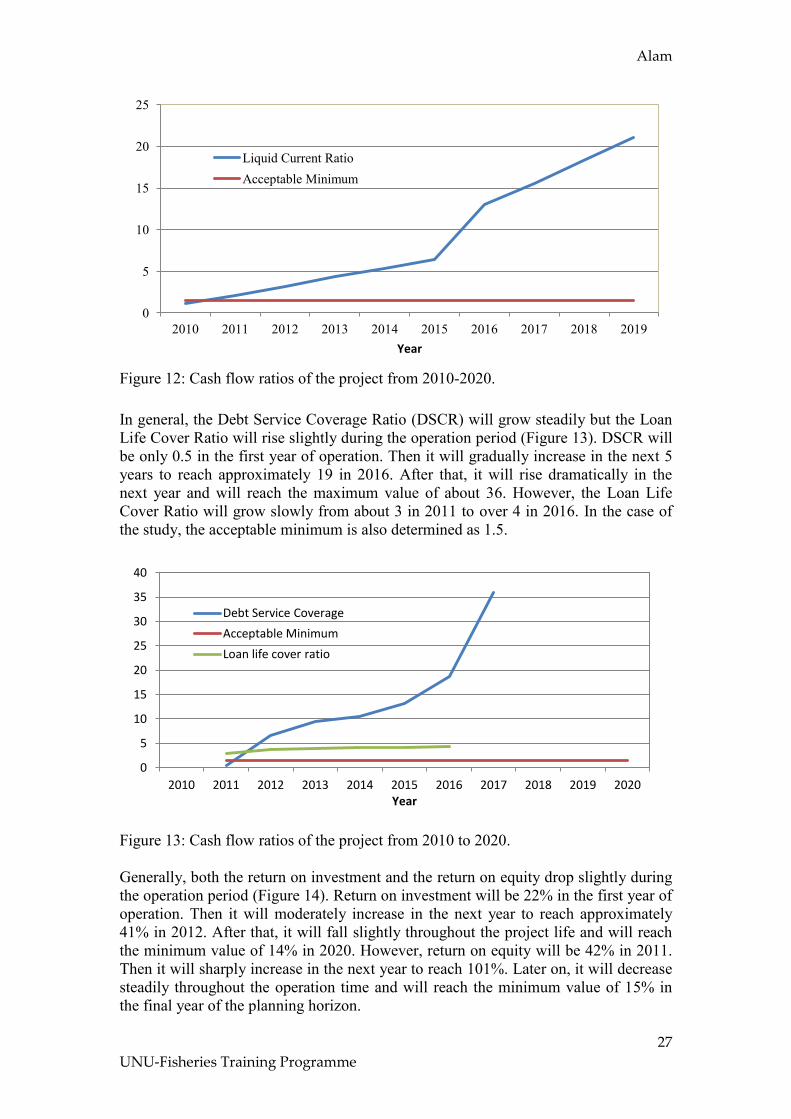
In general, the Debt Service Coverage Ratio (DSCR) will grow steadily but the Loan
Life Cover Ratio will rise slightly during the operation period (Figure 13). DSCR will
be only 0.5 in the first year of operation. Then it will gradually increase in the next 5
years to reach approximately 19 in 2016. After that, it will rise dramatically in the
next year and will reach the maximum value of about 36. However, the Loan Life
Cover Ratio will grow slowly from about 3 in 2011 to over 4 in 2016. In the case of
the study, the acceptable minimum is also determined as 1.5.
Figure 13: Cash flow ratios of the project from 2010 to 2020.
Generally, both the return on investment and the return on equity drop slightly during
the operation period (Figure 14). Return on investment will be 22% in the first year of
operation. Then it will moderately increase in the next year to reach approximately
41% in 2012. After that, it will fall slightly throughout the project life and will reach
the minimum value of 14% in 2020. However, return on equity will be 42% in 2011.
Then it will sharply increase in the next year to reach 101%. Later on, it will decrease
steadily throughout the operation time and will reach the minimum value of 15% in
the final year of the planning horizon.
0
5
10
15
20
25
2010 2011 2012 2013 2014 2015 2016 2017 2018 2019
Year
Liquid Current Ratio
Acceptable Minimum
0
5
10
15
20
25
30
35
40
2010 2011 2012 2013 2014 2015 2016 2017 2018 2019 2020 Year
Debt Service Coverage
Acceptable Minimum
Loan life cover ratio
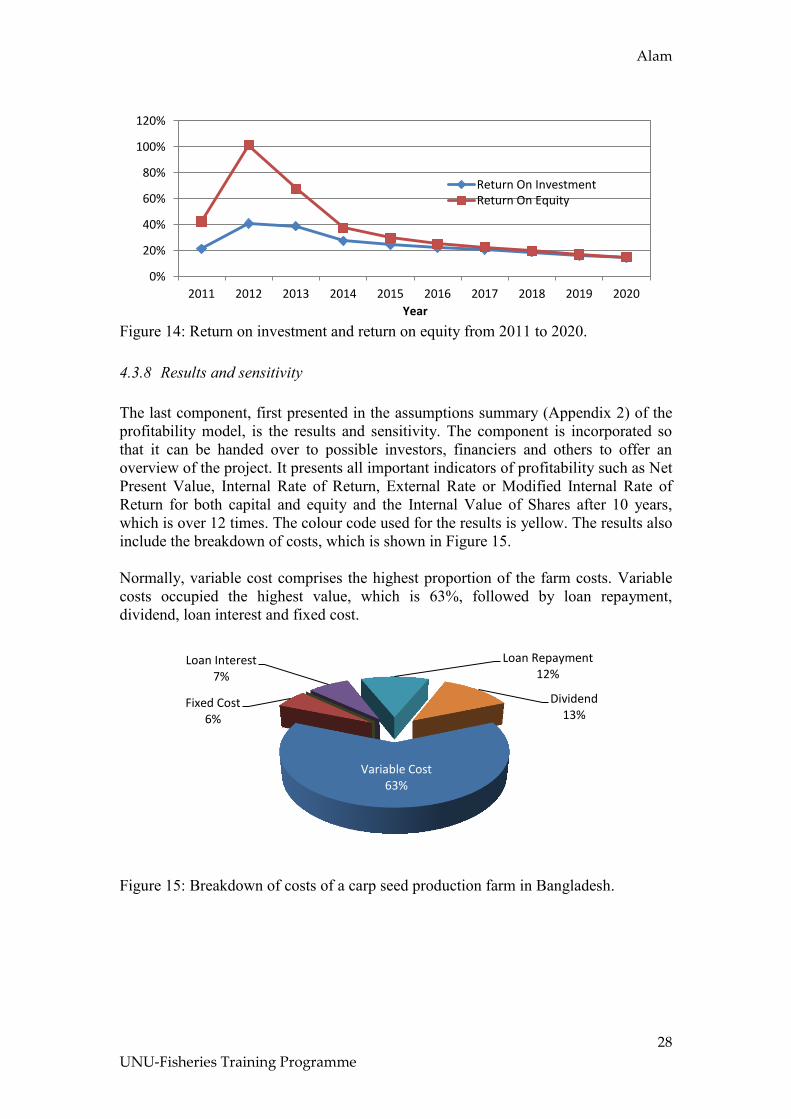
Alam
28
UNU-Fisheries Training Programme
Figure 14: Return on investment and return on equity from 2011 to 2020.
4.3.8 Results and sensitivity
The last component, first presented in the assumptions summary (Appendix 2) of the
profitability model, is the results and sensitivity. The component is incorporated so
that it can be handed over to possible investors, financiers and others to offer an
overview of the project. It presents all important indicators of profitability such as Net
Present Value, Internal Rate of Return, External Rate or Modified Internal Rate of
Return for both capital and equity and the Internal Value of Shares after 10 years,
which is over 12 times. The colour code used for the results is yellow. The results also
include the breakdown of costs, which is shown in Figure 15.
Normally, variable cost comprises the highest proportion of the farm costs. Variable
costs occupied the highest value, which is 63%, followed by loan repayment,
dividend, loan interest and fixed cost.
Figure 15: Breakdown of costs of a carp seed production farm in Bangladesh.
0%
20%
40%
60%
80%
100%
120%
2011 2012 2013 2014 2015 2016 2017 2018 2019 2020
Year
Return On Investment Return On Equity
Variable Cost 63%
Fixed Cost 6%
Loan Interest 7%
Loan Repayment 12%
Dividend 13%

Alam
29
UNU-Fisheries Training Programme
4.4 Risk analysis
Risk analysis was performed using three methods: impact analysis, scenario analysis
and Monte Carlo simulation. The results of the sensitivity analysis are shown as
follows:
4.4.1 Impact analysis
Impact analysis was accomplished using one uncertain item at a time, for example
sales price, sales quantity, cost of equipment or cost of building. The results of the
impact analysis for each of the uncertain items are shown in Figure 16.
Generally, the increase of sale price and production tends to increase the IRR of
equity, but the opposite is true for the equipment and building costs (Figure 16). The
calculated value of IRR of equity is 60%. In response to an increase of sales price up
to 50% the IRR of equity grows up to 134%, and in response to a decrease of 40% it
falls to 0%. As can be seen, the IRR of equity decreases up to 14% with the decrease
of sales price by 30%. Similarly, in the case of production the IRR of equity rises to
101% in response to an increase by 50% and it drops up to 14% with a decrease of
50%. On the other hand, due to the increase of building costs up to 50% the IRR of
equity goes down to 41%, and with a decrease of 50% it goes up to 93%. Likewise, in
case of equipment, the IRR of equity drops up to 55% due to an increase by 50% and
it rises up to 64% with a decrease of costs by 50%.
Figure 16: Impact analysis of IRR of equity.
4.4.2 Scenario analysis
Scenario analysis was done using the scenario manager of Excel’s what-if analysis.
Changing the cells and their values for each scenario, for example, the costs of
buildings and equipment are calculated in the best case 80% of the base estimate but
120% in the worst case. Similarly, the values of sales quantity and sales price are
calculated in the optimistic case 120% of the base estimate but 80% in the worst case.
The results of the scenario analysis are shown in Table 5.
0%
20%
40%
60%
80%
100%
120%
140%
160%
-50% -40% -30% -20% -10% 0% 10% 20% 30% 40% 50%
Buildings
Equipment
Sales Price
Sales Quantity
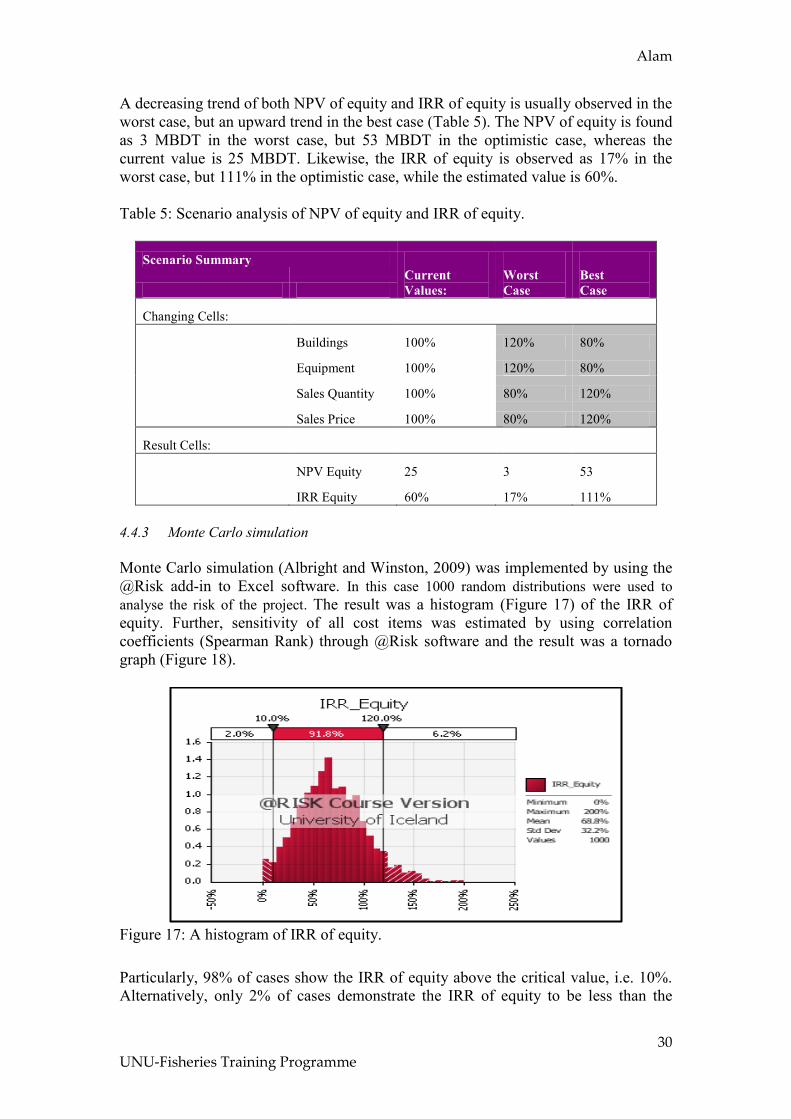
Alam
30
UNU-Fisheries Training Programme
A decreasing trend of both NPV of equity and IRR of equity is usually observed in the
worst case, but an upward trend in the best case (Table 5). The NPV of equity is found
as 3 MBDT in the worst case, but 53 MBDT in the optimistic case, whereas the
current value is 25 MBDT. Likewise, the IRR of equity is observed as 17% in the
worst case, but 111% in the optimistic case, while the estimated value is 60%.
Table 5: Scenario analysis of NPV of equity and IRR of equity.
Scenario Summary
Current
Values:
Worst
Case
Best
Case
Changing Cells:
Buildings 100% 120% 80%
Equipment 100% 120% 80%
Sales Quantity 100% 80% 120%
Sales Price 100% 80% 120%
Result Cells:
NPV Equity 25 3 53
IRR Equity 60% 17% 111%
4.4.3 Monte Carlo simulation
Monte Carlo simulation (Albright and Winston, 2009) was implemented by using the
@Risk add-in to Excel software. In this case 1000 random distributions were used to
analyse the risk of the project. The result was a histogram (Figure 17) of the IRR of
equity. Further, sensitivity of all cost items was estimated by using correlation
coefficients (Spearman Rank) through @Risk software and the result was a tornado
graph (Figure 18).
Figure 17: A histogram of IRR of equity.
Particularly, 98% of cases show the IRR of equity above the critical value, i.e. 10%.
Alternatively, only 2% of cases demonstrate the IRR of equity to be less than the

Alam
31
UNU-Fisheries Training Programme
critical IRR (Figure 17). The coefficient of IRR of equity is highly positive in the case
of sales price followed by production and fixed cost, but much lower in the case of
variable cost followed by buildings, equipment and other costs (Figure 18). The
results of the correlation coefficients indicate that the project is more sensitive to sales
price followed by production.
Figure 18: Correlation coefficients of IRR of equity.
5 DISCUSSION
5.1 Analysis of financial feasibility
As is commonly understood, financial feasibility analysis is an analytical tool used to
evaluate the economic viability of an investment, which is often a predominant factor
in feasibility analysis. It has been observed that financial feasibility evaluates the
financial condition and operating performance of the investment and forecasts its
future condition and performance (Fabozzi and Peterson, 2003). It has been realized
from the results that the case study of a carp seed production farm in Bangladesh is
financially feasible. This will be shown by analysing the results of the profitability
analysis such as Net Present Value, Internal Rate of Return and financial ratios and
the results of the risk analysis.
5.1.1 Profitability assessment
First will be considered Net Present Value (NPV), which is the difference between
the present value of all cash inflows and cash outflows associated with an investment.
As it is observed in the case study, both the NPV of total cash flow and NPV of net
cash flow will be positive (Figure 10). According to Park (2002), the decision rule for
NPV is: NPV>0, meaning the investment is acceptable. It is further stated that a
positive NPV means that the project has greater equivalent value of inflows than
outflows and therefore it makes a profit. Besides, similar studies were performed by
Togba (2008) for trawl fleet investment in Liberia, where a positive NPV was found
and the project was recommended as acceptable. Further, Okechi (2005) studied the
profitability of African Catfish farming in Kenya, where the project was reported

Alam
32
UNU-Fisheries Training Programme
acceptable on the basis of positive NPV. These examples clearly show that the
proposed investment is acceptable on the basis of NPV.
Secondly, Internal rate of return (IRR) measures the level of annual return over the
life of an investment. In the case study, IRR of total cash flow and IRR of net cash
flow are 37% and 60% respectively (Figure 11). A somewhat lower IRR of total cash
flow, which was 34%, was reported by Okechi (2005), but a similar IRR of net cash
flow, which was 60%, was observed during the profitability analysis of African
Catfish farming in Kenya. However, the investment policy usually defines a MARR,
which is 10% in this case study. In that case the IRR and the MARR can be used to
decide the project’s feasibility. According to Park (2002), the decision rule for a
simple project is: if IRR is greater than MARR, the project is acceptable. The central
bank of Bangladesh, Bangladesh Bank, has set a criterion that the project has to offer
a minimum IRR of 15% to borrow from the bank, but this study case offers a much
higher IRR, which is acceptable for bank equity. Consequently, on the basis of the
results of IRR the proposed investment in a carp seed production farm in Bangladesh
is profitable to operate.
Thirdly, financial ratios are often use for analysing financial feasibility. The
profitability ratios show the combined effects of liquidity, asset management and debt
on operating results. Therefore, financial ratios that measure profitability play a great
role in the decision making process (Park, 2002). However, the projected financial
statements are used to calculate the relevant ratios in order to gain a better
understanding of the performance of the project. Among the ratios the Liquid Current
Ratio, Loan Life Cover Ratio, Debt Service Coverage Ratio, etc. are significantly
considered in financial feasibility studies. As it is seen in this case study, the Liquid
Current Ratio (Figure 12) will be approximately 21 in the end of planning horizon. As
the Liquid Current Ratio is significantly greater than the Acceptable Minimum, which
has been decided as 1.5, the investment is financially viable. Similarly, the Debt
Service Coverage Ratio will be about 36 in the sixth year of operation. Moreover, the
Loan Life Cover Ratio will be over 4 in the sixth year of operation. Both the Debt
Service Coverage Ratio and the Loan Life Cover Ratio (Figure 13) in this case study
are greater than the acceptable minimum which is defined as 1.5, which proves the
acceptability of the project. Moreover, return on investment and return on equity in
the last year of operation will be 14% and 15% respectively which is also acceptable.
The return on equity also fulfils the requirement of Bangladesh Bank for lending
equity by the investors, which is 15% (BB, 2003). When looking at these ratios, there
is no doubt that the planned investment is profitable to operate.
Further, the payback period is another method which is sometimes used in financial
feasibility analysis. The method determines when the project will break even, i.e. how
long time it takes to pay investment outlays (Park, 2002). In this case study, the
payback period is only 4 years which is lower than the payback period (8 years)
calculated by Togba (2008) for the feasibility study of trawl fleet investment in
Liberia. A similar payback period of 4 years was estimated by Okechi (2005) during
the profitability analysis of African Catfish farming in Kenya. Thus, the quick
payback period implies low risk in the investment. However, the method does not
measure profitability that is made after paying back the initial investment. The method
also ignores all revenues and cost after the payback period and the time value of
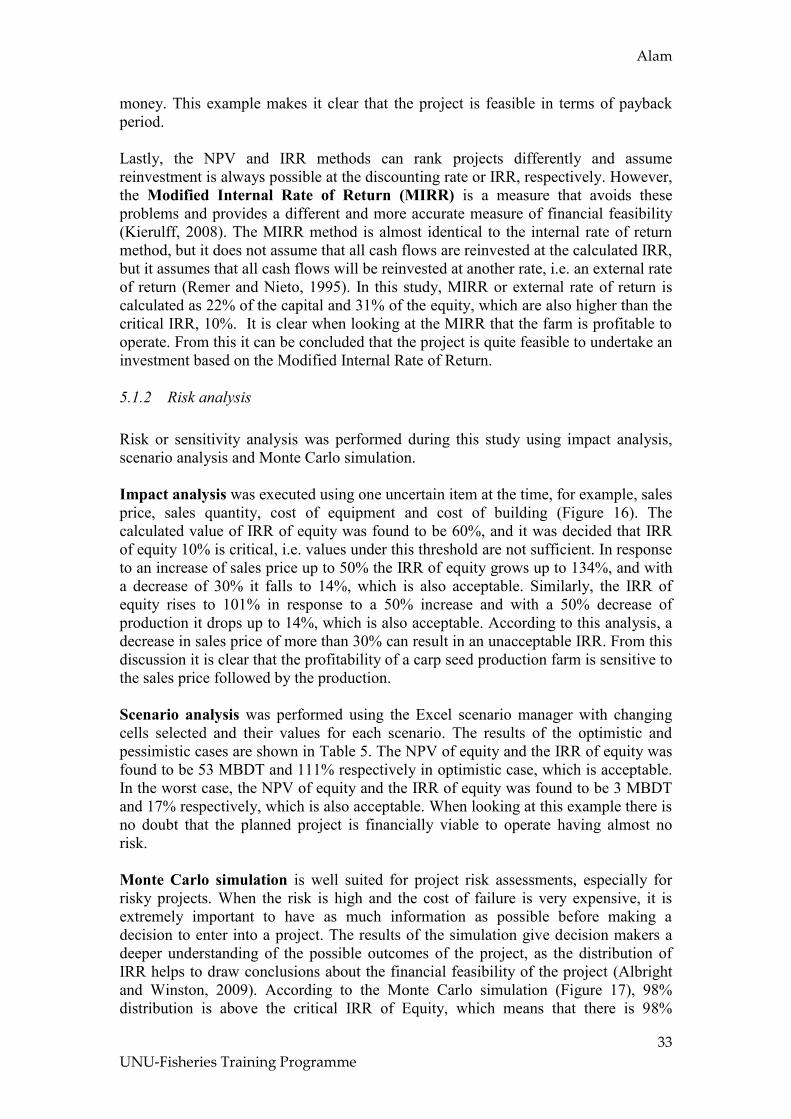
Alam
33
UNU-Fisheries Training Programme
money. This example makes it clear that the project is feasible in terms of payback
period.
Lastly, the NPV and IRR methods can rank projects differently and assume
reinvestment is always possible at the discounting rate or IRR, respectively. However,
the Modified Internal Rate of Return (MIRR) is a measure that avoids these
problems and provides a different and more accurate measure of financial feasibility
(Kierulff, 2008). The MIRR method is almost identical to the internal rate of return
method, but it does not assume that all cash flows are reinvested at the calculated IRR,
but it assumes that all cash flows will be reinvested at another rate, i.e. an external rate
of return (Remer and Nieto, 1995). In this study, MIRR or external rate of return is
calculated as 22% of the capital and 31% of the equity, which are also higher than the
critical IRR, 10%. It is clear when looking at the MIRR that the farm is profitable to
operate. From this it can be concluded that the project is quite feasible to undertake an
investment based on the Modified Internal Rate of Return.
5.1.2 Risk analysis
Risk or sensitivity analysis was performed during this study using impact analysis,
scenario analysis and Monte Carlo simulation.
Impact analysis was executed using one uncertain item at the time, for example, sales
price, sales quantity, cost of equipment and cost of building (Figure 16). The
calculated value of IRR of equity was found to be 60%, and it was decided that IRR
of equity 10% is critical, i.e. values under this threshold are not sufficient. In response
to an increase of sales price up to 50% the IRR of equity grows up to 134%, and with
a decrease of 30% it falls to 14%, which is also acceptable. Similarly, the IRR of
equity rises to 101% in response to a 50% increase and with a 50% decrease of
production it drops up to 14%, which is also acceptable. According to this analysis, a
decrease in sales price of more than 30% can result in an unacceptable IRR. From this
discussion it is clear that the profitability of a carp seed production farm is sensitive to
the sales price followed by the production.
Scenario analysis was performed using the Excel scenario manager with changing
cells selected and their values for each scenario. The results of the optimistic and
pessimistic cases are shown in Table 5. The NPV of equity and the IRR of equity was
found to be 53 MBDT and 111% respectively in optimistic case, which is acceptable.
In the worst case, the NPV of equity and the IRR of equity was found to be 3 MBDT
and 17% respectively, which is also acceptable. When looking at this example there is
no doubt that the planned project is financially viable to operate having almost no
risk.
Monte Carlo simulation is well suited for project risk assessments, especially for
risky projects. When the risk is high and the cost of failure is very expensive, it is
extremely important to have as much information as possible before making a
decision to enter into a project. The results of the simulation give decision makers a
deeper understanding of the possible outcomes of the project, as the distribution of
IRR helps to draw conclusions about the financial feasibility of the project (Albright
and Winston, 2009). According to the Monte Carlo simulation (Figure 17), 98%
distribution is above the critical IRR of Equity, which means that there is 98%
Alam
34
UNU-Fisheries Training Programme
possibility of getting profit from the planned project. There is, however, only 2%
probability of losing investment. Moreover, this simulation also shows that the
investment is more sensitive to sales price followed by production (Figure 18).
After analysing the results of the profitability assessment and risk analyses it is found
that the planned farm is profitable to operate but somewhat sensitive to sales price. As
has been proven a carp seed production farm would be highly profitable to operate in
Bangladesh.
5.2 Analysis of technical feasibility
Fisheries is a well-developed technology providing food and jobs for the ever-
growing population of the world (FAO, 1995). This has been seen in fish breeding
technology assisting rising aquaculture through supplying quality and high yielding
seeds. It is found that carp breeding technology is a widely accepted science, which
makes it technically feasible. This will be proven by analysing the possible outcome
of the selective breeding programme, the scope of improvement of existing practices
in different components of carp breeding technology such as brood stock
management, hatchery operation and nursery management for the excellence of carp
seed quality in Bangladesh.
First will be considered selective breeding programmes, which is a significant method
for increasing yields and which has long-term benefits (Tave, 1995). Selective
breeding programmes, for instance, have been undertaken by different countries to
improve many economic traits (Reddy, 1999). In India, selective breeding work has
been tested on Rohu, Labeo rohita, which offered an average of 17% higher growth
per generation after four generations of selection (Mahapatra et al., 2011). Similarly,
an Atlantic salmon selective breeding programme was commenced in Tasmania for
better growth traits, feed conversion efficiency and reducing the length of the
production cycle. The growth rate was assumed as 10% per generation. Further, it was
stated that the selective breeding programme in Norway reduced the period of
Atlantic salmon ‘grow-out’ from 4 to 3 years (Elliott et al., 2007). Moreover, a similar
breeding programme is going on in Iceland for Atlantic salmon, Arctic char and
Atlantic cod to achieve faster growth, later sexual maturity, higher resistance to
diseases, higher survival rate, better flesh quantity, etc. These examples make it clear
that selective breeding programmes can improve the quality of subsequent generations
of fish, which makes the project feasible.
Second will be considered management of brood stock, which is considered to be the
key success factor of induced breeding (Sarder, 2007). It is common that hatcheries
use immature and under weighted fishes. Therefore, for brood, 2-3 years old fishes are
recommended from natural source as well as from culture ponds (Sarder et al., 2002),
which can be collected from three river sources viz. the Halda, the Jamuna and the
Padma of Bangladesh as well as from the public brood fish farm (Khan, 2008). On the
other hand, pedigree recording is another essential task for success in improvement of
carp seed quality, which is rarely observed in existing fish seed farms in Bangladesh.
Therefore, brood stocks can be reared in species-specific ponds after marking and
pedigree recording (Khan, 2008). To make the farm feasible, the appropriate density
should be allowed with an equal ratio of male and female fishes during stocking and
breeding, which will help to improve the quality of carp seeds (Islam, 2009).
Moreover, the broods of most farms are not provided with a sufficient balanced diet

Alam
35
UNU-Fisheries Training Programme
which results in poor quality of seeds (Khan, 2008). So, the brood fish should be fed
with supplementary feed with a 25-30% protein level (Sarder, 2007) at the rate of 2-
3% body weight of brood fish stocked (May et al., 1984). Accordingly, brood fish can
be developed in a proper way through correcting the existing practices. From this, it
can be stated that brood stock technology will be quite feasible in Bangladesh.
Thirdly, the techniques followed in hatchery can affect the quality of spawns. For
example, the facility of the carp hatchery is important for quality improvement. Most
of the farms/hatcheries in Bangladesh are not running smoothly due to lack of
adequate farm facilities including laboratory facilities. Therefore, a carp hatchery
complex should be comprised of facilities for fish spawning, hatching of eggs, rearing
of fish seeds and laboratory testing. Other examples of mismanagement of carp seed
farms are improper selection of broods, non-selective hybridization, mating between
close relatives, etc. (Khan, 2008). Consequently, the government sets criteria for fish
seed farms that no hatcheries can apply the technique of hybridization except with
government permission and initiative has to be taken during breeding to avoid
inbreeding in fish through proper selection (GoB, 2010). The inducing agent is
another factor which can affect seed quality. Prior to induced breeding, the required
dosages of PG and HCG should be calculated in relation to body weight of brood
fishes to be induced (Sarder, 2007). It is apparent that the planned hatchery
management will be able to improve the quality of carp seeds by following better
hatchery management techniques, and will be feasible in Bangladesh.
Finally, nursery management of carp spawns can also influence the quality of seeds.
For example, the preparation and maintenance of nursery and rearing ponds is
important to improve the survival rate, growth rate and health of fish fry (Jhingran and
Pullin, 1985), which are not properly followed in most of hatcheries in Bangladesh
(Khan, 2008). Only recommended poisons and insecticides with appropriate doses
should be applied to avoid any adverse effect on seed quality. Natural food
productivity using fertilizers also can improve the health and quality of seeds. The
appropriate stocking density with non-competitive species can influence quality
(Sarder, 2007). Further, the proper feeding of fish fry is vital for superiority. Fish
seed should be provided with sufficient quantity of supplementary feed with all
nutrients (Khan, 2008). It is obvious when looking at the management techniques that
there is ample scope of upgrading seed quality by improving the existing management
practices.
Following the analyses of benefits of selective breeding and the scope of development
of management practices, the quality of carp seeds can be improved by avoiding
inbreeding, negative selection and following appropriate management practices. It has
now been shown that establishment of a carp seed production farm is technically
feasible in Bangladesh.
5.3 Analysis of environmental feasibility
It is of concern today that the environment is continually affected by human activities,
including industrialization, use of fossil fuels, deforestation, overexploitation of
nature, etc. This can be seen in fisheries in growing aquaculture industries and
overexploitation of natural aquatic resources. However, aquaculture, particularly a
carp seed production farm, has little impact on the surrounding environment and is

Alam
36
UNU-Fisheries Training Programme
environmentally feasible. This will be shown by analysing the environmental factors
affecting the farm’s production and the farm management factors that affect the
environment. A carp seed production farm can have almost no impact on the adjacent
environment if it is properly managed.
Firstly, the success of a carp seed farm largely depends on the neighbouring
environment where it is located. For instance, the quality of soil has direct influence
on water holding capacity, turbidity and pH of water (Islam, 2009). Therefore, before
hatchery construction launching, it is necessary to search for the subsoil water table
during the dry season of the year and perform laboratory examination of the
parameters of the water available at the site (Jhingran and Pullin, 1985). Even though
Bangladesh is not very affected by draught, dry areas with low water retention
capacity must not be selected as farm area. Further, the presence of predators and
pathogens can also affect the fish seed production (Khan, 2008). Mostly forest,
river/canal and swamp areas with high vegetation are the habitats of fish predators and
pathogens, and should not be selected as a farm area. Moreover, all types of pollution
such as water, air and sound pollution can adversely affect the production, the quality
of brood, hygiene condition of hatchery, survivability and quality of seeds. Therefore,
areas, particularly industrial areas, with pollution from industrial effluents, city
sewage, waste dumping, etc. should be avoided as a farm area. By selecting an
appropriate site for a carp seed farm, possible environmental impact can be avoided.
Secondly, certain farm management practices can cause probable harm to the
environment, but appropriate farm management can prevent putting pressure on the
environment. Generally, hatchery effluents consist of nutrient loads, sediment sludge
and some chemicals. Good hatchery management practice will be able to improve
effluent quality and reduce its volume and subsequently environmental impact. In
general, most of the carp seed farms of Bangladesh prefer to breed Indian major carps
and introduced carps as these fishes have no adverse impact to the environment
(Khan, 2008). Moreover, each carp seed farm should have a combination of
management, technical and supporting staff to operate the facilities. Proper design of
a carp seed production farm is important for effective production and minimization
environmental hazards. Besides, the design will be considered as a criterion for farm
registration in Bangladesh (GoB, 2010). It is better to establish a design in
consultation with an Aquaculture Specialist or Aquaculture Engineer. Potential injury
of the environment can be evaded following proper farm management practices.
After analysing the areas of environmental factors affecting farm production and farm
management practices affecting the environment, which are preventable through
proper planning and good management practices, the carp seed production farm is
found as relatively not harmful to environment. From this discussion it can be
concluded that establishment of a carp seed production farm in Bangladesh is
environmentally feasible. It is important that farm management always care for the
environment.

Alam
37
UNU-Fisheries Training Programme
6 RECOMMENDATIONS
The success and feasibility of a fish seed production farm in Bangladesh completely
depend on continual production of quality seeds. Based on the outcomes of the study
the following aspects are recommended:
i) It is obvious that the findings of the study should be proven through field
implementation in reality.
ii) Similar studies on other components of fisheries companies/farms like
shrimp farming, fish processing plants, fish feed industry, etc. should be
conducted prior to investment avoiding possible loss or risk.
iii) Total Quality Management should be ensured in all stages of fish seed
production for sustainability of the farm.
iv) Carp seed farm management is based on technical knowledge. Therefore,
staff and employees related with seed production should be provided with
training on new aquaculture technologies.
v) All fish seed farms should follow the rules of the Fish Hatchery Act 2010
enacted by the government of Bangladesh to improve the quality of seeds.
vi) It is expected that concerned parties will take necessary monetary steps in
favour of quality carp seed production investment in Bangladesh.
vii) Linkage should be established among aquaculture producers, related
organizations, industries and governments for sustainable development of
aquaculture in Bangladesh.

Alam
38
UNU-Fisheries Training Programme
7 CONCLUSION
Bangladesh fisheries are growing steadily offering employment, nutrition and
economic development. Its aquatic resources are diverse. Initially, fisheries of the
state were based on capture fisheries, which is now under threat due to natural and
human interferences. However, aquaculture of Bangladesh is rising dramatically to
meet the demand of the fast growing population of Bangladesh. In the beginning,
aquaculture fully relied on naturallly sourced fish seeds, but is presently almost
completely dependent on artificially sourced seeds. Due to unplanned breeding
practices in hatcheries the quality of fish seeds, particularly carp seeds, falls rapidly
resulting in poor performance in the culture system. Therefore, the demand of quality
carp seeds is predominant. To overcome this problem, it is essential to establish
quality breeding practices in new investment or existing farms. Consequently, this
study attempted to answer the question, ‘Is it financially, technically and
environmentally feasible to establish a carp seed production farm to improve carp
seed quality in Bangladesh?’
The study is based on secondary information which was collected from different
printed and electronic sources. The collected information was reviewed to find the
best breeding practices and the probable costs to implement the technology. Then the
costs of investment and farm operation were assumed using the Three Point Method.
These costs were then fitted in a Profitability Assessment Model, which consists of
several components such as the assumption summary, investment and financing,
operating statement, balance sheet, cash flow, profitability measures, graphs and
charts, results and sensitivity. All the components of the model have been executed in
separate Excel sheets but in the same workbook. The results for profitability show
positive NPV based on 10% MARR, IRR of capital 37%, IRR of equity 60%, MIRR
of capital 22%, MIRR of equity 31%, internal value of shares after 10 years above 12
times, financial ratios much higher than the acceptable minimum 1.5, which show that
the proposed farm is financially feasible to operate. Moreover, there is 98%
probability of profit with moderate sensitivity to sales price followed by sales
quantity. Similarly, feasibility of the farm is analysed in terms of technology and
environment. The analysis, based on existing selective breeding programmes, shows
that there is significant possibility for the improvement of seed quality regarding
growth rate, survival rate and fish traits. Alternatively, there is ample scope for
improving existing management practices, which contributes to seed quality and
mitigates environmental damage. Following the results of the analyses it can be
concluded that the project is highly feasible to operate. As has been shown, the
planned carp seed production farm is financially, technically and environmentally
feasible in Bangladesh.
Even though the study is based on secondary data, the report will provide necessary
information for new investors and for existing farm owners about the fundamental
practices and the profitability of carp seed production farms. Consequently, culture of
carps will increase due to the availability of quality carp seeds. It is predicted that new
investments in carp seed production will also come forward to meet the rising demand
of quality seeds. As a result, the production of aquaculture will be stimulated through
continual supply of quality seeds. It is expected that the concerned departments of
Bangladesh will extend necessary assistance and monitoring to increase fisheries
production by improving the quality of fish seeds.
Alam
39
UNU-Fisheries Training Programme
LIST OF REFERENCES
Ahmed, M. N. U. 2005. Fish Genetic Improvement and Brood Stock Management.
Training Module. Department of Fisheries, Bangladesh. 112p.
Albright, C. S. and Winston, W. L. 2009. Management Science Modeling. Revised
Third Edition. South-western Cengage Learning, Canada. 992p.
Akhtaruzzaman, M. (ed.). 2010. Monthly Economic Trends. Statistic Department,
Bangladesh Bank. November, 2010. v. xxxv(11). [08.12.2010]
<http://www.bangladesh-bank.org/pub/monthly/econtrds/econtrds.html>
Bangladesh Bank (BB) 2003. Equity and Entrepreneurship Fund Unit. Bangladesh
Bank, Dhaka, Bangladesh. [01.12.2010] http://www.bangladesh-
bank.org/aboutus/dept/eef/ eligibility.html
Bangladesh Bank (BB), 2010. Bank-wise Interest Rate Structure. Banking Regulation
and Policy Department, Bangladesh Bank. [27.12.2010] <http://www.bangladesh-
bank.org/pub/monthly/econtrds/econtrdsxv.pdf>
Davy, F. B. and Chouinard, A. 1981. Induced fish breeding in Southeast Asia: Report
of a workshop held in Singapore, 25-28 November 1980. Ottawa, Canada,
Internationa Development Research Centre, 1981.48 p.
Dey, M. M., Paraguas, F. J., Bhatta, R., Alam, F., Weimin, M., Piumsombun, S.,
Koeshandrajana, S. Dung, L. T. C. & Sang, N. V. 2005. Carp Production in Asia: Past
Trends and Present Status. pp 6-15. In Penman, D. J., Gupta, M. V. And Dey, M.
M.(eds.). Carp Genetic Resources for Aquaculture in Asia. World Fish Center
Technical Report 65, 152p.
DoF, 2010. National Fish Week 2010 Compendium. Department of Fisheries,
Ministry of Fisheries and Livestock, Bangladesh.120 p.
Elliott, N., Bennett, B. and King, H. 2007. An Atlantic Salmon Selective Breeding
Program for Tasmania. [10.01.2010] http://www.csiro.au/files/files/p7hh.pdf
FAO, 2010. FishStat Plus - Universal software for fishery statistical time series.
[04.01.2011] < http://www.fao.org/fishery/statistics/software/fishstat/en#1>
FAO, 2008. Technical Guidelines on Aquaculture Certification. Food and
Agricultural Organization, Sub-committee on Aquaculture, Fourth session, Puerto
Varas, Chile, 6 - 10 October 2008.
FAO, 1995. Code of Conduct for Responsible Fisheries. Food and Agricultural
Organization, Rome, Italy. 1995. 41 p.
FSYB, 2010. Fisheries Statistical Yearbook of Bangladesh. Fisheries Resource
Survey System, Department of Fisheries, Bangladesh. 26(1), 41p.
Alam
40
UNU-Fisheries Training Programme
Fabozzi, F.J. and Peterson, P.P., (2003). Financial management & analysis. 2nd
ed.
New Jersey: John Wiley & Sons.
GoB, 2010. Fish Hatchery Act, 2010. Bangladesh Gazette (additional number),
Government of the People’s Republic of Bangladesh (GoB). March, 2010.
GoB, 1997. Rule for the Conservation of the Environment 1997. Bangladesh Gazette,
Supplementary Issue of 28 August, 1997. pp. 293-303
GoB, 1995. Bangladesh Environment Conservation Act, 1995 (Act No. 1 of 1995).
Government of the People’s Republic of Bangladesh (GoB).
Hamid, A. N. M. M. A. 2010. Production Plan 2010. Fish Seed Multiplication Farm,
Netrakona, Department of Fisheries, Bangladesh. 15p.
Hofstrand, D. and Holz-Clause, M., (2009). What is a feasibility study? Iowa State
University. [21 December 2010]
<http://www.extension.iastate.edu/agdm/wholefarm/pdf/c5-65.pdf>.
Hussain, M. G. and Mazid, M. A. 2005. Carp Genetic Resources of Bangladesh. pp.
16-25. In Penman, D. J., Gupta, M. V. And Dey, M. M. (eds.). Carp Genetic
Resources for Aquaculture in Asia. World Fish Center Technical Report 65, 152p.
ICIMFA, 2011. Selective Breeding - The Key to Sustainability in Aquaculture.
Icelandic Fisheries - The Information Centre of the Icelandic Ministry of Fisheries
and Agriculture. [16.01.2011] <http://www.fisheries.is/aquaculture/slective-
breeding/>
Islam, M. R. 2009. Carp Breeding and Hatchery Management. Training Module.
Department of Fisheries, Bangladesh. 152p.
Jensson, P. 2006. Profitability Assessment Model. In: Workshop on Fisheries and
Aquaculture in Southern Africa: Development and Management. Windoek, Namibia.
ICEIDA and UNU-FTP, August 21-24 2006.
Jhingran, V. G. and Pullin, R. S. V. 1985. A Hatchery Manual for the Common,
Chinese and Indian Major Carps. Asian Development Bank-International Center for
Living Aquatic Resources Management. Manila, Philippines. 191p.
Khan, M. M. R. 2008. Genetic Improvement of Carp Seeds and Brood Stock
Management. Strengthening Institutional Capacity of DoF Project, Department of
Fisheries, Bangladesh. 100p.
Khandaker, H. R.(Ed.). 2007. Prawn Culture Management. Freshwater Prawn Culture
Extension Project, Department of Fisheries, Bangladesh. 80p.
Kierulff, H., (2008). MIRR: A Better Measure. Business Horizons. 51,pp. 321-329.

Alam
41
UNU-Fisheries Training Programme
Mahapatra, K. D., Jana, R. K., Saha, J. N., Gjerde, G. and Sarangi, N. 2011. Lessons
from the breeding program of rohu. Development of Aquatic Animal genetic
Improvement and Dissemination Programs: Current Status and Action Plans. pp. 34-
40.
Matson, J. 2000. Cooperative Feasibility Study Guide. United States Department of
Agriculture. Rural Business – Cooperative Service. Report 58.24p. [21.12.2010]
<http://www.rurdev.usda.gov/rbs/pub/sr58.pdf>.
May, R.C., Pullin, R. S. V. and Jhingran, V. G., (eds). 1984. Summary Report of the
Asian Regional Workshop on Carp Hatchery and Nursery Technology. ICLARM
Conference Proceedings 11, 38p. Asian Development Bank, Manila, Philippines and
International Center for Living Aquatic Resources Management, Manila, Philippines.
NBR, 2010. Income Tax-At a Glance. Budget 2010-1011 Fiscal Year. National Board
of Revenue, Bangladesh. [08.12.2010] <http://www.nbr-bd.org/incometax.html>
Okechi, J. K. 2005. Profitability Assessment: A Case Study of African Catfish
(Clarias gariepinus) Farming in the Lake Victoria Basin, Kenya. The United Nations
University-Fisheries Training Programme, Reykjavik, Iceland. 65p.
Park, C. S. 2002. Contemporary Engineering Economics. 3rd
ed. Prentice-Hall. Inc.,
New Jersey, USA.
Reddy, P. V. G. K. 1999. Genetic resources of Indian major carps. FAO Fisheries
Technical Paper. No. 387. Rome, FAO. 76p.
Rahman, S. S., Perschbacher, P., and Hussain M. G. 1987. A baseline survey of
spawn buyers at the Freshwater Aquaculture Research Station hatchery, Mymensingh
(Bangladesh). Bangladesh Journal of Fisheries.v. 10(1), pp.29-35.
Remer, D. S. and Nieto, A. P., (1995). A compendium and comparison of 25 project
evaluation techniques. Part 1: Net present value and rate of return methods.
International J. of Prod.Econ. 42, pp. 79-96.
Sarder, R. 2007. Freshwater fish seed resources in Bangladesh, p. 105-128. In:
Bondad-Reantaso, M. G. (ed.). Assessment of freshwater fish seed resources for
sustainable aquaculture. FAO Fisheries Technical Paper. No. 501. Food and
Agriculture Organization, Rome, Italy. 628p.
Sarder, A. S., Azam, M. R. and Hossain, M. A. 2002. Private hatchery owners’
perspectives on hatchery management in Bangladesh. pp. 77-81. In: Penman, D.J.,
Hussain, M.G., McAndrew, B.J. and Mazid, M.A. (eds.). Proceedings of a workshop
on Genetic Management and Improvement Strategies for Exotic Carps in Asia, 12-14
February 2002, Dhaka, Bangladesh. Bangladesh Fisheries Research Institute,
Mymensingh, Bangladesh.

Alam
42
UNU-Fisheries Training Programme
Sattar, M. A. and Das, T. K. 2002. Broodstock management of Chinese carps and
dissemination strategy at NFEP, Parbatipur. pp. 43-50. In: Penman, D.J., Hussain,
M.G., McAndrew, B.J. and Mazid, M.A. (eds.). Proceedings of a workshop on
Genetic Management and Improvement Strategies for Exotic Carps in Asia, 12-14
February 2002, Dhaka, Bangladesh. Bangladesh Fisheries Research Institute,
Mymensingh, Bangladesh.
Sukumaran, K. K. 1985. Seed Production and Hatchery Management. In. Lecture
notes on composite fish culture and its extension in India, Corporate Document
Repository, FAO, India, Asia. [31.12.2010]
<http://www.fao.org/docrep/field/003/AC229E/AC229E03.htm>
Tave, D. 1995. Selective breeding programmes for medium-sized fish farms. FAO
Fisheries Technical Paper.No. 352. Rome, FAO. 122 p.
Togba, G. B. 2008. Analysis of Profitability of Trawl Fleet Investment in Liberia.The
United Nations University-Fisheries Training Programme, Reykjavik, Iceland.65 p.
Ullah, S. M. M. 2010. Production Plan 2010 (Revised). Fish Spawning and Training
Centre, Department of Fisheries, Raipur, Laxmipur, Bangladesh. 20p.
Woynarovich, E and Horvath, L. 1980. The artificial propagation of warm-water
finfishes-A manual for extension. FAO Fish. Tech. Pap., (201). 183p.

Alam
43
UNU-Fisheries Training Programme
APPENDICES
Appendix 1: Estimation of costs
Investment Cost (MBDT) Optimistic Most Likely Pessimistic Expected Value Standard Deviation Variance
Cost at
95%
Confidence
level
Buildings a m b t s v
Pond Construction 3.50 4.00 4.50 4.00 0.17 0.03 -
Hatchery Complex 4.00 4.50 5.00 4.50 0.17 0.03 -
Fence 0.80 1.50 2.00 1.47 0.20 0.04 -
Total Buildings 8.30 10.00 11.50 9.97 0.31 0.10 10.50
Equipment
Pumps 0.80 1.00 1.40 1.03 0.10 0.01 -
Pipes 0.25 0.30 0.35 0.30 0.02 0.00 -
Oxygen Cylinder 0.03 0.04 0.05 0.04 0.00 0.00 -
Nets 0.02 0.03 0.04 0.03 0.00 0.00 -
Vehicles 0.30 0.40 0.50 0.40 0.03 0.00 -
Others 0.01 0.02 0.03 0.02 0.00 0.00 -
Total Equipment 1.41 1.79 2.37 1.82 0.11 0.01 2.00
Other Costs
Design 0.03 0.04 0.05 0.04 0.00 0.00 -
Consultation 0.25 0.35 0.45 0.35 0.03 0.00 -
Licence 0.04 0.05 0.07 0.05 0.01 0.00 -
Total Other Costs 0.32 0.44 0.57 0.44 0.03 0.00 0.50
Variable Costs
(MBDT/ton)
Labour 0.06 0.07 0.08 0.070 0.00 0.00 -
Feed 0.32 0.37 0.46 0.377 0.02 0.00 -
Fertilizers 0.02 0.03 0.04 0.030 0.00 0.00 -
Inducing Agents 0.03 0.03 0.04 0.030 0.00 0.00 -
Chemicals 0.01 0.02 0.02 0.015 0.00 0.00 -
Other 0.01 0.01 0.02 0.010 0.00 0.00 -
Total Variable Costs 0.38 0.53 0.57 0.461 0.02 0.00 0.50
Fixed Costs (MBDT/year)
Maintenance 0.15 0.20 0.25 0.20 0.02 0.00 -
Registration/Insurance 0.04 0.05 0.07 0.05 0.01 0.00 -
Management 0.08 0.11 0.14 0.11 0.01 0.00 -
Sales 0.03 0.05 0.07 0.05 0.01 0.00 -
Other Fixed Costs 0.04 0.05 0.07 0.05 0.01 0.00 -
Total Fixed Costs 0.34 0.46 0.60 0.46 0.02 0.00 0.50

Alam
44
UNU-Fisheries Training Programme
Appendix 2: Assumptions and results
2010
Discounting Rate 10% MARR
Investment
MBDT
Planning Horizon 10 years
Buildings 100% 10.5
Equipment 100% 2.0
Total
Capital Equity
Other
0.5
NPV of Cash Flow 26 25 MBDT
Total
Investment
13.0
Internal Rate
of Return 37% 60%
Financing
External Rate
of Return 22% 31%
Working Capital
2.0
Internal Value
of Shares
Total Financing
15.0
after 10 years 12.1
Equity
30%
Loan
Repayments
6 years
Minimum Cash
Account 1
Loan Interest
13%
Operations
2011 2012 2013 2014 2015
Sales Quantity 100%
9 10 10 11 11 ton/yr.
Sales Price 100%
1.0 1.4 1.5 1.3 1.3
MBDT
/ton
Variable Cost 100% 0.5 MBDT/ton
Fixed Cost 100% 0.5 MBDT/year
Inventory
Build-up
2.0 MBDT Breakdown
of cost MBDT
Per
cent Debtors
(Accounts
Receivable) 25% of turnover
Variable
Cost 55 63% Creditors
(Accounts
Payable) 15% of variable cost
Fixed Cost 5 6%
Dividend 20% of profit
Income Tax 0 0% DepreciationsBu
ildings 4%
Loan
Interest 6 7%
Equipment 15% down to 10% rest value Repayment 10 12%
Other 20%
Dividend 11 13% Loan
Management
Fees 2%
Total 88 100%
Income Tax 0%
Colour Code:
Blue:
Assumptions Yellow: Results

Alam
45
UNU-Fisheries Training Programme
Appendix 3: Investment and financing
Investment
and
Financing
2010 2011 2012 2013 2014 2015 2016 2017 2018 2019 2020 Total
1 2 3 4 5 6 7 8 9 10
Investment:
Buildings
10.5 10.1 9.6 9.2 8.8 8.4 8.0 7.5 7.1 6.7 6.3
Equipment
2.0 1.7 1.4 1.1 0.8 0.5 0.2 0.2 0.2 0.2 0.2
Other
0.5 0.4 0.3 0.2 0.1 0 0 0 0 0 0
Booked Value 13.0 12.2 11.3 10.5 9.7 8.9 8.2 7.7 7.3 6.9 6.5
Depreciation
Depreciation Buildings 4% 0.4 0.4 0.4 0.4 0.4 0.4 0.4 0.4 0.4 0.4 4.2
Depreciation Equipment 15% 0.3 0.3 0.3 0.3 0.3 0.3 - - - - 1.8
Depreciation Other 20% 0.1 0.1 0.1 0.1 0.1 - - - - - 0.5
Total Depreciation 0.8 0.8 0.8 0.8 0.8 0.7 0.4 0.4 0.4 0.4 6.5
Financing: 15.0
Equity 30% 4.5
Loans 70% 10.5
Repayment 6 0 1.7 1.7 1.7 1.7 1.7 1.7 10.5
Principal 10.5 10.5 8.7 7.0 5.2 3.5 1.7 0.0 0.0 0.0 0.0
Interest 13% 1.4 1.4 1.1 0.9 0.7 0.5 0.2 0.0 0.0 0.0 6.1
Loan Management Fees 2% 0.2 16.6

Alam
46
UNU-Fisheries Training Programme
Appendix 4: Operating statement
2010 2011 2012 2013 2014 2015 2016 2017 2018 2019 2020 Total
Operations Statement
Sales
9 10 10 11 11 11 11 11 11 11 106
Price
1.0 1.4 1.5 1.3 1.3 1.3 1.3 1.3 1.3 1.3
Revenue
9.0 13.5 14.5 13.8 13.8 13.8 13.8 13.8 13.8 13.8 133
Variable Cost 0.5
6.5 5.0 5.0 5.5 5.5 5.5 5.5 5.5 5.5 5.5 55
Net Profit
Contribution
2.5 8.5 9.5 8.2 8.2 8.2 8.2 8.2 8.2 8.2 78
Fixed Cost 0.5
0.5 0.5 0.5 0.5 0.5 0.5 0.5 0.5 0.5 0.5 5.0
Diverse Taxes 0%
0.0 0.0 0.0 0.0 0.0 0.0 0.0 0.0 0.0 0.0 0.0
EBITDA/
Operating Surplus
2.0 8.0 9.0 7.7 7.7 7.7 7.7 7.7 7.7 7.7 73.2
Inventory
Movement
2.0
2.0
Depreciation
0.8 0.8 0.8 0.8 0.8 0.7 0.4 0.4 0.4 0.4 6.5
Operating
Gain/Loss(EBIT)
3.2 7.2 8.2 6.9 6.9 7.0 7.3 7.3 7.3 7.3 68.7
Financial Costs
(Interest & Loan
management fee)
0.2
1.4 1.4 1.1 0.9 0.7 0.5 0.2 0.0 0.0 0.0 6.3
Profit before Tax/EBT -0.2 1.8 5.8 7.0 6.0 6.2 6.6 7.1 7.3 7.3 7.3 62.4
Loss Transfer 0 -0.2 0.0 0.0 0.0 0.0 0.0 0.0 0.0 0.0 0.0 0.0
Taxable Profit
0 1.6 5.8 7.0 6.0 6.2 6.6 7.1 7.3 7.3 7.3
Income Tax 0% 0
0 0 0 0 0 0 0 0 0 0 0
Profit after Tax -0.2 1.8 5.8 7.0 6.0 6.2 6.6 7.1 7.3 7.3 7.3 62.4
Dividend 20 %
0.0
0.4 1.2 1.4 1.2 1.2 1.3 1.4 1.5 1.5 1.5 12.5
Net Profit/Loss
-0.2
1.5 4.7 5.6 4.8 5.0 5.3 5.7 5.9 5.9 5.9 49.9
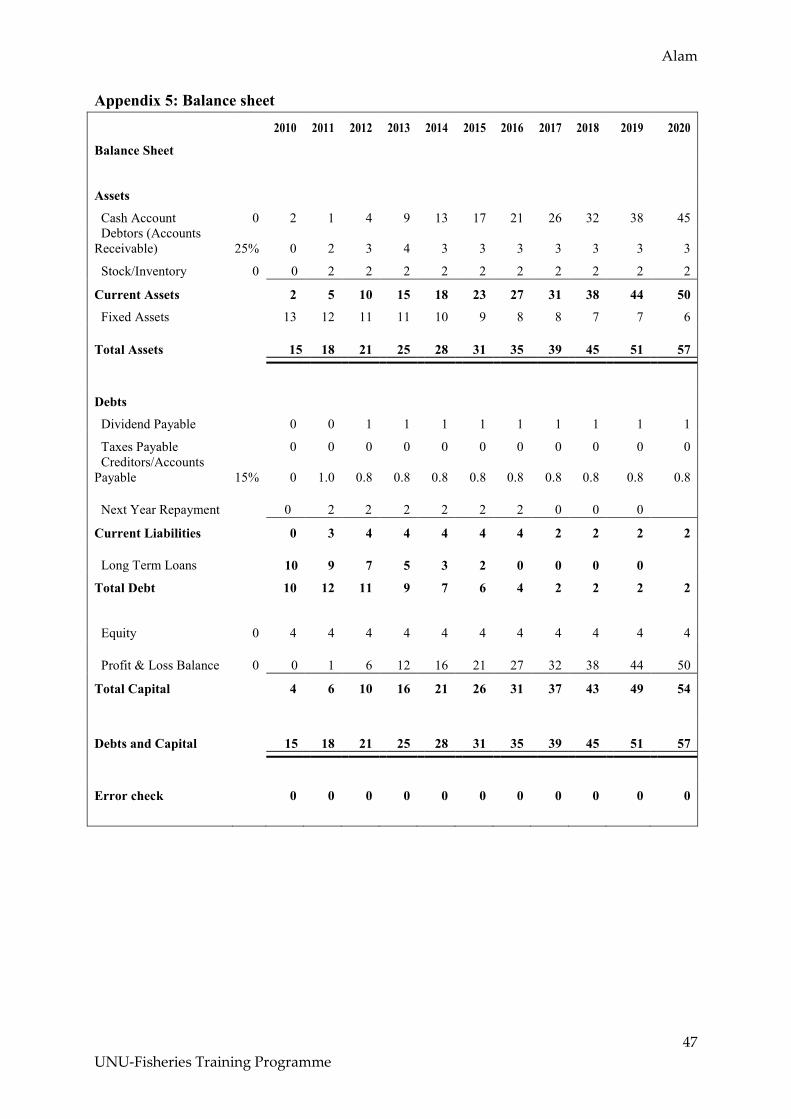
Alam
47
UNU-Fisheries Training Programme
Appendix 5: Balance sheet
2010 2011 2012 2013 2014 2015 2016 2017 2018 2019 2020
Balance Sheet
Assets
Cash Account 0 2 1 4 9 13 17 21 26 32 38 45
Debtors (Accounts
Receivable) 25% 0 2 3 4 3 3 3 3 3 3 3
Stock/Inventory 0 0
2 2 2 2 2 2 2 2 2 2
Current Assets
2 5 10 15 18 23 27 31 38 44 50
Fixed Assets
13 12 11 11 10 9 8 8 7 7 6
Total Assets
15
18 21 25 28 31 35 39 45 51 57
Debts
Dividend Payable
0 0 1 1 1 1 1 1 1 1 1
Taxes Payable
0 0 0 0 0 0 0 0 0 0 0
Creditors/Accounts
Payable 15% 0 1.0 0.8 0.8 0.8 0.8 0.8 0.8 0.8 0.8 0.8
Next Year Repayment
0
2 2 2 2 2 2 0 0 0
Current Liabilities
0 3 4 4 4 4 4 2 2 2 2
Long Term Loans
10
9 7 5 3 2 0 0 0 0
Total Debt
10 12 11 9 7 6 4 2 2 2 2
Equity 0 4 4 4 4 4 4 4 4 4 4 4
Profit & Loss Balance 0
0
1 6 12 16 21 27 32 38 44 50
Total Capital
4 6 10 16 21 26 31 37 43 49 54
Debts and Capital
15
18 21 25 28 31 35 39 45 51 57
Error check
0 0 0 0 0 0 0 0 0 0 0

Alam
48
UNU-Fisheries Training Programme
Appendix 6: Cash flow
2010 2011 2012 2013 2014 2015 2016 2017 2018 2019 2020 Total
Cash Flow EBITDA/
Operating Surplus 0 2.0 8.0 9.0 7.7 7.7 7.7 7.7 7.7 7.7 7.7 73
Debtor Changes 0 2.3 1.1 0.3 -0.2 0 0 0 0 0 0 3
Creditor Changes 0
1.0 0 0 0 0 0 0 0 0 0 1
Cash Flow before Tax 0 0.7 6.6 8.7 8.0 7.7 7.7 7.7 7.7 7.7 7.7 71
0
Paid Taxes
0 0 0 0 0 0 0 0 0 0 0
Cash Flow after Tax 0 0.7 6.6 8.7 8.0 7.7 7.7 7.7 7.7 7.7 7.7 71
0
Financial Costs (Interest) 0.2 1.4 1.4 1.1 0.9 0.7 0.5 0.2 0.0 0.0 0.0 6
Repayment 0
0 1.7 1.7 1.7 1.7 1.7 1.7 0 0 0 10
Free (Net) Cash Flow -0.2 -0.6 3.5 5.9 5.4 5.3 5.5 5.8 7.7 7.7 7.7 54
Paid Dividend
0 0.4 1.2 1.4 1.2 1.2 1.3 1.4 1.5 1.5 11
Financing – Expenditure
(Working Capital) 2 0 0 0 0 0 0 0 0 0 0 2
Cash Movement 1.8
-0.6 3.2 4.7 3.9 4.1 4.3 4.5 6.3 6.3 6.3 45

Alam
49
UNU-Fisheries Training Programme
Appendix 7: Source and allocation of funds
2010 2011 2012 2013 2014 2015 2016 2017 2018 2019 2020 Total
Source of Funds
Profit before Tax -0.2 1.8 5.8 7.0 6.0 6.2 6.6 7.1 7.3 7.3 7.3 62.4
Depreciation
0.0
0.8 0.8 0.8 0.8 0.8 0.7 0.4 0.4 0.4 0.4 6.5
Funds from
Operations -0.2 2.6 6.6 7.9 6.8 7.1 7.3 7.5 7.7 7.7 7.7 68.9
Loan Drawdown 10.5 0.0 0.0 0.0 0.0 0.0 0.0 0.0 0.0 0.0 0.0 75.4
Equity Drawdown
4.5
0.0 0.0 0.0 0.0 0.0 0.0 0.0 0.0 0.0 0.0 144.3
Funds for allocation 14.8 2.6 6.6 7.9 6.8 7.1 7.3 7.5 7.7 7.7 7.7 83.9
Allocation of Funds
Investment 13.0
13.0
Repayment 0.0 0.0 1.7 1.7 1.7 1.7 1.7 1.7 0.0 0.0 0.0 10.5
Paid Taxes 0.0 0.0 0.0 0.0 0.0 0.0 0.0 0.0 0.0 0.0 0.0 0.0
Paid Dividend
0.0
0.0 0.4 1.2 1.4 1.2 1.2 1.3 1.4 1.5 1.5 11.1
Total allocation 13.0 0.0 2.1 2.9 3.2 3.0 3.0 3.1 1.4 1.5 1.5 34.5
Changes Net
Current Assets
1.8
2.6 4.5 5.0 3.7 4.1 4.3 4.5 6.3 6.3 6.3 49.4
Analysis of Changes
Current Assets
Cash at start of year 0.0 1.8 1.2 4.3 9.0 13.0 17.1 21.4 25.8 32.2 38.5
Cash at end of year 1.8 1.2 4.3 9.0 13.0 17.1 21.4 25.8 32.2 38.5 44.7
Changes in Cash 1.8 -0.6 3.2 4.7 3.9 4.1 4.3 4.5 6.3 6.3 6.3 44.7
Debtor changes 0.0 2.3 1.1 0.3 -0.2 0.0 0.0 0.0 0.0 0.0 0.0 3.4
Stock Movements
0.0
2.0 0.0 0.0 0.0 0.0 0.0 0.0 0.0 0.0 0.0 2.0
Changes in Current
Assets 1.8 3.6 4.3 5.0 3.8 4.1 4.3 4.5 6.3 6.3 6.3 50.2
Liabilities
Creditor changes
0.0
1.0 -0.2 0.0 0.1 0.0 0.0 0.0 0.0 0.0 0.0 0.8
Changes Net
Current Assets
1.8
2.6 4.5 5.0 3.7 4.1 4.3 4.5 6.3 6.3 6.3 49.4
Error Check 0 0 0 0 0 0 0 0 0 0 0

Alam
50
UNU-Fisheries Training Programme
Appendix 8: Profitability measures
2010 2011 2012 2013 2014 2015 2016 2017 2018 2019 2020 Total
Profitability Measurements
NPV and IRR of Total Cash Flow
Cash Flow after Taxes 0 1 7 9 8 8 8 8 8 8 8 71
Equity
-4
Loan
-10
Total Cash Flow & Capital -15 1 7 9 8 8 8 8 8 8 8
NPV Total Cash Flow 10% -15 -14 -9 -2 3 8 12 16 20 23 26
IRR Total Cash Flow 0% 0% 0% 3% 18% 25% 30% 33% 35% 36% 37%
MIRR/External Rate of Return of total CF
20% 22% 22% 22% 22% 22%
NPV and IRR of Net Cash Flow
Free (Net) Cash Flow 0 -1 4 6 5 5 6 6 8 8 8 54
Equity
-4
-4
Net Cash Flow & Equity -5 -1 4 6 5 5 6 6 8 8 8 49
NPV Net Cash Flow 10% -5 -5 -2 2 6 9 12 15 19 22 25
IRR Net Cash Flow
0% 0% 0% 26% 42% 49% 54% 56% 58% 59% 60%
External Rate of Return
of free Cash Flow 34% 34% 33% 33% 32% 31%
Financial Ratios
Return On Investment
22% 41% 39% 28% 25% 22% 21% 19% 16% 14%
Return On Equity
42% 101% 68% 38% 30% 25% 23% 20% 17% 15%
Turnover Ratio 61% 77% 69% 55% 49% 44% 39% 35% 31% 27%
Current Ratio
33% 49% 64% 74% 82% 89% 94% 95% 95% 96%
Net Current Ratio
1.8 2.7 3.8 4.9 5.9 6.9 13.9 16.4 19.2 21.9
Liquid Current Ratio
1.1 2.1 3.2 4.3 5.4 6.4 13.0 15.5 18.3 21.0
Internal Value of Shares
1.3 2.3 3.6 4.6 5.8 6.9 8.2 9.5 10.8 12.1
Debt Service Coverage
0.5 6.6 9.5 10.6 13.1 18.8 35.9
Acceptable Minimum
1.5 1.5 1.5 1.5 1.5 1.5 1.5 1.5 1.5 1.5
NPV of Future Cash Flow during loan life 30 32 28 21 15 8
Principal of Loan
10 9 7 5 3 2
Loan Life Cover Ratio
2.9 3.7 4.0 4.1 4.2 4.4

Alam
51
UNU-Fisheries Training Programme
ACKNOWLEDGEMENTS
The author received cooperation and assistance in various ways from many individuals during
the study period in the United Nations University-Fisheries Training Programme (UNU-FTP)
in Iceland. The author is grateful to all of them although it is not possible to remark everyone
by name. However, the author reckons it as a privilege and great pleasure to express his
acknowledgement, deepest sense of gratitude, sincere appreciation and profound regards to
his respected teacher and supervisor, Mr. Páll Jensson, Professor, Department of Industrial
Engineering, University of Iceland, Reykjavik, Iceland for his scholastic guidance,
sympathetic supervision, valuable advice, untiring assistance and constructive criticism in all
phases of the project work and during the preparation of this report. It gives the author great
pleasure in expressing his sincere gratitude and deepest sense of appreciation to Dr. Tumi
Tómasson, Programme Director, UNU-FTP, Marine Research Institute, Reykjavik, Iceland
for his valuable advice, kind cooperation, cordial assistance and appreciable instructions
throughout the Training Programme and during the writing process of this final project. The
author sincerely conveys his heartfelt gratitude to Mr. Thor H. Asgeirsson, Deputy
Programme Director, UNU-FTP, Marine Research Institute, Reykjavik, Iceland for his kind
cooperation, valuable advice, illuminating suggestions and constructive criticism in all phases
of the Training Programme and during the preparation of the final project. The author would
like to extend his sincere and deep appreciation to Ms. Sigridur Ingvarsdottir, Office
Manager, UNU-FTP, Marine Research Institute, Reykjavik, Iceland for her heartfelt
cooperation during the training period. The author also expresses his cordial thanks and
gratitude to all of his friends, colleagues and Senior Authorities of Department of Fisheries,
Bangladesh for their assistance and cooperation during the Training Programme.


![APRIL 1, 2014 WELCOME TO CARP @ [UNIV] “CARP America” .](https://static.fdocuments.net/doc/165x107/56649ea45503460f94ba8f44/april-1-2014-welcome-to-carp-univ-carp-america-wwwcarplifeorg.jpg)