A Business Analysis Methodology - WIReDSpace Home - University
174
A Business Analysis Methodology A research report submitted to: Faculty of Commerce Department of Information Systems University of Witwatersrand in partial fulfilment of the requirements for the degree: Master of Commerce in Information Systems Submitted by: Avsharn Bachoo Student number: 0411216e Year: 2006 Telephone: 082 6030 980 Email: [email protected] Supervisor: Dr Maria Jakovljevic
Transcript of A Business Analysis Methodology - WIReDSpace Home - University

A Business Analysis Methodology
A research report submitted to:
Faculty of Commerce
Department of Information Systems
University of Witwatersrand
in partial fulfilment of the requirements for the degree:
Master of Commerce
in Information Systems
Submitted by: Avsharn Bachoo
Student number: 0411216e
Year: 2006
Telephone: 082 6030 980
Email: [email protected]
Supervisor: Dr Maria Jakovljevic

2
Synopsis
Business analysis is defined as the process in which business needs are identified and solutions
proposed. This process is regarded as one of the most important parts of systems development
because no other part is more difficult to rectify later. However, current business analysis
methodologies are inadequate because they are at a too high level and only address portions of
the complete business analysis process. In particular, the lack of clear objectives, relevance and
outcomes of the phases make business analysis methodologies inadequate. Moreover, activities,
techniques and tools not mapped to those phases are also problematic.
The aim of this research was to develop a business analysis methodology for business analysts
in the South African financial services environment. The intentions were to identify the phases,
as well as objectives, relevance and outcomes for each of these phases. Furthermore, this
research intended to identify appropriate activities, techniques and tools to address the objectives
of each phase of a methodology.
This was done by presenting a literature review of previous research relating to business analysis
methodologies. For information gathering, 45 participants (comprising of business analysts,
project managers, IS managers and CIOs) contributed to this research, 22 of whom were
interviewed individually while 23 participated in focus group interviews. The data from each of
these methods was analysed independently and did not influence or feed into any of the other
methods. Once the individual interviews and focus group interviews had been transcribed,
content analysis and analysis within and between interviews (Merriam, 1998; Strauss, 1987) was
used to analyse the information gathered independently.
The phases of a business analysis methodology identified by the research are the:
• feasibility phase;
• business case phase;
• analysis and design phase; and
• post-implementation evaluation phase.
Objectives, relevance and outcomes of these phases were also identified. In addition, activities,
techniques and tools were mapped to each of these phases.
Key words: Business analysis, Methodology, Activities, Techniques, Tools, Solutions, Business,
Technology.

3
Declaration
I declare that this research report is my own unaided work. It is being submitted for the degree of
Master of Commerce in Information Systems at the University of the Witwatersrand,
Johannesburg. It has not been submitted before for any degree or examination at any other
University.
_________________
Avsharn Bachoo
Signed this _________day of ______________________2006 in Johannesburg

4
Acknowledgements
I would like to sincerely thank the following people for their assistance:
• Dr Maria Jakovljevic, my supervisor for providing encouragement, guidance and constructive
comments during the research process; and
• all the participants who contributed to this research.

5
Table of Contents
Chapter 1
Introduction to a Business Analysis Methodology..........................................................13
1.1 Introduction.............................................................................................................13
1.2 Background ............................................................................................................14
1.3 Statement of the problem ........................................................................................15
1.4 Aim, objectives, research questions and research model.........................................16
1.5 Research Approach ................................................................................................17
1.5.1 Sample selection, characteristics of participants and research settings ....17
1.5.2 Data analysis strategy .............................................................................18
1.5.3 Trustworthiness, reliability and validity of this study..................................18
1.6 Importance of the research .....................................................................................18
1.7 Conclusion..............................................................................................................19
1.8 Structure of the report .............................................................................................20
Chapter 2
Literature Review ..........................................................................................................21
2.1 Introduction.............................................................................................................21
2.2 Background to literature review ...............................................................................21
2.3 Recent research on business analysis methodologies and their activities ................22
2.3.1 Requirements engineering process methodology.....................................22
2.3.2 Requirements triage methodology ...........................................................24
2.3.3 Knowledge level process methodology ....................................................26
2.3.4 Win-win spiral methodology .....................................................................28
2.3.5 Process framework methodology .............................................................29
2.3.6 Requirements generation methodology (RGM) ........................................31
2.4 Research on business analysis techniques and tools ..............................................32
2.4.1 Joint application design (JAD)..................................................................33
2.4.2 Interviews ................................................................................................33
2.4.3 Observation.............................................................................................34
2.4.4 Task demonstration .................................................................................35
2.4.5 Document studies....................................................................................36
2.4.6 Questionnaires ........................................................................................36
2.4.7 Prototyping ..............................................................................................37
2.4.8 I-Time......................................................................................................38

6
2.4.9 Analytic hierarchy process (AHP).............................................................38
2.4.10 Scenarios ..............................................................................................39
2.4.11 Storyboarding ........................................................................................39
2.4.12 Criticality analysis ..................................................................................40
2.4.13 Work breakdown structure .....................................................................41
2.4.14 Decision analysis under uncertainty .......................................................41
2.4.15 Plus minus implications (PMI) ................................................................42
2.4.16 Affinity analysis......................................................................................43
2.4.17 Rational rose .........................................................................................44
2.4.18 Visio ......................................................................................................44
2.4.19 ARIS......................................................................................................45
2.5 Contributions and shortcomings of business analysis methodologies, techniques and
tools .............................................................................................................................45
2.6 Conclusion of the literature review...........................................................................49
Chapter 3
Research Methodology .................................................................................................50
3.1 Introduction.............................................................................................................50
3.2 Qualitative research design .....................................................................................50
3.3 Pre-test and pilot study of data gathering methods ..................................................52
3.4 Sample selection, characteristics of participants and research settings....................52
3.5 Individual interviews ................................................................................................53
3.5.1 Individual Interview protocols ...................................................................54
3.5.2 Pre-test and pilot study of individual interview protocol.............................54
3.5.3 Individual interview sample selection, characteristics of participants and
settings ............................................................................................................55
3.5.4 Conducting individual interviews ..............................................................55
3.6 Focus group interviews ...........................................................................................56
3.6.1 Focus group interview protocols...............................................................56
3.6.2 Pre-test and pilot study of focus interview protocol ...................................57
3.6.3 Focus group interview sample selection, characteristics of participants and
settings ............................................................................................................57
3.6.4 Conducting focus group interviews...........................................................58
3.7 Data analysis strategy.............................................................................................58
3.7.1 Data management ...................................................................................58
3.7.2 Content analysis and analysis within and between interviews...................59
3.7.3 Data coding .............................................................................................60
3.7.4 Category construction..............................................................................60

7
3.7.5 Cross-checking of results.........................................................................60
3.8 Assessment of trustworthiness ................................................................................61
3.8.1 Reliability and validity of the research ......................................................62
3.8.1.1 Reliability of the research......................................................................63
3.8.1.2 Validity of the research .........................................................................63
3.8.2 Ethical considerations..............................................................................65
3.9 Conclusion..............................................................................................................66
Chapter 4
Presentation and Interpretation of the Evidence Collected ............................................67
4.1 Introduction.............................................................................................................67
4.1.1 Overview of findings ................................................................................68
Part 1............................................................................................................................71
4.2 Presentation of findings from individual interviews ...................................................71
4.2.1 Understanding of business analysis .........................................................72
4.2.2 Feasibility phase (PH1FE) - phase 1 of a business analysis methodology 73
4.2.3 Business case phase (PH2BC) - phase 2 of a business analysis
methodology ....................................................................................................77
4.2.4 Analysis and design phase (PH3AD) - phase 3 of a business analysis
methodology ....................................................................................................81
4.2.5 Post-implementation evaluation phase (PH4PI) - phase 4 of a business
analysis methodology.......................................................................................85
Part 2............................................................................................................................89
4.3 Presentation of findings from focus group interviews ...............................................89
4.3.1 Understanding of business analysis .........................................................90
4.3.2 Feasibility phase (PH1FE) - phase 1 of a business analysis methodology 91
4.3.3 Business case phase (PH2BC) - phase 2 of a business analysis
methodology ....................................................................................................94
4.3.4 Analysis and design phase (PH3AD) - phase 3 of a business analysis
methodology ....................................................................................................98
4.3.5 Post-implementation evaluation phase (PH4PI) - phase 4 of a business
analysis methodology.....................................................................................102
Part 3..........................................................................................................................105
4.4 Consolidation and Interpretation of the Results......................................................105
4.4.1 Understanding of business analysis .......................................................106
4.4.2 Feasibility phase (PH1FE) - phase 1 of a business analysis methodology
......................................................................................................................106

8
4.4.3 Business case phase (PH2BC) - phase 2 of a business analysis
methodology ..................................................................................................107
4.4.4 Analysis and design phase (PH3AD) - phase 3 of a business analysis
methodology ..................................................................................................109
4.4.5 Post-implementation evaluation phase (PH4PI) - phase 4 of a business
analysis methodology.....................................................................................110
4.5 Discussion of results .............................................................................................111
4.6 Conclusion............................................................................................................113
Chapter 5
Conclusions, Recommendations and Limitations of this study.....................................114
5.1 Introduction...........................................................................................................114
5.2 Overview of chapters ............................................................................................114
5.3 Main findings.........................................................................................................115
5.4 Implications and contributions of this study for academics and practitioners studying
business analysis........................................................................................................117
5.5 Biasness of this research ......................................................................................119
5.6 Limitations of this study.........................................................................................119
5.7 Recommendations for further research..................................................................120
5.8 Closing remarks ....................................................................................................121
References..................................................................................................................122
Appendix A: Popular Press and Internet References...................................................136
Appendix B: Additional Activities, Techniques and Tools.............................................139
Appendix C: Individual Interview Protocol....................................................................143
Appendix D: Focus Group Interview Protocol ..............................................................148
Appendix E: Data from Individual Interviews ...............................................................154
E1 Supporting comments on relevance of this research and understanding of business
analysis ......................................................................................................................154
E2 Individual interview mentions, percentages and comments for phase 1 ..................155
E3 Individual interview mentions, percentages and comments for phase 2 ..................157
E4 Individual interview mentions, percentages and comments for phase 3 ..................159
E5 Individual interview mentions, percentages and comments for phase n ..................160
Appendix F: Data from Focus Group Interviews ..........................................................162
F1 Supporting comments on the understanding of business analysis ..........................162
F2 Focus group mentions, percentages and comments for phase 1 ............................162
F3 Focus group mentions, percentages and comments for phase 2 ............................164
F4 Focus group mentions, percentages and comments for phase 3 ............................166
F5 Focus group mentions, percentages and comments for phase n ............................168

9
Appendix G: Overall results from Individual Interviews and Focus group Interviews....170
G1 Overall mentions and percentages for phase 1 ......................................................170
G2 Overall mentions and percentages for phase 2 ......................................................171
G3 Overall mentions and percentages for phase 3 ......................................................172
G4 Overall mentions and percentages for phase 4 ......................................................173

10
List of Figures
1 Figure 1.1: Research model for a business analysis methodology..........................................17
2 Figure 2.1: Requirements engineering process methodology .................................................23
3 Figure 2.2: Requirements triage methodology........................................................................25
4 Figure 2.3: Knowledge level process methodology.................................................................27
5 Figure 2.4: Win-win spiral methodology .................................................................................28
6 Figure 2.5: Process framework methodology .........................................................................30
7 Figure 2.6: Requirements generation methodology ................................................................31
8 Figure 2.7: Decision analysis under uncertainty .....................................................................42
9 Figure 3.1: Overview of the qualitative research design .........................................................51
10Figure 4.1: Structure of Chapter 4..........................................................................................67
11Figure 4.2: Overview of findings.............................................................................................68
12Figure E1: Supporting comments from participants on the relevance of this research...........154
13Figure E2: Supporting comments from participants on their understanding of business analysis
.........................................................................................................................................155
14Figure E3: Supporting individual interview comments for phase 1 ........................................156
15Figure E4: Supporting individual interview comments for phase 2 ........................................157
16Figure E5: Supporting individual interview comments for phase 3 ........................................159
17Figure E6: Supporting individual interview comments for phase n ........................................161
18Figure F1: Supporting focus group comments for the understanding of business analysis ....162
19Figure F2: Supporting focus group comments for phase 1 ...................................................163
20Figure F3: Supporting focus group comments for phase 2 ...................................................165
21Figure F4: Supporting focus group comments for phase 3 ...................................................166
22Figure F5: Supporting focus group comments for phase n ...................................................168

11
List of tables
1 Table 2.1: Business analysis methodologies - contributions and shortcomings.......................45
2 Table 2.2: Business analysis techniques - contributions and shortcomings.............................47
3 Table 2.3: Business analysis tools- contributions and shortcomings .......................................48
4 Table 3.1: Sample table for individual interviews....................................................................55
5 Table 3.2: Sample table for focus group interviews ................................................................57
6 Table E1: Mentions and percentages from individual interviews for phase 1.........................155
7 Table E2: Mentions and percentages from individual interviews for phase 1 activities ..........156
8 Table E3: Mentions and percentages from individual interviews for phase 1 techniques.......156
9 Table E4: Mentions and percentages from individual interviews for phase 1 tools ................157
10Table E5: Mentions and percentages from individual interviews for phase 2.........................157
11Table E6: Mentions and percentages from individual interviews for phase 2 activities ..........158
12Table E7: Mentions and percentages from individual interviews for phase 2 techniques.......158
13Table E8: Mentions and percentages from individual interviews for phase 2 tools ................158
14Table E9: Mentions and percentages from individual interviews for phase 3.........................159
15Table E10: Mentions and percentages from individual interviews for phase 3 activities ........159
16Table E11: Mentions and percentages from individual interviews for phase 3 techniques .....160
17Table E12: Mentions and percentages from individual interviews for phase 3 tools ..............160
18Table E13: Mentions and percentages from individual interviews for phase n.......................160
19Table E14: Mentions and percentages from individual interviews for phase n activities ........161
20Table E15: Mentions and percentages from individual interviews for phase n techniques .....161
21Table E16: Mentions and percentages from individual interviews for phase n tools ..............161
22Table F1: Mentions and percentages from focus group interviews for phase 1 .....................162
23Table F2: Mentions and percentages from focus group interviews for phase 1 activities.......163
24Table F3: Mentions and percentages from focus group interviews for phase 1 techniques ...163
25Table F4: Mentions and percentages from focus group interviews for phase 1 tools.............164
26Table F5: Mentions and percentages from focus group interviews for phase 2 .....................164
27Table F6: Mentions and percentages from focus group interviews for phase 2 activities.......165
28Table F7: Mentions and percentages from focus group interviews for phase 2 techniques ...165
29Table F8: Mentions and percentages from focus group interviews for phase 2 tools.............166
30Table F9: Mentions and percentages from focus group interviews for phase 3 .....................166
31Table F10: Mentions and percentages from focus group interviews for phase 3 activities.....167
32Table F11: Mentions and percentages from focus group interviews for phase 3 techniques .167
33Table F12: Mentions and percentages from focus group interviews for phase 3 tools ...........167

12
34Table F13: Mentions and percentages from focus group interviews for phase n ...................168
35Table F14: Mentions and percentages from focus group interviews for phase n activities.....168
36Table F15: Mentions and percentages from focus group interviews for phase n techniques .168
37Table F16: Mentions and percentages from focus group interviews for phase n tools ...........169
38Table G1: Mentions and percentages of phase 1 .................................................................170
39Table G2: Mentions from feasibility phase activities .............................................................170
40Table G3: Mentions from feasibility phase techniques..........................................................170
41Table G4: Mentions from feasibility phase tools ...................................................................171
42Table G5: Mentions and percentages of phase 2 .................................................................171
43Table G6: Mentions from business case phase activities .....................................................171
44Table G7: Mentions from business case phase techniques ..................................................171
45Table G8: Mentions from business case phase tools ...........................................................172
46Table G9: Mentions and percentages of phase 3 .................................................................172
47Table G10: Mentions from analysis and design phase activities ...........................................172
48Table G11: Mentions from analysis and design phase techniques........................................172
49Table G12: Mentions from analysis and design phase tools .................................................173
50Table G13: Mentions and percentages of phase 4 ...............................................................173
51Table G14: Mentions from post-implementation evaluation phase activities..........................173
52Table G15: Mentions from post-implementation evaluation phase techniques ......................173
53Table G16: Mentions from post-implementation evaluation tools ..........................................173
54Table G17: Cross-tabulation of participants .........................................................................174

13
Chapter 1
Introduction to a Business Analysis Methodology
1.1 Introduction
Almost two decades ago, Fred Brooks wrote in No Silver Bullet:
“The hardest single part of building a system is deciding precisely what to
build. No other part of the conceptual work is so difficult as establishing the
detailed requirements.... No other part of the work so cripples the resulting
system if done wrong. No other part is more difficult to rectify later"
(Brooks, 1987, p10).
Business analysis is defined as the process in which business needs are identified and solutions
proposed (American Supplier Institute, 2003; Avison and Fitzgerald, 1995). This process is
regarded as one of the most important parts of systems development because no other part is
more difficult to rectify later (Brooks, 1987; Lubars, Potts and Richter, 1993; SEIREP, 2004).
However, no adequate business analysis methodology exists (Hofmann and Lehner, 2001;
Pfleeger, 2001; Robertson and Robertson, 1999).
In order to establish a common understanding of the terminology, as well as enable the reader to
easily comprehend this report, a few of the necessary terms relevant to a business analysis
methodology will now be listed.
• Methodology - A methodology is defined as a collection of phases, activities, techniques and
tools that help users/developers implement a new system or solution (Avison and Fitzgerald,
1995).
• Phases - Researchers (Avison and Fitzgerald, 1995; Davis, 1993b) describe phases as the
unique stages or components of a methodology. However, activities, techniques and tools
may be unique to a phase or may feature in a number of different phases (Avison and
Fitzgerald, 1995; Davis, 1993b).
• Activities - According to Davis (1993b), activities are the tasks of a phase.
• Techniques - Techniques are understood as specific approaches to performing activities
(Avison and Fitzgerald, 1995; Davis, 1993b).
• Tools - Literature (Avison and Fitzgerald, 1995; Davis, 1993b; Pfleeger, 2001) describes tools
as automated computer software tools.

14
• Systems analysis - As business analysis is an emerging field, there is some confusion
between business analysis and systems analysis. Evans (2004) states that systems analysis
is more concerned with the technical aspect of information systems. This includes the design
of the system, technical specifications, as well as examining existing systems to understand
them better, and to determine and choose between alternatives for system improvement and
employment.
The above definitions will be used throughout this report as there is inconsistency in the literature
relating to the definition of phases, activities, techniques and tools (Davis, 1993b; Kotonya and
Sommerville, 2000). The following section presents a background to the study followed by the
statement of the problem.
1.2 Background
In recent years, much research (Hofmann and Lehner, 2001; IEEE, 2004; Kotonya and
Sommerville, 2000) has been conducted in an effort to improve the different activities making up
the systems development process. However, business analysis still remains one of the least
explored areas and has the least satisfactory scientific foundations (Ashworth, 1999; IEEE, 2004;
Leffingwell and Widrig, 2000; Sommerville, 2005).
Dutoit and Paech (2000) state that a system is developed primarily to meet business needs.
However, without a clear understanding of the business problem, developers do not know what to
build, and clients/users do not know what to expect. Dutoit and Paech (2000) further show that
poor business analysis results in inadequate solutions to business problems, which ultimately
results in solution failure and the clients/users losing confidence in the development team as well
as in business analysis. Standish (2004) shows that 80% of project failures are related to
business analysis problems. Good business analysis can obviate many of the problems
associated with systems development, particularly during the maintenance phase (Bailin, 1999;
Boehm and Papaccio, 1998; Jarke, 1998; Jeffery, 1992). In response to these problems,
organisations are exhibiting an increased interest in business analysis and the benefits it yields
(Jordan, Keller, Tucker and Vogel, 1989; Standish, 2004; Williams, 1998).
Successful systems are unlikely without adequate business analysis (Hofmann and Lehner, 2001;
Pfleeger, 2001; Robertson and Robertson, 1999). Yet, no adequate business analysis
methodology exists. For these reasons business analysis is a promising area for research effort.

15
1.3 Statement of the problem
The literature describes business analysis methodologies as being composed of high level
phases such as analysis and specification (Bubenko, 1995; Davis, 2003a; Jordan et al., 1989;
You, 2001). However, these phases are at such a high level that it is difficult to apply them to real
project scenarios (Bubenko, 1995; Davis, 2003a; You, 2001). These phases lack clear objectives,
outcomes and precise details which results in uncertainty about which activities to use for
conducting business analysis (Bubenko, 1995; Curtis, Krasner and Iscoe, 1988; Davis, 2003a;
Jordan et al., 1989).
Another problem is that many business analysis methodologies address only portions of the
complete business analysis process (Gottesdeiner, 2002; Richards, 2000; Sawyer, Sommerville,
and Viller, 1999). For example, the requirements engineering process methodology provides a
set of guidelines for the elicitation and analysis phases, but fails to address any other phase of
business analysis (Gottesdeiner, 2002; Richards, 2000).
Methodologies such as soft systems methodology (SSM) and agile methodologies are also
available for business analysts, but they do not show the business analyst how to approach a
problem in a logical manner, and what phases to follow in order to find the best solution to that
problem (Lubars et al., 1993; Potts, 1991; SEI, 2004; Siponen, Baskerville and Kuivalainen, 2005;
Zucconi, 1999). Avison and Fitzgerald (1995) state that neither SSM nor agile methodologies are
appropriate for business analysis because:
• SSM does not determine whether a project is a success or a failure, and produces models of
system activity that are largely informal and therefore subject to misunderstanding; and
• agile methodologies give an analyst too much leeway and do not suit non-technical projects.
An additional problem with business analysis methodologies relates to the selection of
appropriate activities, techniques and tools to address the objectives and outcomes of the
different phases of business analysis (Davis, 2003a; Lobo, 2004). Currently there are a large
number of activities, techniques and tools for business analysis. Nevertheless these are not
mapped to the appropriate phases (Davis, 2003a; Lobo, 2004). Lobo (2004) states that business
analysts often perform activities and select techniques and tools in an ad hoc fashion, which
results in an output which inadequately addresses the objectives of that phase. It is therefore
important to map business analysis activities, techniques and tools to phase objectives.

16
These literature findings reveal the lack of a practical and integrated business analysis
methodology. The next section introduces the aim, objectives, research questions and the
research model for this study.
1.4 Aim, objectives, research questions and research model
The aim of this research was to develop a business analysis methodology for business analysts
in the South African financial services environment1. The intentions were to identify the phases,
as well as objectives, relevance and outcomes for each of these phases. Moreover, this research
intended to identify appropriate activities, techniques and tools to address the objectives of each
phase of a methodology. To satisfy the aim and objectives of the research, the following research
questions set out below were formulated:
Research question 1 (RQ 1): What are the phases of a business analysis methodology
and why are they relevant?
Research question 2 (RQ 2): What are the objectives and outcomes for each of these
phases?
Research question 3 (RQ 3): Which activities, techniques and tools are appropriate to
each phase of business analysis?
Based on the above research questions, a research model, illustrated in Figure 1.1, was adapted.
This research model represents the structure of a business analysis methodology and the
corresponding research questions that will be explored in this research.
1 This setting was selected for the study due to the researcher’s background in financial services. Section 3.4 describes the sample selection, characteristics of participants and research settings.

17
1 Figure 1.1: Research model for a business analysis methodology
Source: Adapted from Avison and Fitzgerald (1995)
This research model provides a base to build an appropriate methodology that reflects the
phases, activities, techniques and tools that will be investigated. The research approach adopted
for this study is introduced in the next section.
1.5 Research Approach
A qualitative approach, consisting of individual semi-structured interviews and focus group
interviews, was selected for this research because it allowed for in-depth probing of issues and a
greater detail in responses (Denzin and Lincoln, 1994; Merriam, 1998).
1.5.1 Sample selection, characteristics of participants and research settings
A pre-test was scheduled prior to the initial data collection phase to validate the data gathering
methods and ensure they were free from errors (Compeau and Higgins, 1995; Dixon, Bouma and
Atkinson, 1988). Thereafter, a snowball approach with non-randomised purposive sampling
(Creswell, 1994) was used to select the final 45 participants, made up of CIOs, business analysts,
project managers and IS managers from Bank A and Bank B. Twenty two of these participants
were interviewed individually and 23 participated in 2 focus group interviews. The data analysis
strategy adopted follows in the next section.

18
1.5.2 Data analysis strategy
As data was gathered through multiple data gathering methods (semi-structured individual
interviews and focus group interviews) the criteria for triangulation was satisfied (Creswell 1994;
Yin 1994; Merriam 1998). Content analysis and analysis within and between interviews (Merriam,
1998; Neuendorf, 2002), was used to name and identify categories and subcategories through a
detailed examination of the data. After data coding and category construction, the results from
each these methods were cross-checked against each other by selecting high frequency
mentions and eliminating low frequency mentions (Silverman, 2000). This strategy allowed the
comparison of one result against another to check for patterns, contradictions and examine
overlapping facets, to increase the reliability of the final results (Baskerville, 1999). These cross-
checked results were also compared to the features of present business methodologies to see if
the results overcame the shortcomings found. To ensure these results were trustworthy, an
assessment of trustworthiness was also conducted.
1.5.3 Trustworthiness, reliability and validity of this study
The criteria used to increase the trustworthiness of this research were a thick description,
prolonged engagement, peer debriefing and referential adequacy (Lincoln and Guba,
1985). Moreover, Yin’s (1994) criteria for reliability (diachronic, synchronic and inter-judge
reliabilities) and validity (instrument, internal, construct and generalisability) were also applied.
Permission to interview, anonymity and confidentiality, informed consent as well as researcher
integrity were the ethical considerations adhered to, to the best of the researcher’s ability
(Neuman, 1994).
The following section demonstrates the importance of this research.
1.6 Importance of the research
Business analysis is an emerging practice and an even younger area of research compared to
other information system (IS) disciplines. This research is therefore important to researchers and
practitioners in that it enhances the current understanding of business analysis. In so doing the
research identifies the relevant phases of a business analysis methodology, with appropriate
activities, techniques and tools, applicable to financial services. Moreover, this study critically
analyses literature on the topic, and so illuminates the deficiencies in the research.

19
A practical and integrated business analysis methodology is of particular importance to
practitioners because 80% of project failures are related to business analysis problems (Standish,
2004). Further, it is beneficial to practitioners because it ensures a repeatable process,
measurable deliverables, accurate requirements and less confusion. These benefits are set out
below.
• A repeatable process: having a clearly defined methodology ensures a standardised
approach towards business analysis and promotes consistency in software development.
(Avison and Fitzgerald, 1995; SEIREP, 2004).
• Measurable deliverables: according to researchers, (Avison and Fitzgerald, 1995; Standish,
2004), a methodology consists of phases which can be broken down into measurable
deliverables. This results in a higher probability of project success, as the phases can be
better managed and monitored.
• Accurate requirements: Avison and Fitzgerald (1995) suggest that a methodology can help
users specify their requirements better and help business analysts investigate and analyse
user requirements more precisely.
• Less confusion: business analysts lack the necessary guidance when selecting the
appropriate activities, techniques and tools for the different phases of business analysis.
When activities, techniques and tools are mapped to phases, the result is less confusion for
business analysts and improved planning and control. A business analysis methodology also
promotes consistent terminology and conventions which results in less confusion for
organisations (Avison and Fitzgerald, 1995; Standish, 2004).
Business analysis has attracted little interest in the academic literature (Lobo, 2004). This study
provides an exploration of this emerging discipline and provides direction to literary material for
academics wishing to research business analysis further. It also presents a basis for developing a
comprehensive conceptual background from which hypotheses can be proposed for later testing,
and offers several suggestions to researchers wanting to build on its contribution.
The next section concludes this chapter, and is followed with the structure for the remainder of
this research report.
1.7 Conclusion
This chapter introduced the topic of business analysis by investigating business analysis
problems and motivating the need for a business analysis methodology. It examined the
problems with current business analysis methodologies and revealed the lack of a practical and

20
integrated business analysis methodology. Further, it showed that business analysis activities,
techniques and tools not mapped to appropriate phases result in incorrect outputs to those
phases. The aim of this research, as well as the objectives, research questions and research
model were presented. Furthermore, the research approach adopted for this study was
established. Finally, this chapter showed that a business analysis methodology would be
beneficial to both practitioners and researchers.
1.8 Structure of the report
The next chapter will present previous studies that relate to business analysis methodologies and
build a conceptual framework for this study. More importantly, chapter 2 will present the
contributions and shortcomings of the methodologies, techniques and tools. After introducing the
underlying literature pertaining to business analysis methodologies, the research methodology
used to carry out this study will follow.
Chapter 3 will justify the qualitative approach selected for this study that allows for in-depth
probing and detailed responses. The pre-test and pilot study, conducted to validate the data
gathering methods comprising of individual interviews and focus group interviews, will also be
illustrated. The sample selection, characteristics of participants and settings for each of the data
gathering methods used for this study will be further demonstrated. The data analysis strategy
including the data management strategy, content analysis and analysis within and between
interviews will also be presented. Importantly, this chapter will introduce the data coding and
category construction procedure selected for the research. The assessment of trustworthiness,
criteria for reliability and validity, as well as ethical considerations of the researcher will also be
covered.
Chapter 4 will derive the categories and subcategories from the data. The content analysis and
analysis within and between interviews will be demonstrated. This chapter will then present the
findings from the individual interviews and focus group interviews. The consolidation and
interpretation of these findings will follow. This chapter will conclude by linking the findings to the
literature review and a discussion of the results.
Finally, chapter 5 will conclude this research by presenting an overview of this report followed by
the main findings of this study. The implications and contributions of this study will then be then
assessed, followed by a discussion of the biasness, the limitations as well as recommendations
for further research.

21
Chapter 2
Literature Review
2.1 Introduction
Chapter 1 established the topic of business analysis by examining business analysis problems,
motivating the need for a business analysis methodology, and investigating problems with current
methodologies. The aim of this research, as well as the objectives, research questions and
research model were established. Furthermore, the research approach adopted for this study was
introduced.
This chapter provides a literature review of previous research undertakings that relate to business
analysis methodologies, and covers the following topics:
2.2 background to literature review;
2.3 research on business analysis methodologies and their activities;
2.4 research on business analysis techniques and tools;
2.5 contributions and shortcomings of methodologies, techniques and tools; and
2.6 conclusion of the literature review.
In the subsequent section, a background to the literature review is presented.
2.2 Background to literature review
Remenyi and Williams (1995) state:
“An extensive literature review is an essential prerequisite for
research…the literature review should assist the researcher to identify
the unsolved problem (Leedy, 1993) in the field being studied that will
become the focus of the research project”.
Business analysis has attracted little interest in academic literature, despite the fact that Brooks
(1987) and Lubars et al., (1993) have stated it is one of the most important parts of systems
development. Much has been written on parts of business analysis (Davis, Fairley and Yourdon,
1999; Richards, 2000), on individual activities, techniques and tools (Potts, 1991; Zucconi, 1999)
as well as on closely related subjects such as systems analysis, project management and
software engineering (Sommerville, 2005). However, the subject of business analysis itself has

22
been discussed extensively in the popular press. Appendix A presents a list of popular press
articles, to illustrate the volume of interest in this subject and show that this is a field in need of
academic research.
Like most research that is close to exploitation in practice, economic factors have driven the
development of business analysis (Lobo, 2004). Traditionally business analysis was regarded as
a fuzzy stage of software development where a specification was generated from possibly vague
and informally expressed ideas (Evans, 2004). Early research (Boehm, 1981; Boehm, 1988) in
information systems showed that it is economically convenient and effective to fix faults as early
as possible in the development process. However, over the years the realisation of the
importance of business analysis has resulted in a better understanding of the business analysis
process. The following section subsequently introduces current business analysis methodologies
and their activities found in the literature.
2.3 Recent research on business analysis methodologies and their
activities
This section presents a review of six different business analysis methodologies and their activities
from literature. Most of these methodologies were not specifically developed for business
analysis, but were originally intended for related disciplines such as systems analysis and project
management (Hofmann and Lehner, 2001; Pfleeger, 2001; Robertson and Robertson, 1999).
However, due to the lack of an adequate business analysis methodology, they have been
adopted by business analysts (Hofmann and Lehner, 2001; Pfleeger, 2001; Robertson and
Robertson, 1999). The requirements engineering process methodology is firstly considered.
2.3.1 Requirements engineering process methodology
The requirements engineering process methodology is an engineering methodology frequently
used by business analysts (Iyer and Richards, 2004; Richards, 2003; Richards, 2000). As
illustrated in Figure 2.1, this methodology is comprised of five phases (Iyer and Richards, 2004;
Richards, 2003; Richards, 2000):

23
2 Figure 2.1: Requirements engineering process methodology
Source: Iyer and Richards (2004)
The following section defines the phases and activities of this methodology as illustrated in the
above figure.
• Phase 1 - Requirements acquisition: requirements acquisition involves capturing stakeholder
requirements. This phase uses interviews as a technique to extract the requirements. This
phase results in the gathering of requirements in formats such as use case descriptions and
interview transcripts.
• Phase 2 - Concept generation: concept generation is the second phase of this methodology
and involves representing the requirements of different stakeholders in the form of a table.
This table comprises of requirement objects as rows and object attributes as columns. The
visual representation of the viewpoints of different stakeholders helps to ensure an easier
understanding and comparison of the viewpoints.
• Phase 3 - Concept comparison and conflict resolution: once the table representations of the
requirements have been generated, the tables are compared for conflicts. Requirements
which appear in the tables are classified as being in one of the four states (Gaines and
Rappaport, 1988).
o Consensus is the situation where the same requirement is described using the same
terminology.
o Correspondence occurs when the same requirement is described using different
terminology.

24
o Conflict is where different requirements are being described, but the same terms are
used.
o Contrast is where there is no similarity between requirements or the terminology used.
• Phase 4 - Negotiation: on detecting the conflicts, the next phase is to resolve them through
different negotiation techniques. This methodology adopts the five strategies of conflict
resolution, set out below, proposed by Easterbook and Nuseibeh (1996).
o Resolving entails removing inconsistencies.
o Ignoring involves taking no action.
o Circumventing involves avoiding or not including a conflict.
o Delaying entails putting a conflict on hold.
o Ameliorating involves reducing the degree of inconsistency.
• Phase 5 - Evaluation: this is the last phase of the methodology and determines if another
iteration of the methodology is necessary. The methodology uses the number of conflicts to
decide whether to go through another cycle of the model.
This methodology is at a very high level and fails to identify all the phases of business analysis
(Lobo, 2004; Wallace, Keil and Rai, 2004). It only provides an overview of the phases and does
not clearly identify the objectives and outcomes of the phases (Lobo, 2004; Wallace, et al., 2004).
The methodology only covers the early stages of business analysis, and overlooks the latter
portion of business analysis (Lobo, 2004; Wallace et al., 2004). Techniques such as joint
application design (JAD) are specified for each phase but, these are limited to only one or two for
each phase, which restricts the application of the methodology (Lobo, 2004; Wallace et al., 2004).
Furthermore, tools are not specified (Lobo, 2004; Wallace et al., 2004).
After reviewing the requirements engineering process methodology, an assessment of the
requirements triage methodology was conducted.
2.3.2 Requirements triage methodology
Requirements triage methodology is also an engineering methodology frequently used by
business analysts. The goal of this methodology is to create a set of features, which can be
developed using available resources within acceptable levels of risk (Ruhe and Momoh, 2005;
Yourdon, Davis and Zweig, 1999). These features must be sold at an acceptable price to a known
market in sufficient quantities to achieve satisfactory levels of profit and thus achieve a
reasonable return on investment (Ruhe and Momoh, 2005; Yourdon et al., 1999). It comprises a

25
process of deciding what features a product should include in its implementation (Davis, 2003b;
Davis et al., 1999; Davis, 1993a; Ruhe and Momoh, 2005). For this methodology, the time and
effort needed to develop the features of a system are compared with the project budget and
schedule. If there is incompatibility between these project parameters (time, effort, schedule,
cost), then the features are removed so that the project parameters synergise. The requirements
triage also regard marketing, financial and development factors as addition phases (Davis,
2003b; Davis et al., 1999; Davis, 1993a; Ruhe and Momoh, 2005).
The methodology is comprised of five phases illustrated in Figure 2.2 (Davis, 1993a; Davis et al.,
1999; Davis, 2003b):
3 Figure 2.2: Requirements triage methodology
Source: Davis (2003b)
As indicated in Figure 2.2, the following phases of the methodology are specified (Davis, 2003b).
• Phase 1 - Risk analysis: this phase determines acceptable levels of risk for the requirements.
• Phase 2 - Cost and schedule estimation: this phase determines the effort and time required
to implement potential features of the system.
• Phase 3 - Price analysis: the price analysis phase determines the optimal price to charge
customers.
• Phase 4 - Market analysis: the market analysis phase determines the types of customers,
their numbers, their buying power/capability, and the urgency for a particular feature.

26
• Phase 5 - Feature triage: feature triage is the process that determines the correct features to
be developed.
Commercial tools such as Omni-Vista SP2, Primavera Monte Carlo3 and QSS TechPlan 4 have
been developed to support the requirements triage methodology (Sud, 2004). These tools allow a
business analyst to visualise the effects of various factors like cost, schedule and price on the
development of the project (Sud, 2004).
However, this methodology fails to describe the outcomes, as well as the activities of each phase
of business analysis (Karlsson, Berander, Regnell and Wohlin, 2004; Sud, 2004). The
requirements triage methodology also only focuses on the middle portion of business analysis
after the requirements have been specified (Karlsson et al., 2004; Sud, 2004). As a consequence
of this, its applicability is restricted as this methodology has to be plugged into other
methodologies for effective usage (Karlsson et al., 2004; Sud, 2004).
Thereafter, an investigation of the knowledge level process methodology was conducted.
2.3.3 Knowledge level process methodology
The knowledge level process methodology is a scenario-based methodology that comprises of
different phases, as shown in Figure 2.3 (Abbink, Van Dijk, Dobos, Hoogendoorn, Jonker, Konur,
Van Maanen, Popova, Sharpanskykh, Van Tooren, Treur, Valk, Xu and Yolum, 2004; Albers,
Jonker, Karami and Treur, 2004; Bragge, Merisalo-Rantanen and Hallikainen, 2005; Herlea,
Jonker, Treur and Wijngaards, 1999). Researchers define a scenario as an assumed sequence of
possible events (Abbink et al., 2004; Herlea et al., 1999).
2 http://www.omni-vista.com/products 3 http://www.primavera.com/products/monte.html 4 http://www.qssinc.com/products/visiontools/techplan.html

27
4 Figure 2.3: Knowledge level process methodology
Source: Abbink et al., (2004)
As illustrated in Figure 2.3, the knowledge level process methodology consists of three phases
(Abbink et al., 2004; Albers et al., 2004; Bragge et al., 2005a; Herlea et al., 1999) which are set
out below.
• Phase 1 - Elicitation: the elicitation phase involves the identification of problems, elicitation of
requirements and scenarios from the stakeholders, and documentation of the domain
knowledge.
• Phase 2 - Manipulation of requirements and scenarios: this phase entails resolving the
ambiguity and inconsistency among the requirements and scenarios. In addition, this phase
reformulates the informal requirements to semi-formal and formal requirements and
establishes the relationships between the requirements and the scenarios.
• Phase 3 - Maintenance of requirements and scenario specification: this phase involves the
configuration control of traceability information and documents containing the requirements
and scenarios.
Nevertheless, the level of detail in the knowledge level process methodology is inconsistent, as
phase 1 and phase 2 are at a low level of detail, i.e., a very detailed description of activities within
the phases (Lobo and Arthur, 2005). However, phase 3 is highly abstract, i.e., a high level
description of activities for this phase (Lobo and Arthur, 2005). Also, since the methodology is

28
scenario-based with the requirements and scenario phases intertwined, it is difficult to incorporate
changes into the methodology (Bragge et al., 2005a). Another drawback is that although the
methodology identifies high level phases, the literature does not provide adequate information
about their details (Bragge et al., 2005a; Lobo and Arthur, 2005). Furthermore, this methodology
does not provide techniques and tools for conducting the phases identified (Bragge et al., 2005a;
Lobo and Arthur, 2005).
After reviewing the knowledge level process methodology, the win-win spiral methodology was
evaluated.
2.3.4 Win-win spiral methodology
The win-win spiral methodology, shown in Figure 2.4, combines the waterfall and prototyping
approaches with elements of risk analysis and customer negotiation (Boehm, Bose, Horowitz and
Lee, 1994; Bragge, Martin and Tuunanen, 2005).
5 Figure 2.4: Win-win spiral methodology
Source: Boehm et al., (1994)
As illustrated in Figure 2.4, the win-win spiral methodology comprises of the phases listed below
(Boehm et al., 1994).

29
• Phase 1: this phase identifies next-level stakeholders, and their win conditions. Thereafter,
this phase involves reconciling stakeholders' win conditions, and establishing the next-level
objectives, constraints, and alternatives.
• Phase 2: the next phase of the spiral involves evaluating product and process alternatives
and resolving risks. Thereafter, the next-level product and process, including system-wide
partitions are defined.
• Phase 3: the final phase involves validating the product and process definitions and reviewing
the results.
The above mentioned phases are repeated until a complete and well defined business analysis
document is obtained (Bragge et al., 2005b).
The win-win spiral methodology presents a general framework for business analysis that is easy
to use (Boehm et al., 1994). However, it lacks adequate detail for the phases (Bragge et al.,
2005b; Parets-Llorca and Grunbacher, 1999). Moreover, all the phases are briefly explained on a
high level, with their activities also stated on a high level. Furthermore, outcomes, techniques and
tools are not specified for the phases (Bragge et al., 2005b; Parets-Llorca and Grunbacher,
1999).
After reviewing the win-win spiral methodology, an assessment of the process framework
methodology was conducted.
2.3.5 Process framework methodology
The process framework methodology provides a general framework for business analysis.
Illustrated in Figure 2.5, this methodology consists of four phases, which are executed iteratively
until a precise and complete business analysis specification is obtained (Alcazar and Monzon,
2000).

30
6 Figure 2.5: Process framework methodology
Source: Alcazar and Monzon (2000)
The phases of this methodology are set out below (Alcazar and Monzon, 2000).
• Phase 1 - Capture user requirements: this phase involves the elicitation of information such
as business processes, organisation descriptions and stakeholder profiles. The methodology
recommends the use of techniques such as requirements lists, graphs, and free texts for the
representation of requirements.
• Phase 2 - Analyse requirements: this phase focuses on building a common understanding of
the requirements, problem domain, vocabulary and other relevant information. To capture this
information, unified modelling language (UML) and entity relationship diagrams (ERDs) are
prescribed as techniques to business analysts. A second objective of this phase is to classify
the requirements in a hierarchical order and to identify the relationship between the
requirements.
• Phase 3 - Build solution specification: this phase represents the system objectives in a
common format for the business analyst and the customer. This phase advocates the use of
use cases (Jacobson, 1992) for the presentation of requirements to the customer. A use case
is a technique for capturing the potential requirements of a new system. Each use case
provides one or more scenarios that convey how the system should interact with the end user
or another system to achieve a specific business goal (Jacobson, 1992).

31
• Phase 4 - Verify specification: this phase requires the business analyst to confirm that all the
requirements have been captured and recorded. In addition, the requirements are checked
for adherence to the quality characteristics such as correctness, preciseness and verifiability.
The process framework methodology identifies the main phases of the business analysis, but fails
to provide the details of these phases (Lobo and Arthur, 2005; Ranky and Chamyvelumani,
2003). In addition, the activities such as stakeholder profiles are specified at a very high level.
This methodology focuses on presentation and representation of the phases, rather than on the
activities of the phases (Lobo and Arthur, 2005; Ranky and Chamyvelumani, 2003).
Finally, an investigation of the requirements generation methodology was conducted.
2.3.6 Requirements generation methodology (RGM)
The requirements generation methodology (RGM), shown in Figure 2.6, provides a general
structured framework for business analysis (Arthur and Groener, 2005; Lobo, 2004).
7 Figure 2.6: Requirements generation methodology
Source: Arthur and Groener (2005)
Illustrated in Figure 2.6, this methodology divides business analysis into two phases (Arthur and
Groener 2005; Lobo, 2004).
• Phase 1 - Requirements definition: in this phase, the requirements are elicited and evaluated
iteratively until the exit criteria is satisfied. This phase consists of the ‘indoctrination’ and

32
‘requirements capturing’ sub-phases. Indoctrination is concerned with familiarising the
customer about the RGM, educating the business analyst about the problem domain, and
specifying the customer’s responsibilities. The requirements capturing phase is further refined
into sub-phases, which focus on obtaining requirements from the customer and refining them
in an iterative manner, until the complete set of requirements is collected. The RGM also
provides protocols and guidelines to structure the phases identified. Protocols define
boundaries for the RGM within which the customer and the business analyst must operate,
whereas guidelines are recommendations or suggestions that are optional for the
requirements engineer or the customer.
• Phase 2 - Requirements analysis: this is where the complete set of requirements is analysed,
documented, verified and validated.
The RGM identifies phases for business analysis. Furthermore, the RGM specifies constraining
and guiding components in the form of protocols and guidelines, which help in effectively
conducting business analysis. The drawback of the RGM is that the activities such as
requirement capturing are stated at a high very level (Nance and Arthur, 2006). Another
shortcoming of the RGM is that the outcomes, techniques and tools that are required for the
phases are not identified (Nance and Arthur, 2006).
This section concludes the review of the business analysis methodologies and their activities from
literature. The subsequent section introduces a review of techniques and tools from literature.
2.4 Research on business analysis techniques and tools
As discussed in the previous section, one of the drawbacks of the business analysis
methodologies is that they fail to specify the techniques and tools for the phases. The literature
reveals hundreds of individual techniques and tools independent of any methodologies that are
available for business analysts.
The problem is that business analysts choose techniques and tools in an ad hoc manner. Since
the use of different techniques and tools result in different outputs, incorrect selection may
inadequately address the objective of a phase, and ultimately have a negative impact on the
quality of a product (Davis, 2003a; Lobo, 2004). Due to the large number of individual tools and
techniques, only a few are examined in this section (See Appendix B for additional tools and
techniques). Joint application design (JAD) is the first technique considered.
33
2.4.1 Joint application design (JAD)
Joint application design (JAD) is a soft technique by which a group attempts to find a solution to a
specific problem by gathering spontaneous ideas by its members (Duggan and Thachenkary,
2004; Goguen and Linde, 1993; Jennex, 2005). This technique has been employed successfully
by many industrial and research organisations studying business, engineering, scientific, and
management problems (Goguen and Linde, 1993; Jennex, 2005).
According to Lewis and Thomas (2003), during a JAD session the subsequent steps as set out
below are followed.
• The business analyst writes the problem for which solutions are sought on a blackboard or
conference pad. The problem should be brief, specific and stimulating.
• The reasoning and background information for the problem are conveyed to the group.
• The ground rules for the JAD are clearly explained. These are set out below.
o Every idea is acceptable.
o Neither verbal evaluation nor nonverbal expressions of approval or disapproval is
permitted during the JAD session.
o The quantity of ideas is the main goal of JAD. This concept is called "freewheeling."
o Building on the ideas of others, referred to as "hitchhiking," is encouraged.
o A time limit for the JAD session should be set.
The JAD session usually begins with a surge of ideas and then slows down as the meeting
progresses. The business analyst lists each idea on a board or pad as soon as it is mentioned
and should not hesitate in recording ideas, as this can give the impression of disapproval.
Furthermore, the ideas are written exactly as spoken by the group member. The JAD session
continues till all ideas have been exhausted. The drawback of this technique is that it needs to be
followed up by some additional effort to filter out the unrealistic ideas. In addition, the
effectiveness of the technique depends largely on the knowledge and management skills of the
business analyst (Duggan and Thachenkary, 2004). Interview techniques are discussed in the
following section.
2.4.2 Interviews
Interviews are perhaps the most common technique for business analysis and have been
effectively employed in a large number of domains (Bragge et al., 2005a; Quek and Shah, 2004;
Goguen and Linde, 1993). If stakeholders are asked the right questions, the interview technique
can provide valuable information about the system and its problems. While the questions play a

34
critical role in the success of an interview, the social aspects of dealing with the stakeholders are
also equally important (Quek and Shah, 2004; Zucconi, 1999).
The interview technique begins by asking broad questions known as context-free questions,
which do not suggest a particular response from the stakeholder (Bragge et al., 2005a; Gause
and Weinberg, 1989). Context-free questions pertain to day-to-day work, day-to-day problems,
critical tasks, and so forth. For example, who is the client for this system? What is the real reason
for wanting to solve this problem? What environment is this product likely to encounter? What
kind of product precision is required? These questions enable the identification of critical issues,
which are probed further through detailed questions at a later time.
Interviews can be conducted on an individual or group basis. The advantage of interviewing a
group of people is that they can inspire each participant to remember critical issues and describe
day-to-day work (Bragge et al., 2005a; Gause and Weinberg, 1989). As a consequence, the
business analyst can obtain more information about the system and its problems. However, it is
important that a balance in participation is maintained so that no one person dominates the
interaction process. With individual interviews, the time taken is considerable because the
business analyst has to interview the participant on an individual basis. Furthermore, this
technique assumes that the interviewee has access to conscious accurate knowledge (Bragge et
al., 2005a; Quek and Shah, 2004).
The next section introduces the observation technique, also frequently used by business analysts
(Bragge et al., 2005a).
2.4.3 Observation
Observation is useful in understanding the users’ domain, tasks, priorities and work habits that
the users themselves are sometimes unaware of, such as workarounds, failures, and exceptions
(Gause and Weinberg, 1989). In addition, this technique helps in determining the context around
the use of a particular system and the relationship of the system with the other systems in the
environment (Bragge et al., 2005a; Gause and Weinberg, 1989).
An example of an observation is watching an unaware user finding a section in a manual. It would
seem logical that people would use the index to find a particular section. However, observation
shows that, in most cases, people skim through the book assuming that they know where the
section is. Only when their efforts fail, do they actually refer the index for a particular section
(Bragge et al., 2005a; Gause and Weinberg, 1989).

35
This technique is intended to obtain information by observing what actually transpires in the work
environment. Hence, to conduct this technique, a business analyst visits the work site and takes
notes about the environment (the problem being investigated) and its interactions. Furthermore,
the technique does not require any special equipment and can be conducted by a single person.
The use of technology such as a video camera is beneficial as it provides a better coverage of the
environment and also allows the business analyst to examine the collected data later (Gause and
Weinberg, 1989). The problem with the observation technique is that it usually cannot collect
information about events / interactions that happen rarely, because the observer can spend only
a specific amount of time in the work environment (Bragge et al., 2005a). Task demonstrates
follow in the subsequent section.
2.4.4 Task demonstration
Task demonstration technique requires the users to perform tasks while describing what they are
doing and why (Lindgaard, 1994; Kirwan, 1992). This technique is a variant of the interview and
observation technique and involves the study of what a user is required to do, in terms of
cognitive activities, to achieve a task objective (Aleotti, Caselli and Reggiani, 2003; Kirwan,
1992). In many situations, users cannot explain the knowledge that they posses, however, they
are able to demonstrate how a particular task is performed. This enables the business analyst to
gain a better understanding of the user’s knowledge. Task demonstration can be applied to
studying how users use existing products. Such an analysis helps in identifying the difficulties
users face in using existing products, and improvements that might be needed (Aleotti et al.,
2003; Kirwan, 1992).
The information collected by this technique is usually evaluated by the business analyst to obtain
the initial set of requirements for the system. This technique typically produces the following
information (Aleotti et al., 2003; Lindgaard, 1994):
• roles and related tasks;
• sequences of events and relationships between them;
• objects involved in tasks and their attributes;
• users' actions and resulting behaviour; and
• breakdowns and problems.
The main benefit of the task demonstration technique is a better understanding of the user's
thoughts and the interaction with a product. Another advantage is that this technique takes less
time to perform because the user usually performs all the tasks in one session. The drawback of
this technique is that the success of the technique depends heavily on the tasks assigned to the

36
users. Hence, it is very important to create the right tasks for a particular application (Aleotti et al.,
2003). Furthermore, the use of this technique is largely limited to eliciting requirements for
interactive applications (Aleotti et al., 2003). Document studies, is introduced in the next section.
2.4.5 Document studies
Business analysis often involves the study of documents such as business plans, market studies,
contracts, requests for proposals, statements of work, existing guidelines, analyses of existing
systems, and procedures (Jansen, Ballintijn and Brinkkemper, 2005; Hofmann and Lehner,
2001). Hence, document studies are essential in providing a complete coverage of the
requirements for the system under development.
Documents provide information about the current system and its functionalities. In addition, the
documents also explicate the need for a particular feature and the arguments against a rejected /
delayed functionality. Furthermore, domain information such as the relationship and interaction of
the system with the other components, and organisational work procedures are outlined in
documents (Jansen et al., 2005; Hofmann and Lehner, 2001). Thus, the business analyst can
obtain considerable amounts of useful information from the study of documents. The drawback of
the document studies technique is that the communication is one sided and impedes the
clarification of, and questioning about, the information presented (Jansen et al., 2005; Hofmann
and Lehner, 2001). The next technique, questionnaires, is reviewed in the subsequent section.
2.4.6 Questionnaires
Questionnaires are written lists of questions that are distributed to a large number of people.
Depending on the information that needs to be elicited, the business analyst formulates the
questions as either open-ended or closed-ended. Questionnaires with closed-ended questions
can be statistically analysed, whereas open-ended questionnaires could be analysed using
qualitative methods (Jansen et al., 2005; Lauesen, 2002).
Closed-ended question questionnaires are suited to situations where it is necessary to obtain
statistical evidence for assumptions (Jansen et al., 2005; Lauesen, 2002). The questions could
provide participants with a set of alternatives as answers, and hence, the results are easier to
evaluate statistically. An example of a closed-ended question is: “Is the length of time the most
important problem at work: Yes / No”. However, because the questions are closed-ended, the
participants have no latitude in explaining their choices. It is also possible that the participants
could misunderstand the question and make a wrong selection. Questionnaires with open-ended
37
questions give the participant the freedom to answer in any way that he/she chooses. This type of
questionnaire is best suited for eliciting opinions and suggestions. Such questionnaires enable
the participants to convey their reasoning for the choice they make for a particular question
(Jansen et al., 2005; Lauesen, 2002). However, in this case there is not only the risk that the
participants may misunderstand the questions, but also that the business analyst may
misinterpret the answers (Jansen et al., 2005; Lauesen, 2002). Prototyping, another business
analysis technique is introduced in the next section.
2.4.7 Prototyping
Prototyping involves creating a partial implementation of the system in order to help the
developers, users, and customers understand the requirements (White and Dhillon, 2005;
Leffingwell and Widrig, 2000). This technique is used to gain a better understanding of poorly
defined and fuzzy requirements of a system (Cameron, 1989).
Once the prototype is built, the users of the system should ‘play’ with the prototype in an
environment which closely simulates the target setting of the final system (Cameron, 1989). This
enables observation of the influence of environmental and other external factors that affect the
system (White and Dhillon, 2005; Leffingwell and Widrig, 2000). Furthermore, for the results to be
reliable, it is recommended that various types of users be selected for exercising the prototype.
After using the prototype, the users should give a “Yes, But” response, which reveals the
unknown user needs. After “playing” with a prototype, users and the business analyst should
have a better picture of what the system requirements are (Leffingwell and Widrig, 2000).
The result of prototyping can be two kinds of requirements (Lauesen, 2002):
• product-level requirements: these are requirements for the product functionalities, which have
been shown to be realistic and useful by the prototype; and
• design-level requirements: these are requirements which specify that the real product should
have interfaces the same as, or similar to, that of the prototype.
The main drawback of this technique is the high demands of cost and time (White and Dhillon,
2005; Cameron, 1989). I-Time, another business analysis technique is explored in the next
section.

38
2.4.8 I-Time
I-Time is commonly used for determining the rationale of the requirements and is referred to as
individual time or introvert time. In this technique, the participants spend a few moments reflecting
on the question and problems. This technique involves a group session that is usually non-
interactive (Alur and Chandrashekharapuram, 2005).
I-Time is conducted according to the following procedure (Lauesen, 2002):
• give a brief introduction of the topic / issue (requirements whose rationale is to be
determined);
• instruct team members either to sit quietly or leave the room briefly to find space where they
can concentrate and focus;
• establish a time limit, depending on the topic or question the team is considering;
• repeat the question or instructions, or display them on a slide or overhead projector during
the break; and
• the participants present their ideas after the break and this process is repeated in subsequent
rounds.
This technique is easy to perform and is inexpensive. However, the success of this technique
depends heavily on the questions posed and the skills of the business analyst (Alur and
Chandrashekharapuram, 2005). Analytic hierarchy process (AHP) is considered in the
subsequent section.
2.4.9 Analytic hierarchy process (AHP)
Analytic hierarchy process (AHP) is used for prioritising requirements, however only if the
complete set of requirements can be obtained in one session (Shih and Liu, 2005; Lauesen,
2002). It involves comparing all unique pairs of requirements to determine which of each pair is of
higher priority. Therefore, if a software project consists of n requirements, the business analyst
must make n(n-1)/2 pair wise comparisons to rank the requirements.
This technique consists of the steps set out below (Shih and Liu, 2005; Lauesen, 2002).
• Outline all unique pairs of requirements.
• Compare the pairs. The comparison results in a hierarchy structure.
• Estimate the relative priority of each requirement on the basis of the hierarchy.
39
The advantage of this technique is that it provides the priorities of each requirement relative to
every other requirement. The disadvantage is that it is time consuming and expensive (Shih and
Liu, 2005). This is feasible for small projects, but as n becomes large, the effort required
dramatically increases. However, the resultant ranking is trustworthy and can be helpful to the
management in deciding which features to implement first. The following section introduces
scenarios, a technique used by business analysts.
2.4.10 Scenarios
Scenarios are descriptions of how users can interact with a system in different situations
(Siponen et al., 2005; Sawyer and Sommerville, 1997). A scenario provides the sequence of
steps in the interaction between the system and the user (Sawyer and Sommerville, 1997).
Scenarios can be generated in different formats, but should at least have the following
information (Sawyer and Sommerville, 1997):
• a description of the state of the system before entering the scenario;
• the normal flow of events in the scenario;
• exceptions to the normal flow of events;
• information about other activities which might be going on at the same time; and
• a description of the state of the system after completion of the scenario.
The main advantage of scenarios is that it enables users to understand the product (system /
requirements) better. As a consequence, the users provide better feedback about the product and
this reduces the incidence of change requests in future. The drawback of the scenarios technique
is that it is time consuming and cost intensive because of the large amount of effort involved in
creating the scenarios (Siponen et al., 2005). Storyboarding is explored in the following section.
2.4.11 Storyboarding
Storyboarding involves a visual representation of a scenario (Leffingwell and Widrig, 2000). It
entails creating drawings depicting a set of user activities that occur in a particular system
(Maiden, Manning, Robertson and Greenwood, 2004; Leffingwell and Widrig, 2000). The
storyboarding technique involves representing requirements through dialogues, toolbars and
pictures for better user comprehension and feedback.
Storyboards are grouped into three types listed below based on the mode of interaction with the
user (Maiden et al., 2004; Leffingwell and Widrig, 2000).
40
• Passive storyboard: in this kind of storyboard, the business analyst simply walks the user
through the interactions, with a “when you do this, this happens” explanation.
• Active storyboard: these provide an automated description of the way the system interacts in
a typical usage scenario.
• Interactive storyboard: this allows the user to experience the system interactions, similar to a
throwaway prototype.
Storyboarding is a simple and effective technique that enhances user understanding of the
requirements (Leffingwell and Widrig, 2000). Storyboarding also helps to identify features that
have been missed by the business analyst. The problem with this technique is the time and cost
involved (Leffingwell and Widrig, 2000). The next section introduces the technique of criticality
analysis.
2.4.12 Criticality analysis
Criticality analysis is a technique which ranks requirements according to the combined influence
of the severity and probability of occurrence of the risk factors (Arthur and Groener, 2005; Hayes,
Dekhtyar, Sundaram and Howard, 2004).
Arthur and Groener (2005) describe two types of criticality analysis: quantitative and qualitative.
The activities involved in using the quantitative criticality analysis technique are listed below.
• Define the reliability/unreliability for each item.
• Determine the portion of the item’s unreliability that can be attributed to each risk factor.
• Rate the probability of loss that will result from each risk factor occurring.
• Calculate the criticality for each risk factor by:
o Risk factor criticality = Item unreliability x Ratio of unreliability associated with the risk
factor x Probability of loss.
• Calculate the criticality of each item by obtaining the sum of criticalities for each risk factor
that has been identified for the item:
o Item Criticality = SUM of risk factor criticalities.
The activities involved for the qualitative criticality analysis are:
• rate the severity of the potential risk factors;
• rate the likelihood of occurrence of each risk factor; and
• compare the risk factors with a matrix, which identifies the severity on the horizontal axis and
occurrence on the vertical axis.

41
Upon completion of this technique, the risk involved in the development of the requirements
elicited is determined and the high risk requirements are identified (Hayes et al., 2004; Lauesen,
2002). The advantage of this technique is that it is easy to perform and time efficient. A drawback
of criticality analysis is that it relies heavily on the expertise of the business analyst to provide
suitable values for the risk factors and it assumes that all the risk sources / factors have been
identified. Work breakdown structure is reviewed in the next section.
2.4.13 Work breakdown structure
The work breakdown structure is an expertise-based technique which organises the project
components into a hierarchy for budget estimation and control. If cost is associated with each
component in the hierarchy, an overall cost estimate for the project development can be
determined traversing the tree bottom up (Baird, 1989; Jiang, Klein, Hwang, Huang and Hung,
2004). Expertise is used in this technique when identifying the components of the hierarchy and
determining the estimates of the individual elements.
A work breakdown structure consists of two hierarchies, one representing the product and the
other illustrating the activities needed to develop the product (Boehm, 1981; Jiang et al., 2004).
The product hierarchy identifies the components in the software product and describes the basic
structure of the overall system. An activity hierarchy shows the various activities that may be
associated with a given software component. An advantage of work breakdown structure
technique is that it provides a good schedule estimate and excellent cost estimates (Boehm,
1981; Jiang et al., 2004). The drawback of this technique is that it is costly and fails to identify
factors which guide the business analyst in his/her estimations (Jiang et al., 2004).
2.4.14 Decision analysis under uncertainty
Decision analysis under uncertainty comprises of an organised structure within which various
options can be laid out and investigated (Jakob, Lars and Peter, 2004; Howard, 1988). Hence,
given an impracticable project, a business analyst can utilise the decision analysis technique to
choose the right alternative that is economically and practically viable.
Decision analysis begins with the construction of the decision tree, which consists of solution
alternatives represented as lines (Clemen, 1996), as illustrated in Figure 2.7 below.

42
8 Figure 2.7: Decision analysis under uncertainty
Source: Clemen (1996)
If the result of taking a decision / alternative is uncertain, a small circle is drawn. If the result is
another decision that is to be taken, then a square is drawn as illustrated in Figure 2.7. At each
circle, possible outcomes are drawn and the probability / cash value of each outcome is
estimated.
The decision analysis technique is advantageous because it clearly lays out the problem so that
all options are challenged and allows the analysis of all possible consequences of the decision.
Furthermore, this technique provides guidance to a business analyst for taking the best decision
(Clemen, 1996). The disadvantage of this technique is that it costly and relies on the business
analyst for identifying the consequences of the decisions and the associated probabilities
(Clemen, 1996). Plus minus implications (PMI) are explored in the subsequent section.
2.4.15 Plus minus implications (PMI)
Plus minus implications (PMI) is a decision making technique which helps evaluate the pros and
cons of a problem under consideration (Lauesen, 2002; Wallace et al., 2004). Research
(Lauesen, 2002; Wallace et al., 2004) found it to be the most commonly used technique for
feasibility analysis.

43
The PMI technique starts with the drawing of a table with the headings: Plus, Minus and
Implications. In the column underneath ‘Plus’ all the positive aspects of the project are included.
For example, the business analyst may list all points which make the project technically,
operationally and economically feasible (Frame, 2002; Wallace et al., 2004). Under the column
‘Minus’, the negative aspects of the project are listed. The last column, ‘Implications’, records the
effects (either positive or negative) which are expected to occur when the project is completed
and delivered. Examples of project implications could be: capturing a large percentage of the
market share or the necessity to include localisation features (Wallace et al., 2004).
The PMI technique is simple, cost effective and time efficient. However, this technique is unclear
about the weighting of points and relies heavily on the experience of the business analyst. As a
consequence, the results obtained can be misleading if this technique is performed by
inexperienced business analysts. The subsequent section reviews affinity analysis technique.
2.4.16 Affinity analysis
Affinity analysis involves writing a concept on a note and sticking it on a wall or board. A team
then moves the notes around to form groups based on how they feel the concept relates to the
others (Rygielski, Wang and Yen, 2002). Essentially, this technique is a categorisation technique
where users sort various concepts into several groups (Goguen and Linde, 1993). The activities
involved in affinity analysis are listed below (Goguen and Linde, 1993).
• Form a team of four to six people so that there is good mix of experience and perspectives.
• Clearly state what the team is trying to accomplish and what the end result of the exercise
should be.
• Use notes to record concepts (requirements) in whole sentences and not just as a single
word.
• Tack cards to wall or whiteboard in no particular order.
• The team members sort the cards into groups based on their intuition. No person should
influence the other person’s decision.
• For each group, create header cards which concisely describe what each group represents.
The header cards should be single word titles and meaningful. Write sub-header cards for
subgroups, if necessary.
• Connect the related headers and sub-headers with lines to generate an affinity diagram.
Affinity analysis is an effective technique for classifying requirements so that they are easy to
comprehend. This technique is very effective to use when there is a large amount of data that

44
needs to be classified. Moreover, it is a simple technique which can be performed in a short time
frame. The drawback of affinity analysis is that for large amount of data, a huge canvas is
necessary to conduct this technique. In addition, this technique is fairly expensive because it
involves approximately six people and a business analyst, who manages the proceedings of the
meeting. The subsequent section introduces a review of tools from literature, commencing with
Rational rose.
2.4.17 Rational rose
Rational rose5 is a tool intended for analysis, modelling and construction of software applications
(Cossentino and Potts, 2002). Business analysts use Rational rose to model solutions with
classes, actors (stick figures), use case elements (ovals), objects (rectangles) and
messages/relationships (arrows) in the form of sequence diagrams (Cossentino and Potts, 2002).
Rational rose is able to document solutions and generate code in programming language such as
C++, Visual Basic or Java (Damm, Hansen, Thomsen and Tyrsted, 2000).
The benefit of Rational rose is the ability to provide for iterative development, as new
requirements can be developed in phases (Cossentino and Potts, 2002; Damm et al., 2000).
However problems with Rational rose relate to integration with other systems or interfaces (Faraj,
Alshawi, Aouad, Child and Underwood, 1999). After reviewing Rational rose, an examination of
Viso was conducted, and follows in the next section.
2.4.18 Visio
Visio6 is a drawing and diagramming tool that is primarily used to convert business and technical
documents into visual diagrams (Reilly and Bendiab, 2002). Visio is mainly intended for
enterprise-level projects and is used to document and communicate information (Reilly and
Bendiab, 2002).
The benefits of Visio include easily creating and documenting diagrams, as well as using the tool
as a communicate mechanism to visualise and ideas more effectively (Auer, Tschurtschenthaler
and Biffl, 2003). However a disadvantage of this tool relates to problems managing large
diagrams on a computer screen (Graaf, Lormans and Toetenel, 2002). After examining Visio, a
review of ARIS was conducted, and follows in the subsequent section.
5 http://www.rational.com 6 http://www.microsoft.com

45
2.4.19 ARIS
ARIS7 is a modelling tool, which is primarily used to convert business requirements into process
flow diagrams. ARIS further contains features for remodelling and analysis of business processes
(Stutz, Siedersleben, Kretschmer and Krug, 2002).
However, it was found that analysts who are not trained to use ARIS have difficulty understanding
the complex functionality of this tool (Toh and Harding, 1999).
This section concludes the review of the business analysis techniques and tools. The
contributions and shortcomings of business analysis methodologies, techniques and tools are
presented in the following section.
2.5 Contributions and shortcomings of business analysis methodologies,
techniques and tools
Table 2.1 summarises the contributions and shortcomings of the methodologies which were
identified in section 2.3. The major problems with the business analysis methodologies are that
the phases are at too high a level and the objectives, relevance and outcomes of these phases
are not clearly defined. The second problem is that the activities, techniques and tools are not
specified for the phases.
1 Table 2.1: Business analysis methodologies - contributions and shortcomings
Methodology Contributions Shortcomings
Requirements engineering
process methodology
• Techniques specified for
each phase
• Phase objectives not clearly
defined
• Single techniques specified for
each phase
• Phase outcome not defined
• Only covers early stages
• Inadequate level of detail
• Tools not specified
Requirements triage
methodology
• Adequate level of detail
• Phase objectives not clearly
defined
• Phase outcome not defined
7 http://www.ids-scheer.com

46
• Activities and techniques not
specified for the phases
• Only addresses middle portion
of business analysis
Knowledge level process
methodology
• Identifies phases
• Inconsistent level of detail
• Phase objectives not clearly
defined
• Phase outcome not defined
• Techniques and tools not
specified for the phases
• Complex, difficult to change
• Not general in nature
(scenario-based)
Win-win spiral
methodology
• Ease of use
• Inadequate level of detail
• Phase objectives not clearly
defined
• Phase outcome not defined
• Activities, techniques and tools
not specified for the phases
Process framework
methodology
• Focuses on documents
produced
• Inadequate level of detail
• Phase objectives not clearly
defined
• Phase outcome not defined
• Activities and tools not
specified for the phases
Requirements generation
methodology
• Identifies phases
• Inadequate level of detail
• Activities at a high level
• Techniques and tools not
specified for the phases
Table 2.2 and Table 2.3 summarise the contributions and shortcoming of the techniques and
tools identified in section 2.4. Highlighting the contributions and shortcomings of techniques and
tools shows that incorrect selection could hamper the outcome of a phase of business analysis.

47
2 Table 2.2: Business analysis techniques - contributions and shortcomings
Techniques Contributions Shortcomings
Joint Application Design
(JAD)
• Elicits news ideas, cost
effective, simple
• Promotes creativity, team
spirit
• Business analyst has to have
strong people management
skills.
• This technique should be
followed by idea reduction
techniques
Interviews • Cost effective
• Provides opportunity to
explore topics in depth
• Time consuming
• Interview questions are critical
for success
• Assumes interviewee has
access to accurate information
Observation • Simple and cost effective • Cannot collect information
about events that rarely
happen because of limited time
Task Demonstration • Suited for interactive
applications
• Time efficient
• Success dependent on tasks
assigned to the user
Document Studies • Provides comprehensive
information
• Involves one-way
communication
• Business analyst may get
frustrated
• Takes a long time to read the
documents
Questionnaires • Large user coverage
• Cost effective, simple
• Success dependent on the
questions
Prototyping • Provides good user
feedback
• Helps user in
comprehending the
requirements
• Cost and time intensive
I-Time • Cost effective, simple
• Questions posed to user are
critical to success
• Needs to be followed by a
discussion

48
Analytic Hierarchy Process
(AHP)
• Provides relative priorities
• Time consuming, cost
intensive
• Applicable if requirements
obtained in a single iteration
Scenarios • Easy to comprehend
• Better feedback from
users
• Cost and time intensive
Storyboarding • Easy to comprehend
• Better feedback from
users
• Cost and time intensive
Criticality Analysis • Simple, cost effective,
time efficient
• Assumes all risk factors are
known before analysis
• Single estimate for risk factors
Work Breakdown Structure • Good schedule cost
estimates
• Time consuming and large
effort required
Decision Analysis Under
Uncertainty
• Clear problem definition • Relies on the business analyst
for identifying the
consequences of the decisions
and the associated
probabilities
PMI • Cost effective, simple • Weighing of points is not clear
Affinity Analysis • Simple, fosters team spirit
• Can be conducted in a
short time frame
• Difficult to manage for large
amount of data
• Cost intensive
3 Table 2.3: Business analysis tools- contributions and shortcomings
Tools Contributions Shortcomings
Rational rose • Iterative development
functionality
• Problems integrating with other
systems or interfaces
Visio • Easy to create and
document requirements
• Problems managing large
diagrams on a computer
screen
ARIS • Good features for
modelling and analysis
• Difficult for untrained users

49
It is thus evident that, although prior research has made important advances, business analysis
methodologies are inadequate for business analysis. In particular, the lack of clear objectives,
relevance and outcomes of the phases, as well as activities, techniques and tools not mapped to
those phases, make business analysis methodologies inadequate. The following section
presents a conclusion of the literature review.
2.6 Conclusion of the literature review
This chapter introduced a literature review by presenting recent studies pertaining to business
analysis methodologies. Thereafter, research relevant to business analysis techniques and tools
were presented. Moreover, the contributions and shortcomings of methodologies, techniques and
tools were examined. The lack of clear objectives, relevance and outcomes of the phases were
presented as shortcomings to the methodologies from literature. The literature review also
illustrated that techniques and tools were not mapped to the relevant phases of a methodology.
As discussed in chapter 1, section 1.4, this research attempts to overcome these problems by
developing a business analysis methodology with phases that have objectives, relevance and
outcomes, as well as appropriate activities, techniques and tools for those phases. The following
chapter details the research methodology used for this study.

50
Chapter 3
Research Methodology
3.1 Introduction
The literature review in chapter 2 introduced the underlying conceptual framework pertaining to
business analysis methodologies.
This chapter establishes the research methodology used to carry out this study, and justifies the
qualitative approach that allows for in-depth probing and detailed responses. The pre-test and
pilot studies conducted are also illustrated. Importantly, the data gathering methods comprising of
individual interviews and focus group interviews are demonstrated. Moreover, the sample
selection, characteristics of participants and settings for each of these data gathering methods
that are used for this study are further introduced. The data analysis strategy including the data
management strategy, content analysis and analysis within and between interviews are
presented in detail. This chapter further introduces the data coding and category construction
procedure used for this research. Moreover, the assessment of trustworthiness, criteria for
reliability and validity, as well as ethical considerations of the researcher are also covered. The
following section introduces the qualitative research design used in this study.
3.2 Qualitative research design
Leedy (1993) defines a research design as an operation framework within which facts are placed
to make their meaning clearer. The aim of a research design is to describe and analyse methods
used, hence clarify their presuppositions and consequences, and highlight their limitations
(Leedy, 1993). Creswell (1994) suggests that qualitative research is a free-form research
methodology that is used to gain insight into underlying issues surrounding a research problem
by gathering non-statistical feedback and opinions rooted in people's feelings, attitudes,
motivations, values and perceptions, often from small samples.
A qualitative design was selected for this research because it allowed for in-depth probing of
issues and greater detail in responses (Denzin and Lincoln, 1994). It also allowed for interaction
with the participants whereby probing questions could be asked based on previous responses.
Further, it allowed for interaction between group members in the focus group interviews, which
often stimulated discussion and uncovered issues unanticipated by the researcher (Dixon et al.,
1988; Hussey and Hussey, 1997).

51
The qualitative research design used for this study is illustrated in Figure 3.1.
9 Figure 3.1: Overview of the qualitative research design
Source: Adapted from Baskerville (1999)
Qualitative data gathering methods consisting of individual interviews and focus group interviews
were used for this study. The criteria for triangulation, the application of different data gathering
methods to study the same phenomenon, was used to test the consistency of findings obtained
through the individual interviews and focus group interviews because it has been argued that
triangulation increases the reliability and validity of a final result (Baskerville, 1999; Dixon et al.,
1988). It is based on the assumption that any bias inherent in a particular method can be
neutralised when used together with other methods, i.e. the weakness from one method can be
overcome with another method (Hussey and Hussey, 1997; Yin, 1994). Illustrated in Figure 3.1,
content analysis, as well as analysis within and between interviews was then independently
conducted on the data from the individual and focus group interviews. The results from each of
these data gathering methods were then cross-checked against each other.
In order to improve the reliability and validity of the data gathering methods, a pre-test and pilot
study was conducted, and follows in the next section.

52
3.3 Pre-test and pilot study of data gathering methods
A pre-test refers to a small-scale trial of particular research components while a pilot study is the
process of carrying out a preliminary study, going through the entire research procedure with a
small sample (Mathison, 1988; Maxwell, 1992; Patton, 2001). Compeau and Higgins (1995)
recommend that both a pre-test and a pilot test be conducted prior to the initial data collection
phase in order to validate the data gathering methods and ensure that they are free from errors.
Further, a pre-test and pilot study serves as a trial run and enables a researcher to revise the
methods and logistics of data collection before starting the actual fieldwork (Mathison, 1988;
Maxwell, 1992; Kvale, 1995).
As a result of the pre-test and pilot study, the reliability and validity of the research is improved;
time, effort and money can be saved in the long run (Mathison, 1988; Maxwell, 1992; Patton,
2001). A pre-test and pilot study of individual and focus group interviews was therefore conducted
for this study to improve the reliability and validity of the results. See section 3.5.2 for the
individual interview pre-test and pilot study, as well as section 3.6.2 for the focus group interview
pre-test and pilot study.
The following section introduces the sample selection, characteristics of the participants and the
research settings.
3.4 Sample selection, characteristics of participants and research settings
Initially, the individual and focus group interviews were conducted with the researcher’s
colleagues and former work colleagues from Bank A and Bank B. These participants then
suggested further participants within those organisations, and so the process continued. This
method of sample selection is known as the snowball approach, and is widely accepted in the
field of research (Sutherland, 1994).
From this snowball sample, non-randomised purposive sampling was conducted to add reliability
to the data (Maxwell, 1992). Non-randomised purposive sampling is a sampling method based on
the judgement of the researcher, where participants are chosen, based on their knowledge of the
phenomenon the researcher is studying (Leedy, 1993). The following criteria were used to select
the non-randomised purposive sample (Maxwell, 1992):
• participants who had experience and knowledge in business analysis; and
• participants that were verbally fluent and able to freely communicate their feelings, thoughts
and perceptions to the research.

53
The final sample of participants represented different types of IS professionals, made up of CIOs,
business analysts, project managers and IS managers from Bank A and Bank B. The
characteristics of the participants were as follows. The CIOs were individuals that were
responsible for the strategic planning of information systems and technology within each bank.
Business analysts were accountable for identifying business needs and proposing solutions.
Project managers, on the other hand, were involved with the implementation of solutions and
systems. Finally, IS managers were responsible for the management of information systems and
technology within each bank.
In total, 45 participants contributed to this research. Twenty two of these participants were
interviewed individually and 23 participated in 2 focus group interviews. Tables 3.1 and 3.2
represent the sample for the individual interviews and the focus group interviews respectively.
Furthermore, participants in this study were only involved with one data gathering method, i.e., if
a participant was interviewed individually, then that candidate did not participate in the focus
group interviews. Further, most of the participants asked not to be named and are therefore not
identified in this research.
The following sections present the data gathering methods consisting of individual interviews and
focus group interviews, used for this research.
3.5 Individual interviews
The purpose of the individual interviews was to gather data in order to develop the business
analysis methodology. Interviews offer researchers the chance to explore topics in depth and to
gain appreciation of the subject area (Campbell, 1996; Goguen and Linde, 1993). Questions that
were asked during the interviews were semi-structured. Individual interviews were used for this
study because these allowed for the collection and recording of complex responses (Hussey and
Hussey, 1997). Individual interviews also allowed the researcher and participant to have full
discussions and explanations of the questions and answers (Yin, 1994). Moreover, individual
interviews allowed the same questions (see Appendix C) to be posed to each participant which
made interviewing of a number of individuals more systematic and comprehensive (Silverman,
2000).
However, the researcher is also aware that individual interviews limit the use of alternative lines
of questioning. Alternative lines of questioning refers to the posing of different questions to
different people, depending on their particular experiences (Dixon et al., 1988; Hussey and
54
Hussey, 1997), for example, senior business analysts could be interviewed in more detail than
junior business analysts. However, the benefit of the researcher and participant to have full
discussions outweighed this limitation (Creswell, 1994).
3.5.1 Individual Interview protocols
The individual interview protocol, presented in Appendix C, was designed to probe key questions
around the central theme of this research. It consisted of 5 questions, most of which the
interviewees were encouraged to answer at length. The design of the individual interview protocol
was influenced by the need to elicit qualitative information to develop a business analysis
methodology (Goguen and Linde, 1993). The major issues covered in each interview were:
• phases of a business analysis methodology;
• objectives, relevance and outcomes of these phases;
• activities of a business analysis methodology;
• techniques of a business analysis methodology; and
• tools of a business analysis methodology.
3.5.2 Pre-test and pilot study of individual interview protocol
Pre-test interviews were conducted with 2 candidates from Bank A. The pre-test revealed the
need to make changes to some of the questions (Fowler, 1995). Changes were made to the
wording of the questions in order to personalise them as follows. For example, question 3, “for
each phase described above, list the activities that you perform?” was modified to “now, for each
phase mentioned above, please tell me about the activities you perform when conducting
business analysis. Shall we begin with phase 1?”. Question 4, “for each phase described above
list the techniques that you utilise?” was changed to “for each phase mentioned above, please tell
me about the techniques you utilise when conducting business analysis?”.
After these changes to the individual interview protocol, a pilot study was then conducted (Fowler,
1995). For the pilot study the modified interview protocol was used to conduct individual
interviews with 3 different candidates from Bank B. The data from these 3 interviews were
analysed using the data analysis strategy described in section 3.7 (Mathison, 1988; Maxwell,
1992; Kvale, 1995). Adequate results were obtained, and no further changes were made to the
interview protocol (Mathison, 1988; Maxwell, 1992; Kvale, 1995).

55
3.5.3 Individual interview sample selection, characteristics of participants and
settings
In total, 69 people were identified for the individual interviews. Of these, 30 candidates said they
were too busy to be interviewed, and 17 did not respond to the invitation. Twenty two individual
interviews were carried out. These individual interviews were conducted in June 2005. The time
duration of these interviews was approximately half an hour. Table 3.1 presents the participants
identified and those who participated in the individual interviews.
4 Table 3.1: Sample table for individual interviews
Bank A Bank B Total
Identified Participated Identified Participated Identified Participated
Business
analysts
15 8 12 5 27 13
CIOs 1 1 1 1 2 2
Project
Managers
10 3 10 2 20 5
IS
managers
10 1 10 1 20 2
Total 36 13 33 9 69 22
Thirteen business analysts, 2 CIOs, 5 project managers and 2 IS managers were interviewed
from Bank A and Bank B.
3.5.4 Conducting individual interviews
Each interview was conducted by the researcher on the work premises of the participant, usually
in the interviewee’s office. All interviewees agreed to allow the interview to be recorded using a
tape recorder.
The individual interviews commenced with an introduction, followed by the first question from the
interview protocol related to their understanding of business analysis. The specific questions
relating to a business analysis methodology followed. The specific questions were asked to make
sure that the interviewee had covered all the areas deemed important by the objectives of this
research. Interviewees were permitted freedom to digress from the theme of a particular question,
as long as the information given was useful to the research topic (Creswell, 1994).

56
Where answers were unclear or ambiguous, clarification was requested by using a mirroring or
reflecting probe such as, “What you seem to be saying….” Explanatory probes such as, “What did
you mean by that?” or “What makes you say that?” and focused probes such as, “What sort of
systems/measure/etc.?” were used when necessary (Creswell, 1994). Silent probes also proved
to be effective (the interviewer remains quite and, in so doing draws out further response from the
interviewee). Drawing out probes, where the interviewer repeats the last few words of the
participant, helped to draw out further information. This helped obtain information from the
interviewee that might not have emerged naturally (Mathison, 1988; Maxwell, 1992). Care was
taken to avoid influencing responses by agreeing or disagreeing with statements, or even by the
use of body language or facial expressions (Creswell, 1994).
To ensure that the interview was complete, the interviewees were asked at the end of the
interview what important issues they thought had not been covered by the interview (Creswell,
1994). Participants said that the interview had covered the important issues. In order to test the
consistency and increase the reliability of the findings for the business analysis methodology,
focus group interviews were held (Baskerville, 1999; Dixon et al., 1988).
3.6 Focus group interviews
The purpose of the focus group interviews was to gather data in order to develop a business
analysis methodology. According to Silverman (2000), in the applied social sciences focus group
interviews are among the most widely used research tool. A focus group takes advantage of the
interaction between small groups of people. Participants respond to, and build on, what others in
the group have said. Focus group interviews allowed the researcher to elicit ideas, insights and
experiences from a small group of participants in a limited period of time (Lincoln and Guba,
1985), to develop a business analysis methodology.
However, the researcher is also aware that only a limited number of questions can be covered
and that unexpected diversions can occur in a focus group such as power struggles among
participants (Patton, 2002, Silverman, 2000). Nevertheless, the benefits of participant interaction
as stated above of a focus group interview outweigh these limitations (Creswell, 1994).
3.6.1 Focus group interview protocols
The focus group interview protocol, presented in Appendix D, consisted of 5 questions, most of
which the interviewees were encouraged to answer at length (Goguen and Linde, 1993). The
design of the focus group interview protocol was influenced by the need to find qualitative

57
information and identify the relevant phases, activities, techniques and tools of business analysis
methodology.
3.6.2 Pre-test and pilot study of focus interview protocol
A pre-test of the focus group interview protocol was conducted with 2 candidates from Bank B.
However, no changes were made to the any wording of the questions as satisfactory responses
were received.
As the data analysis strategy was already tested with the individual interview pilot study, another
pilot study for the focus group interviews was not deemed necessary. The reason is that the
same data analysis strategy, described in section 3.7, was being used for both data gathering
methods (Mathison, 1988; Maxwell, 1992; Kvale, 1995).
3.6.3 Focus group interview sample selection, characteristics of participants and
settings
Two focus sessions, each made up of 12 and 11 participants respectively, were held at Bank A
and Bank B. These focus group interviews were held in August 2005. Table 3.2 lists the
candidates who participated in the focus group sessions.
5 Table 3.2: Sample table for focus group interviews
Focus Group 1
Bank A
Focus Group 2
Bank B
Total
Business analysts 5 4 9
Project Managers 3 4 7
IS managers 4 3 7
Total 12 11 23
The duration of these sessions varied between half an hour and one hour, the average session
time being about 45 minutes. Nine business analysts, 7 project managers and 7 IS managers
participated in the focus group interviews.

58
3.6.4 Conducting focus group interviews
The focus group interviews were conducted by the researcher on the work premises of the
participants, i.e., one focus group interview at Bank A, and one focus group interview at Bank B.
All interviewees agreed to allow the sessions to be recorded using a tape recorder.
The focus group interviews started with an introduction, a question related to their understanding
of business analysis, followed by the more specific questions (see Appendix D). Freedom to
digress from the theme of a particular question was permitted as long as the information given by
the participants was useful to the research topic (Silverman, 2000). Moreover, participants were
allowed to build on the responses of other participants, as well as to debate any concerns
(Mathison, 1988; Maxwell, 1992). As suggested by Creswell (1994), the researcher avoided
influencing responses by agreeing or disagreeing with statements.
In the closing stages of the focus group interview, the participants were asked if all the issues
they deemed relevant were considered (Creswell, 1994). Participants said that the focus group
interview had covered the important issues.
After the participants had completed the individual interviews and focus group interviews, data
analysis was conducted with the data collected. The data analysis strategy used for this research
follows.
3.7 Data analysis strategy
According to Strauss (1987), a data analysis strategy is a process of systematically applying
logical techniques to describe, summarise, and compare data. The following strategy was applied
to the analysis of individual interviews and focus group interviews independently.
3.7.1 Data management
Data management was designed to maintain as much of the participants’ ideas as possible from
the individual and focus group interviews, as well as to permit ongoing analysis (Patton, 2001;
Strauss, 1987). As previously stated, individual and focus group interviews were recorded using a
tape recorder, with permission from the participants (Mathison, 1988; Maxwell, 1992). Further, the
researcher wrote abbreviated notes in a section of the interview protocol (Maxwell, 1992) called
“interview comments” (see Appendices C and D). These are referred to as “raw” field notes
gathered from individual and focus group interviews (Patton, 2001).

59
After each individual and focus group interview, the recordings and “raw” field notes were
transcribed by the researcher into a notebook, and are referred to as “expanded” field notes
(Morse, 1994). These “expanded” field notes were written as full sentences, with the researcher
adding commentary as well as anything relevant which he remembered, but had not had time to
write down (Mathison, 1988; Maxwell, 1992; Patton, 2001). The individual and focus group
interviews were analysed separately. The technique used to analyse this data follows in the next
section.
3.7.2 Content analysis and analysis within and between interviews
Content analysis is a procedure for organising non-structural information into a standardised
format that allows a researcher to make inferences about the characteristics and meaning of
written or recorded material (Merriam, 1998). Analysis within and between interviews was used to
analyse the “expanded” field notes (Merriam, 1998). Strauss (1987) suggests that content
analysis be used in the reduction of qualitative data to develop a larger, more consolidated
picture:
“Content analysis is necessary to systematically and objectively derive
categories of responses that represent homogenous thoughts or opinions. This
is done to facilitate interpretation of the large volume of lengthy and detailed
responses. This form of content analysis is known as open coding or context-
sensitive scheme coding. This form of analysis involves a researcher firstly
coding, and then naming categories through a detailed examination of the data.
A pre-determined framework of possible responses is not used, but the actual
text provided by participants is used to generate the categories as well as to
summarise the data. This involves an iterative interpretation process of first
reading responses, then rereading to establish meaningful categories, and
finally rereading select responses to refining the number and meaning of
categories in a manner deemed most representative of the participants’ text”
(p106).
The “expanded” field notes from the individual and focus group interviews were analysed
independently using the content analysis procedure above. The “expanded” field notes from each
data gathering method did not influence or feed into each other. Analysis within and between
interviews was also conducted to increase the reliability of the data (Merriam, 1998). The data
coding approach follows in the next section.

60
3.7.3 Data coding
Strauss (1987) suggests that for open coding, codes may emerge from a preliminary examination
of the data. He suggests a researcher “breaks down the contents of the data into meaningful and
pertinent units of information”, (p108). He states codes may be based upon words or themes that
identify text or premises that relate to the research objectives. Using this process, codes were
assigned by the researcher, to responses received from the individual interviews and focus group
interviews. Codes were written in the margins of the notebook containing the expanded field
notes (Morse, 1994; Strauss, 1987). In an effort to reduce potential coding error, responses
deemed “incomprehensible” within the context of the question were not coded (Silverman, 2000).
The category construction strategy follows in the next section.
3.7.4 Category construction
Category construction was performed using the following procedure, recommended by Strauss
(1987):
”The researcher gives each response a label known as a code. The researcher
assigns these labels (codes) to units or sections of interview transcripts, notes
or other sources of data. Then the researcher defines conceptual categories -
i.e. clusters of concepts or ideas that may be suggested by the research
questions” (p109).
After the data coding, categories for a business analysis methodology were defined. Based on
the research questions, categories and subcategories such as phases, activities, techniques and
tools were represented in the form of tables (Merriam, 1998; Strauss, 1987). Responses were
then summarised into the tables for each question, and the number of times each response was
mentioned was counted (Merriam, 1998; Strauss, 1987). Each question’s response was then
ordered in descending number of mentions, causing the most popular responses to be at the top
of each table (Merriam, 1998; Strauss, 1987). These tables can found in Appendices E and F.
The cross-checking strategy follows in the next section.
3.7.5 Cross-checking of results
After the data coding and category construction were performed on the individual and focus group
interviews, the data from each these methods were cross-checked against each other. Silverman
(2000) suggests a researcher should “cross-check data by selecting high frequency mentions and

61
eliminating low frequency mentions” (p188). Therefore, the data from the individual interviews
was cross-checked against the data from the focus group interviews by selecting the most
frequently mentioned responses for each category and eliminating responses with a low
frequency of mentions. This strategy allowed the comparison of one data set against another to
check for patterns, contradictions and examine overlapping facets, to increase the reliability of the
final result (Baskerville, 1999).
This cross-checked data was then compared to the business analysis methodologies which were
identified in the literature review to see if the results overcame the shortcomings found. To ensure
these results were trustworthy, an assessment of trustworthiness was conducted, and follows in
the next section.
3.8 Assessment of trustworthiness
Lincoln and Guba (1985) suggest that trustworthy qualitative research needs to be based on
“systematic collection of data, using acceptable research procedures, and allowing the
procedures and findings to be open to systematic critical analysis from others” (p53). The criteria
used to increase the trustworthiness of this research are set out below (Lincoln and Guba, 1985).
• Thick description: this entails having a detailed description of the research process showing
how the researcher reached the conclusions. This assists other researchers replicate the study
and arrive at the same general scheme (Lincoln and Guba, 1985). This study presented a
literature review, a description of the research methodology, the qualitative research design, as
well as a description of the data analysis strategy. The semi-structured interview protocols were
also presented (Mathison, 1988; Maxwell, 1992; Patton, 2001).
• Prolonged engagement: prolonged engagement involves the researcher investing sufficient
time to learn about the culture to be studied, detecting and minimising distortions that may
slowly shape the data, and building trust with the participants (Lincoln and Guba, 1985). The
researcher of this study has over eight years of experience in business analysis. Also, time was
spent with the participants exchanging introductions prior to the interviews to build up trust with
them (Lincoln and Guba, 1985).
• Persistent observation: this means identifying characteristics and elements relevant to the
research (Lincoln and Guba, 1985). Persistent observation was demonstrated in this study
through the diligent note taking in the form of “raw” field notes and recording of the individual
and focus group interviews (Lincoln and Guba, 1985).

62
• Peer debriefing: this involves exposing oneself to peers in a manner similar to that of an
analytic session, to explore aspects that may be implicit in the researcher's mind (Creswell and
Miller, 2000; Lincoln and Guba, 1985). This was achieved with the assistance of the
researcher’s colleague, of a similar status, who reviewed the research process and as well as
the results of this study (Creswell and Miller, 2000).
• Referential adequacy: referential adequacy is the use of mechanically recorded data such as
tape recorders, videotapes, photographs (Lincoln and Guba, 1985). This study recorded all the
individual and focus group interviews using a tape recorder.
Researchers (Creswell and Miller, 2000; Merriam, 1998; Lincoln and Guba, 1985; Yin, 1994)
further suggest that the trustworthiness of a qualitative study is related to the reliability and
validity of the research, and a discussion of these follows.
3.8.1 Reliability and validity of the research
There are multiple views of reliability and validity in qualitative literature. A few of these views are
set out below.
• Researchers may view reliability and validity from a quantitative perspective to find equivalents
(LeCompte and Goetz, 1982; Andrews, 1984).
• The employment of descriptive language can be used by scholars to provide legitimacy for
reliability and validity (Lincoln and Guba, 1985; Eisner, 1991).
• Researchers may re-conceptualise reliability and validity within a framework (Lather, 1993).
• Some literature suggests that reliability and validity is not relevant to qualitative research
(Wolcott, 1994).
Moreover, within a qualitative research framework, there are no statistical techniques to establish
the reliability and validity of research findings (Terre Blanche and Kelly, 1999; Andrews, 1984).
Therefore, for this research, Yin’s (1994) criteria for reliability (diachronic, synchronic and inter-
judge reliabilities) and validity (instrument, internal, construct and generalisability) are adapted.
Yin (1994) also suggests that if similar patterns are established in data collection from different
sources, the reliability and validity of the interpretations is enhanced. The research satisfied these
criteria by comparing the content analysis data from the individual interviews and focus group
interviews, where similar patterns were demonstrated (Creswell and Miller, 2000; Merriam, 1998;
Silverman, 2000).

63
All of Yin’s (1994), criteria for determining reliability and validity of qualitative research, adapted in
the next section, were adopted in this research.
3.8.1.1 Reliability of the research
Reliability refers to the extent to which a measure yields the same results after repeated trials
(Carmines and Zeller, 1979; Yin, 1994). This research supports the diachronic, synchronic and
inter-judge criteria for reliability.
• Diachronic reliability refers to the stability of observed outcomes (Kirk and Miller, 1986).
Content analysis showed consistent patterns in the identification of phases, activities,
techniques and tools, from the business analysts, project managers and IS managers from the
2 banks.
• Synchronic reliability refers to the similarity of outcomes determined from multiple sources of
different measures (Yin, 1994). For this research, standardised instruments were used in the
form of protocols for the individual interviews and focus group interviews, whereby similar
patterns of results were produced.
• Inter-judge reliability is achieved by determining the degree of agreement between
participants (De Vellis, 1991). This research compared the interview responses from the
individual and focus group interview responses (Yin, 1994). Consistent patterns in the
responses from each method indicated the degree of consistent agreement in the responses
analysed.
Validity of this research was achieved as follows.
3.8.1.2 Validity of the research
Lincoln and Guba (1985) state that validity “determines whether the research truly measures that
which it was intended to measure and how truthful the research results are” (p57). The criteria of
validity which apply to this research appear below.
• Instrumental validity addresses whether or not generated observations from one instrument
match those from an alternative measure (Kirk and Miller, 1986; Nunally, 1978). In this
research, data from semi-structured interviews and focus group interviews were compared.
Similar patterns in the results from each method showed the validity of instruments used in this
research (Ragin, 1990; Trochim, 1989). Further, a pre-test and pilot study of the instruments
improved the validity of the instruments (Mathison, 1988; Maxwell, 1992; Patton, 2001).

64
• Internal validity occurs by “applying pattern-seeking and matching methods across cases”
(Yin, 1994). For this research, internal validity was achieved through pattern matching, during
the content analysis which revealed similarities in outcomes from different data collection
methods and different participants (Yin, 1994; Glaser and Strauss, 1967). Analysis within and
between interviews, recommended by Merriam (1998), was conducted to increase the internal
validity of the results. Finally, the “convergence of multiple sources of evidence” (Patton, 2001,
p83) from the individual interviews and focus group interviews contributed to the internal validity
of this research.
• Construct validity is accomplished by the establishment of correctly defined and consistently
applied operational measures for the concepts being studied (Kirk and Miller, 1986). This was
achieved with standardised protocols for individual as well as focus group interviews. Kirk and
Miller (1986) suggest multiple sources of evidence encourage convergent lines of inquiry and
this was accomplished by a diverse sample of participants consisting of business analysts,
project managers IS managers and CIOs. Finally, construct validity was also achieved by
handing over the draft of the interview data to the participants to examine whether they agreed
with the way the researcher presented the information (Patton, 2001; Yin, 1994). This method,
called re-negotiation, was utilised in this research. After the individual interviews and focus
group interviews, the transcripts were discussed with the participants for their approval (Patton,
2001).
• Generalisability, also referred to as external validity (Kirk and Miller, 1986; Patton, 2001), was
achieved in this study through the use of multiple participants with different characteristics and
the observed similarities within the outcomes. These outcomes lent themselves to
generalisability across cases (Kirk and Miller, 1986; Patton, 2001; Yin, 1994).
Lincoln and Guba (1985) suggest that sustaining the trustworthiness of research depends on
reliability and validity. If the reliability, validity and trustworthiness can be tested then a more
“credible and defensible result” (Johnson, 1997, p283) may lead to generalisability which is one of
the concepts suggested by Stenbacka (2001) as the structure for both doing and documenting
high quality qualitative research. Therefore, the quality of a research is related to generalisability
of the result and consequently to the testing and increasing the validity or trustworthiness of the
research (Patton, 2001).
As stated above, all of these criteria have been adopted by this research. Also, the reliability and
validity criteria of this research contributed to the robustness of the design, and are in line with
other criteria recommended by Lincoln and Guba (1985) that relate to credibility, transferability,
dependability, and conformability of qualitative research. Ethical considerations for this research
are discussed in the next section.

65
3.8.2 Ethical considerations
Neuman (1994) suggests that ethics begin and end with the researcher, and that the researcher’s
personal moral code is the strongest defence against unethical behaviour. A discussion
concerning ethical considerations in this study follows.
• Permission to interview IS professionals was first obtained from the directors of the divisions of
the 2 banks were the research took place. Permission was also obtained from the participants
prior to individual and focus group interviews.
• Anonymity and confidentiality refers to the principle that the identity of an individual is kept
secret (Mouton, 2001). Under no circumstances was the research discussed in the contexts of
the identity of the participants, and all data gathered was treated confidentiality. No information
was presented in any way that permitted linking certain individuals to specific responses.
Information was also presented in an aggregate form.
• Informed consent was obtained from all the participants. The researcher also communicated
the aims of the study to the participants. The participants were further informed about the steps
taken to maintain the anonymity of responses, the researcher’s contact details and the process
for receiving a copy of the results.
• Researcher integrity was respected as the researcher strove at all times during the
investigation to maintain integrity as suggested by Mouton (2001).
o Adherence to the highest technical standards for research and practice is essential.
o Since individual researchers vary in their research modes, skills and experience, they
should always indicate the limits of their finding and the methodological constraints that
determine the validity of such findings in the conclusions of a research study.
o In presenting their work, researchers are always obliged to report their findings fully and not
to misrepresent their results in any manner. To the best of their ability, researchers should
also disclose details of their methods and research designs that might be relevant to
interpretations of research findings.
These ethical considerations were adhered to, to the best of the researcher’s ability. The
following section presents a conclusion of the research methodology used for this study.

66
3.9 Conclusion
This chapter introduced the qualitative methodology that allowed for in-depth probing and detailed
responses to carry out this study. The pre-test and pilot studies conducted were also illustrated.
Importantly, the data gathering methods comprising of individual interviews and focus group
interviews were demonstrated. The sample selection, characteristics of participants and settings
for each of the data gathering methods used for this study were further demonstrated. The data
analysis strategy including the data management strategy, content analysis and analysis within
and between interviews were presented in detail. Chapter 3 further introduced the data coding
procedure and category construction used for the research. The assessment of trustworthiness,
criteria for reliability and validity, as well as ethical considerations of the researcher were also
covered. The interpretation of the data is set out in the following chapter, Presentation and
Interpretation of the Evidence Collected.

67
Chapter 4
Presentation and Interpretation of the Evidence Collected
4.1 Introduction
The qualitative research methodology used for this research was presented in the previous
chapter. This chapter presents the findings from the individual interviews and focus group
interviews. Moreover, the content analysis done on these findings and the categories and
subcategories derived are presented. The consolidation and interpretation of these findings with
the literature review are also introduced. Chapter 4 concludes by reviewing the research
questions with a discussion of the results. Figure 4.1 below presents the structure of chapter 4.
10Figure 4.1: Structure of Chapter 4
The structure for this chapter, illustrated in Figure 4.1, is as follows:
4.2 findings and presentation from individual interview (Part 1);
4.3 findings and presentation from focus group interviews (Part 2);
4.4 consolidation and interpretation of the results (Part 3); and
4.5 discussion of the results.
The next section provides an overview of the findings, followed by the construction of conceptual
categories and subcategories for the phases, activities, techniques and tools of a business
analysis methodology.

68
4.1.1 Overview of findings
Recalling chapter 1, Figure 1.1 illustrated the research model explored in this research. Figure
4.2 fulfils that model by identifying phases, objectives, relevance and outcomes for each of those
phases, as well as activities, techniques and tools. These elements of the business analysis
methodology were derived from the individual interviews and focus group interviews. To assist
with clarity, Figure 4.2 also includes the label abbreviations used during the coding of the data
(Merriam, 1998; Strauss, 1987).
In order to justify these findings, an understanding of the conceptual category construction is
required. Using the process described in section 3.7.4 for the category construction, conceptual
main categories called ‘phases’ were derived from the data (Merriam, 1998; Strauss, 1987).
Recalling this section:
”First the researcher then gives each response a label known as a code. The
researcher assigns these labels (codes) to units or sections of interview
transcripts, notes or other sources of data, and assigns them into the
categories. Then the researcher defines conceptual categories - i.e. clusters of
concepts or ideas that may be suggested by the research questions” (Strauss,
1987, p109).
Using this process for category construction, main categories such as a feasibility phase
(PH1FE), business case phase (PH2BC), analysis and design phase (PH3AD) and post-
implementation evaluation phase (PH4PI), as illustrated in Figure 4.2, were derived from the
data. After deriving these main categories, subcategories and sub-subcategories composed of
activities, techniques and tools were similarly derived from the data.
11Figure 4.2: Overview of findings

Shown in Figure 4.2, the first phase of a business analysis methodology was the feasibility
phase (PH1FE), the objective of this phase being a preliminary analysis of a business
requirement. The deliverable outcome of this phase was found to be a feasibility report. A
feasibility phase was deemed to be relevant because it minimised project failure based on poor
business requirements and consequently avoided financial losses. The feasibility phase included:
• feasibility phase activities – identifying a need or opportunity (PR1IN), defining boundaries
(PR1DB), information gathering (PR1IG), opportunity identification (PR1OI), opportunity
analysis (PR1OA) and recommendations (PR1RE) were activities derived from the data;
• feasibility phase techniques – techniques included interviews (TE1IN), observations (TE1OB)
and task demonstrations (TE1TD); and
• feasibility phase tools – the tools including Visible Analyst (TO1VA), Cool Biz (TO1CB) and
Visio (TO1VI) were derived from the data.
Once the feasibility phase had been established, the business case phase (PH2BC) was
derived. This research indicated that the objective of a business case phase was to elaborate on
the intended solution from the feasibility phase. The outcome from this phase was a business
case document. This phase was judged to be relevant because it defined the scope of the
intended solution. As seen in Figure 4.2, the activities consisted of identifying a solution (PR2IS),
refining boundaries (PR2RB), collating more information (PR2CM), analysing a solution (PR2AS),
assumptions and dependencies (PR2AD), as-is analysis (PR2AA) and recommendations
(PR2ERE). Techniques included criticality analysis (TE2CA), risk reduction leverage (TE2RR)
and fault tree analysis (TE2FT). Finally, tools such as Borland Together (TO2BT), Rational Rose
(TO2RR) and Telelogic (TO2TE) were derived from the data. Thereafter, the identification of
activities, techniques and tools, for the analysis and design phase was perused.
Analysis and design phase (PH3AD) was found to be the third phase of a business analysis
methodology. It emerged that the analysis component of this phase entailed an analysis model
representing the business case solution and the design component entailed transforming that
model into a logical design solution capable of being implemented. This phase was deemed to be
relevant because it generated documentation in the form of an analysis and design model.
Refinement (PR3RE), scope (PR3SC), ownership (PR3OW), redesign (PR3RD), detailed
analysis (PR3DA), design of solution (PR3DS), change management (PR3CM), modelling
(PR3MO) and design signoff (PR3DS) were activities identified for this phase, illustrated in
Figure 4.2. Techniques were affinity analysis (TE3AA), functional hierarchy decomposition
(TE4FH) and modelling (TE5MO). Telelogic (TO3TE), Requisite Pro (TO3RP) and Rational Rose
(TO3RR) were the tools identified.

71
The findings from this study indicated that a post-implementation evaluation phase (PH4PI)
was the final phase of a business analysis methodology. Individual and focus group interview
data suggested that the post-implementation evaluation phase evaluated the implemented
solution by comparing it to the business case objectives. The deliverable from this phase was a
post-implementation review report. This phase ensured lessons learnt from the project are re-
integrated into the organisation, to benefit future projects. For this phase, reviewing of
requirements (PR4RR), reviewing the business case (PR4RB) and reviewing the objectives
(PR4RO) were derived from the data for the activities as shown in Figure 4.2. Traceability matrix
(TE4TM), inspections (TE5IN) and traceability tree (TE6TT) were the techniques identified. The
tools included Ideogramic (TO4ID), Telelogic (TO4TE) and Rational Rose (TO4RR).
A link was also found between the post-implementation evaluation phase and business case
phase. It was found that the business case phase provides a baseline for determining success or
failure at the end of the project.
These findings are discussed in greater detail in subsequent sections and are consolidated with
the literature finding in part 3 of this chapter. The presentation of evidence derived from the
individual interviews follow in the next section.
Part 1
4.2 Presentation of findings from individual interviews
As mentioned in chapter 3, section 3.5.3, 69 people were invited to participate in the individual
interviews. Section 3.5.3, highlighted the interview sample selection as well as the characteristics
of participants and settings. Twenty two people accepted and participated in the individual
interviews, representing an acceptance rate of 31%.
This section presents the findings from individual interviews and is structured as follows:
• understanding of business analysis;
• phases, objectives, relevance and outcomes of a business analysis methodology; and
• activities, techniques and tools for the phases of a business analysis methodology.
It must be noted the most significant evidence (Mathison, 1988; Maxwell, 1992) from Bank A and
Bank B participants will be presented in a single section.

72
Without being specifically asked, 12 participants commented on the relevance of the research.
Their comments give a clear indication of the importance and timely nature of this project. The
opinion of most of the participants on the research initiative is reflected by the words of a project
manager from Bank A:
"I think research of this sort is long overdue. Organisations very often do not fully grasp the
importance of business analysis. They need to plan more effectively and efficiently up front to
ensure a successful implementation. Business analysts desperately need a proper methodology
to ensure a standard process is followed for successful project implementation".
Comments from other participants on the relevance of this research can be found in Appendix E,
Figure E1. The researcher then proceeded to investigate participants understanding of business
analysis, since this is an emerging field and there is some confusion with systems analysis, as
discussed in chapter 1, section 1.1.
4.2.1 Understanding of business analysis
This section presents the participants’ understanding of business analysis. One participant, a
senior business analyst from Bank B, captured the essence of the understanding of business
analysis as follows. He said “Business analysis is about understanding business requirements,
and finding solutions to these requirements. These business requirements can be needs, wants,
problems or opportunities”.
Another IS manager from Bank A was outspoken concerning her understanding of business
analysis. It was her opinion that business analysis comprised of analysing current business
practices as well as analysing problems. In her words “Business analysis is about analysing
current business processes, and understanding your business environment”.
The CIO from Bank B commented “Business analysis is the process of understanding and
defining business requirements”. Furthermore, he commented that business analysis comprises
of “understanding and interpreting a business need or requirement, identifying requirements for
improvements and consulting users”. More evidence to support these findings from individual
interview participants are included in Appendix E, Figure E2.
To summarise, participants from the individual interviews viewed business analysis as the
process of understanding business requirements and solving business problems. Once an
understanding of business analysis was established, participants were probed to explain the

73
phases of a business analysis methodology, which follows in the next section. The most time was
spent on the identification of the phases, because this was the problematic area, as discussed in
the literature review in section 2.5. The next section introduces the first phase of a business
analysis methodology identified by the individual interview participants.
4.2.2 Feasibility phase (PH1FE) - phase 1 of a business analysis methodology
This section intended to derive the first phase of a business analysis methodology from the
individual interviews. Interviewees were asked to name and describe the objective, relevance and
outcome of the first phase that they follow when conducting business analysis (see Appendix C,
individual interview protocol).
A sampling of participants’ comments reveals some interesting insights into their thinking of the
first phase of a methodology. During probing about the objective and relevance of this phase, the
CIO from Bank B said, “The first phase should provide a good foundation to allow pre analysis
and design activities to commence in a focused manner. This phase should highlight the
advantages and disadvantages associated with each option and cover issues such as cost,
revenue and strategic considerations. It should provide management with a firm basis to
determine whether the solution has sufficient merit to continue into more detailed phases”. This
CIO elaborated on the outcome of this phase by stating “The end product of this phase should be
a clear, concise feasibility report to management, which presents solution options with objectives,
conclusions and recommendations”.
A project manager from Bank B made a witty remark about this phase: “Although an unsuccessful
feasibility study may appear to be a failure, it’s not. The real failure would have been if you had
invested your organisation’s money in a project and then lost it due to barriers you failed to
research in advance”.
Additional evidence from participants can be found in Appendix E, Figure E3.
To summarise, the responses from the individual interviews suggest that the objective of the first
phase of a business analysis methodology involves a preliminary study of business problems,
opportunities or requirements. Further, these responses imply that relevance of the first phase
involves a detailed analysis of a business requirement to understand the practicability of
implementing it. Individual interview data suggested that the outcome of this phase should be a
feasibility report to management. The most frequently mentioned name for phase 1 of a
methodology was a feasibility phase (PH1FE), with 15 mentions (25.8% of all mentions). The

74
classification of all responses can be found in Appendix E, Table E1. It is important to remember
that frequency of mentions is an indicator of the intensity of meaning (Neuman, 1994; Neuendorf,
2002; Newbold, Boyd-Barrett and Van Den Bulck, 2002). Intensity emphasises words or phrases
that cannot be experimentally examined or measured (Denzin and Lincoln, 1994; Neuendorf,
2002). A closer look at Table E1 shows that this mention elicited the strongest response, and the
first phase should be a feasibility phase.
Once the first phase had been defined, the next step was to identify the activities for this phase
and thus follows in the next section.
4.2.2.1 Activities for feasibility phase
This section intended to identify the activities used by business analysts for the first phase of
business analysis. Recalling chapter 1, activities were defined as steps or sub-events of a phase.
Below are examples of comments from the individual interviews. Participants identified the
following activities of the first phase of a business analysis methodology.
• Identification of a need or opportunity (PR1IN) – During an interview, a business analyst from
Bank A said, “Identifying a need or opportunity involves a background investigation of the
problem, understanding the need or opportunity and then linking this to the organisations
strategy objective”.
• Defining boundaries (PR1DB) – A project manager from Bank A stated, “Defining boundaries
requires putting the requirement into business context, exclusions and feedback from
stakeholders”.
• Information gathering (PR1IG) – “Information gathering” according to another project manager
from Bank B “includes competitor analysis, market analysis, product analysis and process
analysis”.
• Opportunity identification (PR1OI) – Another business analyst from Bank B suggested,
“Opportunity identification consists of analysing information and identifying opportunities”.
• Opportunity analysis (PR1OA) – With regard to this activity, an IS manager from Bank A stated,
“Opportunity analysis entails customer implication, stakeholder impact, partnership
requirements, organisational impact and financial viability”.
• Recommendations (PR1RE) – For the last activity, another IS manager from Bank A
suggested, “Recommendations include understanding the viable opportunities, pro’s and con’s
and finally a go or no-go proposal”.
75
A classification of these responses including the number and percentage of the mentions is found
in Appendix E, Table E2. Participants were further probed to explain why these activities should
be used for the first phase of business analysis.
A project manager from Bank B said, “These activities can help business narrow the range of
options, assess each of the remaining options and propose solutions …these activities also help
management analyse and understand the impact of new projects before they commit people and
financial resources”.
According to another IS manager from Bank B, “These activities reduce the risk of over-
engineering a solution. They help reduce the number of changes in the development process and
reduce costs by building quality early in the process as well as promoting a more focused
development approach. Further, these activities help identify requirement priorities, and support
more accurate project planning”
In summary, this section identified the activities for the first phase of business analysis. A closer
examination of these responses suggest that these activities assist business analysts in
understanding and narrowing a range of options, assessing each of the remaining options and
then proposing solutions. Further, these activities help identify requirement priorities, and support
more accurate project planning.
Once the activities had been extracted, the next step was to identify the techniques used for this
phase.
4.2.2.2 Techniques for feasibility phase
This section identifies the techniques used by business analysts for the first phase of a business
analysis methodology. Interviewees were asked to name and briefly describe the techniques that
they employed for this phase. The most frequently referenced techniques for the first phase of a
business analysis methodology were “interviews” (TE1IN), “observations” (TE1OB) and “task
demonstrations” (TE1TD). These techniques are classified in Table E3.
Participants were further probed to explain why these techniques should be used for the first
phase of business analysis. A sample of explanations from participants is recorded below.
• Interviews (TE1IN) – A business analyst from Bank A said, “If a business analyst asks the right
questions, this technique can provide valuable information about the system and its problems”.

76
• Observations (TE1OB) - According to one project manager from Bank B, “Observations help
develop a better understanding of the requirements, and to represent them in a clear and
comprehensible manner. In addition, observations provide an effective technique for validating
requirements with the users”. This participant further elaborated, “Users are often vague in
their description of requirements, and observations are valuable because they provide a more
precise view of the requirements, their dependencies and their interactions”.
• Task demonstrations (TE1TD) - An IS manager from Bank B said, “Task demonstrations assist
in providing a better understanding of the requirements; they support validation, assist with
business concerns, and aid in design of the software system”. This IS manager further stated,
“Besides being cost effective, task demonstrations provide a better focus on distinct functions
because they are analysed one at a time. In addition, it is also easier to measure progress and
validate requirements piece by piece”.
In summary, individual interview data suggest interviews, observations and task demonstrations
to be the techniques for the first phase of business analysis. A closer inspection of these
responses to understand why they are appropriate to this phase reveals that these techniques
help a business analyst understand requirements better and clearly represent them. Furthermore,
these techniques support validation and help break down complex problems that result in easier
measures of progress. Identification of the tools for the feasibility phase of business analysis was
conducted next.
4.2.2.3 Tools for feasibility phase
The tools used for the first phase of business analysis were extracted from the individual
interviews in this section. Interviewees were asked to name and briefly describe the tools that
they use for this phases of business analysis. Participants said that the following tools were used
for the first phase of a business analysis: “Visible Analyst8” (TO1VA), “Cool Biz9” (TO1CB) and
“Visio” (TO1VI). These responses can be found in Table E4. A sample of comments from
participants is recorded below.
• Visible Analyst (TO1VA) - During probing, a business analyst from Bank B said, “Various
graphical representations are produced by visible analyst that assist a business analyst in the
understanding and formulation of requirements for the first phase”. The benefit of this tool for
this phase according to him was that “this tool helps to elicit and capture requirements
8 http://www.visible.com 9 http://www.ca.com

77
adequately, so that a business analyst can develop, modify, structure, and present business
requirements appropriately”.
• Cool Biz (TO1CB) - Another IS manager from Bank A said “Cool Biz produce models which can
be used to specify a solution. The models produced can also be checked for completeness and
consistency”. She added, “This tool can be used to group and prioritise requirements, and
check for consistency of requirements”.
• Visio (TO1VI) – “The simplicity, flexibility and advanced functionality make this tool ideal for this
phase”, was the view of another business analyst from Bank B.
Visible Analyst, Cool Biz and Visio were the tools appropriate to this phase because of the
simplicity, advanced functionality, as well as the visual depictions produced by them that help
business analysts understand business requirements. Individual interview data suggests that
these tools can also be use to prioritise as well as check for consistency of requirements, for this
phase.
Once the first phase of business analysis with objectives, relevance, outcomes, as well as
appropriate activities, techniques and tools had been identified, the next step was to identify the
second phase of business analysis. This follows in the next section.
4.2.3 Business case phase (PH2BC) - phase 2 of a business analysis methodology
For the second phase, participants were asked to name and briefly describe the objective,
relevance and outcome when conducting business analysis. A sample of comments from
participants is presented below.
“The business case phase objective” according to a Bank B project manager, “formally presents
the business problem, identifies project options, benefits, costs, risks and defines the scope.
Overall the objective of this phase is to help gain approval from management for a project to
proceed to address the problem and to obtain common agreement on exactly what the project will
deliver”.
A business analyst from Bank A remarked on the relevance of this phase, “When an organisation
has a number of proposed initiative projects, the business case phase is used to assist in
prioritising the various projects. This prioritisation may be achieved by comparing the projects
based upon their benefits, costs and risks”.

78
Another participant, an IS manager from Bank A, captured the essence of a business case phase
as follows, “This phase provides a description of the intended solution with the anticipated costs
and benefits”. According to him, the outcome of this phase “is a start-up document used by
management to assess the pros and cons of a proposed solution and to assess options like
resources and finances for this solution”.
More evidence to support these findings from participants can be found in Appendix E, Figure E4.
Summarising these responses, the indication is that this phase objective involves an elaboration
of the proposed solution from the previous phase. Moreover, the relevance of this phase
encompasses the scope, risks, costs and benefits of the proposed solution. The responses
suggest that the outcome is a business case document. The most commonly mentioned name for
phase 2 of a methodology was a business case phase (PH2BC), with 13 mentions (25.4% of all
mentions). The classification of the responses can be found in Appendix E, Table E5. Activities
for this phase are described in the next section.
4.2.3.1 Activities for business case phase
This section intended to derive the activities for the second phase of business analysis from the
individual interviews. Participants identified the following activities for this phase.
• Identify solution (PR2IS) – According to the CIO from Bank A, “This entails revisiting the
feasibility findings”.
• Refine boundaries (PR2RB) – The same CIO elaborated, “Refining boundaries comprises of
the scope and exclusions of a solution as well as the costs and benefits”.
• Collate more information (PR2CM) – A business analyst from Bank B suggested this activity
entails “additional information including the business architecture, process requirements and
dependencies need to be collated”.
• Analysis of solution (PR2AS) – “Examining the proposed solution in detail” was the response of
an IS manager from Bank B relating to this activity.
• Assumptions and dependencies (PR2AD) – “Assumptions and dependencies” according to a
business analyst from Bank B includes “analysing all speculations and reliances”.
• ‘As-is’ analysis (PR2AA) – Describing this activity, a business analyst from Bank A said
“Examine the current scenario including the process gaps, and conceptual ‘to-be’,
organisational change requirements and system expectations, as well as analyse alternatives”.

79
• Make recommendation (PR2ERE) – According to an IS manager from Bank A, “This phase
concludes with a formal business case as well as a degree of confidence in costs, benefits and
assumptions”.
The responses for the activities of this phase are classified in Table E6. Participants were further
asked to explain why these activities should be used for the second phase of business analysis.
An IS manager from Bank A said, “These activities capture the business ramifications of a project
in an appropriate format for business analysts and decision-makers. When writing a business
case, these activities establish direction, by providing business analysts with an outline of the
steps that are necessary to complete the project…….these activities also minimise risk, by
identifying the financial impacts, risks and rewards of a project”.
Another participant, a business analyst from Bank A said, “These activities provide control, by
providing a benchmark for monitoring project performance and quickly identifying
problems…these activities create discipline, by providing an opportunity to identify and consider
ideas and issues before an option is implemented”.
Another Bank B business analyst remarked, “These activities can help define the project's
resource requirements, investment costs and revenue projections when writing a business case”.
This section identified the activities for the second phase of business analysis. A closer inspection
of these responses reveals that these activities support the business outcome of a project in an
appropriate format for decision-makers. These responses also suggest that these activities
establish direction with cost, benefit and risk assumptions. Studying these responses in more
detail reveals that these activities can provide a benchmark for monitoring performance of the
completed project. The next step was to identify the techniques used for this phase, having
extracted the activities.
4.2.2.2 Techniques for a business case phase
Participants were asked to name and briefly describe the techniques that they followed for the
second phase of business analysis in this section. Techniques for the second phase of a
business analysis methodology were “criticality analysis” (TE2CA), “risk reduction leverage”
(TE2RR) and “fault tree analysis” (TE2FT). These techniques are classified in Table E7.

80
Participants were asked to explain why such techniques should be used for the second phase of
business analysis. The following sample of responses was revealed from participants.
• Criticality analysis (TE2CA) - “Criticality analysis” according to a Bank B business analyst
“focuses on business concerns by assisting in the evaluation of requirements from a financial
perspective”. This business analyst further elaborated, “This technique helps maintain focus on
information related to business, organisational and management constraints”.
• Risk reduction leverage (TE2RR) – Another participant, an IS manager, from Bank A said “Risk
reduction leverage facilitates better decisions during a business case phase because the
requirements are established prior to detailed analysis. Also, projected estimates will tend to
have less deviation from their accruals. Thus, business analysts can make better informed
decisions, and thereby increase the probability of project success”.
• Fault tree analysis (TE2FT) - This IS manager concluded by saying, “Fault tree analysis is a
simple, cost effective technique and provides good estimates when writing a business case”.
These responses suggest that these techniques are beneficial to this phase because they are
financially orientated. Further, these responses imply they can help business analysts make
better financial decisions. Criticality analysis, risk reduction leverage and fault tree analysis were
also found to be simple as well cost effective for this phase. Moreover, these techniques help to
establish the requirements prior to detailed analysis. Once the techniques had been identified, the
tools for this phase of business analysis were pursued.
4.2.2.3 Tools for a business case phase
The tools used by business analysts for the second phase of a business analysis methodology
are identified in this section. According to the participants, “Borland Together10” (TO2BT),
“Softeam Objecteering Project11” (TO2SO) and “Telelogic12” (TO2TE) were tools that should be
used for this phase of business analysis. These tools are classified in Table E8. A sample of
comments from participants is presented below.
• Borland Together (TO2BT) – An IS manager from Bank A commented during probing, “Borland
Together helps a business analyst create a business case, by employing software templates
and scorecards based on best practice criteria that help judge how the business case will be
received”.
10 http://www.borland.com 11 http://www.objecteering.com 12 http://www.telelogic.com

81
• Softeam Objecteering Project (TO2SO) - Another participant, a project manager from Bank B
said, “This tool consists of fill-in-the-blank templates with the potential to produce a complete
business case. Some features are complete management programmes that produce financial
models for business cases as only one of many possible outputs. They are able to deal with
real-world situations in a pragmatic way, not just on a theoretical or abstract level. This tool is
sufficiently easy to learn”.
• Telelogic (TO2TE) - Finally, another project manager from Bank B commented “Telelogic
contains features for preparing business cases, project descriptions, critical assumptions, risk
assessments, conclusions and recommendations”.
These responses suggest that these tools are useful to this phase, because they contain features
and templates that assess the financial impacts of a project. Features such as risk assessments
were found to be practical and simple for this phase. Also, the tools ease of use for developing
business cases was another implied outcome.
The next step, which is now discussed, was to identify the third phase, having identified the
second phase of business analysis.
4.2.4 Analysis and design phase (PH3AD) - phase 3 of a business analysis
methodology
This section intended to derive the third phase of a business analysis methodology. Some
comments from participants are presented below.
A business analyst from Bank A fittingly described the objective of the analysis and design phase
as “consisting of refining agreeing the expectations from the business case". She further said that
analysis and design “consisted of designing solutions and producing models for the solution”.
An IS manager, also from Bank A commented on the relevance of this phase, “during the
previous phases a business analyst identified what the proposed new system is required to do. In
this phase, a business analyst looks at how the new system will fulfil these objectives”. According
to her, “This phase is more focused on the specification of the detailed solution. This phase
focuses on the logical, implementation-independent aspects of a system like the requirements, as
well as dealing with the physical implementation-dependent aspects of a system such as the
system's technical specifications”.

82
One outspoken project manager from Bank B said that this phase entails “transforming all of the
information from the business case into the design for the new system. This phase should include
the system's functionality, hardware and software platform and methods for acquisition”.
A Bank B business analyst described the outcome of analysis and design as “a detailed
specification of all system elements, including the data, processes, impulse, and outputs in the
form of a model”.
More evidence to support this phase can be found in Appendix E, Figure E5.
In summary, the responses from the individual interviews suggest that the third phase of a
business analysis methodology involves presenting the business case in the form of an analysis
and design model, and then transforming that model into a logical solution that can be
implemented. This phase focuses on the technical aspects such as systems functionality,
hardware, software, data and process specifications. The outcome of this phase is an analysis
and design model. The most frequently cited name for phase 3 of a business analysis
methodology was an analysis and design phase (PH3AD), with 13 mentions. These responses
are classified in Appendix E, Table E9. After extracting the third phase, the next step was to
identify the activities. This is reviewed in the subsequent section.
4.2.4.1 Activities for analysis and design phase
Feedback from participants identified the activities of the third phase of a business analysis
methodology as those listed below.
• Refinement (PR3RE) – “Refinement” in the view of a project manager from Bank A “entails
streamlining the goals and expectations from the business case”.
• Scope (PR3SC) – A Bank B business analyst commented, “This activity comprises of the
exclusions and constraints of the solution”.
• Ownership (PR3OW) – “Ownership” exclaimed a business analyst Bank A “can be achieved
with a project champion, a steering committee and management buy-in”.
• Redesign (PR3RD) – An IS manager from Bank A remarked, “This activity includes ‘to be’
design, ‘to be’ viability analysis, process gaps, deficiencies and simulations”.
• Detailed analysis (PR3DA) – A Bank B project manager suggested, “This activity must include
context analysis, risk assessments, customer impact and training”.

83
• Design of solution (PR3DS) –In the opinion of a business analyst from Bank A, “Designing a
solution should include the current architecture of technology and business interface
requirements”.
• Change management (PR3CM) – “People issues like training should be reviewed at this stage”
was the view of the CIO from Bank A.
• Modelling (PR3MO) – A business analyst from Bank B viewed this activity as “producing the
actual model”.
• Design signoff (PR3DS) – “Design signoff” suggested a project manager from Bank A “should
ensure the models are approved and the solution is again compared to the actual requirement”.
These activities are classified in Table E10.
Probing took place whereby participants were asked to explain why these activities should be
used for the third phase of business analysis. A business analyst said, “The business case
solution is at a high level, and these activities give structure and focus to the solution and speed
up the development process”.
Another participant, a project manager from Bank A remarked, “These activities can help a
business analyst by ensuring consistency across projects and enables comparative evaluation
and priorities….these activities also provide a logical and consistent approach”.
Another IS manager from Bank B commented, “These activities assist business analysts by
ensuring methodical thinking and systematic problem solving during analysis and design”. She
further elaborated, “These activities assist a business analyst and customer obtain a mutual
understanding of the requirements”.
A closer examination of these responses suggests that these activities are beneficial to this
phase because they add structure to the development process, and as a consequence speed up
the development process. These activities help business analysts maintain consistency across
projects, and ensure a methodical and systematic approach is adopted. Moreover, these activities
ensure a business analyst and customer have a mutual understanding of the requirements. The
next step was to identify the techniques used for this phase, having identified the activities.

84
4.2.4.1 Techniques for analysis and design phase
Participants mentioned “affinity analysis” (TE3AA), “functional hierarchy decomposition” (TE4FH)
and “modelling” (TE5MO), as techniques for the third phase of a business analysis methodology.
These techniques are classified in Table E11. The following sample of responses was revealed
from participants.
• Affinity analysis (TE3AA) - A project manager from Bank B said, “Analysis and design phase
involves creating a formal model of the problem to be solved. Affinity analysis guides a
business analyst by creating standardisation for this phase. It helps a business analyst to
assess user needs in order to understand the complete problem being solved”.
• Functional hierarchy decomposition (TE4FH) - Another Bank B project manager said,
“Functional hierarchy decomposition can help a business analyst understand the current
system as well as the system that is being developed. This technique further makes a formal
representation of the system being designed”.
• Modelling (TE5MO) - A business analyst from Bank A suggested, “Modelling gives structure
during this phase by creating a blue print of a system solution to a given problem”.
An examination of these responses suggests that, because these techniques develop formal
models of a solution, they are advantageous to this phase. Looking more closely at the
responses, it can be seen that these techniques help a business analyst develop standardisation
and structure by formally representing the solution being designed. Once the techniques were
identified, the tools for this phase of business analysis were investigated.
4.2.4.3 Tools for analysis and design phase
“Rational Rose” (TO3RR), “Visio” (TO3VI) and “Cool Biz” (TO3CB) were tools that participants
suggested be used for the third phase of business analysis. These tools are classified in Table
E12. A sample of comments from participants is recorded below.
• Rational Rose (TO3RR) - A business analyst from Bank B commented, “Rational rose enables
users to see and feel the system during analysis and design. Further, this tool is appropriate
because it speeds up the processes of systems development and gives support for
management of projects, and also enables business analysts to build prototypes more easily”.
• Visio (TO3VI) - A project manager from Bank A remarked, “Visio improves the readability of
complex formal specifications. It contributes to a reduction in development time and costs

85
during analysis and design. Visio ensures easier maintenance of systems developed and
improves communications between the business analysts, programmers, and the end users”.
• Cool Biz (TO3CB) - Finally, a Bank A business analyst said, “During analysis and design, Cool
Biz speeds up the development process by ensuring consistency, completeness and
conformance to standards”.
These responses suggest that these tools speed up development process by ensuring
consistency and completeness. These tools further improve communications between the
business analysts, programmers, and end users. Moreover, for business analysts, these tools
improve readability of complex formal specifications as well as help reduce time and costs. Also,
the responses imply that theses tools enable business analysts to build models more easily.
Once the third phase of business analysis had been identified, the next step was to identify the
last phase of business analysis, which is discussed in the next section.
4.2.5 Post-implementation evaluation phase (PH4PI) - phase 4 of a business
analysis methodology
Participants were asked to name and briefly describe the objective, relevance and outcomes for
the the last phase that they follow when conducting business analysis. A business analyst from
Bank A, referring to the objective of this phase said, “A post-implementation evaluation is
conducted after the project has finished and usually after the project team has been disbanded. It
typically examines how well the project conformed to the original requirements as well as the
running costs as predicted and if users like the system”.
An IS manager from Bank B remarked on the relevance, of this phase “this phase evaluates the
solution to determine whether the anticipated return on investment was achieved and decide
whether continuation or modification of the solution is necessary to meet business requirements”.
A Bank B project manager, referring to the outcome of this phase said, “From a project
perspective, this phase should document the timeline of the project and how it adapted over the
course of the project, analyse the reasons why particular project tasks were difficult and
understand whether a different process might have made them easier”. Finally, he said a post-
implementation evaluation phase should “document and make recommendations for future
projects in the organisation”.
However ten participants said that the post-implementation evaluation phase should be repeated
after an extend period of time, for example, after 6 months and then again after 1 year. One of

86
them, an IS manager from Bank B commented, “A post-implementation evaluation should take
place after a relatively stable operating environment has been established, about six to twelve
months after implementation”.
Notably, 15 participants also said that there was a relationship between a business case phase
and a post-implementation evaluation phase. A business analyst from Bank A said, “Compare the
post-implementation review to the business case to see if the project met the expectations that it
was intended to meet”. Another participant, an IS manager, also from Bank A suggested “a post-
implementation evaluation phase is conducted after system implementation to enable an
organisation to measure the value gained through the new system against the business case”.
In summary, these findings suggest that the objective of this phase entails a review of the
implemented solution including the cost and benefits against the requirements in the business
case. This phase was found relevant because it compares the solution to see how well it
conformed to the original requirements. Moreover, based on the project learning’s, this phase
makes recommendations for future projects in the organisation. The outcome was found to be a
post-implementation phase review report. The most commonly referenced name for phase 4 of a
business analysis methodology was post-implementation evaluation phase (PH4PI), with 18
mentions (35.2% of all mentions). The responses are classified in Appendix E, Table E13.
Furthermore, it was found that this phase should be repeated after an extend period of time.
Individual interview data further suggested that this phase be compared to the business case
phase to see if the project met the deliverables that it was intended to meet. More evidence to
support these findings can be found in Appendix E, Figure E6. After defining the last phase, the
next step was to identify the activities and this follows in the next section.
4.2.5.1 Activities for post-implementation evaluation phase
Opinions concerning the activities of the fourth phase of a business analysis methodology are set
out below.
• Review the requirements (PR4RR) – The Bank B CIO remarked, “The business analyst should
review the original business problem or opportunity”.
• Review the business case (PR4RB) – The view of a business analyst from Bank A was, “The
business case should be the benchmark for the review”.
• Review the objectives (PR4RO) – According to a Bank B project manager, “The objectives
stated in the business case should be used as a point of reference”.

87
More responses are classified in Table E14. Participants were asked to explain why these
activities should be used for the last phase of business analysis.
A project manager from Bank A said, “The post-implementation evaluation phase is conducted to
scrutinise the implementation of a project against the plans and requirements originally
established for the project. These activities create a systematic approach by helping a business
analyst to compare the actual performance of the live project against the requirements. Also,
these activities assess the extent to which the original requirements and objectives were
achieved”.
A business analyst from Bank A said, “A post-implementation evaluation is the last phase in the
project process and represents closure of the feedback loop.…these activities help provide the
lessons learnt and are fed back into the organisation, to the benefit of future projects….these
activities help a business analyst identify ways to improve the value of a project and increase
user morale through the continuous improvement of the solution created”.
Another participant, an IS manager from Bank B said, “These activities help establish
benchmarks and key performance areas”. She elaborated, “These activities help avoid user
frustration by identifying operational issues before they become problems”. She further added,
“The activities can also compare actual costs of the project to those initially projected”.
A closer inspection of these responses suggests that these activities develop a systematic
approach for this phase by comparing the implemented solution against the original requirements.
Furthermore, these activities ensure that lessons learnt are re-integrated into the organisation.
Individual interview data suggests that benchmarks and key performance areas can be
developed with these activities. The next step was to identify the techniques used for this phase,
having identified the activities.
4.2.5.2 Techniques for post-implementation evaluation phase
Responses from participants for the fourth phase of a business analysis methodology were
“traceability matrix” (TE4TM), “inspections” (TE5IN) and “traceability tree” (TE6TT). Appendix E,
Table E15 classifies the techniques given by interviewees. Probing revealed the following
responses from participants.
• Traceability matrix (TE4TM) - “This technique” according to a business analyst from Bank B
“helps a business analyst trace the original project expectations from the business case as well

88
as performance, investment and operating costs, schedules, benefits, and technical capability
to the actual project”. He further added, “This technique also permits a business analyst to
estimate cost and schedule deviations”.
• Inspections (TE5IN) - Another participant, also a business analyst from Bank A suggested,
“This technique helps a business analyst gather information at the end of a project by
comparing the original business case assumptions and justifications to the outcome”. This
participant further elaborated, “Inspections assist a business analyst to draw conclusions,
learned lessons and make recommendations to management”.
• Traceability tree (TE6TT) - A Bank B project manager said, “This technique focuses on helping
a business analyst trace the solution to the original requirements by gathering feedback
relevant to the project”.
In summary, these responses suggestion is that these techniques help a business relate the
business case to the implemented solution. Expectations such as performance, investment and
operating costs, benefits, and technical capability could be traced back to the original
requirements. Furthermore, these techniques could assist a business analysts draw conclusions,
and make recommendations to management. The next step was to identify the tools used for this
phase, having extracted the techniques.
4.2.5.3 Tools for post-implementation evaluation phase
Participants said that “Ideogramic13” (TO4ID), “Rational Rose” (TO4RR) and “Telelogic” (TO4TE)
were tools that should be used for the fourth phase of business analysis. These tools are
classified in Table E16.
A project manager from Bank A said, “Ideogramic contains the documentation required to close
out a project formally. There are templates that help a business analyst hand over all deliverables
and documentation to the end user including termination contracts. There are also guidelines to
that help a business analyst determine the level of project success and identify lessons learned
for future projects”.
Another participant, an IS manager from Bank A said, “Tools like Rational Rose and Telelogic
contain templates for post-implementation reviews. These tools help a business analyst obtain a
complete picture, by capturing all viewpoints”.
13 http://www.ideogramic.com

89
A Bank B project manager said, “Tools like Ideogramic and Rational Rose help a business
analyst by listing all outstanding tasks and issues, by creating a plan to hand over the
deliverables for reviewing project performance. Also, these tools help a business analyst trace the
outcome to the original requirements”.
However, there were mixed responses for the tools relating to the last phase of business
analysis. Eleven participants stated that there were no tools for the last phase of business
analysis. An IS manager from bank B said, “I’m not familiar with any tools for the last phase of
business analysis”.
Overall however, the responses suggest that these tools are appropriate to this phase because
they contain features and templates that can compare the outcome of a project to the original
requirements, as well as formally close out a project. Moreover, these tools assist a business
analyst by listing all outstanding tasks and issues. Furthermore a plan to hand over the
deliverables for reviewing project performance could be created. The identification of tools for the
last phase of the methodology concluded the findings from the individual interviews.
Part 1 introduced the findings from the individual interviews by establishing the phases,
objectives, relevance and outcomes, as well as the activities, techniques and tools of a business
analysis methodology. The findings and presentation from the focus groups interviews follow in
the next section.
Part 2
4.3 Presentation of findings from focus group interviews
A total of 23 people participated in 2 focus group sessions. Recall that focus group 1, made up of
12 participants was held at Bank A, and focus group 2, comprising of 11 participants was held at
Bank B. Section 3.6.3 presented the detailed focus group sample selection, characteristics of
participants and settings.
This section presents the findings from focus group interviews and is structured as follows:
• understanding of business analysis;
• phases, objectives, relevance and outcomes of a business analysis methodology; and
• activities, techniques and tools for the phases of a business analysis methodology.
90
Moreover, the most significant evidence (Mathison, 1988; Maxwell, 1992) in terms of the research
objectives from both focus group 1 and focus group 2 will be presented in a single section.
The following section explains the understanding of business analysis derived from the focus
group interviews. It is worth remembering that the reason for this question (see Appendix D,
question 1) was due to the confusion with systems analysis, as discussed in chapter 1, section
1.1.
4.3.1 Understanding of business analysis
This section presents a synopsis of the understanding of business analysis derived from the 2
focus groups. A participant from focus group 1, a senior project manager said, “Business analysis
is about the understanding business needs and solving these needs with technology. It involves
liaising with business to understand and extract the needs by asking questions like ‘what’ and
‘how’”.
Another participant in this group, a business analyst interjected, “Business analysis is a process
of defining a problem clearly and then specifying a solution to this problem. Contrary to belief, this
solution does not necessarily have to be a technical solution….the solution to a problem could be
a non-technical solution like introducing training to a process”.
In the second focus group, an IS manager, stated, “A business analyst should provide the most
effective solution for the user. In addition a business analyst should help find better ways of doing
things, by providing the BEST solution to the user's requirement that has a minimal impacting on
time and money”.
Another IS manager from focus group 2 said, “Business analysis is about determining and
documenting the information needs, as well as the business and technical requirements the
proposed system must meet. It entails all the activities that go into the investigation, scoping and
definition of a new system. Business analysis is an important part of the system development
process whereby a business analyst identifies the needs and requirements of a user; having
identified these requirements he/she is then in a position to design a solution”.
More evidence to support these findings can be found in Appendix F, Figure F1.
A closer look at the responses reveals that business analysis was viewed as the process of
understanding business needs and then providing solutions to these needs. Focus group data

91
show that the resolution to a problem could be a business or technical solution. The focus group
data also suggest that business analysis entails documenting the business needs and the
solution. Once an understanding of business analysis had been established, the focus groups
were asked to explain the phases of a business analysis methodology. This is discussed below.
4.3.2 Feasibility phase (PH1FE) - phase 1 of a business analysis methodology
This section intended to derive the phases of a business analysis methodology from the focus
group interviews. The groups were asked to name and describe the objective, relevance and
outcomes of the phases that they follow when conducting business analysis. A sample of
comments from participants is presented below.
In focus group 1, a project manager commented on the objective, “A feasibility study is designed
to provide an overview of the primary issues related to a business idea. The purpose is to identify
any ‘make or break’ issues that would prevent the business from being successful in the
marketplace. In other words, a feasibility study determines whether the business idea makes
sense”.
In the second focus group, referring to the relevance of this phase, a business analyst said, “a
feasibility study leads to a business case by examining the range of possible options and
potential issues, and forms a basis for its development”. The outcome of this phase, continued
this business analyst “is a feasibility study document presenting issues that could influence the
success of a potential project and assess the advantages and disadvantages of each option so
they can be ranked”. Addition comments from participants in the focus groups can be found in
Appendix F, Figure F2.
A closer examination of the focus group responses reveals that the objective of first phase of a
business analysis methodology involves a preliminary study of user needs, wants or
requirements. These responses imply that the relevance of this phase involves a detailed
analysis of the business requirements to understand the practicability of implementing them. The
outcome was found to be a feasibility phase document. Overall, the first phase identified by the
focus groups was a feasibility phase (PH1FE), with 26 mentions (60.4% of all mentions), shown
in Table F1. The next step of this research was to identify the activities for the first phase of
business analysis.

92
4.3.21 Activities for the feasibility phase
This section presents the activities for the first phase of business analysis. Participants identified
the following activities of the first phase of a business analysis methodology.
• Identifying a need or opportunity (PR1IN) - “Identifying a business requirement necessitates a
background investigation and understanding of the requirement and linking this to the
organisations strategic objectives” was the view of a project manager from focus group 1.
• Defining boundaries (PR1DB) – Concerning this activity, a business analyst from focus group 2
suggested, “This entails the scope of the business requirement”.
• Information gathering (PR1IG) – “Information gathering” in the opinion of an IS manager from
focus group 1 “consists of industry best practice, in-house gaps and improvement
opportunities”.
• Opportunity identification (PR1OI) - “Opportunity identification” suggested another IS manager
from focus group 1 “simply consists of identifying viable opportunities”.
• Opportunity analysis (PR1OA) – A business analyst from focus group 1 remarked, “Opportunity
analysis entails risk analysis, strategic vs. tactical position, assumptions and process
implications”.
• Recommendations (PR1RE) - “Recommendations include a go or no-go proposal” remarked a
business analyst from focus group 2.
A classification of these activities, including the number and percentage of the mentions is found
in Table F2. Focus groups were asked to explain why these activities should be used for the first
phase of business analysis.
An IS manager from the first group said, “During this phase, these activities help a business
minimise losses based on a poor business idea and help them avoid financial mistakes. These
activities can help a business analyst determine whether or not to implement a particular project
or system”.
Another participant in this group, an IS manager said, “These activities help a business analyst
plan in advance as well as evaluate alternative solutions. These activities also provide a business
analyst with an understanding of the user requirements for a new system”.
In the second focus group, a project manager said, “These activities help identify the business
and technical feasibility of a project. These activities also help management make better

93
investment decisions by providing management with enough information to know whether the
project can be done, and if the final product will benefit its intended users”.
To summarise, the responses suggest that these activities help a business analyst understand
user requirements. Moreover, these activities help the business analyst to analyse alternative
options and then recommend a solution. As a result, these activities help an organisation
minimise losses based on poor business ideas aw well as assist them to avoid financial mistakes.
After identifying the activities, the next step was to identify the techniques used for this phase.
4.3.2.2 Techniques for the feasibility phase
The techniques used by business analysts for the first phase of a business analysis methodology
are identified in this section. Focus groups were asked to name the techniques that they adopted
for this phase. Examples of the most frequently mentioned techniques for the first phase are
listed below.
• Interviews (TE1IN) - Probing of the first focus group revealed the following. An IS manager
said, “Interviews help with the identification of the business requirements. As there is no single
catch-all technique applicable to all types of requirements, business analysts need to know
about a range of different techniques intended for the early phase. Tried and tested techniques
such as interviews are ideal”.
• Observations (TE1OB) - Another participant from this group, a business analyst added, “This
technique can help a business analyst gather, analyse and document project requirements.
Observations are a realistic practical technique, not a theoretical technique. Business, user,
functional, and non-functional requirements are all addressed with this technique”.
• Task demonstrations (TE1TD) - “They help a business analyst to be agile by assisting him/her
to choose the tool for the level of requirements he/she needs for fast results”, was the opinion
of a project manager from the second focus group.
Table F3 shows a classification of these techniques.
To summarise, interviews, observations and task demonstrations assist a business analyst with
the identification, understanding and representation of business requirements. Once the
techniques for this phase had been extracted, the identification of the tools for this phase of
business analysis took place.

94
4.3.2.3 Tools for the feasibility phase
For this section participants were asked to identify the tools that they use for the first phase of
business analysis. The most frequently mentioned tools for the first phase of a business analysis
methodology are set out below.
• Visible Analyst (TO1VA) - During probing, a project manager from the second focus group
commented, “During the early stages of a project, visible analyst helps a business analyst to
assemble a working preview of the proposed system. This tool also provides integrated
configuration management to simplify the development process. It allows simulations during
early stages of a project to let business, end users and developers interact with critical business
systems before development. The visual representation of the application looks and behaves
like the real thing, including data interactions and business logic, so everyone literally gets on
the same page”.
• Cool Biz (TO1CB) - Another project manger from the second group said, “This tool targets the
initial stages of project, even before the project framework has been established. It enables
business requirements to be gathered and synchronised efficiently”.
• Visio (TO1VI) - “Visio allows the creation, description, modification and tracking of business
requirements in the early phases of a project” was the opinion of a business analyst from the
second group.
These tools are classified in Table F4.
These responses show that these tools are appropriate for this phase because of the visual
graphics produced that assist business analysts to identify business requirements. These tools
also permit simulations during early stages of a project to allow users to interact with the
proposed solution before development. Once appropriate activities, techniques and tools had
been identified for the first phase of business analysis, the next step was to identify the second
phase of business analysis. This is reviewed in the next section.
4.3.3 Business case phase (PH2BC) - phase 2 of a business analysis methodology
For this section, participants were asked to name and briefly describe the objective, relevance
and outcomes of the second phase that they follow when conducting business analysis. A
sampling of participants’ comments adds some insight into their thinking of the second phase of a
methodology.

95
According to a project manager from the first focus group ““The objective of the business case
phase is to verify if the solution meets the needs of the business, and is a mechanism for
receiving funding and approval to move forward. The business case document brings everything
together in one document, simplifies the development of the financial justification, and will usually
list the advantages and disadvantages of the solution. Moreover, management can use the
business case document as a way to measure success of the project. Finally, the business case
phase is useful for management to prioritise the project against any other projects in the business
that may require capital investment”.
In the second focus group, an outspoken participant, an IS manager remarked on the relevance,
“This phase justifies the resources and capital investment to implement a solution. It should cover
why the project is needed and how the project will solve the issues or opportunities facing the
organisation”.
Referring to the outcome of this phase, a project manager in this group added, “The business
case phase presents a comprehensive view of the solution and provides the financial justification
and ROI for project implementation. It is used to communicate the project to other stakeholders,
establish a method for measuring success and to receive funding approval for the project”.
More evidence from focus group participants can be found in Appendix F, Figure F3.
Summarising these responses from the focus groups, a business case phase can be understood
as consisting of a description and understanding of the intended solution with the anticipated
costs and benefits and the output being a formal business case document. The most frequently
referenced name for phase 2 of a methodology was a business case phase (PH2BC), with 27
mentions (41.5% of all mentions). These responses are classified in Table F5. Having identified
the second phase, the activities for this phase were pursued. These can be found in the next
section.
4.3.3.1 Activities for the business case phase
The most commonly mentioned names for the activities of the second phase of a business
analysis methodology are listed below.
• Identify solution (PR2IS) – “This activity” remarked a business analyst from focus group 1
“entails reviewing the feasibility findings”.
96
• Refine boundaries (PR2RB) – In the opinion of a project manager from the first focus group this
activity includes “the constraints, costs and benefit that need to be established”.
• Collate more information (PR2CM) – “Process requirements including key interfaces such as
customers, users, systems need to be explored” was suggested by an IS manager in focus
group 2.
• Analysis of solution (PR2AS) – A business analyst from the second focus group remarked,
“This activity entails an in-depth examination of the proposed option including the assumptions
and dependencies”.
• ‘As-is’ analysis (PR2AA) – In the view of a project manager from focus group 1, “The current
environment, including the systems, resources, current projects and core business processes,
needs to be established”.
• Make recommendation (PR2ERE) – “The recommendation” according to an IS manager from
focus group 2 “should include a comprehensive suggestion motivating the intended solution”.
These activities are classified in Table F6. Probing revealed the following. A focus group
participant said, “These activities are beneficial to this phase because they can be used to identify
opportunities for business improvement. These activities help define a project's resource
requirements, investment costs, revenue projections and market acceptance”.
Another participant, a business analyst in this group added, “This approach combines business
activities with technical activities. Further, they justify investing in technology and help to find right
business solutions to problems as well as to identify critical stakeholders. They further define the
scope of the project”.
According to another focus group participant, an IS manager “These activities are helpful for this
phase because they help create the basis for a project by describing the business problem or
opportunity, by listing the alternative solutions and including a cost / benefit analysis selection”.
These responses imply that these activities summarise the business implication of a project.
Scrutiny of these responses shows that these activities establish structure to the intended
solution, as well as provide the financial component of the project. Furthermore, these activities
can be used to define a project's resource requirements, investment costs, revenue projections
and market acceptance. The next step was to identify the techniques used for this phase, having
identified the activities.

97
4.3.3.2 Techniques for the business case phase
This section intended to identify the techniques for the second phase of business analysis from
the focus group interviews. The most frequently recommended techniques for the second phase
of a business analysis methodology are listed below.
• Criticality analysis (TE2CA) - During the first focus group, a project manager said, “Criticality
analysis helps a business analyst identify the financial components of a business case. It helps
him/her to present a clear, concise, fact-based business case. This technique helps a business
analyst measure the full range of business benefits including intangible and qualitative
benefits”.
• Risk reduction leverage (TE2RR) – Referring to risk reduction leverage, this same participant
commented, “This technique helps a business analyst present the financial aspect of the
business case for maximum impact”.
• Fault tree analysis (TE2FT) - An IS manager from the second group said, “Fault tree analysis
help establish baseline measurements and benchmarks for a business case. It also helps a
business analyst adhere to a variety of regulations for justifying and tracking projects”.
These techniques are classified in Table F7.
Scrutinising these responses, it can be seen that these techniques are favourable to this phase
because of the financial orientation. This financial orientation includes costs and benefits of the
intended solution. Moreover, these techniques help a business analyst determine baseline
measurements and benchmarks for a business case, which assist with the tracking of a project.
Having identified the techniques for the second phase, the tools for this phase of business
analysis were considered next.
4.3.3.3 Tools for the business case phase
This section intended to identify the tools used for the second phase of business analysis from
the focus group interviews. The most repeatedly mentioned tools for the second phase of a
business analysis methodology are set out below.
• Borland Together (TO2BT) - A business analyst in the first focus group said, “For a business
case, this tool enables a business analyst to communicate the proposed features, functions,
and specifications of a product or system with greater clarity, so that the developers can fully
understand, build, and test the intended product or system”.

98
• Rational Rose (TO2RR) - In this group, a business analyst mentioned, “Rational Rose provides
a flexible combination of modelling and simulation features for developing a business case. It is
suitable for generating, structuring and managing requirements for complex business problems.
Rational Rose has comprehensive templates that are available for business case construction”.
• Telelogic (TO2TE) - A business analyst from the second group said, “Telelogic contains
software templates that help write a business case that concisely presents the benefits of
change, and assess the financial impacts of a solution, including calculating Net Present Value
(NPV) and ROI that can help secure funding for a project”.
These tools are classified in Table F8.
A closer inspection of these responses suggests that these tools are helpful to this phase
because they contain features or modules that address the financial impacts of a project. Also,
the ease of use in developing business cases was another implied outcome. Furthermore, these
tools help a business analyst communicate the proposed features with developers more clearly,
so that they can fully understand the intended solution. Once the second phase of business
analysis with appropriate activities, techniques and tools had been identified, the next step was to
identify the third phase of business analysis, which is discussed in the next section.
4.3.4 Analysis and design phase (PH3AD) - phase 3 of a business analysis
methodology
This section was intended to identify the third phase of a business analysis methodology. A
sample of comments from participants is presented below.
According to the opinion of a business analyst from the second group, “Analysis continues from
the business case. It involves a more detailed study of a current business system and its
problems as well as an understanding of business needs and information requirements. Design is
the detailed specification of that solution that meets the requirements determined during the
analysis”.
Another participant from this group, an IS manager remarked, “Analysis and design involves
producing a viable blueprint that satisfies the requirements in the business case. This phase also
involves converting the business strategies and tactics into the blueprint for a system. It could
entail system functions, processing, size and scope, structure, hardware and software details”.
More comments from participants can be found in Appendix F, Figure F4.

99
The responses from the focus group participants suggest the analysis and design phase entails a
model of the system that will meet the needs of end users. A closer examination of the responses
suggests this phase should include logical and physical design elements. The most repeatedly
mentioned name for phase 3 of a methodology was an analysis and design phase (PH3AD),
with 26 mentions and are classified in Appendix F, Table F9. After extracting the third phase, the
next step was to identify the activities, which are described in the following section.
4.3.4.1 Activities for the analysis and design phase
The most frequently mentioned activities for the third phase of a business analysis methodology,
as well as a sample of comments from participants are listed below.
• Refinement (PR3RE) – According to a project manager from focus group 1, “This involves
refining the intended solution proposed in the business case”.
• Scope (PR3SC) – In the view of a business analyst from this group, “Scope consists of the
inclusion and exclusions the solution”.
• Ownership (PR3OW) – Regarding this activity, a business analyst, from the second focus group
remarked, “Accountability of the project is essential for success”.
• Redesign (PR3RD) – “Redesign” in the opinion of an IS manager from the first focus group
“entails the design of the intended solution”.
• Detailed analysis (PR3DA) – According to a project manager from the second focus group,
“This activity must include a detailed context analysis”.
• Design of solution (PR3DS) – “This activity entails the actual design including the business and
technology components” was the view of an IS manager from the second focus group.
• Change management (PR3CM) – “The impact of people issues needs to be taken into account”
was a view expressed by a project manager from focus group 1.
• Modelling (PR3MO) – An IS manager, also from focus group 1 commented, “The actual
analysis model identity is produced in this activity”.
• Design signoff (PR3DS) – For the last activity, a business analyst from the second focus group
suggested, “Analysis and design is formally signed off by all stakeholders”.
The responses mentioned by focus group participants are classified in Table F10. During probing
a participant from the first focus group, a project manager, commented, “These activities improve
the quality of the analysis and design phase. The ability of business analysts to implement high-
quality solutions depends on the quality of the analysis and the design, and the ability of the
maintenance programmers to make changes to the system after it has been put into operation.
These activities contribute to the quality of analysis and design”.

100
In this group, an IS manager added, “The complexity of analysis and design makes it difficult to
anticipate all the issues that will eventually be of importance in the final design. It is inevitable that
business analysts may overlook important issues. These activities provide structure for them”.
In the second group, an IS manager commented, “These activities are dynamic and can adapt to
changing needs” This IS manager elaborated, “A result of these activities is reduced development
time”.
These responses suggest that these activities are beneficial to this phase because they improve
the quality, add structure to the development process and as a consequence speed up the
development process. Once the activities had been established, the next step was to identify the
techniques used for this phase.
4.3.4.2 Techniques for the analysis and design phase
The most frequently mentioned techniques for the third phase of a business analysis
methodology, as well as examples of evidence, are presented below.
• Affinity analysis (TE3AA) - A business analyst from the first focus group said, “Affinity analysis
is a practical technique focused on the analysis and design of systems. It assists when
communicating with users, assessing their requirements and developing systems that meets
those requirements”.
• Functional hierarchy decomposition (TE4FH) - A project manager from the second group said,
“This technique allows a business analyst to divide complex processes into simple processes. It
also allows a business analyst to specify what the new system will accomplish, based on the
user requirements from the business case”.
• Modelling (TE5MO) - An IS manager in this second group said added, “Modelling helps a
business analyst analyse business processes by developing process models and data models
for a system. It also helps a business analyst work successfully with a group of peers on a
common problem”. She elaborated, “Modelling makes it easy for a business analyst to draw the
exact boundary of the new system under consideration by keeping in view the problems and
new requirements as well as working out the pros and cons, including new areas of the
system”.
These techniques are classified in Table F11.

101
To summarise, these techniques develop formal models of a solution and are therefore useful to
this phase. These techniques further assist a business analyst to communicate with users as well
as assess their requirements. Furthermore, it was found that these techniques help a business
analyst divide complex processes into simple processes. After the techniques for this phase had
been identified, the tools for this phase of business analysis were noted.
4.3.4.3 Tools for the analysis and design phase
The most frequently cited tools for the third phase of a business analysis methodology were
“Telelogic”, “Requisite Pro14” and “DOORS
15”. These tools are classified in Table F12. A sample
of comments from participants is presented below.
• Telelogic (TO3TE) – “This is a powerful, yet simple tool for, modelling and sharing requirements
during analysis and design”, said a business analyst from the first focus group. “Telelogic can
be used by business analysts who want to improve the communication aspects of a project,
enhance collaborative development, reduce project risk and increase the quality of systems
before implementation”.
• Requisite Pro (TO3RP) - Another focus group participant from focus group 1, a business
analyst said, “This tool integrates modelling and development functionalities to allow business
analysts to model functionality more accurately during analysis and deign”.
• DOORS (TO3DO) – “This tool’s flexibility for modelling makes it adequate for this phase”, was
the view of an IS manager from focus group 2.
Examining these responses, the implication is that these tools improve quality and speed up the
development process by ensuring consistency and completeness. Moreover, these responses
imply that theses tools help business analysts build models easily. These tools were further found
to be simple, flexible and powerful for this phase. After identifying the tools, the next step was to
identify the last phase of business analysis, and this follows in the next section.
14 http://www.ibm.com
102
4.3.5 Post-implementation evaluation phase (PH4PI) - phase 4 of a business
analysis methodology
Participants were asked to name and briefly describe the objective, relevance and outcomes of
the last phase that they follow when conducting business analysis.
A sampling of participant comments reveals some insights into their thinking of the last phase of a
methodology. “The objective of a post-implementation evaluation” according to one outspoken
business analyst from focus group 2 “is to assess the overall success of the project. This phase”,
according to her, “should include a review of how the project performed against the objectives,
scope, benefits, expenses and deliverables from the business case”.
Another participant, an IS manager also from focus group 2 took this further. “The relevance of
the last phase is not only to assess the projects level of success but also to identify lessons learnt
and make recommendations for future projects. The outcome is a post-implementation review
report”.
However, from the 2 groups, 18 participants said that there was a relationship between a
business case phase and a post-implementation evaluation phase. A project manger from the
second focus group remarked “the post-implementation confirms if the project was successful
and justifies the investment made by comparing it to the business case”. She further elaborated
“a post-implementation evaluation phase should assess whether the project achieved the benefits
set out in the business case, therefore there is a relationship”.
Another IS manager from this group added “a post-implementation evaluation phase should
compare the actual performance of a project to objectives in the business case”.
No other relationships were identified. Seventeen participants also said that the post-
implementation evaluation phase should be repeated after a period of time. Other comments from
participants can be found in Appendix F, Figure F5.
To summarise, findings from the focus groups indicate that the objective of this phase consists of
an inspection and verification of the solution. Additionally, the relevance of this phase entails an
assessment of the project against the objectives, scope, benefits, costs and deliverables from the
business case. The outcome was found to be a post-implementation review report. Furthermore,
a relationship between a business case phase and a post-implementation evaluation phase was
established. The most commonly mentioned response for phase 4 of a methodology was a post-

103
implementation evaluation phase (PH4PI), with 28 mentions (53.8% of all mentions). These
responses are classified in Appendix F, Table F13.
After defining the last phase, the next step was to identify the activities for this phase, and this is
reviewed in the next section.
4.3.5.1 Activities for the post-implementation evaluation phase
The most frequently mentioned activities for the fourth phase of a business analysis methodology,
as well as a sample of explanations from participants are recorded below.
• Review the requirements (PR4RR) – Relating to this activity, a project manager from the first
focus group suggested, “A business analyst should re-examine the original user want or need”.
• Review the business case (PR4RB) – “The costs and benefits projected in the business case
should be re-evaluated to see if they were met” was the view of a business analyst, also from
this group.
• Review the objectives (PR4RO) – An IS manager from the second focus group remarked, “Any
objective specified in the business case should be reviewed”.
The business analysis responses mentioned by interviewees relating to the activities for the
fourth phase of a business analysis methodology are classified in Table F14.
Participants from the focus groups were asked to elaborate on these activities. A business
analyst from the first group said, “These activities help a business analyst ensure that the system
is operating effectively as intended in the business case by identifying improvements in its
operation. Based on this, an action plan can be prepared to implement these improvements”.
An IS manager from this group interjected, “These activities help a business analyst find out
whether the expected benefits of the project have been realised and if lessons learned from the
project will lead to recommendations for improvements”.
In the second focus group, a project manger said, “These activities compare what was originally
planned to what actually happened and assess whether the outcome added value to the
organisation. These activities also assess unexpected benefits, unforeseen problems, user
reaction and follow-on work recommendations, together with timescales”.

104
To summarise, these activities ensure the lessons learnt from the implementation are re-
integrated into the organisation to benefit future projects. A closer examination of these
responses suggests that these activities ensure a logical approach is adopted by comparing the
solution to the original requirements. Furthermore, these activities help a business analyst identify
improvements in the operation of a project, as well as formulate an action plan to implement
these improvements. The next step was to identify the techniques used for this phase, having
identified the activities.
4.3.5.2 Techniques for the post-implementation evaluation phase
The most frequently cited techniques for the fourth phase of a business analysis methodology
were “traceability matrix”, “inspections” and “traceability tree”. Other responses mentioned by
interviewees relating to the techniques for the fourth phase of a business analysis methodology
are classified in Table F15. A sample of comments from participants is presented below.
• Traceability matrix (TE4TM) - A business analyst from the second focus group said, “This
technique helps trace the end result to the original requirements. This technique can further be
used to evaluate the effectiveness of the system development after the system has been in
production for a period of time, maybe after six months”.
• Inspections (TE5IN) – “This technique can help determine if the system does what it is
designed to do. This technique assesses the system in terms of functionality, performance, and
cost versus benefits, as well as measuring the effectiveness of the life-cycle development
activities that produced the system. The review of results can be used to strengthen the system
as well as system development procedures”, was the view of a project manager from this
group.
• Traceability tree (TE6TT) – “The traceability tree helps trace the solution back to the
requirements”, was the opinion of a business analyst from the second focus group.
In summary, these techniques help a business analyst to relate the business case to the
implemented solution. Additionally, these techniques help a business analyst evaluate the
effectiveness of the system development after the system has been in production for a period of
time. Moreover, they can be used to assess functionality, performance, costs and benefits of the
solution. The tools used for this phase were investigated next after having extracted the
techniques.

105
4.3.5.3 Tools for the post-implementation evaluation phase
The most commonly mentioned tools for the fourth phase of a business analysis methodology
were “Ideogramic”, “Telelogic” and “Rational Rose”. More tools relating to the fourth phase of a
business analysis methodology are classified in Table F16. During probing, participants made the
comments recorded below.
• Ideogramic (TO4ID) - A project manager from the first focus group suggested “Ideogramic
assesses the outcomes and success of a project. Depending on the input into the tool, it lists
the expected outcomes as specified in the project plans, reports on variances from that plan
and makes provisions for recommendations related to lessons learned”.
• Telelogic (TO4TE) - Another participant, a business analyst from the second focus group
commented “Telelogic compares the outcome, in terms of success or failure, costs and benefits
of the implementation to the original specifications”.
• Rational Rose (TO4RR) – “The ease of use of when reviewing projects makes this tool ideal for
post-implementation evaluations”, was the opinion of an IS manager, also from the second
focus group.
Summarising these responses, these tools are appropriate to this phase because they contain
features that can help a business analyst compare the outcome to the original requirements.
Moreover, these tools have the capability to assess the expected outcomes as specified in the
project plans. The identification of tools for the last phase of the methodology concluded the
findings from the focus group interviews. The consolidation and interpretation of the findings from
the individual interviews and focus group interviews are presented in the next section.
Part 3
4.4 Consolidation and Interpretation of the Results
The previous sections, i.e. part 1 and part 2, presented the evidence that was collected during the
data collection phase, which consisted of primary data from individual interviews and focus group
interviews. The objective of part 3 is to consolidate these findings, as well as put the research
objectives into perspective.
Subsequent sections of part 3 consolidate and interpret the findings from the individual
interviews, focus groups and link them to the literature findings. Individual and focus group
interview participants’ understanding of business analysis follows in the next section.

106
4.4.1 Understanding of business analysis
Business analysis was defined as the process of business problem solving by 62% of the
participants. Interpreting the responses, the indication is that business analysis is the
understanding of business requirements. A closer examination of these responses suggests that
these requirements could be business problems, opportunities, needs or wants. The responses
also suggest that business analysis consists of finding business or technical solutions to these
requirements and documenting these solutions in a clear and understandable way.
4.4.2 Feasibility phase (PH1FE) - phase 1 of a business analysis methodology
The first phase of a business analysis methodology was the feasibility phase (PH1FE). Seventy
six percent of all the participants identified the feasibility phase as the first phase of a business
analysis methodology. Recall that the frequency of mentions is an indicator of the intensity of
meaning and emphasises words or phrases that cannot be experimentally examined or measured
(Denzin and Lincoln, 1994; Neuman, 1994; Neuendorf, 2002; Newbold, et al., 2002). Seventy six
percent therefore reveals a strong indication of the intensity of this phase. The total number of
mentions is presented in Appendix G, Table G1.
The researcher found that the objective of a feasibility phase is to conduct a preliminary analysis
of a business requirement. The responses suggest that this requirement could be a problem, an
opportunity, a need, or a want. A closer look at the responses suggests that this phase consists
of understanding and analysing this requirement to determine the practicability of implementing it.
Importantly, it was found that for this phase, an in-depth objective understanding of the business
requirement is important. The responses also indicate that this phase should provide
management with a firm basis for determining whether the business requirement has sufficient
merit to continue into more detailed phases. The comments from participants suggest that the
deliverable outcome of this phase should be a feasibility report to management. This feasibility
report should present the proposed solutions to a business requirement, the advantages and
disadvantages associated with each solution, objectives, conclusions and recommendations.
The reason why a feasibility phase is relevant is that it minimises project failure that could be
based on poor business requirements and consequently prevents financial losses. The
researcher found that this phase helps management decide between alternative solutions and
promotes a more focused business approach. Individual and focus group interview findings
indicated that the activities for a feasibility phase were to:
• identify a need or opportunity (PR1IN);

107
• define boundaries (PR1DB);
• perform information gathering (PR1IG);
• perform opportunity identification (PR1OI);
• conduct opportunity analysis (PR1OA); and
• make recommendations (PR1RE).
The activities mentioned by participants in response to the feasibility phase of a business analysis
methodology are classified in Appendix G, Table G2. The findings suggest that these activities
are appropriate to this phase because they help business analysts narrow a range of options,
assess the remaining options and then propose solutions.
The techniques for a feasibility phase were interviews (TE1IN), observations (TE1OB) and
task demonstrations (TE1TD). The techniques mentioned by participants in response to the
feasibility phase are classified in Appendix G, Table G3. A closer look at the responses suggests
that these techniques help a business analyst develop a better understanding of the
requirements, and represent those requirements in a clear and comprehensible format for this
phase.
The tools for a feasibility phase were Visible Analyst (TO1VA), Cool Biz (TO1CB) and Visio
(TO1VI) and are classified in Appendix G, Table G4. Examining these responses, it can be seen
that these tools are suitable to this phase because of the graphical representations produced that
help business analysts to understand and formulate requirements. The next section identifies the
second phase of a business analysis methodology.
4.4.3 Business case phase (PH2BC) - phase 2 of a business analysis methodology
Seventy five percent of participants identified the business case phase (PH2BC) as the second
phase of a business analysis methodology. The total number of references is presented in the
Appendix G, Table G5.
Individual and focus group interview findings indicated that the objective of a business case
phase was to elaborate and structure the intended solution from the feasibility phase. A closer
look at the responses suggests that this phase consists of the business requirement, the intended
solution, scope of the intended solution, risks associated with that solution and the anticipated
costs and benefits. Interpreting the responses further, the indication is that this phase can help
justify including a project in an organisation's program of work, as organisations typically have
several potential competing projects in its program of work. This phase could also help gain

108
approval from management to proceed with a project and to obtain common agreement on the
project deliverables. The outcome from this phase is a business case document.
The reason why the business case phase is relevant is that it defines the scope of the
intended solution. Furthermore, this phase determines the project's resource requirements, costs
and benefits. Importantly, this research identified a relationship between this phase and the final
phase (post-implementation evaluation phase) of business analysis. Findings from the individual
interviews and focus group interviews indicated that the objectives of the business analysis phase
should be reviewed in the final phase of business analysis. Therefore, this phase provides an
important baseline for determining success or failure at the end of the project.
The researcher found that the activities of a business case phase were to identify a solution
(PR2IS), refine the boundaries of a solution (PR2RB), to collate more information (PR2CM), to
analyse a solution (PR2AS), to determine the assumptions and dependencies (PR2AD), to
conduct “as-is analysis” (PR2AA) and finally to make recommendations (PR2ERE). See
Appendix G, Table G6 for all mentioned activities of a business case phase. These activities were
found to be beneficial to this phase because they summarised the business ramifications of a
project and established direction, by providing business analysts with the activities necessary to
complete the project with minimal risk. Moreover, these activities were found to create structure to
the intended solution and provide a benchmark for monitoring performance of the completed
project.
The techniques for a business case phase were criticality analysis (TE2CA), risk reduction
leverage (TE2RR) and fault tree analysis (TE2FT). Refer to Appendix G, Table G7 for all
techniques mentioned by participants in response to the business case phase. These techniques
were found to be advantageous to this phase because they were financially orientated to help
business analysts make better financial decisions.
The tools for a business case phase were Borland Together (TO2BT), Rational Rose (TO2RR)
and Telelogic (TO2TE). Appendix G, Table G8 presents all mentioned business case tools.
These tools were found to be beneficial to this phase because they contained software features
that assessed the financial impacts of a project. Further, the ease of financial computations was
found to be another reason these tools were beneficial to this phase. The third phase of a
business analysis methodology is discussed in the next section.

109
4.4.4 Analysis and design phase (PH3AD) - phase 3 of a business analysis
methodology
Analysis and design (PH3AD) was found to be the third phase of a business analysis
methodology according to 71% of the participants of this research. The total number of
references is presented in Appendix G, Table G9.
Individual and focus group interview findings suggested that the analysis and design phase
consists of an analysis component and a design component. The objective of the analysis
component entails an in-depth study of the solution from the business case and producing an
analysis model representing that solution. The researcher found that the objective of the design
component was to transform that analysis model into a logical solution which is capable of being
implemented. In summary, to quote a participant, “analysis is about doing the right things and
design is about doing the things right”. The outcome from this phase is an analysis model, in the
form of an analysis and design document. The reason why the analysis and design phase is
relevant is that it generates documentation in the form of an analysis model.
The activities for the analysis and design phase consisted of refining the solution (PR3RE),
determining the scope (PR3SC), ownership (PR3OW), redesigning the solution from the business
case (PR3RD), conducting detailed analysis (PR3DA), designing a solution (PR3DS), conducting
change management (PR3CM), modelling (PR3MO), and finally signing-off the design (PR3DS).
The analysis and design phase activities mentioned by participants in response to the analysis
and design phase of a business analysis methodology are classified in Appendix G, Table G10. It
was found that these activities are beneficial to this phase because they add structure to the
solution and as a consequence speed up the development process.
The techniques for the analysis and design phase were affinity analysis (TE3AA), functional
hierarchy decomposition (TE4FH) and modelling (TE5MO). See Appendix G, Table G11 for all
mentioned analysis and design techniques. A closer look at the responses suggests that these
techniques develop standardisation by making formal representations of the solution being
designed, and are therefore beneficial.
The tools for the analysis and design phase were Telelogic (TO3TE), Requisite Pro (TO3RP)
and Rational Rose (TO3RR). Appendix G, Table G12 presents all mentioned tools for this phase.
The responses suggest that these tools speed up development process by enabling business
analysts to build models more easily. A result of this was a reduction in development time and

110
costs during analysis and design. The last phase of business analysis is discussed in the next
section.
4.4.5 Post-implementation evaluation phase (PH4PI) - phase 4 of a business
analysis methodology
Eighty nine percent of the participants indicated that a post-implementation evaluation (PH4PI)
was the final phase of a business analysis methodology. The total number of responses is
presented in Appendix G, Table G13.
Individual and focus group interview data indicated that the objective of the post-implementation
evaluation phase was to evaluate the implemented solution by comparing it to the business case
objectives, the costs and benefits. The responses also suggest that this phase acts as a feedback
mechanism to business analysts to optimise decision-making on future projects. The deliverable
outcome from this phase is a post-implementation review report.
The reason why a post-implementation evaluation phase is relevant is that it ensures that
lessons learnt from the project are re-integrated into the organisation, to benefit future projects. It
was also found that the post-implementation evaluation phase should be conducted twice i.e.,
directly after the project is implemented and then repeated after a period of time, approximately 6
months, after the implementation. To quote an IS manager from the second focus group, “a post-
implementation evaluation should take place after a relatively stable operating environment has
been established, about six to twelve months after implementation”. A relationship was also
found between the post-implementation evaluation phase and business case phase. Eighty one
percent of all the participants said the post-implementation evaluation phase should be compared
to the business case phase to see if the project met the deliverables that it was intended to meet.
These participants said that a post-implementation evaluation phase checks whether the benefits,
set out in the business case were achieved and identifies opportunities for further improvement.
The researcher found that the activities associated with the post-implementation evaluation
were to review the requirements (PR4RR), review the business case (PR4RB) and to review the
objectives (PR4RO). Appendix G, Table G14 presents all mentioned activities associated with the
post-implementation evaluation phase. These activities were found to develop a systematic
approach by comparing the actual solution to the original requirements. They also ensured the
lessons learnt are re-integrated into the organisation to benefit future projects.

111
The techniques for the post-implementation evaluation phase found by this research were
traceability matrix (TE4TM), inspections (TE5IN) and the traceability tree (TE6TT). See Appendix
G, Table G15 for all mentioned techniques for this phase. The responses suggest that these
techniques are appropriate to this phase because they help analyse information at the end of a
project to the original business case requirements.
The tools for a post-implementation evaluation phase were Ideogramic (TO4ID), Telelogic
(TO4TE) and Rational Rose (TO4RR). Appendix G, Table G16 shows all mentioned tools
associated with this phase. Data from the individual interviews and focus group interviews
indicated that these tools were appropriate to this phase because of the software features that
could trace the outcome to the original requirements.
Thereafter, all the results were compared to the literature review conducted in chapter 2 to
establish if the research objectives were achieved. A discussion of this follows in the next section.
4.5 Discussion of results
The literature review in chapter 2 revealed that although prior research made important advances
in business analysis, business analysis methodologies are inadequate for business analysis.
Table 2.1 summarised the short comings of the requirements engineering process methodology
(Iyer and Richards, 2004), requirements triage methodology (Davis, 2003b), knowledge level
process methodology (Abbink et al., 2004), win-win spiral methodology (Boehm et al., 1994),
process framework methodology (Alcazar and Monzon, 2000) and requirements generation
methodology (Arthur and Groener, 2005). In particular, the lack of clear objectives, relevance and
outcomes of the phases made these business analysis methodologies inadequate. Furthermore,
other problems were that the phases were at a high level and there was an inadequate and
inconsistent level of detail in these phases (Bubenko, 1995; Curtis et al., 1988; Davis, 2003a;
Jordan et al., 1989).
Moreover, the literature review, section 2.4, found that there are a large number of activities,
techniques and tools for business analysis. However, because these were not mapped to the
appropriate phases of business analysis, business analysts often perform activities and select
techniques and tools in an ad hoc manner (Davis, 2003a; Lobo, 2004). This results in an output
which inadequately addresses the objectives of that phase (Davis, 2003a; Lobo, 2004). The
reason is that different activities, techniques and tools have different advantages and
disadvantages, and incorrect selection could hamper the objective of a phase (Davis, 2003a;
Lobo, 2004).

112
Findings from this study addressed the problems revealed in the literature review, by identifying
phases of a methodology, with objectives, relevance and outcomes. Moreover, appropriate
activities, techniques and tools to address the objectives of each of the phases were identified.
Importantly, a relationship was found between the post-implementation evaluation phase and
business case phase. Individual and focus group interview findings indicated that the business
case phase provides a baseline for determining success or failure at the end of the project. It was
revealed that the objectives of the business case phase should be reviewed in the final phase of
business analysis, and then compared to the project outcome to determine success or failure of
the project.
Another interesting outcome was that a post-implementation evaluation phase should be
conducted twice i.e., directly after the project is implemented and then repeated after a period of
time, approximately six months, after the implementation. The reason for this is the time required
to achieve a stable operating environment.
A closer examination of the results reveals that tools such as Rational Rose and Telelogic are
appropriate to the business case phase, analysis and design phase and also the post-
implementation evaluation phase. This is due to the ease of use, financial and traceability
features of these tools.
Recall that a qualitative approach was selected for this research because it allowed for in-depth
probing of issues, a greater detail in responses as well as for interaction with the participants
(Denzin and Lincoln, 1994; Dixon et al., 1988; Hussey and Hussey, 1997). Individual interviews
and focus group interviews were selected for this study, based on the assumption that any
weaknesses inherent in a one data gathering method (for example individual interviews) could be
neutralised when used together with the other data gathering method (for example focus group
interviews), and as a consequence, increase the reliability and validity of a final result
(Baskerville, 1999; Dixon et al., 1988; Hussey and Hussey, 1997; Yin, 1994).
However, comparing the evidence from the individual interviews in section 4.2 and focus group
interview finding in section 4.3, no outstanding difference was found in the comments to make
any strong conclusions. Nevertheless, 11 participants from the individual interviews stated that
there were no tools for the post-implementation evaluation phase (i.e. 50% of individual interview
participants). Notably, all focus group participants named tools for this phase. The reason all the
focus group participants named tools for this phase could be attributed to prompting from other

113
focus group participants, an inherent weakness of focus group interviews (Hussey and Hussey,
1997; Yin, 1994).
According to researchers (Baskerville, 1999; Dixon et al., 1988), meta-information such as
participant seniority, skills, experience or age could influence research conclusions. Realising that
participants’ job characteristics could have influenced the outcome, the responses from the
project managers, business analysts, IS managers and CIOs were cross-tabulated in Table G17.
However, no strong difference was found in the results to make any strong conclusions.
Finally, this research defined business analysis as the process of business problem solving.
Recall that the reason for obtaining this definition is because business analysis is an emerging
field, and there is some confusion with systems analysis. The researcher found that business
analysis was the understanding of business requirements that could be business problems,
opportunities, needs or wants. Business analysis was found to consist of finding business or
technical solutions to these requirements and documenting these solutions in a clear and
understandable way. The following section presents a conclusion to this chapter.
4.6 Conclusion
This chapter presented the evidence that was collected during the data collection phase. It
consisted of primary data from individual interviews and focus group interviews. The content
analysis, analysis within and between interviews, as well as an interpretation of the data was
presented. This chapter interpreted the data by identifying phases, activities, techniques and
tools. The findings indicate that the phases of a business analysis methodology are a feasibility
phase, business case phase, analysis and design phase and finally a post-implementation
evaluation phase. Objectives, relevance and outcomes of these phases, as well as the activities,
techniques and tools were also presented. Chapter 5 presents the conclusions of the study,
discusses the limitations of the research and suggests possible areas for future research.

114
Chapter 5
Conclusions, Recommendations and Limitations of this study
5.1 Introduction
The preceding chapter presented and interpreted the findings from the individual interviews, focus
group interviews and linked them to relevant literature.
This chapter concludes the research effort by presenting an overview of each chapter followed by
the main findings of this study. The implications and contributions of the study are then assessed,
followed by a discussion of the biasness, the limitations as well as recommendations for further
research. An overview of chapters is presented in the following section.
5.2 Overview of chapters
Chapter 1, introduction to a business analysis methodology presented the topic of business
analysis by investigating business analysis problems and motivating the need for a business
analysis methodology. It described business analysis as one of the least explored areas with no
adequate methodology. Chapter 1 described the problem of business analysis methodologies as
being composed of high level phases with unclear objectives and outcomes that resulted in
uncertainty about which procedures to use for conducting business analysis. An additional
problem related to the mapping of appropriate activities, techniques and tools to address the
objectives of each phase of a methodology. The aims, objectives as well as the research
questions and a research model were established in chapter 1. After investigating problems with
business analysis and motivating the need for a business analysis methodology a literature
review was conducted.
This examination of previous research undertakings that related to business analysis
methodologies was provided in Chapter 2, literature review. This chapter presented
methodologies and their activities from literature, such as requirements engineering process
methodology; requirements triage methodology; knowledge level process methodology; win-win
spiral methodology; process framework methodology and requirements generation methodology.
Further a review of different techniques and tools from literature was also investigated. More
importantly, this chapter concluded with the contributions and shortcomings of these
methodologies, techniques and tools. After establishing the underlying literature pertaining to
business analysis methodologies, the research methodology used to carry out this study followed.

115
Chapter 3, research methodology clarified the methodology used to carry out the study and
justified the qualitative approach that allowed for in-depth probing and detailed responses. The
pre-test and pilot study, conducted to validate the data gathering methods to ensure that they
were free from errors, and in order to increase the reliability of the results, was also illustrated.
Importantly, the data gathering methods comprising of individual interviews and focus group
interviews were demonstrated. The sample selection, characteristics of participants and settings
for each of the data gathering methods used for this study were further demonstrated. The data
analysis strategy including the data management strategy, content analysis and analysis within
and between interviews were presented in detail. Chapter 3 further introduced the data coding
and category construction procedure used for the research. The assessment of trustworthiness,
criteria for reliability and validity, as well as ethical considerations of the researcher were also
covered.
Chapter 4, presentation and interpretation of the evidence collected, derived the phases,
activities, techniques and tools from the data. This chapter presented the findings from the
individual interviews and focus group interviews. The consolidation and interpretation of these
findings followed. This chapter concluded by linking the findings to the literature review and a
discussion of the results. The main findings of this study follow in the next section.
5.3 Main findings
The objectives of this research included identifying the relevant phases of a business analysis
methodology as well as the objectives, relevance and outcomes for each of those phases. It also
included mapping appropriate activities, techniques and tools to the relevant phases of a
methodology. The results from this study addressed those objectives as follows.
The first phase of a business analysis methodology was identified as the feasibility phase.
Individual and focus group interview findings indicated that the objective of this phase was to
conduct a preliminary analysis of a business requirement. The deliverable outcome was found to
be a feasibility report. A feasibility phase was relevant because it minimised project failure based
on poor business requirements. This research identified the activities as identifying a need or
opportunity, defining boundaries, performing information gathering, performing opportunity
identification, conducting opportunity analysis and finally making recommendations. The
techniques for this phase were interviews, observations and task demonstrations, while the tools
included Visible Analyst, Cool Biz and Visio.

116
This research identified the business case phase as the second phase of a business analysis
methodology. The objective was to elaborate and structure the intended solution from the
feasibility phase. The outcome was found to be a business case document. The business case
phase was relevant because it defined the scope of the intended solution. The researcher further
found that the activities were to identify a solution, refine the boundaries of a solution, to collate
more information, to analyse a solution, to determine the assumptions and dependencies, to
conduct “as-is analysis” and finally to make recommendations. The techniques were criticality
analysis, risk reduction leverage and fault tree analysis, and the tools were Borland Together,
Rational Rose and Telelogic.
Analysis and design was found to be the third phase of a business analysis methodology. The
objective entailed conducting an in-depth study of the solution from the business case and
producing an analysis model representing that solution. The objective further entailed
transforming that analysis model into a logical solution capable of being implemented. The
outcome was an analysis model, in the form of an analysis and design document. This phase was
relevant because it generated documentation in the form of an analysis and design model. The
activities consisted of refining the solution, determining the scope, ownership, redesigning the
solution from the business case, conducting detailed analysis, designing a solution, conducting
change management, modelling, and finally the signing off the design. The techniques were
affinity analysis, functional hierarchy decomposition and modelling whereas the tools included
Telelogic, Requisite Pro and Rational Rose.
This study indicated that a post-implementation evaluation phase was the final phase of a
business analysis methodology. Findings from the individual interviews and focus group
interviews showed that the objective was to evaluate the implemented solution by comparing it to
the business case objectives. The deliverable outcome was a post-implementation review report.
This phase was relevant because it ensured lessons learnt from the project are re-integrated into
the organisation, to benefit future projects. The researcher found that the activities were to review
the requirements, review the business case and to review the objectives. The techniques were
traceability matrix, inspections and traceability tree and the tools were Ideogramic, Telelogic and
Rational Rose.
A relationship was found between the post-implementation evaluation phase and business case
phase. This relationship is important because the business case phase provides a baseline for
determining success or failure at the end of the project. It was revealed that the objectives of the
business case phase should be reviewed in the final phase of business analysis, and then
compared to the project outcome to determine success or failure of the project.

117
In addition, it was further established that the post-implementation evaluation phase should be
conducted twice, directly after a project is implemented, and then after a few months
(approximately 6 months) after the implementation of a project. The reason for this is the time
required to achieve a stable operating environment.
These findings therefore address the research aims and objectives identified in chapter 1, and
have implications as well as contributions for academics and practitioners. These are discussed
in the next section.
5.4 Implications and contributions of this study for academics and
practitioners studying business analysis
The implications of this research include those of conceptual, methodological and practical
consequences (Denzin and Lincoln, 1994; Whetten, 1989) for academics and practitioners.
These implications are set out below.
• Conceptual implications
The most important conceptual implication of this research relates to the identification of the
relevant phases of a business analysis methodology, with clear objectives and outcomes. This
contribution addresses the problem with the methodologies which were identified in the literature
review, chapter 2, section 2.5 that had high level phases with unclear objectives and outcomes.
The other contribution has been the mapping of activities, techniques and tools for each of these
phases. The literature review, section 2.4 illustrated the various techniques and tools, each with
different criterion and the difficulty in selecting appropriate techniques and tools to meet the
objectives of each phase. This study also contributed to our understanding related to the
definition of business analysis, because this is an emerging field, and there is confusion between
business analysis and systems analysis (Evans, 2004).
The other conceptual implication relates to this study providing direction to literary material for
academics wishing to research business analysis further (Denzin and Lincoln, 1994; Whetten,
1989). The literature review and references used for this study direct researchers to academic
publications relating to business analysis.
Finally, this study provides a basis for developing a comprehensive conceptual process for
academics from which hypotheses could be proposed for later testing (Whetten, 1989).

118
• Methodological implications
The methodological implications of this study relate to the research methodology used for this
project (Whetten, 1989). Information systems research is dominated by the use of quantitative
methodologies, and researchers are encouraging qualitative methodologies for information
system studies (Lee, Liebenau and DeGross, 1997; Reeves, 2000; Siregar and Tan, 2004). The
application of primarily qualitative methods (individual interviews and focus group interviews) for
this study has therefore been a methodological contribution (Lee et al., 1997; Reeves, 2000;
Siregar and Tan, 2004).
Another methodological contribution lies in the presentation of the quotes and direct excerpts
from the individual and focus group interviews presented in chapter 4 and the appendices (Dixon
et al., 1988; Whetten, 1989). These quotes and direct excerpts may be useful for other
academics researching business analysis (Dixon et al., 1988).
• Practical implications
The practical implication of this research also relates to the development of the business analysis
methodology, with identification of the relevant phases with clear objectives and outcomes, as
well as the appropriate activities, techniques and tools. The investigation in chapters 1 and 2
showed the lack of a practical and integrated business analysis methodology for business
analysts. The findings of this study are beneficial to practitioners because having a clearly
defined business analysis methodology standardises the approach towards business analysis,
promotes consistency in software development and helps ensure a repeatable process (Avison
and Fitzgerald, 1995; Standish, 2004; SEIREP, 2004). A standardised methodology results in
measurable deliverables and improved productivity for practitioners (Avison and Fitzgerald, 1995;
Standish, 2004; SEIREP, 2004).
The conceptual, methodological and practical implications of this study are therefore of
importance to IS practitioners and academics involved in business analysis and research.
However, biasness exists in this research.

119
5.5 Biasness of this research
Leedy (1993) defines bias as any influence
“…that may have disturbed that randomness by which the choices of a
sample population has been selected, or any influence whereby the
results were not obtained under the conditions of pure chance”.
Care was taken to avoid bias as far as possible throughout the research. However, some biases
exist in the individual interviews and focus group interviews.
Researchers (Leedy, 1993; Neuman, 1994) suggest that individual interviews rely heavily on the
skill of the interviewer; and therefore the quality of the results is also heavily dependent on that
factor. Furthermore, in essence, the interviewer becomes the measuring instrument and the
accuracy is therefore questionable (Neuman, 1994). Researchers (Leedy, 1993; Neuman, 1994)
suggest biasness exist with individual interviews due to its high level of subjectivity and low level
of control. To reduce biasness, a semi-structured interview with a standard interview protocol was
used for this study (Leedy, 1993; Neuman, 1994).
Silverman (2000) states biasness exists with focus group interviews because a focus group
discourages the participation of introvert or unconfident participants. Also, the group nature of the
method precludes confidentiality of responses. Further, separating an individual view from the
collective response could be complex, as individual participants are influenced by group
responses (Silverman, 2000). A standard interview protocol was also used for the focus group
interviews to reduce biasness (Leedy, 1993; Neuman, 1994). Moreover, the focus group
interviews were held in the participants work environment to ensure a comfortable setting
(Silverman, 2000). However, this study is not without its limitations, which follow in the
subsequent section.
5.6 Limitations of this study
The business analysis methodology derived from this study was derived by analysing qualitative
responses from individual and focus group interview participants, and not developed concurrently
with a live project (Baskerville, 1999; Dixon et al., 1988). Further studies should take into account
this research methodology used. To overcome this limitation, an action approach is
recommended by researchers (Baskerville, 1999; Dixon et al., 1988).

120
The other limitation relates to the settings and participants (Mathison, 1988; Maxwell, 1992;
Patton, 2001). The research was conducted in 2 settings from the South African financial services
sector, Bank A and Bank B. The outcome therefore represents results related to participants and
initiatives of these 2 organisations and may not be entirely transferable to other types of
organisations or sectors (Mathison, 1988; Maxwell, 1992; Patton, 2001). Thus, it would be
interesting to expand this study to other organisations, sectors or industries involved in business
analysis.
Another limitation, applicable to most research in information systems, is related to ‘change’, and
the understanding that change an ongoing process (Bubenko, 1995; Campbell, 1996). During the
process of compiling this research report, various new techniques and tools were introduced to
industry. This can be substantiated by glancing at the popular press. Towards the end of writing
this research report it was learnt that Bank A was considering introducing a new analysis and
design tool called Protos16, to be sourced from Holland. While it is agreed that some of these
developments would have implications for the business analysis methodology, some form of
closure has to take place in order to complete a research report within a time and scope limit.
Suggestions for additional research follow in the subsequent section.
5.7 Recommendations for further research
This research presented a business analysis methodology for business analysts in the South
African financial services environment. This research could be further expanded in the following
ways.
This study found a relationship between the business case phase and the post-implementation
evaluation phase, as the business case phase provides a baseline for determining success or
failure at the end of the project. This relationship could be further explored by developing
additional research questions or hypotheses to assess this relationship.
This study also showed that a post-implementation evaluation phase should be conducted
directly after the project is implemented and then repeated after a stable operating environment
has been achieved. This result establishes another possible direction for future studies and could
be further explored with additional research questions or hypotheses to evaluate this outcome.
A limitation of this study related to the participants and the settings. Therefore, another possible
direction for future research could be to replicate this study with different settings and
16 http://www.pallas-athena.com

121
participants, to observe whether same results are obtained. Replicating the study would provide
results to validate the business analysis methodology (Baskerville, 1999; Dixon et al., 1988).
Finally, this study could be extended by conducting a detailed empirical evaluation. This would
provide deeper insight into the implementation aspect of the business analysis methodology. In
addition, an empirical study would highlight any problematic aspects of the methodology and
would provide suggestions for further improvement. Such a study could provide results which
could be used to prove the effectiveness of the business analysis methodology (Baskerville,
1999; Dixon et al., 1988).
5.8 Closing remarks
Overall, this business analysis methodology seeks to make business analysis more logical,
structured and standardised. There is “no silver bullet” (Brooks, 1987, p10) for business analysis,
however research (Herbsleb, Carleton, Rozum, Siegel and Zubrow, 1994; Paulk, 1993; SEIREP,
2004) confirms that projects that adopt a logical and structured approach have a greater
probability of success than projects that adopt a chaotic ad hoc approach. If business analysis is
done well, the probability is that the rest of the development would also go well. The business
analysis methodology derived from this research is already finding its application into the
researcher’s work environment. Findings presented in this report will be explored further in future
studies by the researcher.

122
References
1. Abbink, H., Van Dijk, R., Dobos, T., Hoogendoorn, M., Jonker, C.M., Konur, S., Van Maanen,
P.P., Popova, V., Sharpanskykh, A., Van Tooren, P., Treur, J., Valk, J., Xu, L., and Yolum, P.
(2004) Automated Analysis for Incident Management, Proceedings of the 24th International
Conference on Innovative Techniques and Applications of Artificial Intelligence, pages 19-32.
2. Albers, M., Jonker, C.M., Karami, M., and Treur, J. (2004) Agent models and different user
ontologies for an electronic market place, Knowledge and Information Systems, volume 6,
number 1, pages 1-41.
3. Alcazar, G.E. and Monzon, A. (2000) A Process Framework for Requirements Analysis and
Specification, Proceedings of the Fourth International Conference on Requirements
Engineering, 19-23 June 2000, pages 27-35.
4. Aleotti, J., Caselli, S. and Reggiani, M. (2003) Toward programming of assembly tasks by
demonstration in virtual environments, Robot and Human Interactive Communication
Proceedings, The Twelfth IEEE International Workshop, 31 October - 2 November 2003,
pages 309-314.
5. Alur, R. and Chandrashekharapuram, A. (2005) Dispatch Sequences for Embedded Control
Models, Proceedings of the Eleventh IEEE Real Time and Embedded Technology and
Applications Symposium IEEE Computer special, pages 508-518.
6. American Supplier Institute (2003) Quality Function Deployment: A Collection of
Presentations and QFD Case Studies, American Supplier Institute Press.
7. Andrews, F. M. (1984) Construct Validity and Error Components of Survey Measures: A
Structural Modelling Approach, Public Opinion Quarterly, volume 48, number 2, pages 409-
422.
8. Arthur, J.D. and Groener, M.K. (2005) An operational model for structuring the requirements
generation process, Requirements Engineering, volume 10, issue 1, January 2005, pages
45-62.
9. Ashworth, C.M. (1999) Using SSADM to Specify Requirements, IEEE Colloquium on
Requirements Capture and Specification for Critical Systems. Digest number 138, pages 1-3.

123
10. Auer, M., Tschurtschenthaler, T. and Biffl, S. (2003) A Flyweight UML Modeling Tool for
Software Development in Heterogeneous Environments, Twenty-ninth Euromicro Conference
(EUROMICRO'03), IEEE computer, September 2003, page 267.
11. Avison, D.E and Fitzgerald, G. (1995) Information Systems Development: Methodologies,
Techniques and Tools, second edition, Maidenhead: McGraw-Hill.
12. Bailin, S.C. (1999) An Object-Oriented Requirements Specification Method, Communications
of the ACM, volume 32, number 5, pages 608-623.
13. Baird, B. (1989) Managerial Decisions Under Uncertainty, John Wiley and Sons.
14. Baskerville, R.L. (1999) Investigating information systems with action research,
Communications of the association for information systems, volume 2, number 9, available
from http://www.cis.gsu.edu/, accessed March 2005.
15. Boehm, B. (1981) Software Engineering Economics, Prentice-Hall.
16. Boehm, B., Bose, P., Horowitz, E. and Lee, M.J. (1994) Software Requirements As
Negotiated Win Conditions, Proceedings of ICRE, April 1994, pages74-83.
17. Boehm, B. (1988) A Spiral Model of Software Development and Enhancement, IEEE
Computer, pages 61-72, May 1988.
18. Boehm, B. and Papaccio, P.N. (1998) Understanding and Controlling Software Costs, IEEE
Transactions of Software Engineering, volume 14(10), pages 1462-1477.
19. Bragge, J., Merisalo-Rantanen, H. and Hallikainen, P. (2005a) Gathering Innovative End-
User Feedback for Continuous Development of Information Systems: A Repeatable and
Transferable E-Collaboration Process, IEEE Transactions On Professional Communication,
March 2005, volume 48, number 1, Special edition.
20. Bragge, J., Martin, P. and Tuunanen, T. (2005b) Developing Innovative Information Systems
Services Together with Wide Audience End-Users, Proceedings of the Thirty-eighth Annual
Hawaii International Conference on System Sciences for IEEE Computer Society, volume 3,
page 88.

124
21. Brooks, F.P. (1987) No Silver Bullet: Essence and Accidents of Software Engineering, IEEE
Computer, volume 20, number 4, pages 10-19.
22. Bubenko, J. A. (1995) Challenges in Requirements Engineering, Second IEEE International
Symposium on Requirements Engineering, York (UK).
23. Cameron, J. R. (1989) Prototyping Core Functionality Using JSD, IEEE Colloquium on
Requirements Capture and Specification for Critical Systems, Digest number 138, pages 1-2,
Institution of Electrical Engineers.
24. Campbell, T. (1996) Technology, multimedia, and qualitative research in education, Journal
of Research on Computing in Education, volume 30, number 9, pages 122-133.
25. Carmines, E. G. and Zeller, R. A. (1988) Reliability and Validity Assessment, Thousand
Oaks, CA: Sage Publications.
26. Clemen, R.T. (1996) Making Hard Decision: An Introduction to Decision Analysis, second
edition, Belfont, California: Duxbury Press.
27. Compeau, D. R. and Higgins, C. A. (1995) Computer self-efficacy: Development of a
measure and initial test, MIS Quarterly, volume 19, number 2, pages 189-211.
28. Cossentino, M. and Potts, C. (2002) A CASE Tool Supported Methodology for the Design of
Multi-Agent Systems, Proceedings of the 2002 International Conference on Software
Engineering Research and Practice, Las Vegas, USA.
29. Creswell, J.W. (1994) Research Design: Qualitative and Quantitative Approaches, Sage
Publications: London.
30. Creswell, J. W. and Miller, D. L. (2000) Determining validity in qualitative inquiry, Theory into
Practice, volume 39, number 3, pages 124-131.
31. Curtis, B., Krasner, H. and Iscoe, N. (1988) A field study of the Software Design Process for
Large systems, Communications of the ACM, volume 31, number 11, pages 1268-1286.
125
32. Damm, C.H., Hansen, K.M., Thomsen, M., and Tyrsted, M. (2000) Tool Integration:
Experiences and Issues in Using XMI and Component Technology, Proceedings of TOOLS
Europe 2000, Mont Saint-Michel, France.
33. Davis, A. (1993a) Identifying and measuring quality in a software requirements specification,
Proceedings of the First International Software Metrics Symposium, pages 141-152, 1993.
34. Davis, A. (1993b) Software Requirements: Objects, Functions and States, Prentice Hall,
Englewood Cliffs, NJ, 1993.
35. Davis, A., Fairley, R. and Yourdon, E. (1999) Software Product Planning, Omni-Vista white
paper number 99-002, http://hpsearch.uni-trier.de/hp/atree/d/Davis:Al.html, accessed January
2006.
36. Davis, A. (2003a) Elicitation Technique Selection: How do experts do it?, International Joint
Conference on Requirements Engineering (RE03), IEEE Computer, September 2003, pages
169-178.
37. Davis, A. (2003b) The Art of Requirements Triage, IEEE Computer, March 2003, pages 42-
48.
38. Denzin, N.K. and Lincoln, Y.S. (1994) Handbook of qualitative research, Thousand Oaks, CA:
Sage.
39. De Vellis, R. F. (1991) Scale Development: Theory and Applications, Newbury Park, CA:
SAGE Publications.
40. Dixon, B. R., Bouma, G. D. and Atkinson, G. B. J. (1988) A Handbook of Social Science
Research: A Comprehensive and Practical Guide for Students, Oxford: Oxford University
Press.
41. Duggan, W.E. and Thachenkary, S.C. (2004) Integrating nominal group technique and joint
application development for improved systems requirements determination, Information and
Management, volume 41, issue 4, March 2004, pages 399-411.

126
42. Dutoit, A. H. and Paech, B. (2000) Supporting Evolution: Using Rationale in Use Case Driven
Software Development, Proceedings of the Sixth International Workshop on Requirements
Engineering: Foundation for Software Quality, June 5-6 2000, Stockholm, Sweden.
43. Easterbrook, S. and Nuseibeh, B. (1996) Using Viewpoints for Inconsistency Management,
BCSEEE Software Engineering Journal, January 1996, pages 31-43.
44. Eisner, E. W. (1991) The enlightened eye: Qualitative inquiry and the enhancement of
educational practice, New York, NY: Macmillan Publishing Company.
45. Evans, N. (2004) The Need for an Analysis Body of Knowledge (ABOK) - Will the Real
Analyst Please Stand Up? Issues in Informing Science and Information Technology –
Informing Science, Proceedings of the informing science and information technology
education joint conference, Rock Hampton, Australia, June 25-28 2004, available from
http://proceedings.informingscience.org , accessed, July 2005.
46. Faraj, I., Alshawi, M., Aouad, G., Child, T., Underwood, J. (1999) Distributed Object
Environment: Using International Standards For Data Exchange, Computer-Aided Civil and
Infrastructure Engineering, volume 14, pages 395-405.
47. Fowler, F. J. (1995) Improving Surveys Questions, Design and Evaluation, Newbury Park,
CA: Sage Publications.
48. Frame, D. (2002) The New Project Management: Tools for an Age of Rapid Change,
Complexity, and Other Business Realities, Jossey Bass Business and Management Series.
49. Gaines, B.R. and Rappaport, A. (1988) Integration of acquisition and performance systems,
Proceedings of the Third AAAI Knowledge Acquisition for Knowledge-Based Systems
Workshop, pages 20-25.
50. Gause, D. C. and Weinberg, M.G. (1989) Exploring Requirements: Quality Before Design,
New York Dorset: House Publishing.
51. Glaser, B. and Strauss, A. (1967) The Discovery of Grounded Theory: Strategies for
Qualitative Research, Chicago: Aldine.
52. Gottesdeiner, E. (2002) Requirements by Collaboration, Addison-Wesley.

127
53. Goguen, J. and Linde, C. (1993) Techniques for Requirements Elicitation, Proceedings of the
First IEEE International Symposium on Requirements Engineering (RE'93), San Diego,
California, USA, pages 152-164, IEEE Computer Society Press.
54. Graaf, B., Lormans, M., Toetenel, H. (2002) Software Technologies for Embedded Systems:
An Industry Inventory, Fourth International Conference on Product Focused Software
Process Improvement, Rovaniemi, Finland, 2002.
55. Hayes, J.H., Dekhtyar, A., Sundaram, S. and Howard, S. (2004) Helping Analysts Trace
Requirements: An Objective Look, Proceedings of the Requirements Engineering
Conference, Twelfth IEEE International (RE'04), pages 249-259, IEEE Computer Society.
56. Herbsleb, J., Carleton, A., Rozum, J., Siegel, J. and Zubrow, D. (1994) Benefits of CMM-
Based Software Process Improvement: Initial Results, Technical Report CMU/SEI-94-TR-14,
Software Engineering Institute, Pittsburgh, available from
http://citeseer.ist.psu.edu/herbsleb94benefits.html, accessed July 2006.
57. Herlea, D.E., Jonker, C.M., Treur, J., and Wijngaards, N.J.E. (1999) A Formal Knowledge
Level Process Model of Requirements Engineering, Proceedings of the Twelfth International
Conference on Industrial and Engineering Applications of AI and Expert Systems,
volume 1611, pages 869-878.
58. Hofmann, H. and Lehner, F. (2001) Requirements Engineering as a Success Factor in
Software Projects, IEEE Software, volume 18, number 4, pages 58-66.
59. Howard, R.A. (1988) Decision Analysis: Practice and Promise, Management Science, volume
34, number 6, pages 679- 695.
60. Hussey, J. and Hussey, R. (1997) Business Research, London: Macmillan Press Ltd.
61. Institute of Electrical and Electronics Engineers (2004) IEEE Guide to Software Requirements
Specifications, ANSI/IEEE Standard 830- 2004, Institute of Electrical and Electronics
Engineers, New York.
62. Iyer, J. and Richards, D. (2004) Evaluation Framework for Tools that Manage Requirements
Inconsistency, Proceedings of the Ninth Australian Workshop on Requirements Engineering,
6-7 December, Adelaide.

128
63. Jacobson, I. (1992) Object-Oriented Software Engineering, Addison-Wesley, ACM Press.
64. Jakob, H. I., Lars, M. and Peter, A. N. (2004) Managing risk in software process
improvement, MIS Quarterly, September 2004, volume 28, issue 3, page 395.
65. Jarke, M. (1998) Requirements Tracing, Communications of the ACM, volume 41, number
12, pages 32-36.
66. Jeffery, D.R. (1992) Software Process Quality: Requirements for Improvement from Industry,
Proceedings of the Rome Air Development Centre Software Quality Workshop, New York.
67. Jennex, E. M. (2005) End-User System Development: Lessons from a Case Study of IT
Usage in an Engineering Organisation, Journal of Cases on Information Technology, volume
7 number 2, pages 67-81, April-June 2005.
68. Jansen, S., Ballintijn, G and Brinkkemper, S. (2005) A Process Model and Typology for
Software Product Updaters, Proceedings of the Ninth European Conference on Software
Maintenance and Reengineering (CSMR'05), IEEE Computer Society, pages 265-274.
69. Jiang, J.J., Klein,G., Hwang, H., Huang, J. and Hung S. (2004) An exploration of the
relationship between software development process maturity and project performance,
Information and Management, volume 41, number 3, January 2004, pages 279-288.
70. Johnson, B. R. (1997) Examining the validity structure of qualitative research, Education,
volume 118, number 3, pages 282-292.
71. Jordan, P.W., Keller, K.S., Tucker, R.W. and Vogel, D. (1989) Software Storming: Combining
Rapid Prototyping and Knowledge Engineering, IEEE Computer, pages 39-48.
72. Karlsson, L. Berander, P., Regnell, B., Wohlin, C. (2004) Requirements Prioritisation: An
Experiment on Exhaustive Pair-Wise Comparisons versus Planning Game Partitioning,
Proceedings of the Eighth International Conference on Empirical Assessment in Software
Engineering (EASE’04), Edinburgh, Scotland, UK.
73. Kirk, J., and Miller, M. (1986) Reliability and Validity in Qualitative Research, Newbury Park,
CA: Sage Publications.
129
74. Kirwan, A. (1992) A Guide to Task Analysis, Taylor and Francis, London.
75. Kotonya, G. and Sommerville, I. (2000) Requirements Engineering - Processes and
Techniques, John Wiley and Sons Ltd.
76. Kvale, S. (1995) The Social Construction of Validity, Qualitative Inquiry, volume 1, number 1,
pages 19-40.
77. Lather, P. (1993) Fertile Obsession: Validity after Post-structuralism, Sociological Quarterly,
volume 34, number 4, pages 673-693.
78. Lauesen, S. (2002) Software Requirements: Styles and Techniques, Addison-Wesley
Publishing.
79. LeCompte, M., and Goetz, J. (1982) Problems of reliability and validity in ethnographic
research, Review of Educational Research, volume 52, number 1.
80. Lee, A., Liebenau, J. and DeGross, J. (1997) Information Systems and Qualitative Research,
London: Chapman and Hall.
81. Leedy, P.D. (1993) Practical Research – Planning and Design, New York: Macmillan
Publishing.
82. Leffingwell, D. and Widrig, D. (2000) Managing Software Requirements - A Unified Approach,
Addison-Wesley Longman, Inc.
83. Lewis, R. and Thomas, E. (2003) Brainstorming, available from
http://www.dos.uci.edu/publications/guides/b3.html, accessed February 2006.
84. Lincoln, Y. S. and Guba, E. G. (1985) Naturalistic inquiry, Beverly Hills, CA: Sage.
85. Lindgaard, G. (1994) Usability Testing and System Evaluation: A Guide for Designing Useful
Computer Systems, London: Chapman and Hall.
86. Lobo, O.L. (2004) Analysis and Evaluation of Methods for Activities in the Expanded
Requirements Generation Model (x-RGM), Thesis (PhD), Virginia Polytechnic Institute and

130
State University, available from http://scholar.lib.vt.edu/theses/available/etd-07272004-
133607, accessed June 2005.
87. Lobo, O.L. and Arthur, D.J. (2005) Local and Global Analysis: Complementary Activities for
Increasing the Effectiveness of Requirements Verification and Validation, Proceeding of the
ACM Southeast Conference, March 2005.
88. Lubars, M., Potts, C. and Richter, C. (1993) A review of the state of the practice in
requirements modelling, Proceedings of IEEE Symposium on Requirements Engineering,
San Diego, California.
89. Maiden, N., Manning, S., Robertson, S. and Greenwood, J. (2004) Integrating creativity
workshops into structured requirements processes, Symposium on Designing Interactive
Systems, Proceedings of the 2004 conference on Designing interactive systems: processes,
practices, methods, and techniques, ACM Press.
90. Mathison, S. (1988) Why triangulate? Educational Researcher, volume 17, number 2, pages
13-17.
91. Maxwell, J. A. (1992) Understanding and validity in qualitative research, Harvard Educational
Review, volume 62, number 3, pages 279-300.
92. Merriam, S. B. (1998) Qualitative Research and Case Study Applications in Education, San
Francisco: Jossey-Bass.
93. Morse, J.M. (1994) Critical issues in qualitative research methods, Thousand Oaks,
California: Sage.
94. Mouton, J. (2001) How to succeed in your masters and doctoral studies: A South African
guide and resource book, Pretoria: J.L van Schaik.
95. Nance, E.R. and Arthur, D.J. (2006) Software Requirements Engineering: Exploring the Role
in Simulation Model Development, Proceedings of the 2006 Operational Research Society
Simulation Workshop (SW06), Leamington Spa, UK. March 28-29, 2006.
96. Neuman, W.L. (1994) Social Research Methods: Qualitative and Quantitative Approaches,
second edition, Boston: Allyn and Bacon.

131
97. Neuendorf, K. A. (2002) The Content Analysis Guidebook, Thousand Oaks, CA: Sage
Publications.
98. Newbold, C., Boyd-Barrett, O. and Van Den Bulck, H. (2002) The Media Book. London:
Arnold.
99. Nunally, J. (1978) Psychometric Theory, New York: McGraw-Hill.
100. Parets-Llorca, J. and Grunbacher, P. (1999) Capturing, Negotiating and Evolving
System Requirements: Bridging WinWin and the UML, Proceedings of the twenty fifth
Euromicro Conference, Volume 2, Los Alamitos, California: IEEE Computer Society Press,
pages 252-259.
101. Patton, M. Q. (2001) Qualitative evaluation and research methods, third edition,
Thousand Oaks, CA: Sage Publications Inc.
102. Paulk, M.C. (1993) Capability Maturity Model for Software, Software Engineering
Institute, Carnegie Mellon University, Pittsburgh, available at
http://www.sei.cmu.edu/publications/documents/93.reports/93.tr.024.html, accessed July
2006.
103. Pfleeger, S.L. (2001) Software Engineering: Theory and Practice, second edition:
Prentice-Hall.
104. Potts, C. (1991) Seven (Plus or Minus Two) Challenges for Requirements Analysis
Research, Proceedings of the Requirements Engineering and Analysis Workshop, CMU/SEI-
91-TR-30, Software Engineering Institute.
105. Quek, A. and Shah, H. (2004) A Comparative Survey Of Activity-Based Methods For
Information Systems Development, International Conference on Enterprise Information
Systems, Staffordshire University, Beacon side, Stafford, United Kingdom, available at
http://www.comp.lancs.ac.uk/computing/research/cseg/projects/tracker/qs_iceis04.pdf,
accessed July 2005.
106. Ragin, C. C. (1990) The Comparative Method: Moving Beyond Qualitative and
Quantitative Strategies, Berkeley and London: University of California Press.

132
107. Ranky, P. G. and Chamyvelumani, S. (2003) A Method, a Tool (CORA) and Application
Examples for Analysing Disassembly User Interface Design Criteria, International Journal of
Computer Integrated Manufacturing, Vol. 16, No. 4-5, pages 317-325.
108. Reeves, T. (2000) Enhancing the Worth of Instructional Technology Research through
Design Experiments and Other Development Research Strategies, International Perspectives
on Instructional Technology Research for the 21st Century, a Symposium sponsored by
SIG/Instructional Technology at the Annual Meeting of the American Educational Research
Association, New Orleans.
109. Reilly, D. and Bendiab, T. A. (2002) A Rapid Prototyping Approach for the Design of
Extensible In-Vehicle Telematics Systems, Journal of Integrated Design and Process
Science, volume 6, number 2, pages 91-106.
110. Remenyi D. and Williams B. (1995) Some Aspects of Methodology for Research in
Information Systems, Journal of Information Systems, No 10, pages 191–201.
111. Richards, D. (2003) Requirements Reconciliation using a Computer Supported
Collaborative Approach, Journal of Integrated Design and Process Science, June 2003,
volume 7, number 2, pages 113-129.
112. Richards, D. (2000) A Process Model for Requirements Elicitation, Proceeding of the
Eleventh Brisbane Conference on Information Systems, December 6-8, Brisbane.
113. Robertson, S. and Robertson, J. (1999) Mastering the Requirements Process, Addison-
Wesley.
114. Ruhe, G. and Momoh, J. (2005) Strategic Release Planning and Evaluation of
Operational Feasibility, Proceedings of the Proceedings of the Thirty-eighth Annual Hawaii
International Conference on System Sciences, volume 9, pages 312-313.
115. Rygielski, C., Wang, J and Yen, D.C. (2002) Data mining techniques for customer
relationship management, Technology in Society, November 2002, volume 24, number 4,
pages 483-502.

133
116. Sawyer, P. and Sommerville, I. (1997) Viewpoints: principles, problems and a practical
approach to requirements engineering, Annals of Software Engineering, special issue on
software requirements engineering, volume 3, number 101, page 130.
117. Sawyer, P., Sommerville, I. and Viller, S. (1999) Capturing the benefits of requirements
engineering, IEEE Software, volume 16, number 2, pages 78-85.
118. Shih, Y. and Liu, D.R. (2005) Hybrid Recommendation Approaches: Collaborative Filtering
via Valuable Content Information, Proceedings of the Thirty-eighth Annual Hawaii
International Conference on System Sciences (HICSS'05), IEEE Computer Society.
119. Siregar, J. and Tan, M.T. K. (2004) Leveraging Theoretical Pluralism in qualitative IS
research: The example of IS professionals' identity as a complex phenomenon, Proceedings
of Twelfth European Conference on Information, 14 - 16 June 2004, Turku, Finland.
120. Siponen, M., Baskerville, R. and Kuivalainen, T. (2005) Integrating Security into Agile
Development Methods, Proceedings of the Thirty-eighth Annual Hawaii International
Conference on System Sciences (HICSS'05), IEEE Computer Society.
121. Software Engineering Institute Requirements Engineering Project (SEIREP) (2004)
Requirements Engineering and Analysis Workshop Proceedings, Technical Report CMU/SEI-
91-TR-30, Software Engineering Institute, Pittsburgh, available from http://www.sei.cmu.edu,
accessed June 2006.
122. Silverman, D. (2000) Doing qualitative research: a practical handbook, London: Sage.
123. Sommerville, I. (2005) Software Engineering, seventh edition: Addison-Wesley.
124. Standish Group (2004) The Chaos chronicles, available from
http://www.standishgroup.com, accessed April 2005.
125. Strauss, A. (1987) Qualitative Analysis for Social Scientists, Cambridge, Cambridge
University Press.
126. Stenbacka, C. (2001) Qualitative research requires quality concepts of its own,
Management Decision, volume 39, number 7, pages 551-555.

134
127. Stutz, C., Siedersleben, J., Kretschmer, D. and Krug, W. (2002) Analysis beyond UML,
Proceedings of IEEE Joint International Requirements Engineering Conference, 2002, pages
215-222, Essen, Germany.
128. Sud, R. (2004) A Synergistic Approach to Software Requirements Generation: The
Synergistic Requirements Generation Model (SRGM) and, An Interactive Tool for Modelling
SRGM (itSRGM), Thesis (Masters), Virginia Polytechnic Institute and State University,
available from http://www.scholar.lib.vt.edu/theses/available/etd-05182003-111744, accessed
January 2006.
129. Sutherland, F. (1994) The Measurement of Information Technology Benefits in South
Africa, Unpublished M.Comm thesis, University of the Witwatersrand, Johannesburg.
130. Terre Blanche, M. and Kelly, K. (1999) Interpretative Methods, in M. Terre Blance and K.
Durrheim, Research in Practice: Applied Methods for the Social Sciences, pages 123-146,
Cape Town: University of Cape Town Press.
131. Toh, K. T. K. and Harding, J. A. (1999) An Enterprise Modelling CASE Tool and Data
Schema Requirements for the Selection of Software Support, International Journal of
Production Research, 37:18, 1999, pages 4079-4104.
132. Trochim, W. (1989) Outcome Pattern Matching and Program Theory, Evaluation and
Program Planning, volume 12, pages 355-366.
133. Wallace, L., Keil, M. and Rai, A. (2004) How Software Project Risk Affects Project
Performance: An Investigation of the Dimensions of Risk and an Exploratory Model, Decision
Sciences, March 2004, volume 35, number 2, pages 289-32.
134. Whetten, D. A. (1989) What constitutes a theoretical contribution? Academy of
Management Review, volume 14, number 4, pages 490-495.
135. White, E.R.F and Dhillon, G. (2005) Synthesising Information System Design Ideals to
Overcome Developmental Duality in Securing Information Systems, Proceedings of the
Thirty-eighth Annual Hawaii International Conference on System Sciences, IEEE computer
society.

135
136. Williams, T. (1998) What Do You Mean You Can’t Tell Me If My Project Is in Trouble? First
European Conference on Software Metrics, Antwerp, Belgium.
137. Wolcott, H. F. (1994) Transforming qualitative data: Description, analysis, and
interpretation, Thousand Oaks, CA: Sage.
138. Yin, R. K. (1994) Case Study Research: Design and Methods, second edition, Newbury
Park: Sage.
139. You, R.R. (2001) Effective Requirements Practices, Addison-Wesley.
140. Yourdon, A.S., Davis, A. E. and Zweig, E. A. (1999) Requirements Management Made
Easy, Omni-Vista white paper number 99-002.
141. Zucconi, L. (1999) Techniques and Experiences Capturing Requirements for Several Real-
Time Applications, ACM SIGSOFT Software Engineering Notes, volume 14, number 6, pages
51-55.

136
Appendix A: Popular Press and Internet References
The references in this section come from popular press and internet articles. Although many have
limited academic value, they have been included to illustrate the extent of interest in business
analysis.
1. Alwang, G. (2004) The Importance of Business Analysis engineering, PC World, March 3.
2. Bakos, Y. (2005) Business analysis and the Virtual Corporation, Computerworld, October 5.
3. Bontis, N. (2003) The Knowledge Toolbox: A Review of the Tools Available to Measure and
Manage Intangible Resources, Computerworld, February 2.
4. Broadwell, O., Gough, J. and Carkenord B. (2005) What is a Business Analyst?,
http://www.b2ttraining.com, accessed July 2005.
5. Chafer, A. (2005) Business Analysis – Setting the Standard, Group Project Services, Lloyds
TSB plc, http://www.llyodstsb.co.za, accessed July 2005.
6. ESI, (2005) Business Analysis, http://www.esi-intl.com, accessed July 2005.
7. Fleisch, E. and H. Österle (2000) Business analysis and networking, Smart Computing,
August 5.
8. Finneran, T.R. (2000) E-Business analysis Metrics, IT World Canada, June 20.
9. Goldberg, S. (2005) Business Analyst Curriculum, http://www.northeasttraininggroup.com,
accessed July 2005.
10. Iacob, M.E., and Smit, A. (2000) Business analysis, Computerworld, September 5.
11. IMT Strategies (2001) Online Customer: The Key to Demonstrating and Capturing E-
Business Value, Research Report, January 2001.
12. Jägers, H. (2004) Solution engineering for Virtual Organisations, PC World, July 5.
13. Jeffries, R. (2005) Business Analysis in Extreme Programming, XP magazine, March 2000.

137
14. Joseph, T. (2005) Business Analysis, http://www.b2ttraining.com, accessed July 2005.
15. Kushal, A. (2005) Methods for User-Centred Design, [MS Powerpoint presentation]. Texas
AandM http://www.cs.tamu.edu/people/k0s8833/chi/home.html, accessed July 2005.
16. Kaplan, R. (2004) Translating Strategy into Action, Computer Business Review, January 5.
17. Klüber, R. (2004) A framework for virtual organising, Computer Business Review, February 7.
18. Lyneham-Brown, D. (2001) Business Analysis and Project Management – Roles and Inter-
relationship, Project Manager Today, March 2001.
19. Lyneham-Brown, D. (2001) Leave It to the Analysts, The Chemical Engineer, November.
20. Lyneham-Brown, D. (2002) Making Change Happen - the Role of the Business Analyst,
Pharma Times, February.
21. Lyneham-Brown, D. (2002) Business Analysts – the Missing Link in the Project Value Chain?,
Project journal, March.
22. Lyneham-Brown, D. (2003) Elements of Change, http://www.eoc.co.uk, accessed July 2005.
23. Morell, J. (2001) Metrics and Models for the analysis of Supply Chain Integration, Computing
Reviews, September.
24. Nohria, N (2002) Networks and Organisations: Structure, Form, and Analysis, Project journal,
March.
25. Österle,H., Fleisch, E., and Alt, R. (2000), Business networking: Shaping enterprise
relationships, Computer Business Review, February.
26. Raymond, T. (2001) Analysis methodologies, Project journal, April.
27. Robinson, T.A., How Does Business Analysis Differ From Systems Analysis, HCCS
CONSULTING GROUP, http://www.hccs.net.au, accessed July 2005.

138
28. Stevens, M. (2005) Bridging the Gap, http://www.eweek.com/article2/0,3959,1023750,00.asp,
accessed July 2005.
29. Underwood, J. (2005) Models for Change - Soft Systems Methodology,
http://linus.socs.uts.edu.au/~jim/bpt/ssm.html, accessed July 2005.
30. Varma, S. (2001) Dotcom Failure, Evaluation, volume 3, issue 5, pages 1-7, 2001,
http://www.eva.com/evaluation/overview.shtml, accessed July 2005.
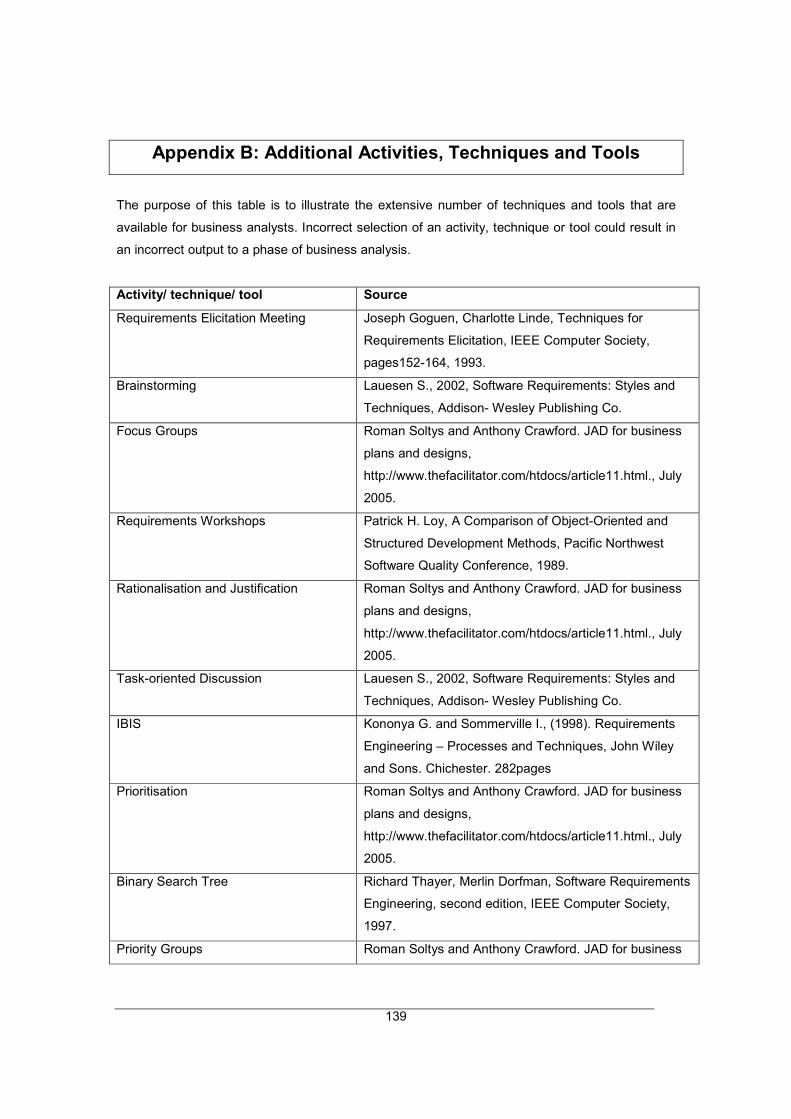
139
Appendix B: Additional Activities, Techniques and Tools
The purpose of this table is to illustrate the extensive number of techniques and tools that are
available for business analysts. Incorrect selection of an activity, technique or tool could result in
an incorrect output to a phase of business analysis.
Activity/ technique/ tool Source
Requirements Elicitation Meeting Joseph Goguen, Charlotte Linde, Techniques for
Requirements Elicitation, IEEE Computer Society,
pages152-164, 1993.
Brainstorming Lauesen S., 2002, Software Requirements: Styles and
Techniques, Addison- Wesley Publishing Co.
Focus Groups Roman Soltys and Anthony Crawford. JAD for business
plans and designs,
http://www.thefacilitator.com/htdocs/article11.html., July
2005.
Requirements Workshops Patrick H. Loy, A Comparison of Object-Oriented and
Structured Development Methods, Pacific Northwest
Software Quality Conference, 1989.
Rationalisation and Justification Roman Soltys and Anthony Crawford. JAD for business
plans and designs,
http://www.thefacilitator.com/htdocs/article11.html., July
2005.
Task-oriented Discussion Lauesen S., 2002, Software Requirements: Styles and
Techniques, Addison- Wesley Publishing Co.
IBIS Kononya G. and Sommerville I., (1998). Requirements
Engineering – Processes and Techniques, John Wiley
and Sons. Chichester. 282pages
Prioritisation Roman Soltys and Anthony Crawford. JAD for business
plans and designs,
http://www.thefacilitator.com/htdocs/article11.html., July
2005.
Binary Search Tree Richard Thayer, Merlin Dorfman, Software Requirements
Engineering, second edition, IEEE Computer Society,
1997.
Priority Groups Roman Soltys and Anthony Crawford. JAD for business
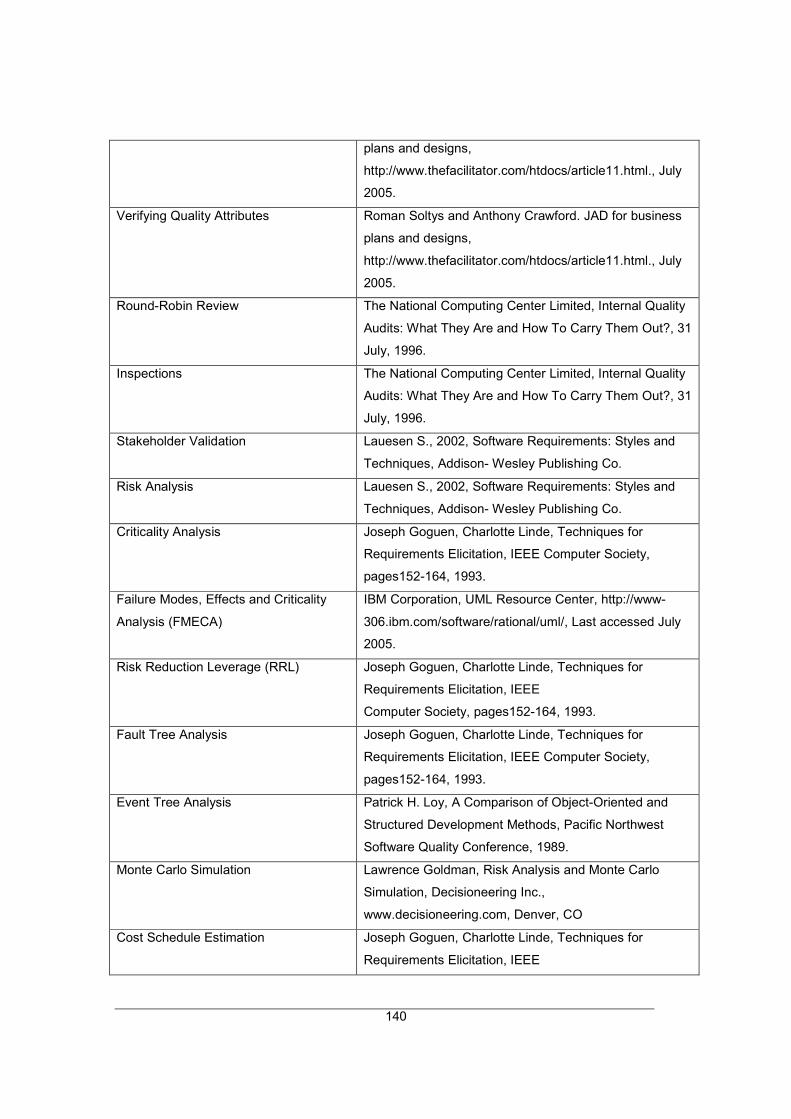
140
plans and designs,
http://www.thefacilitator.com/htdocs/article11.html., July
2005.
Verifying Quality Attributes Roman Soltys and Anthony Crawford. JAD for business
plans and designs,
http://www.thefacilitator.com/htdocs/article11.html., July
2005.
Round-Robin Review The National Computing Center Limited, Internal Quality
Audits: What They Are and How To Carry Them Out?, 31
July, 1996.
Inspections The National Computing Center Limited, Internal Quality
Audits: What They Are and How To Carry Them Out?, 31
July, 1996.
Stakeholder Validation Lauesen S., 2002, Software Requirements: Styles and
Techniques, Addison- Wesley Publishing Co.
Risk Analysis Lauesen S., 2002, Software Requirements: Styles and
Techniques, Addison- Wesley Publishing Co.
Criticality Analysis Joseph Goguen, Charlotte Linde, Techniques for
Requirements Elicitation, IEEE Computer Society,
pages152-164, 1993.
Failure Modes, Effects and Criticality
Analysis (FMECA)
IBM Corporation, UML Resource Center, http://www-
306.ibm.com/software/rational/uml/, Last accessed July
2005.
Risk Reduction Leverage (RRL) Joseph Goguen, Charlotte Linde, Techniques for
Requirements Elicitation, IEEE
Computer Society, pages152-164, 1993.
Fault Tree Analysis Joseph Goguen, Charlotte Linde, Techniques for
Requirements Elicitation, IEEE Computer Society,
pages152-164, 1993.
Event Tree Analysis Patrick H. Loy, A Comparison of Object-Oriented and
Structured Development Methods, Pacific Northwest
Software Quality Conference, 1989.
Monte Carlo Simulation Lawrence Goldman, Risk Analysis and Monte Carlo
Simulation, Decisioneering Inc.,
www.decisioneering.com, Denver, CO
Cost Schedule Estimation Joseph Goguen, Charlotte Linde, Techniques for
Requirements Elicitation, IEEE

141
Computer Society, pages152-164, 1993.
Software Life Cycle Management (SLIM) Nancy Merlo, Schett, 2002, COCOMO (Constructive
Cost Model), Seminar on Software Cost Estimation WS
2002 / 2003, 2002.
Constructive Cost Model (COCOMO) Nancy Merlo, Schett, 2002, COCOMO (Constructive
Cost Model), Seminar on Software Cost Estimation WS
2002 / 2003, 2002.
COCOMO II Nancy Merlo, Schett, 2002, COCOMO (Constructive
Cost Model), Seminar on Software Cost Estimation WS
2002 / 2003, 2002.
Functions Points Nancy Merlo, Schett, 2002, COCOMO (Constructive
Cost Model), Seminar on Software Cost Estimation WS
2002 / 2003, 2002.
Work Breakdown Structure Nancy Merlo, Schett, 2002, COCOMO (Constructive
Cost Model), Seminar on Software Cost Estimation WS
2002 / 2003, 2002.
Gantt Chart Lauesen S., 2002, Software Requirements: Styles and
Techniques, Addison- Wesley Publishing Co.
Program Evaluation and Review
Technique (PERT)
Joseph Goguen, Charlotte Linde, Techniques for
Requirements Elicitation, IEEE Computer Society,
pages152-164, 1993.
Critical Path Method (CPM) Davis, A.M., Jordan, K. and Nakajima, T. (1997),
Elements Underlying the Specification of Requirements,
Annals of Software Engineering, Spec. Issue on
Software Requirements Engineering, 3:63-100.
Price Analysis Joseph Goguen, Charlotte Linde, Techniques for
Requirements Elicitation, IEEE Computer Society,
pages152-164, 1993.
Comparative Price Analysis Lauesen S., 2002, Software Requirements: Styles and
Techniques, Addison- Wesley Publishing Co.
Comparisons with Independent Cost
Estimates
Kononya G. and Sommerville I., (1998). Requirements
Engineering – Processes and Techniques, Chichester.
John Wiley and Sons.
Value Analysis Kononya G. and Sommerville I., (1998). Requirements
Engineering – Processes and Techniques, Chichester.
John Wiley and Sons.
Payback Period Lauesen S., 2002, Software Requirements: Styles and

142
Techniques, Addison- Wesley Publishing Co.
Net Present Value Patrick H. Loy, A Comparison of Object-Oriented and
Structured Development Methods, Pacific Northwest
Software Quality Conference, 1989.
Internal Rate of Return Joseph Goguen, Charlotte Linde, Techniques for
Requirements Elicitation, IEEE Computer Society,
pages152-164, 1993.
Pilot experiments Joseph Goguen, Charlotte Linde, Techniques for
Requirements Elicitation, IEEE Computer Society,
pages152-164, 1993.
Interest Based Bargaining Joseph Goguen, Charlotte Linde, Techniques for
Requirements Elicitation, IEEE Computer Society,
pages152-164, 1993.
Functional Hierarchy Decomposition Joseph Goguen, Charlotte Linde, Techniques for
Requirements Elicitation, IEEE Computer Society,
pages152-164, 1993.

143
Appendix C: Individual Interview Protocol
Thank you for agreeing to participate in this research. I am currently busy with research towards
an M.Comm (Information Systems) at the University of Witwatersrand.
Please be assured that any information provided will be held in the strictest confidence. With your
permission, I will record the interview and will submit a transcript for your approval afterwards. If
you request that the information you provide should not be attributed to you, your wishes will be
respected. Data collected for the purpose of research will not be used for any other purpose
without obtaining your permission for any alternative or additional use.
The aim of this project is to develop a business analysis methodology for business analysts in the
South African financial services environment. This research proposes to identify phases,
activities, tools and techniques for such a methodology.
General
Please tell me your name. This is optional.
What is your position in the organisation?
Project Manager;
Business Analyst
IS manager;
CIO
Other, please specify
Organisation Bank A Bank B
Date // //
1. Business analysis methodology
Time: 5 minutes
Interview comments
Please tell me about your understanding of business analysis.

144
2. Business Analysis Phases
Time: 10 minutes
Please tell me about the phases of the methodology that you use. Also, for each of these phases, please describe to me the objectives, relevance and outcomes. Phase 1
Phase 2
Phase 3
Phase n
Tell me if there are any additional phases, other that the ones you just described?
Do you think there is any relationship between these phases that you just mentioned? Please tell me about this relationship?
Probes:
-Tell me your view on what the scopes of these phases are?
-Explain to me the purpose of each of these phases?
-Tell me if there are any constrains relating to the phases?
-Please give me more ideas or opinions to improve the phases?

145
3. Business Analysis Activities
Time: 10 minutes
Now, for each phase just mentioned, please tell me about the activities you perform when conducting business analysis. Shall we begin with phase 1… Phase 1
Phase 2
Phase 3
Phase 4
Are there any additional activities other than the ones you have just mentioned? Please describe these additional activities to me.
Tell me if you think there is any relationship between these activities?
Probes:
-Please explain to me if these activities user friendly?
-What is your view on any constrains relating to these activities?
-Explain to me if you would change any activities of this
methodology?
-How would you change these activities?
-Explain to me ideas or opinions to improve these activities?

146
4. Business Analysis techniques
Time: 10 minutes
For each phase mentioned above, please tell me about the techniques you utilise when conducting business analysis. Phase 1
Phase 2
Phase 3
Phase n
Tell me if there are any additional techniques?
For these techniques that you mentioned, tell me if there any relationship between these techniques?
Probes:
-Explain to me if these techniques user friendly?
-Describe to me if there are any constrains relating to the techniques?
-Tell me if you would change any techniques of this methodology?
-How would you change these techniques?
-Please give me any ideas or opinions to improve the techniques?

147
5. Business Analysis Tools
Time: 10 minutes
For each phase described above please tell me about the tools that you utilise when conducting business analysis. Shall we begin with phase 1… Phase 1
Phase 2
Phase 3
Phase n
Besides the tools that you just mentioned, tell me if there are any additional tools?
Tell me, do you think there is any relationship between these tools mentioned?
Probes:
-Explain to me if these tools are user friendly?
-Give me your opinion relating to any constrains of the tools?
-Tell me if you would you change any tools of this methodology?
- How would you change these tools?
- Please give me any ideas or opinions to improve the tools?
This question concludes the interview. Thank you for your participation. Please contact me should you be interested in viewing the results of this study
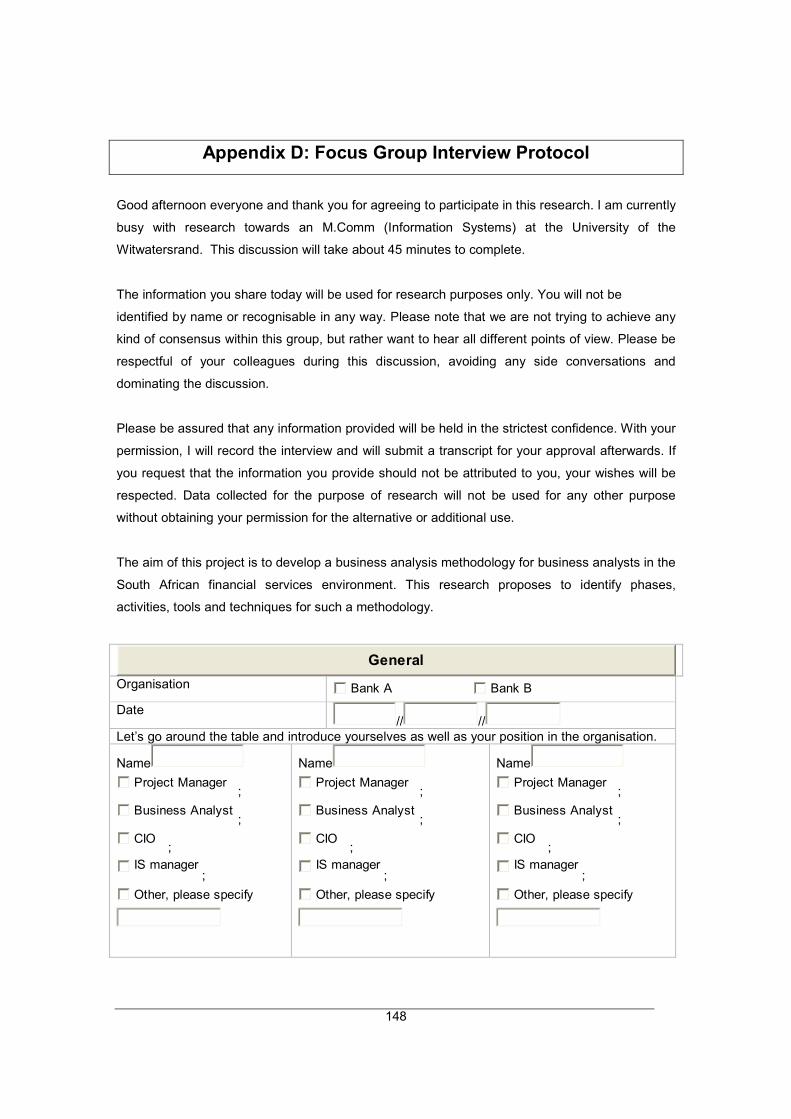
148
Appendix D: Focus Group Interview Protocol
Good afternoon everyone and thank you for agreeing to participate in this research. I am currently
busy with research towards an M.Comm (Information Systems) at the University of the
Witwatersrand. This discussion will take about 45 minutes to complete.
The information you share today will be used for research purposes only. You will not be
identified by name or recognisable in any way. Please note that we are not trying to achieve any
kind of consensus within this group, but rather want to hear all different points of view. Please be
respectful of your colleagues during this discussion, avoiding any side conversations and
dominating the discussion.
Please be assured that any information provided will be held in the strictest confidence. With your
permission, I will record the interview and will submit a transcript for your approval afterwards. If
you request that the information you provide should not be attributed to you, your wishes will be
respected. Data collected for the purpose of research will not be used for any other purpose
without obtaining your permission for the alternative or additional use.
The aim of this project is to develop a business analysis methodology for business analysts in the
South African financial services environment. This research proposes to identify phases,
activities, tools and techniques for such a methodology.
General
Organisation Bank A Bank B
Date // //
Let’s go around the table and introduce yourselves as well as your position in the organisation.
Name
Project Manager;
Business Analyst;
CIO;
IS manager;
Other, please specify
Name
Project Manager;
Business Analyst;
CIO;
IS manager;
Other, please specify
Name
Project Manager;
Business Analyst;
CIO;
IS manager;
Other, please specify

149
Name
Project Manager;
Business Analyst;
CIO;
IS manager;
Other, please specify
Name
Project Manager;
Business Analyst;
CIO;
IS manager;
Other, please specify
Name
Project Manager;
Business Analyst;
CIO;
IS manager;
Other, please specify
Name
Project Manager;
Business Analyst;
CIO;
IS manager;
Other, please specify
Name
Project Manager;
Business Analyst;
CIO;
IS manager;
Other, please specify
Name
Project Manager;
Business Analyst;
CIO;
IS manager;
Other, please specify
Name
Project Manager;
Business Analyst;
CIO;
IS manager;
Other, please specify
Name
Project Manager;
Business Analyst;
CIO;
IS manager;
Other, please specify
Name
Project Manager;
Business Analyst;
CIO;
IS manager;
Other, please specify
1. Business analysis methodology
Time: 5 minutes
Interview comments
Shall we begin with the first question? Traditionally business analysis was considered to be a fuzzy stage of software development where a specification was generated from possibly vague and informally expressed ideas. Please tell me about your understanding of business analysis.

150
2. Business Analysis Phases
Time: 10 minutes
Shall we move on to the next question? A phase is defined as a stage or component of a methodology. Please tell me about the phases of the methodology that you use. Also please describe the objectives, relevance and outcomes of these phases. Phase 1
Phase 2
Phase 3
Phase n
Tell me, are there any additional phases besides the ones you just mentioned?
Do you think there is any relationship between these phases mentioned?
Prompts: Tell me, does anyone else have a comment on that question? Anything else? Do you have something to add? Tell me more about that… Are you referring to…? And by that you mean…? Probes: Tell me more on the scope of these phases? Explain the purpose of each of these phases? What is your view on any constrains relating to the phases? Please give me any ideas or opinions to improve the phases?

151
3. Business Analysis Activities
Time: 10 minutes
Activities are defined as steps, sub-events or tasks of a phase. Now, for each phase mentioned above, please tell me about the activities you perform when conducting business analysis. Shall we begin with phase 1… Phase 1
Phase 2
Phase 3
Phase n
Do you think there are any additional activities?
Please tell, do you think there is any relationship between these activities mentioned?
Probes:
-Please give me your opinion on the user friendliness of these
activities?
-What is your opinion on any constrains relating to these activities?
-Tell me if you would change any activities of this methodology?
-How would you change these activities?
-Please give me ideas or opinions to improve these activities?

152
4. Business Analysis techniques
Time: 10 minutes
A technique is defined as a specific approach towards performing an activity. For each phase mentioned above, please tell me about the techniques you utilise when conducting business analysis. Phase 1
Phase 2
Phase 3
Phase n
Tell me, are there any additional techniques?
Do you think there is any relationship between these techniques mentioned?
Probes:
-Explain to me if these techniques are user friendly?
-Describe to me are any constrains relating to the techniques?
-Tell me if you would change any techniques of this methodology?
-How would you change these techniques?
-Please give me any ideas or opinions to improve the techniques?

153
5. Business Analysis Tools
Time: 10 minutes
Tools are defined as automated software tools designed to help in the development of an information system. For each phase described above please tell me about the tools that you utilise when conducting business analysis. Phase 1
Phase 2
Phase 3
Phase n
Are there any additional tools besides the ones you just mentioned?
Tell me, do you think there is any relationship between these tools mentioned?
Probes:
-Give me your view on whether these tools are user friendly?
-Explain your opinion relating to constrains of the tools?
-Tell me if you would you change any tools of this methodology?
- How would you change these tools?
- Give me any ideas or opinions to improve the tools?
Thank you for your participation. That question concludes the focus group interview. Please contact me should you be interested in viewing the results of this study

154
Appendix E: Data from Individual Interviews
This appendix presents the findings from individual interviews and is structured as follows:
• E1 Supporting comments on relevance of this research and on understanding of business
analysis;
• E2 Individual interview mentions, percentages and comments for phase 1;
• E3 Individual interview mentions, percentages and comments for phase 2;
• E4 Individual interview mentions, percentages and comments for phase 3; and
• E5 Individual interview mentions, percentages and comments for phase n.
E1 Supporting comments on relevance of this research and understanding
of business analysis
• "Well thought out".
• "I think that this survey is an excellent method to gather information on the perceptions of business
analysts and also to become aware of the kind of people and skills that are available".
• “Look to be very relevant questions, and good that one can add comments along the way. I'm keen to see
the results of this project".
• "Excellent layout, looking forward to results".
• "It's brilliantly formulated, well done to you for putting it together".
• "This is a very 'grey' area and we NEED all the help we can get. I really think that this is a great initiative.
Please press this issue and make it work ".
• "Interesting research topic, would like to see results. Thanks ".
• "Curious to see the outcome and the way forward. Good luck!".
• "Absolutely essential…thanks!"
• "About time!"
• "Good research topic.…be interesting to see what the outcome is."
The only negative comment that was received on the research was that “The survey is a good start, but not
exhaustive”.
12Figure E1: Supporting comments from participants on the relevance of this research
• “Business analysis is the missing link between business and IT”.
• “Business analysis provides a common understanding to business people and technical people. It
facilitates a compromise between various stakeholders”.
• “Business analysis analyses business problems”.
• “Analyse and define the business problems in terms of the systems and processes”.

155
• “Analyse how business users do their work and how to increase their efficiency and resource utilisation
such as labour, time and equipment”.
• “Business analysis is the ‘what’ and ‘how’ of things”.
• “Business analysis is about identifying all processes that add value to the organisation”.
• “Analyse the current business processes and investigate/implement better solutions”.
• “Define the business processes and define requirements for new processes”.
• “Understand business, processes and systems that the business uses”.
• “Understand the way a company operates and how it uses technology. It comprises all aspects of
business performance, strategy, structures, technology, systems, HR”.
• “Analyse what the user wants from the system”.
• “Determine business requirements for purposes of feasibility, risk and impact analysis”
• “Identify requirements for improvements”.
• “Analyse the requirements of the business”.
• “Understand the client's requirements”.
• “Analyse business requirements in terms of strategic objectives”.
• “Design and maintain a requirement from business into the designated lines of delivery”.
• “Eliciting business needs as embedded in existing processes or as needed extensions of existing
processes”.
• “Understand the business processes and requirements that drives the business”.
• “Identify a business's requirements in terms of 'what' they need to function as a business logically”.
13Figure E2: Supporting comments from participants on their understanding of business analysis
E2 Individual interview mentions, percentages and comments for phase 1
6 Table E1: Mentions and percentages from individual interviews for phase 1
Code Response Mentions Percent
PH1FE Feasibility phase 15 25.8%
PH1RE Requirements phase 10 17.2%
PH1EL Elicitation phase 9 15.5%
PH1CA Capturing phase 9 15.5%
PH1AN Analysis phase 8 13.7%
PH1SP Specification phase 4 6.8%
PH1IN Investigation phase 2 3.4%
PH1PR Problem solving phase 1 1.7%
Total 58 100%
• “In many ways, a feasibility study is a mini-project in its own right, its outcome being a decision on how the
larger project should be managed”.

156
• “Because putting together a system a significant investment of time and money, you want to make sure
that there are no major roadblocks facing your business idea before you make that investment. Identifying
such roadblocks is the purpose of a feasibility study”.
• “A feasibility study looks at market issues, organisational issues, technical issues and financial issues prior
to commencing with business ideas”.
• “The feasibility phase is a detailed investigation of a concept”.
• “It is an initial study of a project”.
• “A feasibility study is the first stage in a project lifecycle. It helps businesses decide if implementing a
solution is going to be successful and worthwhile. A feasibility study gives a business the opportunity
either to stop the new solution and stay with the current situation or continue developing a new system”.
• “A feasibility study is a process which leads to a decision on whether or not to implement a project, and is
performed by a business analyst”.
• “The purpose of this phase is to decide if a business opportunity is practical and viable”.
• “A description of what a system should do “.
14Figure E3: Supporting individual interview comments for phase 1
7 Table E2: Mentions and percentages from individual interviews for phase 1 activities
Code Response Mentions Percent
PR1IN Identify need or opportunity 27 25.9%
PR1DB Define boundaries 20 19.2%
PR1IG Information gathering 17 16.3%
PR1OI Opportunity identification 16 15.3%
PR1OA Opportunity analysis 14 13.4%
PR1RE Recommendations 10 9.6%
Total 104 100%
8 Table E3: Mentions and percentages from individual interviews for phase 1 techniques
Code Response Mentions Percent
TE1IN Interviews 28 10.9%
TE1OB Observations 27 10.5%
TE1TD Task demonstrations 25 9.7%
TE1DS Document studies 22 8.5%
TE1QU Questionnaires 20 7.8%
TE1JA JAD sessions 20 7.8%
TE1WO Workshops 19 7.4%
TE1PRO Prototyping 19 7.4%
TE1IB IBIS 17 6.6%
TE1SC Scenarios 16 6.2%
TE1ST Storyboarding 15 5.8%
TE1IN Inspections 14 5.4%

157
TE1AI Audits 14 5.4%
Total 256 100%
9 Table E4: Mentions and percentages from individual interviews for phase 1 tools
Code Response Mentions Percent
TO1VA Visible Analyst 30 42.8%
TO1CB Cool Biz 7 10.0%
TO1VI Visio 9 12.8%
TO1TE Telelogic 9 12.8%
TO1MW MS word 8 11.4%
TO1RR Rational Rose 4 5.7%
TO1SO Softeam Objecteering Project 2 2.8%
TO1ER ERWin 1 1.4%
Total 70 100%
E3 Individual interview mentions, percentages and comments for phase 2
10Table E5: Mentions and percentages from individual interviews for phase 2
Code Response Mentions Percent
PH2BC Business case phase 13 25.4%
PH2BA Business analysis phase 10 19.6%
PH2SO Solution specification phase 8 15.6%
PH2BI Business investigation phase 7 13.7%
PH2RE Refinement phase 7 13.7%
PH2CO Costing phase 4 7.8%
PH2BU Budget analysis phase 2 3.9%
Total 51 100%
• “Define the scope of the business issue”.
• “Present options and make recommendations”.
• “Seek approval so that the preferred option can be pursued as a project”.
• “Obtain human and financial resources for a project”.
• “Clarify the business issues and the ideal solution”.
• “Explore options or possible solutions”.
• “Recommend the preferred option”.
• “Seek approval for resources of the preferred option”.
• “Reach agreement on the scope of the project”.
• “Seek authorisation to proceed to the next step of the project”.
15Figure E4: Supporting individual interview comments for phase 2

158
11Table E6: Mentions and percentages from individual interviews for phase 2 activities
Code Response Mentions Percent
PR2IS Identify solution 20 18.1%
PR2RB Refine boundaries 18 16.3%
PR2CM Collate more information 17 15.4%
PR2AS Analysis of solution 17 15.4%
PR2AD Assumptions and dependencies 15 13.6%
PR2AA As-is analysis 12 10.9%
PR2ERE Recommendations 11 10%
Total 110 100%
12Table E7: Mentions and percentages from individual interviews for phase 2 techniques
Code Response Mentions Percent
TE2CA Criticality analysis 26 13.8%
TE2RR Risk reduction leverage 22 11.7%
TE2FT Fault tree analysis 20 10.7%
TE2WB Work breakdown structure 20 10.5%
TE2CB Cost benefit analysis 19 10.1%
TE2CP Comparative price analysis 19 10.1%
TE2VA Value analysis 17 9.0%
TE2PP Payback period 16 8.5%
TE2NP Net present value 15 7.9%
TE2IR Internal rate of return 14 7.4%
Total 188 100%
13Table E8: Mentions and percentages from individual interviews for phase 2 tools
Code Response Mentions Percent
TO2BT Borland Together 15 28.3%
TO2SO Softeam Objecteering Project 10 18.8%
TO2TE Telelogic 8 15.0%
TO2VA Visible Analyst 7 13.2%
TO2UM UModel 7 13.2%
TO2AV Artiso Visual Case 3 5.6%
TO2MW MS word 2 3.7%
TO2RR Rational Rose 1 1.8%
Total 53 100%

159
E4 Individual interview mentions, percentages and comments for phase 3
14Table E9: Mentions and percentages from individual interviews for phase 3
Code Response Mentions Percent
PH3AD Analysis and design phase 13 30.2%
PH3AN Analysis phase 8 18.6%
PH3RE Requirements specification phase 7 16.2%
PH3RA Requirements analysis phase 7 16.2%
PH3SD Solution design phase 6 13.9%
PH3AD Architectural design phase 2 4.6%
Total 43 100%
• “This phase involves refining goals and expectations from the business case”.
• “Entails adapting or integrating business case requirements into technological solutions and determining
how best to incorporate these changes to improve system across the organisation”.
• “Understanding and specifying in detail what a system should do and then specifying in detail how the
parts of a system should be implemented”.
• “Entails context analysis, risk assessment, customer impact and producing models”.
• “This phase investigates how the system will technically solve the business problem and this phase
specifies the systems outputs, hardware, software, and user interface”.
• “This phase involves a more detailed study of a business problem from the business case, and specifies
of a technical, computer-based solution for the business requirements identified in the analysis”.
16Figure E5: Supporting individual interview comments for phase 3
15Table E10: Mentions and percentages from individual interviews for phase 3 activities
Code Response Mentions Percent
PR3RE Refinement 28 15.7%
PR3SC Scope 27 15.1%
PR3OW Ownership 25 14.0%
PR3RD Redesign 19 10.6%
PR3DA Detailed analysis 18 10.1%
PR3DS Design of solution 18 10.1%
PR3CM Change management 16 8.9%
PR3MO Modelling 15 8.4%
PR3DS Design signoff 12 6.7%
Total 178 100%

160
16Table E11: Mentions and percentages from individual interviews for phase 3 techniques
Code Response Mentions Percent
TE3AA Affinity analysis 27 19.5%
TE4FH Functional Hierarchy decomposition 25 18.1%
TE5MO Modelling 19 13.7%
TE6SI Simulation 18 13.0%
TE7BE Benchmarking 18 13.0%
TE8CO Context analysis 16 11.5%
TE9JA JAD 15 10.8%
Total 138 100%
17Table E12: Mentions and percentages from individual interviews for phase 3 tools
Code Response Mentions Percent
TO3RR Rational Rose 15 27.7%
TO3VI Visio 10 18.5%
TO3CB Cool Biz 8 14.8%
TO3MW MS word 7 12.9%
TO3RP Requisite Pro 7 12.9%
TO3DO DOORS 4 7.4%
TO3UM UModel 2 3.7%
TO3AV Artiso Visual Case 1 1.8%
Total 54 100%
E5 Individual interview mentions, percentages and comments for phase n
18Table E13: Mentions and percentages from individual interviews for phase n
Code Response Mentions Percent
PH4PI Post-implementation evaluation phase 18 35.2%
PH4SE Solution evaluation 13 25.4%
PH4PO Post-implementation review 12 23.5%
PH4VA Validation phase 4 7.8%
PH4VE Verification phase 3 5.8%
PH4CO Confirmation phase 1 1.9%
Total 51 100%
• “A rating of the project outcome against each of the specified project processes, including time, cost,
quality, risk, procurement, communications and acceptance management”.
• “A full list of the project achievements”.
• “Lessons learnt and recommendations for future projects“.

161
• “The purpose of this phase is to measure the effectiveness of the solution implemented, against the
requirements and organisational business case. A business should also evaluate the efficiency and
appropriateness of the solution and recommend and undertake any remedial action to address
deficiencies”.
• “This phase evaluates the project plan and analyses the reasons why a particular project tasks were
difficult or intensive for the business analyst or project manager and to make recommendations for future
projects in the organisation”.
• “This phase takes place 3 to 6 months after the project has been completed to assess whether the
business objectives were met and whether the outputs are working as expected. It also assesses the
effectiveness of the project”.
17Figure E6: Supporting individual interview comments for phase n
19Table E14: Mentions and percentages from individual interviews for phase n activities
Code Response Mentions Percent
PR4RR Review requirements 19 42.2%
PR4RB Review business case 14 31.1%
PR4RO Review objectives 12 26.6%
Total 45 100%
20Table E15: Mentions and percentages from individual interviews for phase n techniques
Code Response Mentions Percent
TE4TM Traceability matrix 15 34.8%
TE5IN Inspections 10 23.2%
TE6TT Traceability tree 9 20.9%
TE7PR Peer reviews 9 20.9%
Total 43 100%
21Table E16: Mentions and percentages from individual interviews for phase n tools
Code Response Mentions Percent
TO4ID Ideogramic 10 31.2%
TO4RR Rational Rose 8 25.0%
TO4TE Telelogic 7 21.8%
TO4MW MS word 7 21.8%
Total 32 100%

162
Appendix F: Data from Focus Group Interviews
This appendix presents the findings from the focus group interviews and is structured as follows:
• F1 Supporting comments on understanding of business analysis;
• F2 Individual interview mentions, percentages and comments for phase 1;
• F3 Individual interview mentions, percentages and comments for phase 2;
• F4 Individual interview mentions, percentages and comments for phase 3; and
• F5 Individual interview mentions, percentages and comments for phase n.
F1 Supporting comments on the understanding of business analysis
• “Business analysis is about understanding and interpreting the needs of a business or requirements and
then analysing and documenting the requirements”.
• “The link between business and IT”.
• “Define business requirements and produce structured documentation of these requirements”
• “Identify, analyse and document the business requirements in a clear and understandable way”.
• “Convey the business needs into IT requirements”.
• “Facilitate creative ideas for business solutions”.
• “Provide the most effective solution, automated or not, to business”.
• “Model new business processes”.
• “Provide a common understanding to business people and technical people”.
• “A definition of a business problem and a recommended solution”.
• “Re-engineering of the inadequate business processes”.
• “Finding the best BUSINESS solution”.
• “Analysing and creating a solution that satisfies the users' need or requirement”.
• “Review the business needs with the view to providing manual or automated solutions”
• “Gather requirements for a solution, verify that it is correct and communicate to developers”
• “The interface between business and technology to ensure user satisfaction”.
18Figure F1: Supporting focus group comments for the understanding of business analysis
F2 Focus group mentions, percentages and comments for phase 1
22Table F1: Mentions and percentages from focus group interviews for phase 1
Code Response Mentions Percent
PH1FE Feasibility phase 26 60.4%
PH1RE Requirements phase 12 25.0%
PH1EL Elicitation phase 5 10.4%
PH1CA Capturing phase 1 2.0%

163
PH1AN Analysis phase 1 2.0%
PH1SP Specification phase 1 2.0%
PH1IN Investigation phase 1 2.0%
PH1PR Problem solving phase 1 2.0%
Total 48 100%
• “A thorough feasibility analysis provides the information necessary for a business case”.
• “If a feasibility study is conducted after the project is being initiated, one of its outputs could be a
preliminary business case. If it is conducted after the business case has already been developed, it can
help refine the scope. In either case, it could help narrow the range of options, assess each of the
remaining options and propose solutions to issues raised”.
• “An initial study”.
• “A preliminary study”.
• “An examination of the practicality of implementing new system, processes, methods, or technologies”.
• A feasibility study is a small project to identify the best options for a problem, including potential partners,
potential costs, time frames and finances”.
• “It evaluates a project’s potential for success and reduces risk. It should show how a business can operate
under a given set of assumptions, and show project sensitivity to the market place”
• “This phase should present enough information to determine whether or not a project should advance to
further stages of analysis stage…this is a “go/no-go” decision point”.
• “This phase is to find out if a project can be done, and if so, how. It should tell management whether the
project can be done, and what the alternative solutions are, and a go/no-go decision”.
19Figure F2: Supporting focus group comments for phase 1
23Table F2: Mentions and percentages from focus group interviews for phase 1 activities
Code Response Mentions Percent
PR1IN Identify need or opportunity 31 26.7%
PR1DB Define boundaries 22 18.9%
PR1IG Information gathering 19 16.3%
PR1OI Opportunity identification 17 14.6%
PR1OA Opportunity analysis 16 13.7%
PR1RE Recommendations 11 9.4%
Total 116 100%
24Table F3: Mentions and percentages from focus group interviews for phase 1 techniques
Code Response Mentions Percent
TE1IN Interviews 29 10.7%
TE1OB Observations 28 10.4%
TE1TD Task demonstration 26 9.6%
TE1DS Document studies 23 8.5%

164
TE1QU Questionnaires 21 7.8%
TE1JA JAD sessions 21 7.8%
TE1WO Workshops 20 7.4%
TE1PRO Prototyping 20 7.4%
TE1IB IBIS 18 6.6%
TE1SC Scenarios 17 6.3%
TE1ST Storyboarding 16 5.9%
TE1IN Inspections 15 5.5%
TE1AI Audits 15 5.5%
Total 269 100%
25Table F4: Mentions and percentages from focus group interviews for phase 1 tools
Code Response Mentions Percent
TO1VA Visible Analyst 29 59.1%
TO1CB Cool Biz 10 20.4%
TO1VI Visio 5 10.2%
TO1ER ERWin 1 2.0%
TO1MW MS word 1 2.0%
TO1RR Rational Rose 1 2.0%
TO1SO Softeam Objecteering Project 1 2.0%
TO1TE Telelogic 1 2.0%
Total 49 100%
F3 Focus group mentions, percentages and comments for phase 2
26Table F5: Mentions and percentages from focus group interviews for phase 2
Code Response Mentions Percent
PH2BC Business case phase 27 41.5%
PH2BA Business analysis phase 20 30.7%
PH2SO Solution specification phase 6 9.2%
PH2BI Business investigation phase 5 7.6%
PH2RE Refinement phase 3 4.6%
PH2CO Costing phase 3 4.6%
PH2BU Budget analysis phase 1 1.5%
Total 65 100%
• “A phase where a business analyst seeks funding for a project and to document what the project will
accomplish and what the benefits will be”.
• “to justify the resources and capital investment necessary to bring a change project to fruition”.

165
• “The business case is the one place where all relevant facts are documented and linked together into a
cohesive story”.
• “This phase describes why the project is needed and how much money, people, and time will be needed
to deliver the solution and realise the benefits”.
• “This phase seeks funding for a project and documents what the project will accomplish and what the
benefits will be”.
• “Confirm that the solution meets the requirements of the business, and is the vehicle for receiving funding
and approval to move forward”.
• “This phase also is useful for management to prioritise this project against the many other initiatives in the
business that may require capital investment”.
20Figure F3: Supporting focus group comments for phase 2
27Table F6: Mentions and percentages from focus group interviews for phase 2 activities
Code Response Mentions Percent
PR2IS Identify solution 36 20.0%
PR2RB Refine boundaries 29 16.1%
PR2CM Collate more information 26 14.4%
PR2AS Analysis of solution 25 13.8%
PR2AD Assumptions and dependencies 25 13.8%
PR2AA As-is analysis 20 11.1%
PR2ERE Recommendations 19 10.5%
Total 180 100%
28Table F7: Mentions and percentages from focus group interviews for phase 2 techniques
Code Response Mentions Percent
TE2CA Criticality analysis 27 13.6%
TE2RR Risk reduction leverage 23 11.6%
TE2FT Fault tree analysis 21 10.6%
TE2WB Work breakdown structure 21 10.6%
TE2CB Cost benefit analysis 20 10.1%
TE2CP Comparative price analysis 20 10.1%
TE2VA Value analysis 18 9.0%
TE2PP Payback period 17 8.5%
TE2NP Net present value 16 8.0%
TE2IR Internal rate of return 15 7.5%
Total 198 100%

166
29Table F8: Mentions and percentages from focus group interviews for phase 2 tools
Code Response Mentions Percent
TO2BT Borland Together 30 54.5%
TO2RR Rational Rose 12 21.8%
TO2TE Telelogic 5 9.0%
TO2VO Visual Object Modelers 2 3.6%
TO2UM UModel 2 3.6%
TO2AV Artiso Visual Case 1 1.8%
TO2MW MS word 1 1.8%
TO2SO Softeam Objecteering Project 1 1.8%
TO2VA Visible Analyst 1 1.8%
Total 55 100%
F4 Focus group mentions, percentages and comments for phase 3
30Table F9: Mentions and percentages from focus group interviews for phase 3
Code Response Mentions Percent
PH3AD Analysis and design phase 26 55.3%
PH3AN Analysis phase 12 25.5%
PH3RE Requirements specification phase 5 10.6%
PH3RA Requirements analysis phase 1 2.1%
PH3SD Solution design phase 1 2.1%
PH3AD Architectural design phase 1 2.1%
PH3BM Business modelling phase 1 2.1%
Total 47 100%
• “This phase involves understanding and specifying in detail what a system should do following a business
case, and then specifying in detail how the parts of a system should be implemented”.
• “Analysis entails understanding the business case requirements of a specific problem and then designing
an appropriate solution for the problem domain based on the requirements from analysis”
• “Systems analysis and design phase is the study of the business system and its problems from the
business case and the specification of a computer or human solution that meets the requirements
determined during systems analysis”.
• “This phase examines existing systems to understand them better. It entails modelling, optimisation,
simulation, and decision-making”.
• “This phase describes how the system will accomplish the tasks in the business case”.
• “This phase makes the business case a reality”.
• “It involves the creation of models and processes to build the solution”.
21Figure F4: Supporting focus group comments for phase 3

167
31Table F10: Mentions and percentages from focus group interviews for phase 3 activities
Code Response Mentions Percent
PR3RE Refinement 30 15.9%
PR3SC Scope 27 14.3%
PR3OW Ownership 26 13.8%
PR3RD Redesign 22 11.7%
PR3DA Detailed analysis 20 10.6%
PR3DS Design of solution 19 10.1%
PR3CM Change management 17 9.0%
PR3MO Modelling 15 7.9%
PR3DS Design signoff 12 6.3%
Total 188 100%
32Table F11: Mentions and percentages from focus group interviews for phase 3 techniques
Code Response Mentions Percent
TE3AA Affinity analysis 27 18.4%
TE4FH Functional Hierarchy decomposition 26 17.8%
TE5MO Modelling 22 15.0%
TE6SI Simulation 20 13.6%
TE7BE Benchmarking 19 13.0%
TE8CO Context analysis 17 11.6%
TE9JA JAD 15 10.2%
Total 146 100%
33Table F12: Mentions and percentages from focus group interviews for phase 3 tools
Code Response Mentions Percent
TO3TE Telelogic 30 50.0%
TO3RP Requisite Pro 12 20.0%
TO3DO DOORS 5 8.3%
TO3CB Cool Biz 3 5.0%
TO3RR Rational Rose 2 3.3%
TO3MW MS word 2 3.3%
TO3UM UModel 1 1.6%
TO3AV Artiso Visual Case 1 1.6%
TO3BT Borland Together 1 1.6%
TO3SO Softeam Objecteering Project 1 1.6%
TO3VI Visio 1 1.6%
TO3VO Visual Object Modelers 1 1.6%
Total 60 100%

168
F5 Focus group mentions, percentages and comments for phase n
34Table F13: Mentions and percentages from focus group interviews for phase n
Code Response Mentions Percent
PH4PI Post-implementation evaluation phase 28 53.8%
PH4SE Solution evaluation 15 28.8%
PH4PO Post-implementation review 6 11.5%
PH4VA Validation phase 1 1.9%
PH4VE Verification phase 1 1.9%
PH4CO Confirmation phase 1 1.9%
Total 52 100%
• “This phase is conducted by reviewing the project's performance against the original business case and
project plans and conformance against these”.
• “The post-implementation phase evaluates the results of the solution against baseline expectations from
the requirements several months after deployment”.
• “to validate project benefits and costs, and documents against the business case”.
• “This phase is conducted after the project has finished and usually after the project team has been
disbanded. It reviews the original business case to the project outcome and assesses if the running costs
are as predicted and if the users like the system”.
• “This phase is conducted after system implementation to enable an organisation to measure the value
gained through the new system”.
• “This phase makes recommendations for business analysis and project management procedures for
future projects in the organisation”.
22Figure F5: Supporting focus group comments for phase n
35Table F14: Mentions and percentages from focus group interviews for phase n activities
Code Response Mentions Percent
PR4RR Review requirements 29 54.7%
PR4RB Review business case 17 32.0%
PR4RO Review objectives 7 13.2%
Total 53 100%
36Table F15: Mentions and percentages from focus group interviews for phase n techniques
Code Response Mentions Percent
TE4TM Traceability matrix 26 59.0%
TE5IN Inspections 12 27.2%
TE6TT Traceability tree 5 11.3%
TE7PR Peer reviews 1 2.2%
Total 44 100%

169
37Table F16: Mentions and percentages from focus group interviews for phase n tools
Code Response Mentions Percent
TO4ID Ideogramic 12 54.5%
TO4TE Telelogic 5 22.7%
TO4RR Rational Rose 3 13.6%
TO4MW MS word 2 9.0%
Total 22 100%

170
Appendix G: Overall results from Individual Interviews and
Focus group Interviews
This appendix presents the findings from both the focus group interviews and is structured as
follows:
• G1 Overall mentions and percentages for phase 1
• G2 Overall mentions and percentages for phase 2;
• G3 Overall mentions and percentages for phase 3; and
• G4 Overall mentions and percentages for phase 4.
G1 Overall mentions and percentages for phase 1
38Table G1: Mentions and percentages of phase 1
Code Phase 1 response Mentions Percent
PH1FE Feasibility phase 66 76%
39Table G2: Mentions from feasibility phase activities
Code Response Mentions
PR1IN Identify need or opportunity 88
PR1DB Define boundaries 59
PR1IG Information gathering 51
PR1OI Opportunity identification 46
PR1OA Opportunity analysis 42
PR1RE Recommendations 29
40Table G3: Mentions from feasibility phase techniques
Code Response Mentions
TE1IN Interviews 88
TE1OB Observations 85
TE1TD Task demonstration 79
TE1DS Document studies 70
TE1QU Questionnaires 64
TE1JA JAD sessions 65
TE1WO Workshops 63
TE1PRO Prototyping 61
TE1IB IBIS 55
TE1SC Scenarios 52
TE1ST Storyboarding 49

171
TE1IN Inspections 46
TE1AI Audits 46
41Table G4: Mentions from feasibility phase tools
Code Response Mentions
TO1VA Visible Analyst 59
TO1CB Cool Biz 17
TO1VI Visio 14
TO1TE Telelogic 10
TO1MW MS word 9
TO1RR Rational Rose 5
TO1SO Softeam Objecteering Project 3
TO1ER ERWin 2
G2 Overall mentions and percentages for phase 2
42Table G5: Mentions and percentages of phase 2
Code Phase 2 response Mentions Percent
PH2BC Business case phase 62 75%
43Table G6: Mentions from business case phase activities
Code Response Mentions
PR2IS Identify solution 89
PR2RB Refine boundaries 74
PR2CM Collate more information 68
PR2AS Analysis of solution 65
PR2AD Assumptions and dependencies 63
PR2AA As-is analysis 52
PR2ERE Recommendations 49
44Table G7: Mentions from business case phase techniques
Code Response Mentions
TE2CA Criticality analysis 80
TE2RR Risk reduction leverage 70
TE2FT Fault tree analysis 64
TE2WB Work breakdown structure 65
TE2CB Cost benefit analysis 63
TE2CP Comparative price analysis 61
TE2VA Value analysis 55
TE2PP Payback period 52

172
TE2NP Net present value 49
TE2IR Internal rate of return 46
45Table G8: Mentions from business case phase tools
Code Response Mentions
TO2BT Borland Together 45
TO2RR Rational Rose 13
TO2TE Telelogic 13
TO2SO Softeam Objecteering Project 11
TO2UM UModel 9
TO2VA Visible Analyst 8
TO2AV Artiso Visual Case 4
TO2MW MS word 3
TO2VO Visual Object Modelers 2
G3 Overall mentions and percentages for phase 3
46Table G9: Mentions and percentages of phase 3
Code Phase 3 response Mentions Percent
PH3AD Analysis and design phase 59 71%
47Table G10: Mentions from analysis and design phase activities
Code Response Mentions
PR3RE Refinement 91
PR3SC Scope 84
PR3OW Ownership 78
PR3RD Redesign 67
PR3DA Detailed analysis 61
PR3DS Design of solution 60
PR3CM Change management 53
PR3MO Modelling 49
PR3DS Design signoff 41
48Table G11: Mentions from analysis and design phase techniques
Code Response Mentions
TE3AA Affinity analysis 84
TE4FH Functional Hierarchy decomposition 78
TE5MO Modelling 67
TE6SI Simulation 61
TE7BE Benchmarking 60

173
TE8CO Context analysis 53
TE9JA JAD 49
49Table G12: Mentions from analysis and design phase tools
Code Response Mentions
TO3TE Telelogic 30
TO3RP Requisite Pro 19
TO3RR Rational Rose 17
TO3CB Cool Biz 11
TO3VI Visio 11
TO3DO DOORS 9
TO3MW MS word 9
TO3UM UModel 3
TO3AV Artiso Visual Case 2
TO3BT Borland Together 1
TO3SO Softeam Objecteering Project 1
TO3VO Visual Object Modelers 1
G4 Overall mentions and percentages for phase 4
50Table G13: Mentions and percentages of phase 4
Code Phase 4 response Mentions Percent
PH4PI Post-implementation evaluation phase 73 89%
51Table G14: Mentions from post-implementation evaluation phase activities
Code Response Mentions
PR4RR Review requirements 78
PR4RB Review business case 45
PR4RO Review objectives 31
52Table G15: Mentions from post-implementation evaluation phase techniques
Code Response Mentions
TE4TM Traceability matrix 63
TE5IN Inspections 36
TE6TT Traceability tree 17
TE7PR Peer reviews 13
53Table G16: Mentions from post-implementation evaluation tools
Code Response Mentions
TO4ID Ideogramic 22

174
TO4TE Telelogic 12
TO4RR Rational Rose 11
TO4MW MS word 9
54Table G17: Cross-tabulation of participants
Code Response
Business
analyst
Project
manager
IS
Manager
CIO
PH1FE Feasibility phase 26% 27% 23% 24%
PH2BC Business case phase 25% 25% 26% 24%
PH3AD Analysis and design phase 24% 27% 27% 22%
PH4PI Post-implementation evaluation phase 26% 23% 27% 24%