9/3/20151 Data in the Classroom CSU Fresno November 1, 2010.
71
03/17/22 03/17/22 1 Data in the Data in the Classroom Classroom CSU Fresno CSU Fresno November 1, 2010 November 1, 2010
-
Upload
louisa-bryant -
Category
Documents
-
view
215 -
download
0
Transcript of 9/3/20151 Data in the Classroom CSU Fresno November 1, 2010.

04/19/2304/19/23 11
Data in the ClassroomData in the ClassroomCSU FresnoCSU Fresno
November 1, 2010November 1, 2010
04/19/2304/19/23 22
PresentersPresenters
John KoreyJohn Korey Cal Poly Pomona, Political ScienceCal Poly Pomona, Political Science [email protected]
Ed NelsonEd Nelson CSU Fresno, SociologyCSU Fresno, Sociology [email protected]

04/19/2304/19/23 33
Workshop AgendaWorkshop Agenda Introductions (Ed Nelson)Introductions (Ed Nelson) SSRIC (Ed)SSRIC (Ed) Data for this workshop (John Korey)Data for this workshop (John Korey) Issues and examplesIssues and examples
Experimental design (John)Experimental design (John) Sampling and Statistical Inference (Ed)Sampling and Statistical Inference (Ed) Causality and contingency tables (Ed and Causality and contingency tables (Ed and
John)John) Fun with graphics (John)Fun with graphics (John) Change over time (John)Change over time (John)
Where can we get the data? (John)Where can we get the data? (John) What are we doing this year at Fresno State? (Ed)What are we doing this year at Fresno State? (Ed) EvaluationsEvaluations

04/19/2304/19/23 44
SSRICSSRICSocial Science Research & Instructional CouncilSocial Science Research & Instructional Council
http://www.ssric.org
04/19/2304/19/23 55
The CouncilThe Council Oldest CSU affinity group -- founded in 1972Oldest CSU affinity group -- founded in 1972 Each campus has a representativeEach campus has a representative Works to provide access to dataWorks to provide access to data Promotes use of data analysis in research Promotes use of data analysis in research
and teachingand teaching

04/19/2304/19/23 66
The CouncilThe Council Annual student research conference on Annual student research conference on
April 29 at San Jose State UniversityApril 29 at San Jose State University Sponsors attendance at the ICPSR summer Sponsors attendance at the ICPSR summer
workshops in Ann Arbor, Michiganworkshops in Ann Arbor, Michigan http://
www.ssric.org/participate/icpsr_summer Works with the Field Institute -- selects faculty Works with the Field Institute -- selects faculty
fellow (12 questions) – proposal due April 15fellow (12 questions) – proposal due April 15
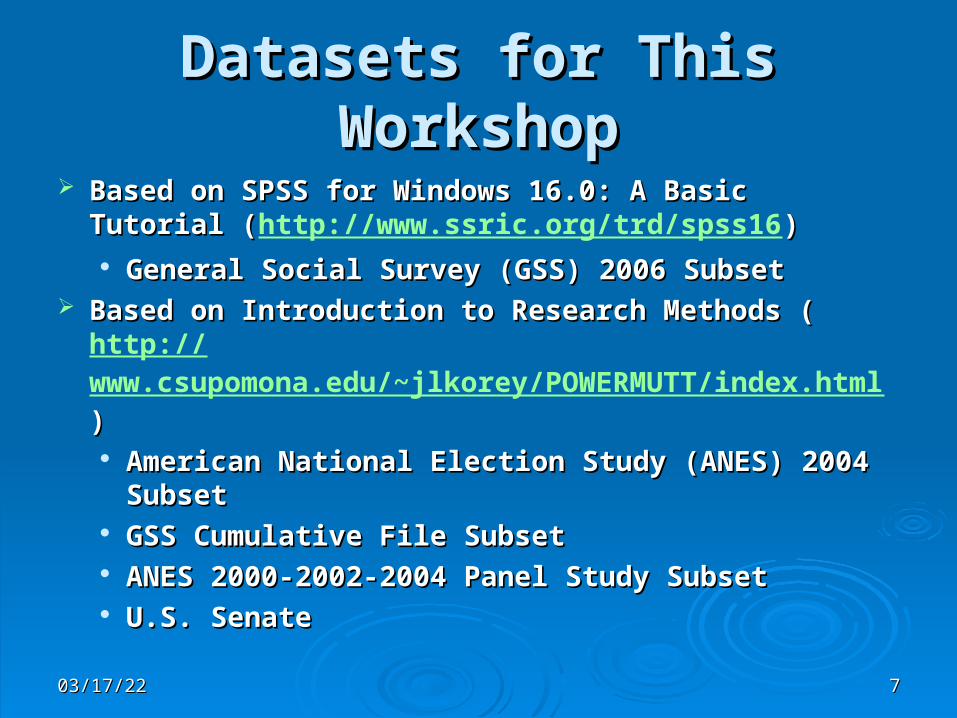
Datasets for This WorkshopDatasets for This Workshop
Based on SPSS for Windows 16.0: A Basic Tutorial (Based on SPSS for Windows 16.0: A Basic Tutorial (http://www.ssric.org/trd/spss16))
General Social Survey (GSS) 2006 SubsetGeneral Social Survey (GSS) 2006 Subset Based on Introduction to Research Methods (Based on Introduction to Research Methods (http://
www.csupomona.edu/~jlkorey/POWERMUTT/index.html) ) American National Election Study (ANES) 2004 American National Election Study (ANES) 2004
SubsetSubset GSS Cumulative File SubsetGSS Cumulative File Subset ANES 2000-2002-2004 Panel Study SubsetANES 2000-2002-2004 Panel Study Subset U.S. SenateU.S. Senate
04/19/2304/19/23 77

04/19/2304/19/23 88
Issues and ExamplesIssues and Examples
Experimental design Experimental design Sampling and statistical inference Sampling and statistical inference Causality and contingency tablesCausality and contingency tables Fun with graphics Fun with graphics Change over time Change over time
04/19/2304/19/23 99
Experimental DesignExperimental Design
04/19/2304/19/23 1010
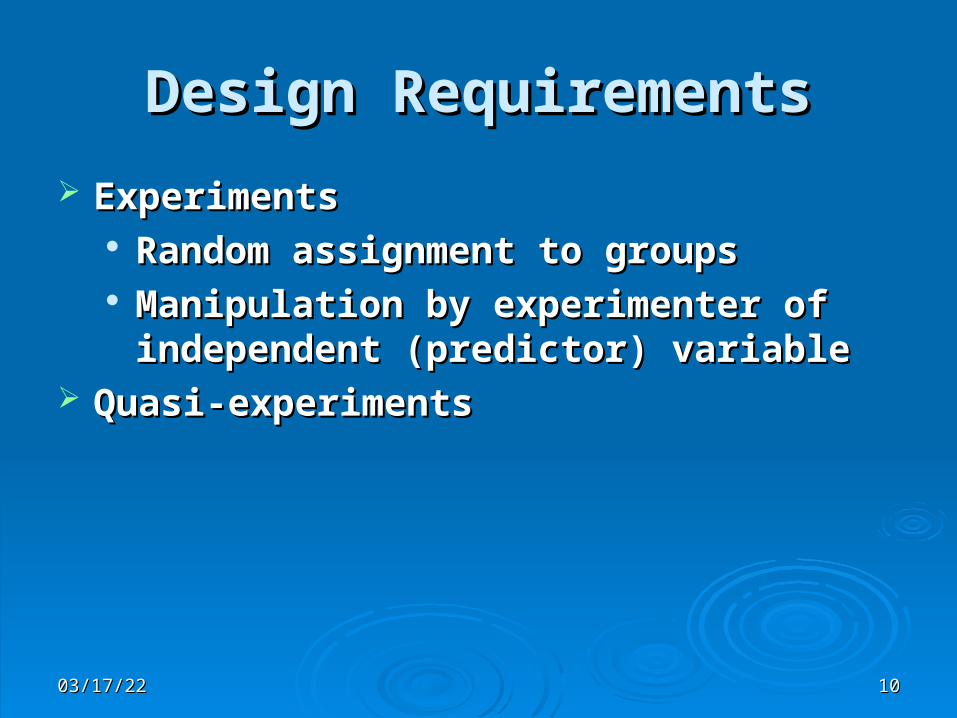
Design RequirementsDesign Requirements
ExperimentsExperiments Random assignment to groupsRandom assignment to groups Manipulation by experimenter of Manipulation by experimenter of
independent (predictor) variableindependent (predictor) variable Quasi-experimentsQuasi-experiments

04/19/2304/19/23 1111
Types of ExperimentsTypes of Experiments
LaboratoryLaboratory FieldField
04/19/2304/19/23 1212
Laboratory Experiment: Laboratory Experiment: Prisoner’s DilemmaPrisoner’s Dilemma
HOMICIDE DIVISIONHOMICIDE DIVISION
INTERROGATION ROOM AINTERROGATION ROOM A
HOMICIDE DIVISIONHOMICIDE DIVISION
INTERROGATION ROOM BINTERROGATION ROOM B
04/19/2304/19/23 1313
Laboratory Experiment: Laboratory Experiment: Prisoner’s DilemmaPrisoner’s Dilemma
INTERROGATION IN PROGRESSINTERROGATION IN PROGRESS
DO NOT ENTERDO NOT ENTER

04/19/2304/19/23 1414
Laboratory Experiment: Laboratory Experiment: Prisoner’s DilemmaPrisoner’s Dilemma
JACK’S BAIL BONDSJACK’S BAIL BONDS
““I’ll get you out if it takes 20 years.”I’ll get you out if it takes 20 years.”
909/869-4619909/869-461924/724/7

04/19/2304/19/23 1515
Laboratory Experiment: Laboratory Experiment: Prisoner’s Dilemma Prisoner’s Dilemma
OutcomesOutcomes
KEY:A'S OUTCOMEB'S OUTCOME
A TALKS A DOESN'T TALK
B TALKS10 YEARS10 YEARS
DEATH1 YEAR
B DOESN’T TALK
1 YEARDEATH
WALKWALK
04/19/2304/19/23 1616
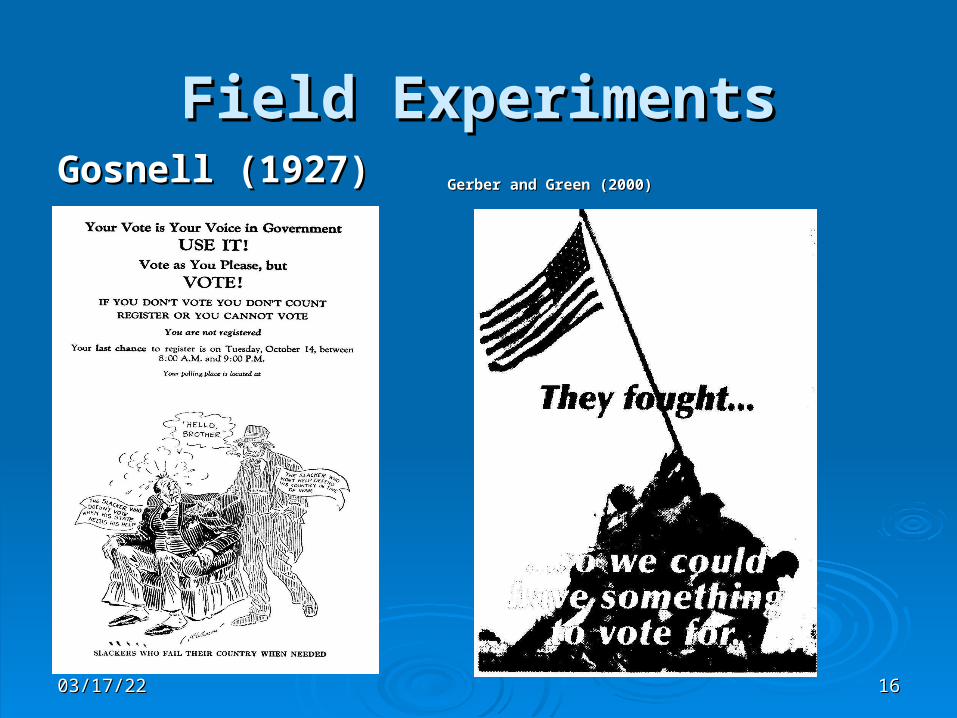
Field ExperimentsField ExperimentsGosnell (1927)Gosnell (1927)
Gerber and Green (2000)Gerber and Green (2000)

04/19/2304/19/23 1717
ResourcesResources
The Center for Experimental Social Science
04/19/2304/19/23 1818
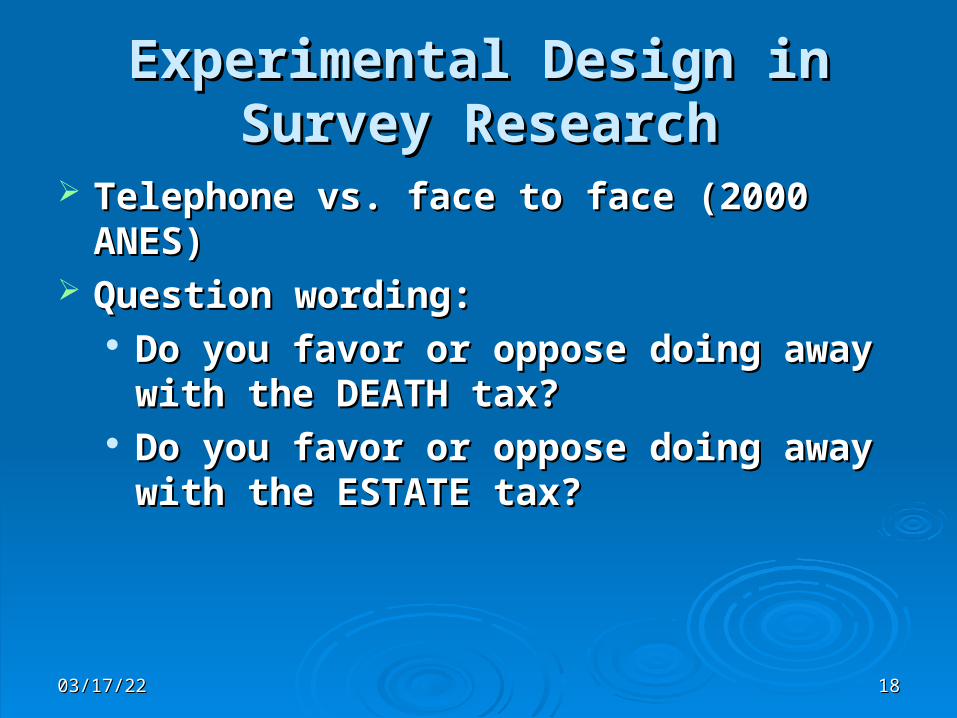
Experimental Design in Survey Experimental Design in Survey ResearchResearch
Telephone vs. face to face (2000 ANES)Telephone vs. face to face (2000 ANES) Question wording: Question wording:
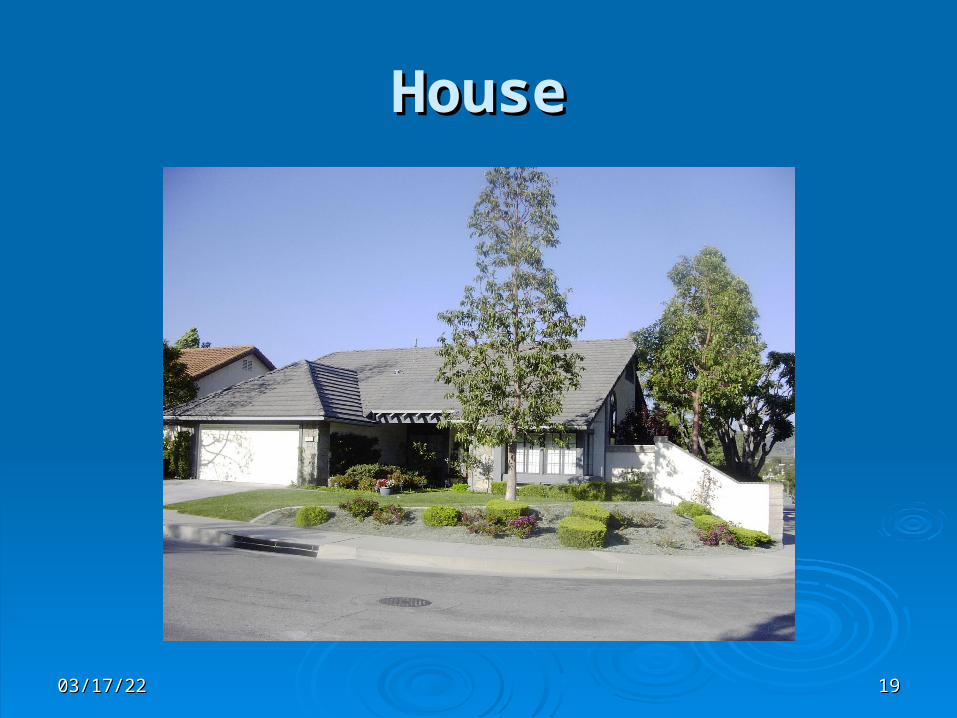
Do you favor or oppose doing away with Do you favor or oppose doing away with the DEATH tax?the DEATH tax?
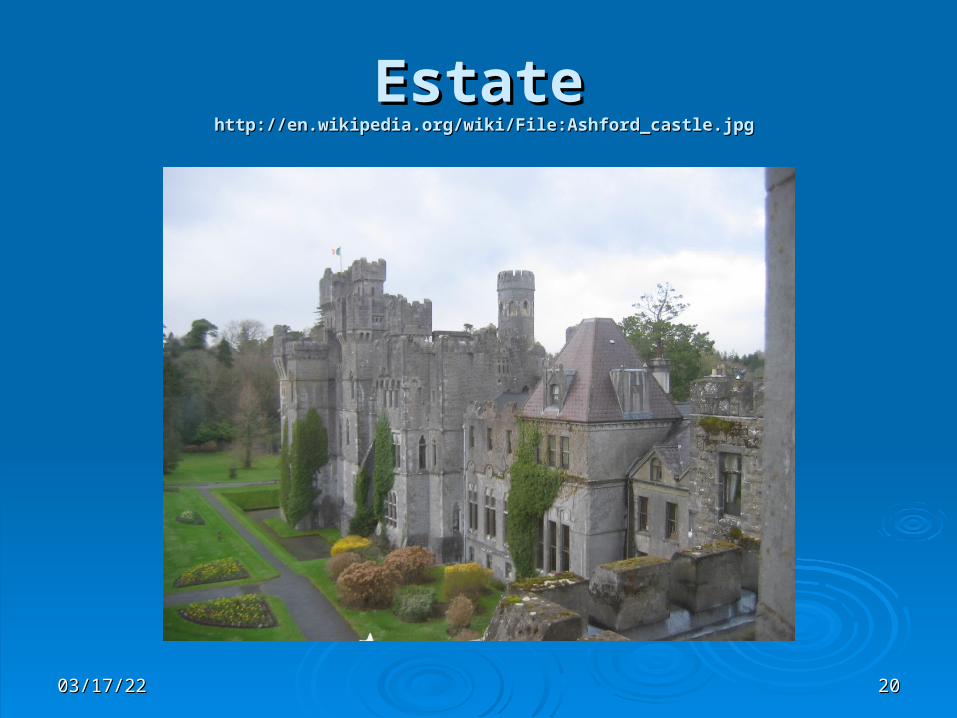
Do you favor or oppose doing away with Do you favor or oppose doing away with the ESTATE tax?the ESTATE tax?
04/19/2304/19/23 1919
HouseHouse
04/19/2304/19/23 2020
EstateEstate http://en.wikipedia.org/wiki/File:Ashford_castle.jpg http://en.wikipedia.org/wiki/File:Ashford_castle.jpg
04/19/2304/19/23 2121
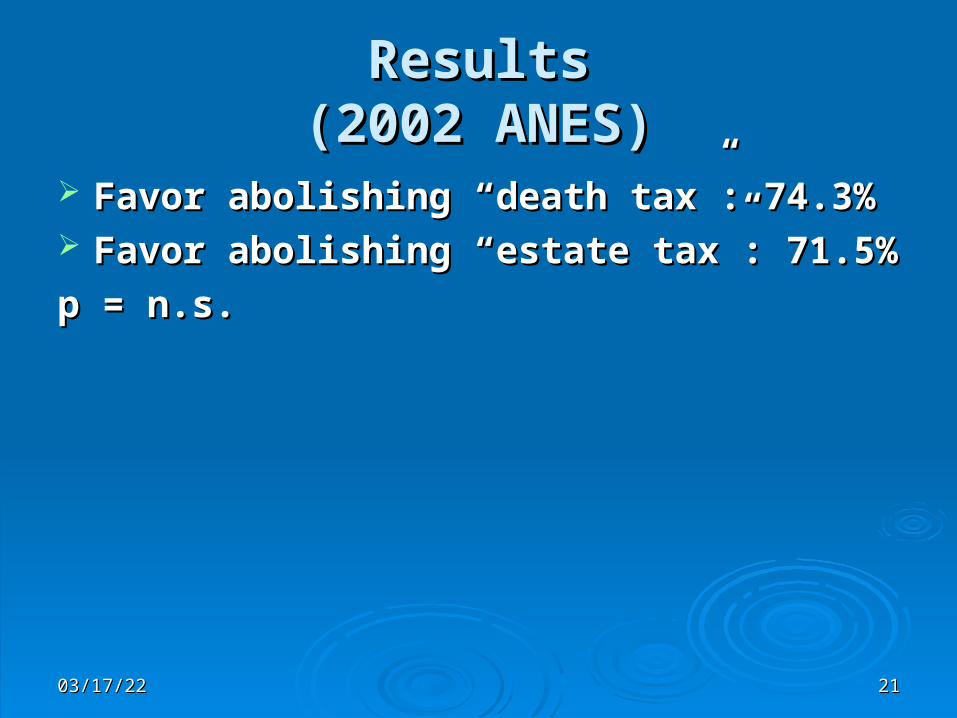
ResultsResults(2002 ANES)(2002 ANES)
Favor abolishing “death tax”: 74.3%Favor abolishing “death tax”: 74.3% Favor abolishing “estate tax”: 71.5%Favor abolishing “estate tax”: 71.5%
p = n.s.p = n.s.

04/19/2304/19/23 2222
Sampling and Statistical Inference
04/19/2304/19/23 2323
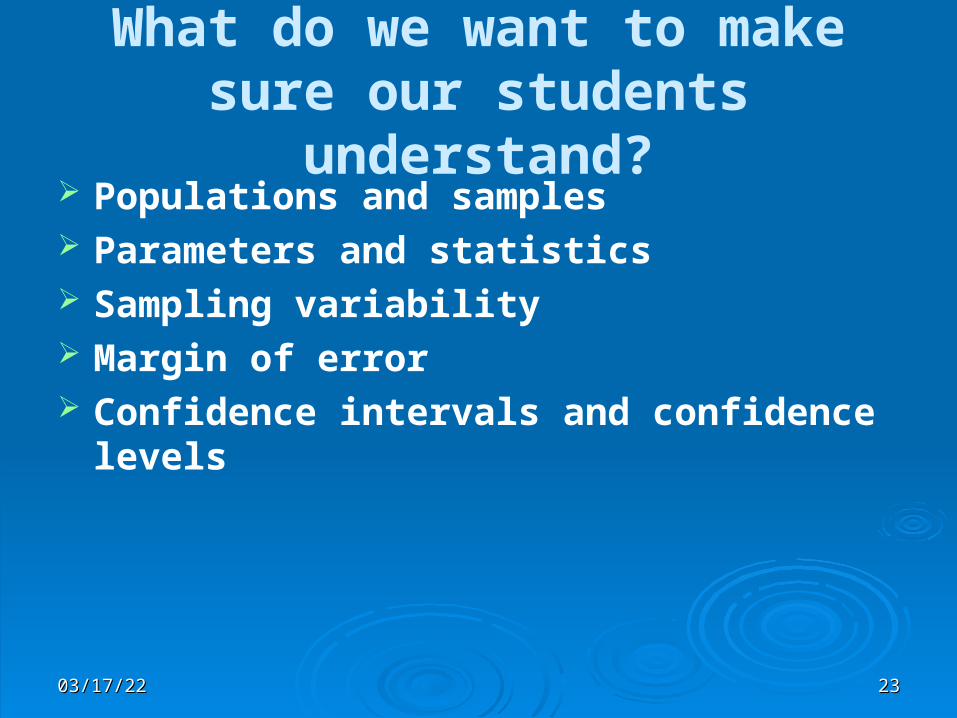
What do we want to make sure our students understand?
Populations and samples Parameters and statistics Sampling variability Margin of error Confidence intervals and confidence levels
04/19/2304/19/23 2424
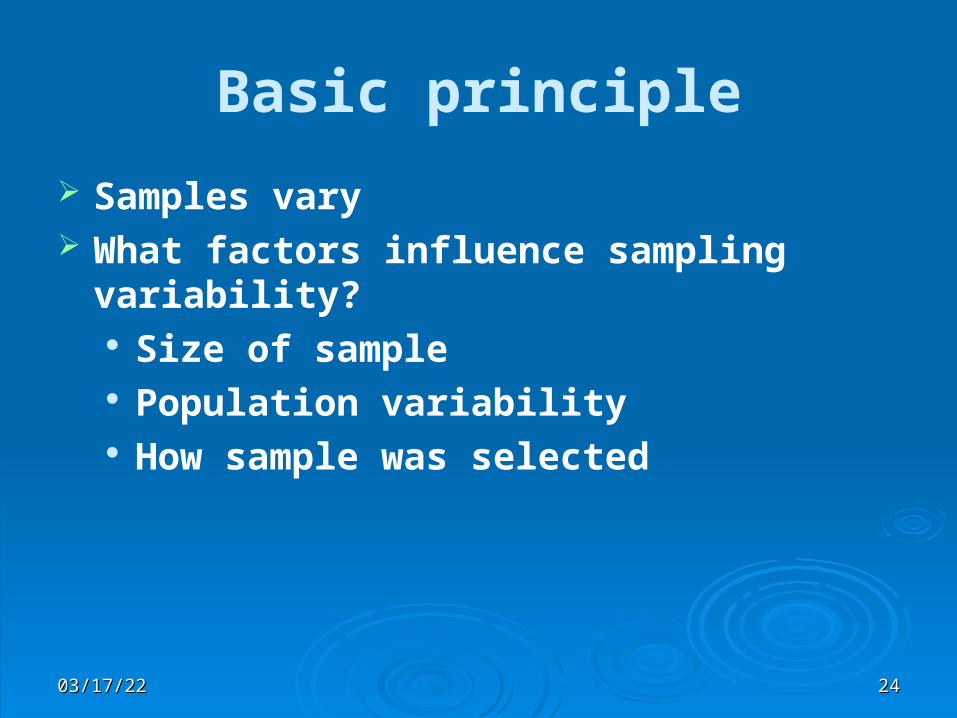
Basic principle
Samples vary What factors influence sampling variability?
Size of sample Population variability How sample was selected
04/19/2304/19/23 2525
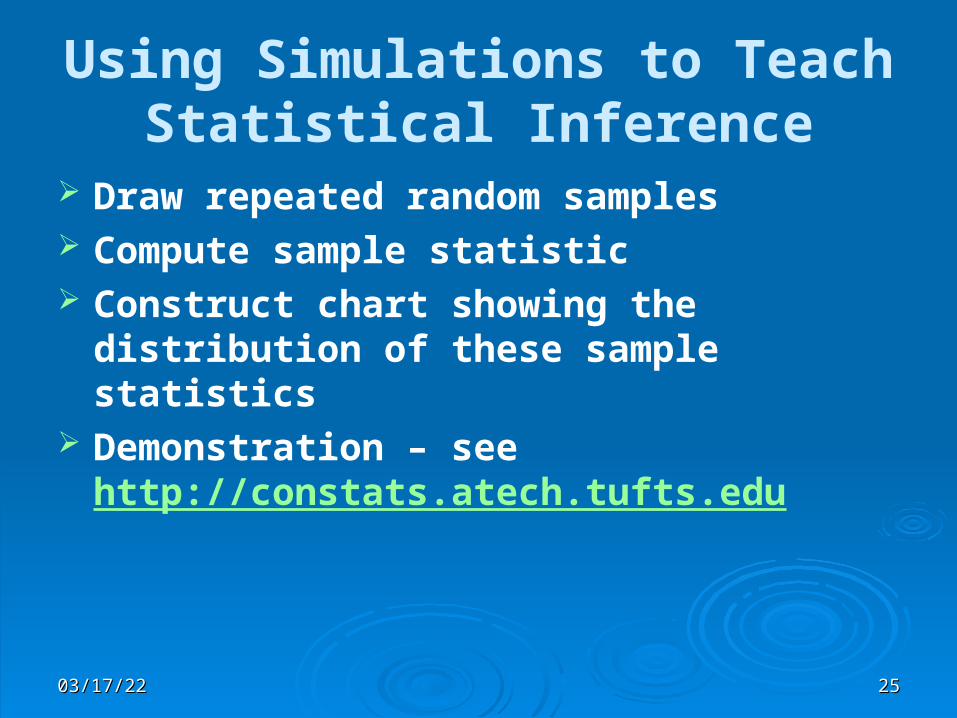
Using Simulations to Teach Statistical Inference
Draw repeated random samples Compute sample statistic Construct chart showing the distribution of
these sample statistics Demonstration – see
http://constats.atech.tufts.edu
04/19/2304/19/23 2626
Estimators and Estimates
An estimator is the method and an estimate is the numerical result
Demonstration – see http://inspire.stat.ucla.edu/unit_09/teaching_tips.php

04/19/2304/19/23 2727
Resources -- Exercises
Rolling dice and flipping coins – see http://www.causeweb.org/repository/StarLibrary/activities/andrews_2003/
M&M’s – see http://www.ropercenter.uconn.edu/education/assignments/polling_basics.pdf
Drawing cards (Aces to Kings) – Xuanning Fu (CSU Fresno)
04/19/2304/19/23 2828
Resources – Web Sites
Roper Center -- Fundamentals of polling: http://www.ropercenter.uconn.edu/education/polling_fundamentals.html
American Association for Public Opinion Research – more on polling -- http://www.aapor.org/Poll_andamp_Survey_FAQs.htm
Sample size calculator -- http://www.surveysystem.com/sscalc.htm

04/19/2304/19/23 2929
Causality and Causality and Contingency TablesContingency Tables
04/19/2304/19/23 3030
What do we need to do to What do we need to do to establish cause and effect?establish cause and effect?
Statistical relationshipStatistical relationship Causal orderingCausal ordering Eliminate alternative explanationsEliminate alternative explanations
04/19/2304/19/23 3131
ExampleExample
Religiosity and how to regulate the Religiosity and how to regulate the distribution of pornography – data set – distribution of pornography – data set – gss06_subset_for_classes_modified2.savgss06_subset_for_classes_modified2.sav RELITEN – how religious the respondent isRELITEN – how religious the respondent is PORNLAW – how the respondent feels PORNLAW – how the respondent feels
about regulating the distribution of about regulating the distribution of pornographypornography
04/19/2304/19/23 3232
SpuriousnessSpuriousness
Are there any alternative explanations (other Are there any alternative explanations (other than the causal one) for the relationship? than the causal one) for the relationship?
Can we think of any alternative explanations for Can we think of any alternative explanations for RELITEN and PORNLAW? RELITEN and PORNLAW?
Gender might account for this relationship. Gender might account for this relationship. Women are more religious than men and also Women are more religious than men and also more likely to want to restrict the distribution of more likely to want to restrict the distribution of pornographypornography
In other words, the relationship between X and Y In other words, the relationship between X and Y might be spurious. So what we need to do is to might be spurious. So what we need to do is to test for spuriousnesstest for spuriousness

04/19/2304/19/23 3333
Testing for SpuriousnessTesting for Spuriousness
Independent variable (X) is RELITENIndependent variable (X) is RELITEN Dependent variable (Y) is PORNLAWDependent variable (Y) is PORNLAW Control variable (C) is SEXControl variable (C) is SEX

04/19/2304/19/23 3434
ConclusionsConclusions
We found out that the relationship of We found out that the relationship of RELITEN and PORNLAW was not spurious RELITEN and PORNLAW was not spurious when we controlled for SEXwhen we controlled for SEX
But does that mean that we can conclude But does that mean that we can conclude that the relationship is never spurious?that the relationship is never spurious?
What does this say about proving causality?What does this say about proving causality?

04/19/2304/19/23 3535
Applying this to the Applying this to the ClassroomClassroom
Start with examples that make sense to Start with examples that make sense to studentsstudents
Move to examples with real data that Move to examples with real data that students can run students can run
Generalize to issues of testing causalityGeneralize to issues of testing causality Can show that a relationship is not causal Can show that a relationship is not causal
(i.e., it’s spurious)(i.e., it’s spurious) Can never prove that a relationship is Can never prove that a relationship is
causal. causal.

04/19/2304/19/23 3636
Example: SpecificationExample: Specification
Open General Social Survey SubsetOpen General Social Survey Subset Does level of education influence the Does level of education influence the
relationship between political views and relationship between political views and party identification?party identification?
04/19/2304/19/23 3737
Specification (continued)Specification (continued)
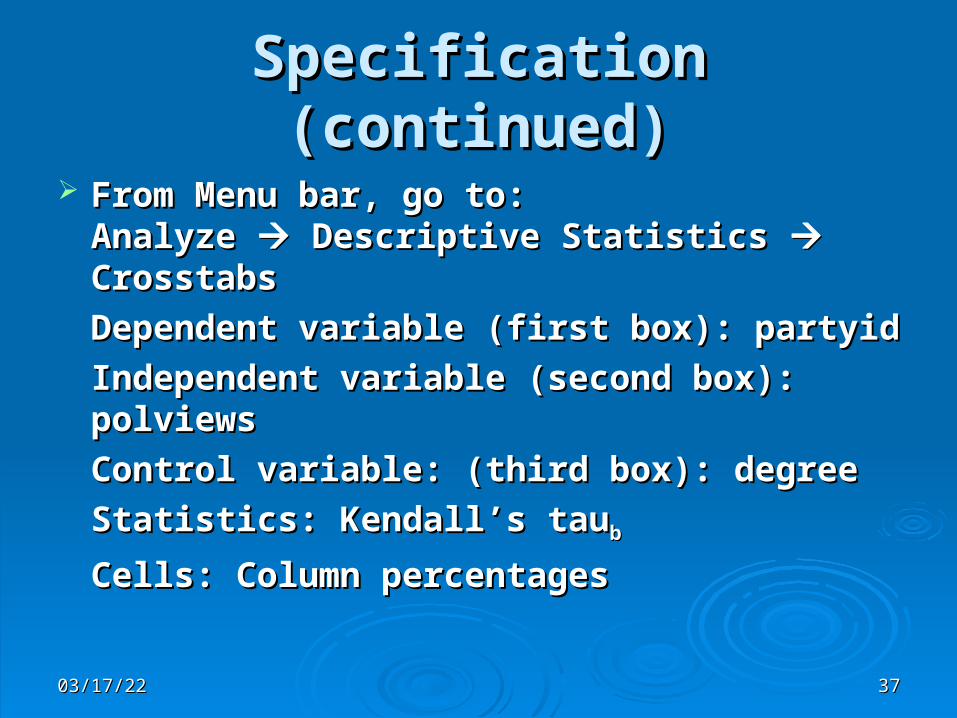
From Menu bar, go to:From Menu bar, go to:Analyze Analyze Descriptive Statistics Descriptive Statistics CrosstabsCrosstabs
Dependent variable (first box): partyidDependent variable (first box): partyid
Independent variable (second box): polviews Independent variable (second box): polviews
Control variable: (third box): degreeControl variable: (third box): degree
Statistics: Kendall’s tauStatistics: Kendall’s taubb
Cells: Column percentagesCells: Column percentages
04/19/2304/19/23 3838
Specification (continued)Specification (continued)
Look at pattern of Kendall’s tauLook at pattern of Kendall’s taubb statistics statistics
04/19/2304/19/23 3939
Example: ReactivityExample: Reactivity
We know that the race of the interviewer in We know that the race of the interviewer in face-to-face interviews affects what people face-to-face interviews affects what people tell us about race tell us about race
We know that the perceived race of the We know that the perceived race of the interviewer in telephone interviews also interviewer in telephone interviews also influences what people tell us influences what people tell us
What about the gender of the interviewer in What about the gender of the interviewer in face-to-face interviews?face-to-face interviews?

04/19/2304/19/23 4040
ANES ExampleANES Example
Open anes04sOpen anes04s We’ll going to use three variablesWe’ll going to use three variables
GENDER – gender of respondentGENDER – gender of respondent INTGENPO – gender of interviewerINTGENPO – gender of interviewer WORKMOM – do you agree or disagree [that a] WORKMOM – do you agree or disagree [that a]
working mother can establish just as warm and working mother can establish just as warm and secure a relationship with her children as a secure a relationship with her children as a mother who does not work?mother who does not work?
Let’s start by using the gender of the interviewer Let’s start by using the gender of the interviewer (INTGENPO) as our independent variable and (INTGENPO) as our independent variable and WORKMOM as our dependent variable WORKMOM as our dependent variable
04/19/2304/19/23 4141
ANES Example ContinuedANES Example Continued What did we discover? Respondents interviewed by What did we discover? Respondents interviewed by
women are more likely to agree that working women are more likely to agree that working mothers can have a warm relationship with their mothers can have a warm relationship with their childrenchildren
Now let’s see if this is true for both male and female Now let’s see if this is true for both male and female respondents. Let’s control for GENDER – gender of respondents. Let’s control for GENDER – gender of the respondentthe respondent
We discover that it is true for both men and women. We discover that it is true for both men and women. It appears that the gender of the interviewer does It appears that the gender of the interviewer does influence what people tell us about working mothers influence what people tell us about working mothers and their childrenand their children
04/19/2304/19/23 4242
ANES Example ImplicationsANES Example Implications
Since about 75% of the interviewers in this Since about 75% of the interviewers in this survey were women, this has some serious survey were women, this has some serious implications. implications.
This suggests that we will overestimate the This suggests that we will overestimate the percent of people that feel that working percent of people that feel that working mothers can have a warm relationship with mothers can have a warm relationship with their childrentheir children

04/19/2304/19/23 4343
Fun with Graphics
04/19/2304/19/23 4444
Box and Whiskers PlotsBox and Whiskers Plots
Open senate file (senate_mod.sav)Open senate file (senate_mod.sav) Compare acu and dwnom scoresCompare acu and dwnom scores
1.1. Graphs Graphs Legacy Dialogs Legacy Dialogs Boxplots Boxplots Clustered Clustered Summarize by Separate Summarize by Separate Variables Variables Define Define
2.2. 1st box: acu, dwnom; 21st box: acu, dwnom; 2ndnd box: party; 3 box: party; 3rdrd box: name; OKbox: name; OK

04/19/2304/19/23 4545
Box and Whiskers Plots Box and Whiskers Plots (continued)(continued)
Convert acu and dwnom to Z scoresConvert acu and dwnom to Z scores
1.1. Analyze Analyze Descriptive Statistics Descriptive Statistics Descriptives Descriptives
2.2. Move acu and dwnom to right windowMove acu and dwnom to right window
3.3. Check Save standardized values as Check Save standardized values as variablesvariables
04/19/2304/19/23 4646
Box and Whiskers Plots Box and Whiskers Plots (continued)(continued)
Compare Zacu and Zdwnom scoresCompare Zacu and Zdwnom scores
1.1. Graphs Graphs Legacy Dialogs Legacy Dialogs Boxplots Boxplots Clustered Clustered Summarize by Separate Summarize by Separate Variables Variables Define Define
2.2. 1st box: Zacu, Zdwnom; 21st box: Zacu, Zdwnom; 2ndnd and 3 and 3rdrd boxes boxes remain the same; OKremain the same; OK
04/19/2304/19/23 4747
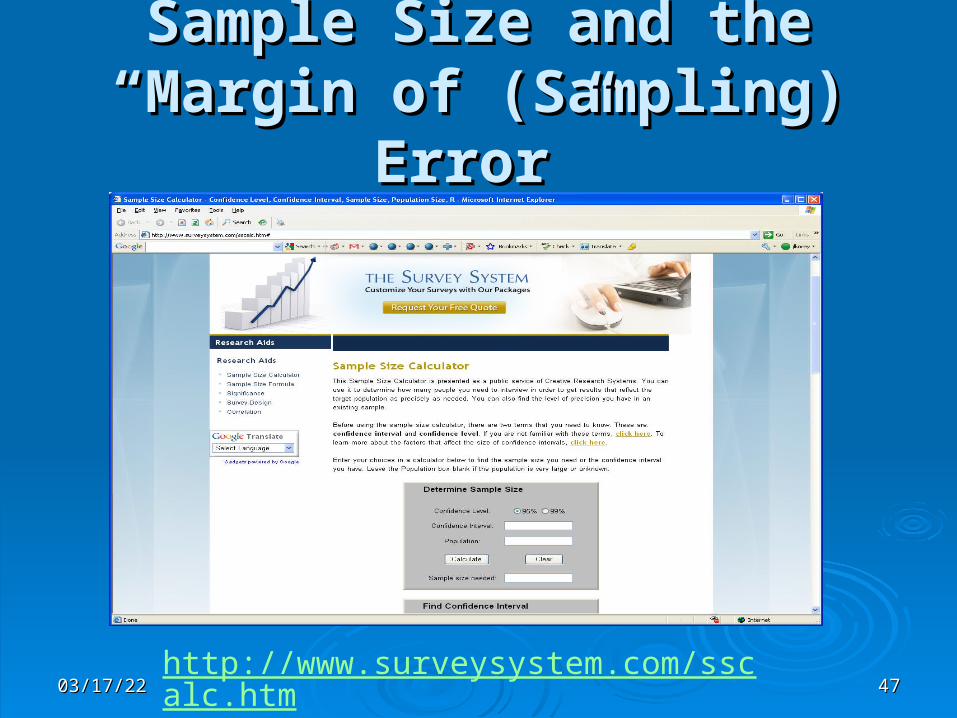
Sample Size and the “Margin Sample Size and the “Margin of (Sampling) Error”of (Sampling) Error”
http://www.surveysystem.com/sscalc.htm

04/19/2304/19/23 4848
Just the FactsJust the Facts
http://pollingreport.com/guns.htm
04/19/2304/19/23 4949
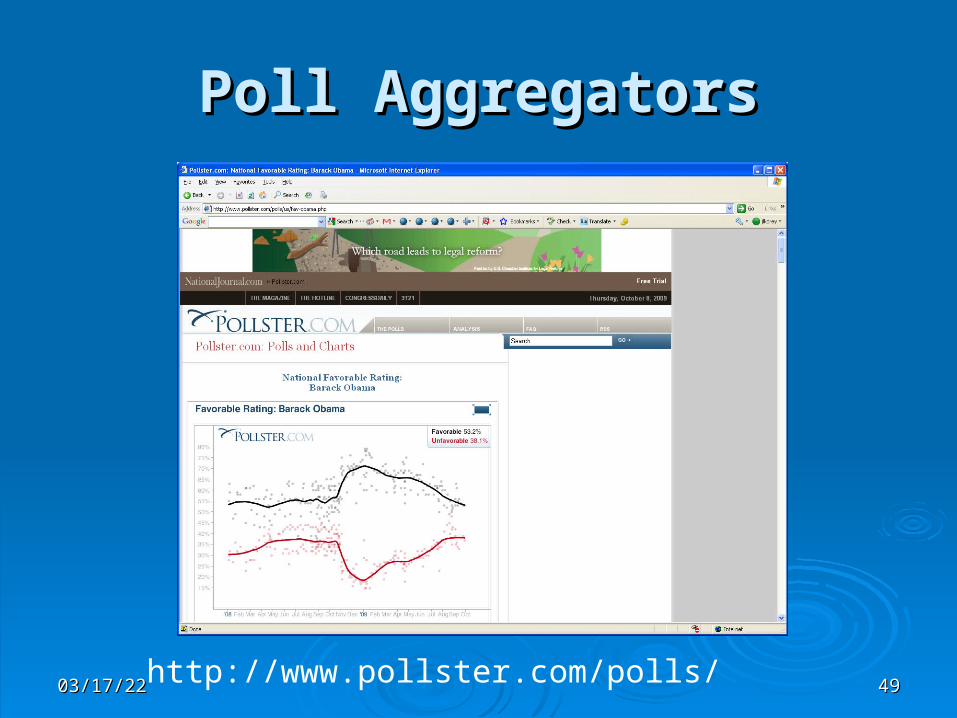
Poll AggregatorsPoll Aggregators
http://www.pollster.com/polls/

Do It Yourself Do It Yourself PrognosticationPrognostication
http://uselectionatlas.org/PRED/http://uselectionatlas.org/PRED/
04/19/2304/19/23 5050
04/19/2304/19/23 5151
ResourcesResources Examples of Assignments (Roper Center)Examples of Assignments (Roper Center) Polling 101: Fundamentals of Polling (Roper Polling 101: Fundamentals of Polling (Roper
Center)Center) Polling 201: Analyzing Surveys (Roper Center)Polling 201: Analyzing Surveys (Roper Center) Polling for DummiesPolling for Dummies Sample size calculator (Creative Research Sample size calculator (Creative Research
Systems)Systems) Sampling Distributions (Tufts)Sampling Distributions (Tufts) Polling and Survey FAQs (AAPOR)Polling and Survey FAQs (AAPOR)
04/19/2304/19/23 5252
Change Over Time
04/19/2304/19/23 5353
ObjectivesObjectives
To explain:To explain:Trend and cohort analysis Trend and cohort analysis (gsscums.sav)(gsscums.sav)Panel studies (anespanl.sav)Panel studies (anespanl.sav)
04/19/2304/19/23 5454
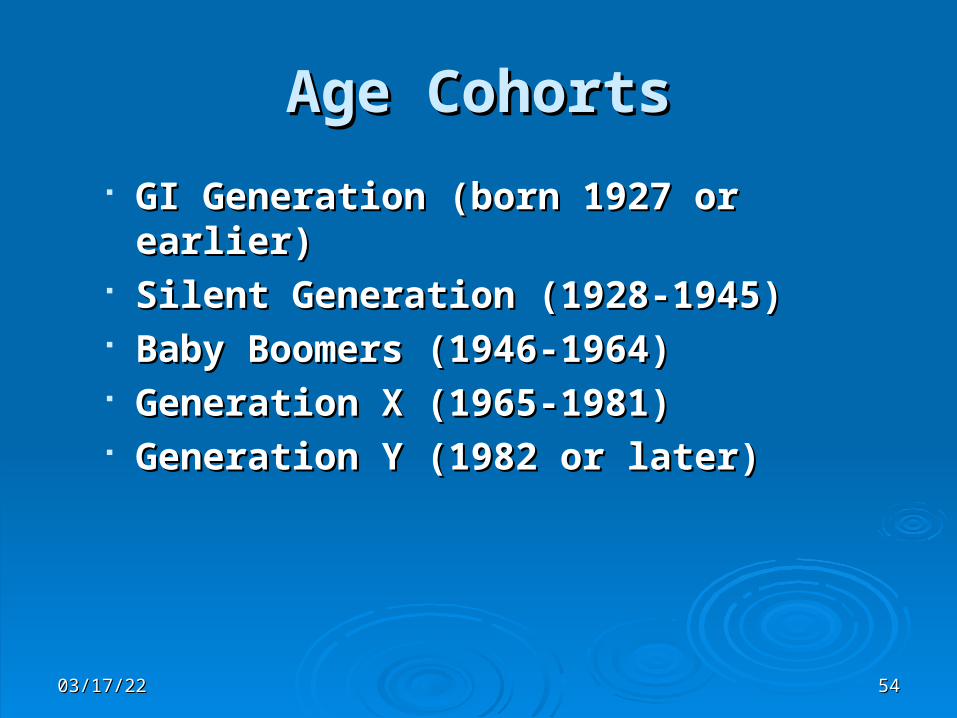
Age CohortsAge Cohorts
GI Generation (born 1927 or earlier)GI Generation (born 1927 or earlier) Silent Generation (1928-1945)Silent Generation (1928-1945) Baby Boomers (1946-1964)Baby Boomers (1946-1964) Generation X (1965-1981)Generation X (1965-1981) Generation Y (1982 or later)Generation Y (1982 or later)
04/19/2304/19/23 5555
ProcedureProcedure
SPSS line chartsSPSS line charts

04/19/2304/19/23 5656
Dependent VariablesDependent Variables
Values recoded into two Values recoded into two categories (0 and 100) as nearly categories (0 and 100) as nearly equal in size as possible. equal in size as possible.
Example: Confidence in press is Example: Confidence in press is recoded as 100 (a lot or only some) recoded as 100 (a lot or only some) and 0 (hardly any or none).and 0 (hardly any or none).
The resulting line graph can be The resulting line graph can be interpreted as the percent of interpreted as the percent of respondents coded as 100, that is, respondents coded as 100, that is, having at least some confidence in having at least some confidence in the press.the press.
04/19/2304/19/23 5757
Trend Analysis: Daily Trend Analysis: Daily Newspaper Readership Newspaper Readership
(Commands)(Commands) Open gsscums.savOpen gsscums.sav Click on Graphs -> Legacy Dialogs -> Click on Graphs -> Legacy Dialogs ->
Interactive -> LineInteractive -> Line Move NEWS to first window on right, and Move NEWS to first window on right, and
YEAR to second window. Click on OKYEAR to second window. Click on OK

04/19/2304/19/23 5858
Trend Analysis: Daily Trend Analysis: Daily Newspaper Readership Newspaper Readership
(Results)(Results)
04/19/2304/19/23 5959
Cohort AnalysisCohort Analysis
To illustrate:To illustrate: Generational replacementGenerational replacement Life cycle patternsLife cycle patterns Across the board changeAcross the board change
04/19/2304/19/23 6060
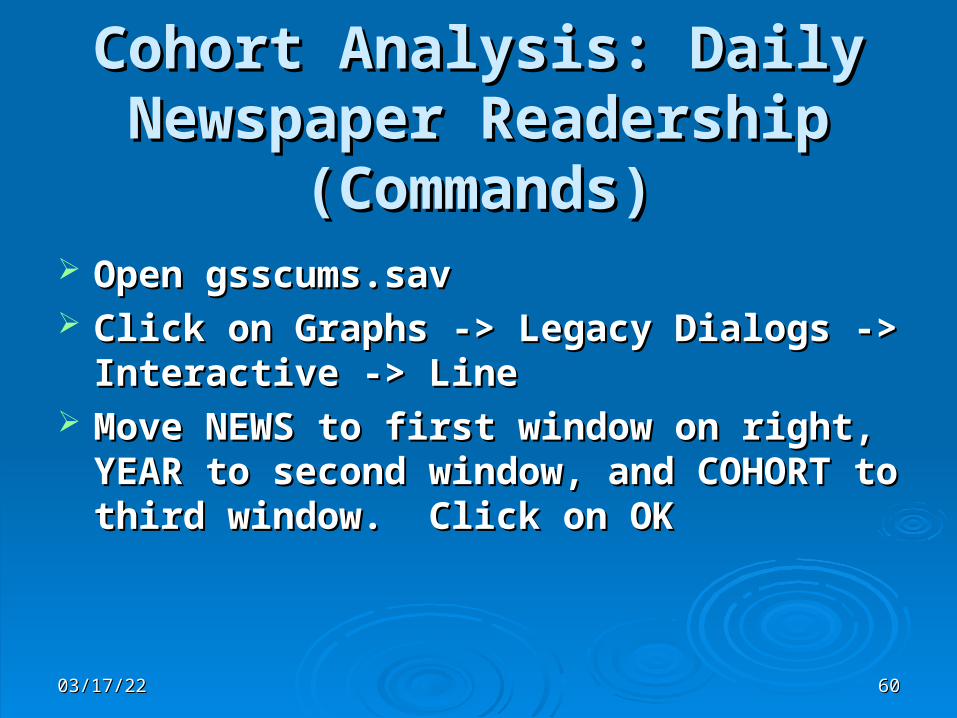
Cohort Analysis: Daily Cohort Analysis: Daily Newspaper Readership Newspaper Readership
(Commands)(Commands) Open gsscums.savOpen gsscums.sav Click on Graphs -> Legacy Dialogs -> Click on Graphs -> Legacy Dialogs ->
Interactive -> LineInteractive -> Line Move NEWS to first window on right, YEAR Move NEWS to first window on right, YEAR
to second window, and COHORT to third to second window, and COHORT to third window. Click on OKwindow. Click on OK

04/19/2304/19/23 6161
Cohort Analysis: Daily Cohort Analysis: Daily Newspaper Readership Newspaper Readership
(Results)(Results)

04/19/2304/19/23 6262
More Cohort AnalysisMore Cohort Analysis
Repeat above commands (first without, then Repeat above commands (first without, then with, COHORT), but instead of NEWS, use with, COHORT), but instead of NEWS, use TVHOURS (over 2 hours per day watching TVHOURS (over 2 hours per day watching TV), then CONPRESS (at least some TV), then CONPRESS (at least some confidence in the press)confidence in the press)
04/19/2304/19/23 6363
Even More Cohort AnalysisEven More Cohort Analysis
Repeat above, but try the following:Repeat above, but try the following: GRASS (favor legalization of marijuana)GRASS (favor legalization of marijuana) RACMAR (oppose interracial marriage)RACMAR (oppose interracial marriage) TRUST (think most people can be trusted)TRUST (think most people can be trusted)
04/19/2304/19/23 6464
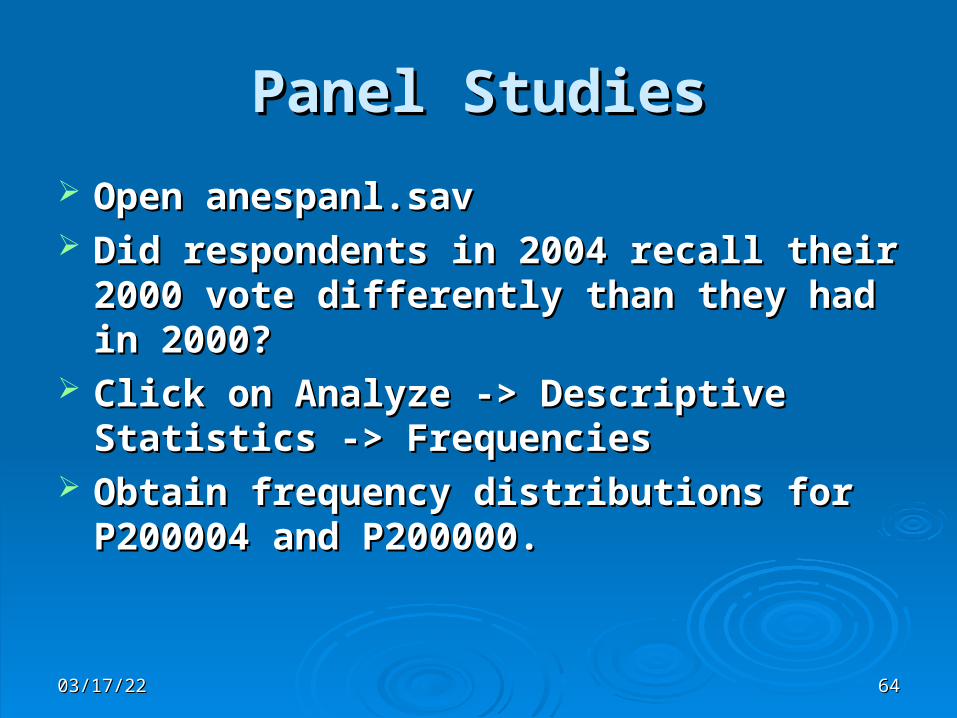
Panel StudiesPanel Studies
Open anespanl.savOpen anespanl.sav Did respondents in 2004 recall their 2000 Did respondents in 2004 recall their 2000
vote differently than they had in 2000? vote differently than they had in 2000? Click on Analyze -> Descriptive Statistics -> Click on Analyze -> Descriptive Statistics ->
FrequenciesFrequencies Obtain frequency distributions for P200004 Obtain frequency distributions for P200004
and P200000.and P200000.
04/19/2304/19/23 6565
Panel StudiesPanel Studies
Did the relationship between party Did the relationship between party identification and feelings about Ralph Nader identification and feelings about Ralph Nader change between 2000 (pre-election) and change between 2000 (pre-election) and 2004?2004?
Click on Analyze -> Compare Means -> Click on Analyze -> Compare Means -> Means.Means.
Move NADR00PR and NADR04 to first Move NADR00PR and NADR04 to first window on right, and PTYID300 to second window on right, and PTYID300 to second window. Click on OK.window. Click on OK.
04/19/2304/19/23 6666
Where Can We Get Data?Where Can We Get Data?
Data resources on or linked from the SSRIC Data resources on or linked from the SSRIC website: website:
http://www.ssric.org/datahttp://www.ssric.org/data
04/19/2304/19/23 6767
Social Science DatabasesSocial Science Databases The California State University subscribes to three data The California State University subscribes to three data
bases to support teaching and research bases to support teaching and research Data basesData bases
Inter-university Consortium for Political and Social Inter-university Consortium for Political and Social Research (ICPSR) at the University of MichiganResearch (ICPSR) at the University of Michigan
Field Poll in San FranciscoField Poll in San Francisco Roper Center for Public Opinion Research at the Roper Center for Public Opinion Research at the
University of Connecticut University of Connecticut General Social Survey and American National Election General Social Survey and American National Election
Studies are available through these databasesStudies are available through these databases These are available to campuses by annual subscriptionThese are available to campuses by annual subscription
04/19/2304/19/23 6868
Proxy ServersProxy Servers On-campus access to data bases is IP On-campus access to data bases is IP
authenticatedauthenticated Off-campus access to ICPSR and Roper Off-campus access to ICPSR and Roper
through your campus’ proxy server through your campus’ proxy server For ICPSR, account only needs to be For ICPSR, account only needs to be
authenticated from on campus or via proxy authenticated from on campus or via proxy server every six months; otherwise, can be server every six months; otherwise, can be accessed from anywhere.accessed from anywhere.
Off-campus access not available for Field dataOff-campus access not available for Field data Another alternative: set up a VPN on your Another alternative: set up a VPN on your
home computerhome computer
04/19/2304/19/23 6969
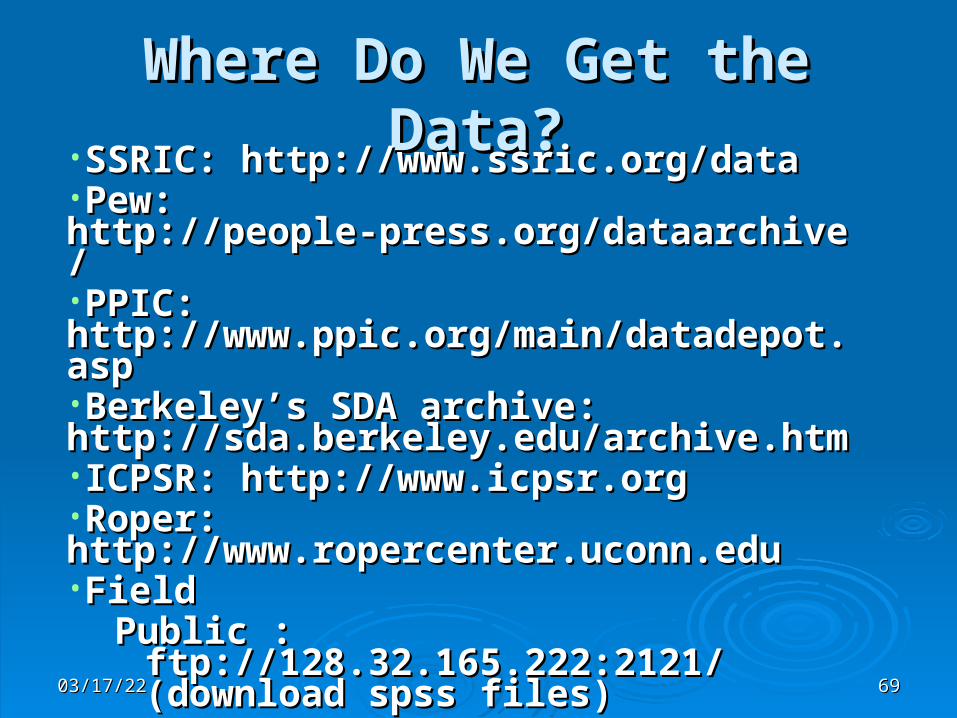
Where Do We Get the Data?Where Do We Get the Data? •SSRIC: http://www.ssric.org/data SSRIC: http://www.ssric.org/data •Pew: http://people-press.org/dataarchive/Pew: http://people-press.org/dataarchive/•PPIC: PPIC: http://www.ppic.org/main/datadepot.asp http://www.ppic.org/main/datadepot.asp •Berkeley’s SDA archive: Berkeley’s SDA archive: http://sda.berkeley.edu/archive.htm http://sda.berkeley.edu/archive.htm •ICPSR: http://www.icpsr.org ICPSR: http://www.icpsr.org •Roper: http://www.ropercenter.uconn.edu Roper: http://www.ropercenter.uconn.edu •Field Field
Public : ftp://128.32.165.222:2121/ Public : ftp://128.32.165.222:2121/ (download spss files) (download spss files)
CSU and UC only ( analyze online): CSU and UC only ( analyze online): http://ucdata.berkeley.edu/data_record.phttp://ucdata.berkeley.edu/data_record.php?recid=3#analyze hp?recid=3#analyze
04/19/2304/19/23 7070
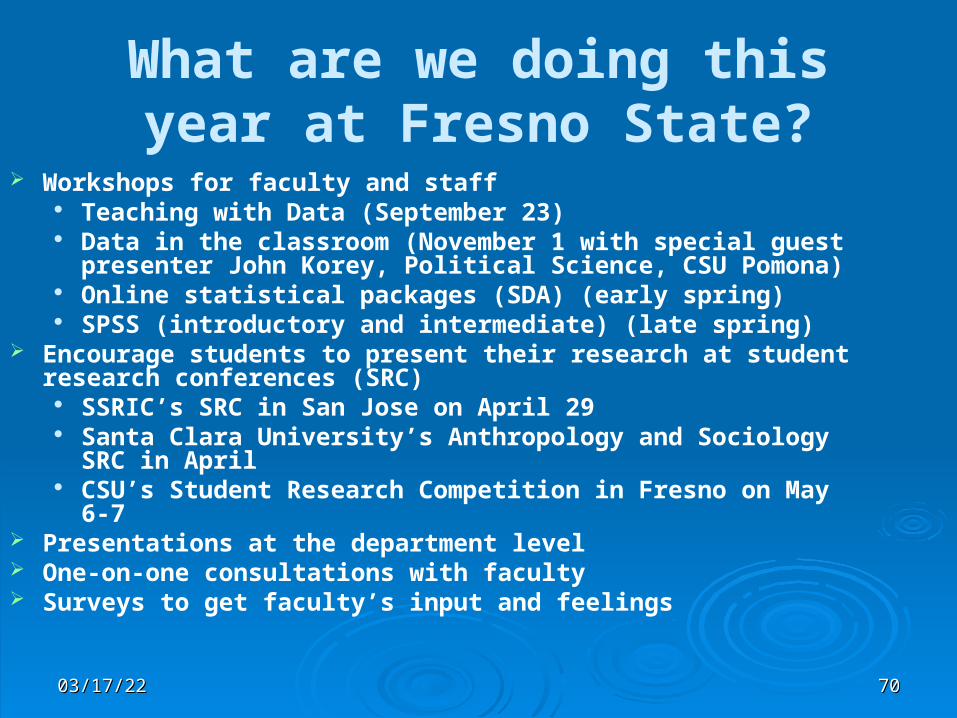
What are we doing this year at Fresno State?
Workshops for faculty and staff Teaching with Data (September 23) Data in the classroom (November 1 with special guest
presenter John Korey, Political Science, CSU Pomona) Online statistical packages (SDA) (early spring) SPSS (introductory and intermediate) (late spring)
Encourage students to present their research at student research conferences (SRC)
SSRIC’s SRC in San Jose on April 29 Santa Clara University’s Anthropology and Sociology SRC
in April CSU’s Student Research Competition in Fresno on May 6-7
Presentations at the department level One-on-one consultations with faculty Surveys to get faculty’s input and feelings

04/19/2304/19/23 7171
EvaluationsEvaluations