
8640 Statistical Review 2014 - · PDF fileUKPIA Statistical Review 2014 ... I welcome the...
48
Statistical Review 2014 Statistical Review 2014 www.ukpia.com
Transcript of 8640 Statistical Review 2014 - · PDF fileUKPIA Statistical Review 2014 ... I welcome the...

Statistical Review2014
Statistical Review 2014
ww
w.ukpia.com
2
About UKPIA
UKPIA Statistical Review 2014
UKPIA represents the non-commercial interests of and speaks for nine companies involved in the UK downstream industry, whose activities cover refi ning, storage and distribution, and marketing of petroleum products.
Our members are:
Associates:

Introduction and Overview
Statistical Review 2014 3
All data is updated as far as possible. Where data is not available the most recent statistics have been used.
Contents
Section Overview Page No
Introduction andOverview
Introduction and overview of UK refi ning. 4
1 EconomicContribution
The refi ning and marketing sector is a major contributor to the UK’s economy. 10
2 Refi neriesThere are seven operational crude oil refi neries inthe UK, which supply the equivalent of 85% of theUK’s oil product demand. 14
3 Road Transport Fuels
Petrol and diesel supply the vast majority of roadtransport energy requirements. 20
4 Biofuels The introduction of biofuels is the biggest changeto road fuels in decades. 23
5 Other Products A wide variety of fuels are produced,and the jet fuel market is expanding. 26
6 Petrol Prices Pre-tax petrol prices in the UK are consistentlyamongst the lowest in Europe. 28
7 Diesel Prices Pre-tax diesel prices in the UK are consistentlyamongst the lowest in Europe. 30
8 Filling Station Stats The number of fi lling stations in the UK is declining; there are now around 8,613. 32
9 Air Quality UK air quality is improving; in part this is due to higher quality fuels and improved vehicle technology. 34
10 Greenhouse Gases
Emissions of carbon dioxide from road transportpre km driven have fallen and the oil industry expects them to continue to fall. 38
11 Process SafetyThe ‘Process Safety Performance Indicators for theRefi ning and Petrochemical Industries’ is one of the key objectives of UKPIA’s commitment to process safety. 40
12 Occupational Health and Safety
The refi ning and marketing sector is oneof the safest industries in the UK. 43

Introduction and Overview
4
Introduction from the Energy Minister
I welcome the publication of UKPIA’s twelfth Annual Statistical Review of the UK oil market, in a year in which signifi cant progress has been made in strengthening the relationship between government, UKPIA and its members.
This government greatly appreciates the work that UKPIA and its members do, and welcomes the contribution that UKPIA made to the recent DECC review of the refi ning and fuel import sectors in the UK. The review provided an insight into the many signifi cant challenges facing the refi ning sector in the UK, and was an important step forward in setting out how industry and government can work together to identify the problems and fi nd the solutions to help ease the pressures on the industry and ensure a resilient fuel supply chain for the future.
The government’s energy security of supply strategy recognises the benefi ts of supply diversity, which is why it is one of the government’s key priorities to ensure a secure and resilient oil supply at affordable prices whilst supporting investment and jobs. The government believes that a mix of domestic refi ning and imports is good for energy resilience and we want to see both continuing to operate in the market.
This government has developed a package of actions, which taken together could help improve the operating environment for the refi ning and import sectors. One of these actions has been the establishment of a new joint government and industry Task Force. Already, work is underway and UKPIA have supported this unreservedly by taking an active role and making a positive contribution.
Of course, there is no single solution and ultimately it will be market forces that will decide what supply confi guration and balance prevails in the UK. This government recognises that there is more to be done, but by working together, industry and government can ensure that the refi ning and imports sectors work effectively and continue to deliver fuel resilience to the UK.
Michael FallonEnergy Minister July 2014
Introduction and Overview
Statistical Review 2014 5
Introduction from the President
I am delighted to be writing the President’s introduction to the UKPIA Statistical Review 2014.
The Review gives an important insight into the facts and fi gures about our downstream oil industry in the UK and it is widely regarded as the go-to source of information and commentary for our sector. As in previous years, I am pleased to acknowledge the work of the DECC (Department of Energy and Climate Change) statistics group, UKPIA’s Secretariat and our member companies for bringing all this data together. Accurate data is essential in business decisions, particularly in the current challenging conditions. This document, therefore, represents an excellent example of government and industry working together to produce a review which is of benefi t to everyone. Looking back at 2013 and the start of 2014, it is fair to say that it has been yet another extremely challenging year for our industry. UK oil refi ning and marketing remains under enormous pressure through a combination of a tough operational climate, structural imbalances in supply/demand and regulatory burden both in the EU and the UK.
It is for this reason that an independent report by IHS Purvin & Gertz was commissioned and published last year. The report, aimed at assessing the role and future oil refi ning and its value to the UK economy, highlighted the serious challenges it faces, which will have implications for the economy and growth both nationally and locally, putting at risk highly skilled jobs and having potentially severe implications upon UK energy supply resilience.
In 2013, the Energy and Climate Change Committee’s inquiry into UK oil refi ning echoed industry’s concerns and called for government action to maintain the health of the UK’s refi ning industry.
Coming on to this year, the Department of Energy and Climate Change has recently published its review into the refi ning and fuel import sectors in the UK. The review highlights the economic benefi t of our indigenous UK industry and identifi es it as a major strategic component of the security and resilience of the nation’s supply of oil products, both now and in the future. The review also commissions a joint government and industry Midstream Oil Task Force to help address some of the serious issues our sector faces.
UKPIA and the industry remain, as ever, willing to work closely with government to help fi nd the best solutions to our future energy challenges. To this end, our industry calls for early, decisive and measurable action from government going forward, especially from the newly established Task Force.
We stand ready to lend our full support and leadership to achieve urgent and quantifi able improvements to the economic wellbeing of our downstream oil industry in the UK.
Finally, I should like to record our thanks for everyone’s continuing contributions to UKPIA committees and for the valuable work of UKPIA generally.
Roy Murray July 2014

Introduction and Overview
6
Processing Crude Oil in a Typical UK Refi nery
Many refi neries in the UK came on stream in the 1950s and 1960s. Since that time they have evolved to meet thegrowing demand for transport fuels and reducing demand for heating and power generation from oil. The composition of fuels has also changed over recent years to reduce the environmental impact of their use. In addition to transport fuels, refi neries produce a wide variety of important feedstocks used in the manufacture of other products, such as petrochemicals, lubricating oils, solvents, bitumen and petroleum coke for aluminium smelting.
No two refi neries are identical. They share common technology such as crude distillation, but each UK refi nery takes a slightly different route to achieve the common goal of extracting maximum value from each barrel of crude oil processed.
Typical refi nery process units
Refi nery operations can be brokendown into fi ve main processes:
• Distillation which separates crude oil into different refi nery streams
• Conversion and reforming which improve the quality of these streams and adjusts the yields to meet market demand
• Desulphurisation which reduces the sulphur in the streams to the required level
• Blending of the refi nery streams to produce the fi nal products meeting current regulations and specifi cations• Waste treatment ensures that all
waste meets current regulations and standards
DistillationThe starting point for all refi neryoperations is the crude distillation unit (CDU). Crude oil is boiled in a distillation column, which separates the crude down into fractions with different boiling points. The crude oil enters the column near the bottom and is heated to around 380°C. The lighter fractions are vaporised and rise up the column. As they rise, they are cooled by a downward fl ow of liquid and condense at different boiling points. This enables fractions with different boiling points to be drawn off at different levels in the column. These fractions range from lighter, low boiling point gases such
as propane and butane to heavier, higher boiling point diesel and gas oil. They are then sent on to other refi nery units for further processing. What is left over at the bottom of the column is a liquid residue, which requires further processing to be turned into more valuable, lighter products or blending components. This residue is fi rst sent to a second stage of fractional distillation in the vacuum distillation unit (VDU). This unit performs the distillation under reduced pressure which allows the distillation of the crude residue at lower temperatures.
CrudeDistillation
UnitCrudeoil
SulphurRecovery
Fuel Gasfor refineryboilers &furnaces
LPG
Unifiner
Merox
VacuumDistillation
Unit
Isomer
Reformer
Fluid CatalyticCracking Unit
TreatingUnits
MeroxIsomerisation
Unit
AlkylationUnitGas
Liq Petroleum GasPetrol componentsKero componentsDiesel componentsFuel oil components
ImportButane
Sulphur
Hydrotreater
Petrol
Kerosene
Derv/Heating oil
Fuel oils
VisbreakerUnit

Introduction and Overview
Statistical Review 2014 7
Using the same approach as beforethe VDU separates into differentcomponents from gas oil to a heavyliquid residue.
The streams from the CDU and VDU are then processed further by the remaining refi nery units to provide the high quality products that consumers expect and that comply with all relevant legislation.
Conversion, Reforming, Desulphurisation andBlending of DifferentStreamsDistillation does not produce enoughof the lighter, more valuable productssuch as petrol that the market wants.Therefore conversion units eg fl uidisedcatalytic cracking (FCC) are used toprocess some of the streams from thevacuum distillation column with the aim of turning the heavy components into lighter transport fuels. Reforming units are used to upgrade the octane of the petrol components produced from the CDU.
Desulphurisation units are then usedto remove sulphur from the products.This enables the products to meettoday’s tighter fuel specifi cations. Extra desulphurisation will be required to allow the refi nery additional fl exibility to process higher sulphur ‘sourer’ crude oils. Reliance on low sulphur crude oils alone limits the fl exibility of a refi nery.
Main ProductsLPG (liquifi ed petroleum gas) is takendirectly from the crude distillation unitand the FCC unit.
Petrol streams from the distillationprocess are cleaned in the unifi ner.This unit strips out excess sulphurand nitrogen compounds as hydrogensulphide and ammonia.
The streams are then sent on to thecatalytic reformer and isomer units forprocessing to raise the octane numberof the petrol by modifying its molecularstructure. The reformer produces a large amount of hydrogen as aby-product, and this is recycled for use in desulphurisation (hydrotreater) units.
Finally the petrol streams from thereformer, fl uidised catalytic crackingunit, the isomerisation unit and thealkylation unit are blended to meet fuelspecifi cations and current regulations.
Jet fuel/kerosene streams fromdistillation are cleaned in the merox unit. This uses a caustic wash and additives to remove sulphur compounds and to inhibit gum formation.
Diesel/heating oil streams areprocessed in the hydrotreater, whichremoves sulphur and other unwantedcompounds using hydrogen and acatalyst. The hydrotreater (desulphuriser) is supplied with recycled hydrogen from other process units such as the reformer. The diesel/heating oil streams are separately blended to meet fuel specifi cations and current regulations.
The lighter fuel oil streams from theVDU are processed in the FCC unitwhilst the heavier residues from the VDU can be processed in the visbreaker.
In the FCC unit, heavy oils are reacted at high temperature with a catalyst which breaks the heavy fractions into more valuable lighter products. The LPG and petrol components are then cleaned in a merox unit and some of the LPG is converted in an isomerisation or alkylation unit into high octane petrol blending components. The FCC’s products areblended into petrol, LPG, diesel/gas oil and fuel oil product streams.
In the visbreaker, the heavy fractionsare held at high temperature until theybecome less viscous. This stream isthen blended into other fuel oil productstreams.
The fuel oil components from thedifferent units are then blended to givefuel oil meeting current regulations and specifi cations.
Desulphurisation and Waste TreatmentThe sulphur recovery unit takes wastehydrogen sulphide from the units which remove sulphur from product streams. The hydrogen sulphide is then reacted with oxygen to give solid elemental sulphur and water vapour. After treatment, this sulphur is sold to other process industries.
All other waste streams are treatedaccording to the current regulations.

Introduction and Overview
8
Refi neries in the UK
The members of UKPIA run the seven major operating refi neries in the UK, which are situated around the coast for ease of crude tanker access. They supply about 85% of the inland market demand for petroleum products. The UK has the fourth largest total refi ning capacity in the EU and some UK refi neries are among the largest in Europe.
Over many years, the refi ning sector has sought to minimise its impacts upon the environment and improvementscontinue to be made to reduce emissions.
Section 2 covers refi ning in more detail, with key fi gures on production, changing product demand and refi nery emissions.
Distribution of ProductsAround 50 major oil terminals are supplied by pipeline (51% of the volume), rail (15%) and sea (34%) from UK refi neries. There is an extensive network of private and Government owned pipelines in the UK, with around 3,000 miles of pipeline currently in use.
The 1500 miles of privately owned UK pipeline network carries a variety of oil products, from road transport fuels to heating oil and aviation fuel. It provides an effi cient and robust distribution system across the UK and directly provides jet fuel for some of the UK’s main airports. It can take several days for fuel to travel from the refi nery to the terminal by pipeline. At the terminal, products are stored in large above-ground tanks and are transported to the fi lling station by road tankers.
The Government also has an oil pipeline system which is largely designed to meet the needs of military airfi elds.
Petroineos Grangemouth
Phillips66 Humber
Total Lindsey Essar Stanlow
ExxonMobil Fawley
Murco Milford Haven
Valero Pembroke

Introduction and Overview
Statistical Review 2014 9
Product DistributionThe UK has a number of oil-company and independently-owned terminal facilities, linked either by pipeline, rail or road.Around a half of all terminals are supplied by pipelines, 15% by rail and around a third by sea.
The south of the country heavily relies on pipelines that connect Fawley, Coryton, Stanlow and Milford Haven, with distribution terminals serving major demand centres. The north tends to be more dependent on road transport withlarge road terminals at Stanlow and on the Humber. Scotland is dependent on supplies from Grangemouth and NorthernIreland on imports delivered to the Belfast port.
Privately owned oil pipelines in England and WalesU.K.O.P. Shell BP Valero Total
ESSO PIPELINE SYSTEM
MAINLINE PIPELINE SYSTEMEsso Valero Total Shell
WALTON GATWICK PIPELINEBP Shell Valero
WEST LONDON PIPELINEBP Shell Valero Total
FINA-LINETotal
PEMBROKE AND MILFORD HAVEN
PURFLEETGATWICK
L.O.R.
STANLOW
NOTTINGHAM
KINGSBURY
BIRMINGHAM
BUNCEFIELD CORYTON/THAMES
AVONMOUTHHEATHROW
FAWLEY
WEST LONDON
MANCHESTER
NORTHAMPTON
INGRESS LOCATIONS: KILLINGHOLME (Total, Phillips 66, BP)
BACKFORD(Shell)
AVONMOUTH
HAMBLE (BP, Esso)
ISLE OF GRAIN (BP, BA)
THAMES HAVEN(BP, Shell, O.I.K.O.S.) WALTON
AVONMOUTH
HAMBLE
RAWCLIFFE
BLACKMOOR
BRAMHALLBACKFORD
HETHERSETT
CLAYDON
ISLE OF GRAIN
SANDY
STANSTED
PURTONTHAMES
HAVEN
KILLINGHOLME
MISTERTON
SAFFRONWALDEN
ALDERMASTON
HALLEN
Government oil pipelines in England and Wales

1. Economic C
ontribution and Refi nery Econom
ics
10
1. Economic Contribution and Refi nery Economics
The UK refi ning industry is one of the largest in Europe, comprising of 7 operating refi neries,
50 terminals and extensive private and government pipelines carrying over 30 million tonnes of fuel each year. The sector has undergone a number of changes over the years. During the 70s and 80s refi ners moved from atmospheric distillation towards the production of gasoline and distillate to take advantage of the changing economic and legislative landscape. And more recently, refi ners have had to increasingly adapt and focus on reducing emissions due to increased environmental legislation and tighter fuel specifi cations, and changing consumer needs with the growth of diesel demand driven partly by fi scal policy.
Despite the strong economic growth seen in the late 90s and early 00s, refi ning margins continued to fall in both the UK and North West Europe as a whole. Increased environmental and energy policy reforms and taxes squeezed the sector further, with rates of return remaining on average below 8% in the period from 1997
to 2012 (graph 1.4). The 2008 credit crisis added to the industry’s continued pressures, from volatile crude prices to increased motor fuel taxation and rise in VAT. Reported margins have shown some signs of recovery since the crisis, but dipped again in 2013 – as shown in graph 1.8.
The oil refi ning and marketing industry plays a very important role in the UK’s economy, supporting the employment over 150,000 people at refi neries, head offi ces, forecourts and as contractors, and supplying over 33% of the primary energy used in the UK from a secure supply base. Over 100 million litres of petrol and diesel are sold in the UK each day to an estimated 4 million customers. Today, our industry collects around £35 billion in fuel duty and VAT each year, which contributes around 5.5% of the Exchequer’s total receipts.
-2,000
-1,000
0
1,000
2,000
3,000
4,000
5,000
1999 2001 2003 2005 2007 2009 2011
Con
tribu
tion
(£m
)
1.1 Contribution to Balance of Payments
● The graph illustrates the value of imports and exports of crude oil and petroleum products
● Oil refi ning has historically been a major contributor to the UK’s balance of payments
● However, the growing demand for diesel and jet fuel has resulted in the UK becoming increasingly reliant on large-scale imports
● Despite the downward trend in product demand in the last few years, imports of diesel have picked up again, increasing by 2.8m tonnes
● Exported oil products, on the other hand, are
heavily dependent on international markets. Most recent trends have seen a decline in exports of petrol, down by approximately 2m tonnes in the last year, and fuel oil has decreased by an estimated 1m tonnes
● Oil products will remain central to the nation’s energy needs for decades to come, alongside a developing role for alternative fuels and energy sources
Contribution to Balance of Payments from Imports and Exports of Petroleum Products
(excluding crude)
Source: DECC

1. Economic C
ontribution and Refi nery Econom
ics
Statistical Review 2014 11
-8%
-6%
-4%
-2%
0%
2%
4%
6%
2000 2002 2004 2006 2008 2010 2012
Product Demand (% Growth) GDP (% Growth)0
5
10
15
20
25
30
94/95 96/97 98/99 00/01 02/03 04/05 06/07 08/09 10/11 12/13
Dut
y (£
bn)
0
20
40
60
80
100
120
1995 1997 1999 2001 2003 2005 2007 2009 2011
Sale
s (£
bn)
1.2 Annual Oil Trade 1.3 Duty from Road Fuels
1.5 Gross Sales
● Oil product demand growth is a key indicator to an economy’s health, and refl ects loosely both cyclical and growth trends
● The impact of the 2008 credit-crisis can clearly be seen by both the GDP and product demand growth curve; they indicate a deep recession in 2008 and another downward trend in 2011
● As economic recovery started picking up in 2013, product demand also followed with gradual growth
● The 2013 Budget estimated fuel duty receipts for 2013/14 at £26.8 billion. The slight increase on the previous year is mainly due to increase in sale of road fuels
● In addition to the duty on road fuels, around £7.7 billion was collected as VAT
● This combined fi gure is around 5.5% of total public sector current receipts and almost equivalent to the country’s total spending on defence
● In 2012, gross sales by UKPIA member companies in the UK were £98.8 billion, including duty
● This represents a slight decline compared to real numbers from the previous year, partly as a result of a decline in sales of petroleum products in 2012
Source: DECC/ONS Source: HM Treasury/HMRC
Source: UKPIA
GDP Growth vs. Oil Product Demand Growth Duty from Road Fuels
Gross Sales
02/03 04/05 06/07 08/09 10/11 11/12 12/13 13/14 Change y/y%
Duty(£bn) 22.10 23.5 23.6 24.6 27.3 26.8 26.6 26.8 0.8%
0
5
10
15
20
25
30
UKPIA Manufacturing Services Upstream OilProduction
RO
CE
(%)
1.4 Average Return on Capital Employed
● The average return on capital employed for period between 1997-2012 was only 7.7% for the downstream oil industry compared to 15.3% average of the other three comparable industries
● Over the same time period, manufacturing industries’ ROCE was 9.9% on average, and that of service industries was 15.4%
● Service industries include communications, hotels, catering, distribution, transport and storage.
Source: UKPIA/Offi ce for National Statistics
1997-2012 Average Return on Capital Employed

12
1. Economic C
ontribution and Refi nery Econom
ics
-
5,000
10,000
15,000
20,000
25,000
1997 2000 2003 2006 2009 2012
Em
ploy
ees
60
70
80
90
1996 1998 2000 2002 2004 2006 2008 2010 2012
% s
hare
of
inla
nd
cons
umpt
ion
1.7 UKPIA Refi nery Share of Inland Consumption
1.6 Refi ning and Marketing Employment
● The refi ning and marketing industry is a major employer in the UK, with around 11,000 people directly employed by UKPIA members in 2012
● The downstream sector as a whole supports the employment of over 150,000* people in other roles, such as service station staff, contractors and road tanker drivers
*The IHS Purvin & Gertz report states a lower number as it does not include service station staff and other personnel
● In 2012, around 85% of inland oil consumption in the UK was supplied by UKPIA member companies
● This provided vital energy resilience and security of supply to the nation along with the provision of high quality fuels at competitive prices
Source: UKPIA Source: UKPIA
Refi ning and Marketing Employment UKPIA Refi nery Share of Inland Consumption
2001 2003 2005 2007 2009 2010 2011 2012 Change y/y%
Consumption 88.3 90.0 91.2 89.7 88.9 85.90 87.60 85.10 -2.9%
0
20
40
60
80
100
120
2003 2004 2005 2006 2007 2008 2009 2010 2011 2012 2013
$/bb
l
European Refining Margins Brent
1.8 Regional Refi ning Margins
● The underlying trend for European refi ning margins over the last decade has been cyclical. However, recent periods have shown more severe and frequent cycles, notably in 2009, 2011 and 2013
● The refi ning margin is the difference between cost of crude purchased and value of product sales and is needed to cover fi xed costs of operators and maintenance, and to remunerate capita
● The Total European Refi ning Margin Indicator (ERMI) is an indicator intended to represent the margin after variable costs for a hypothetical complex refi nery located in Northern Europe that processes a mix of crude oil and other inputs commonly supplied to this region to produce and market the main refi ned products at prevailing prices in this region
European Refi ning Margin Indicator and Price of Brent
Source: Total Ltd ‘European Refi ning Margin Indicator’ (ERMI)

Statistical Review 2014 13
1. Economic C
ontribution and Refi nery Econom
ics
30
35
40
45
50
55
60
Jan Feb Mar Apr May Jun Jul Aug Sep Oct Nov Dec
Penc
e pe
r lit
re
Petrol Diesel Crude Oil
1.9 Crude and Ex-Refi nery Prices
● Wholesale ex-refi nery product prices tracked crude closely throughout 2013
● Crude oil is the main driver for prices of refi ned products such as petrol and diesel and is refl ected in pump prices in the UK and globally
● In recent years, diesel has been more expensive than petrol with the differential narrowing by mid- 2013 but then again widened by the end of year - more signifi cantly then in previous years
● The UK and EU are net importers of diesel, a product for which there is strong global demand
Source: Wood Mackenzie
Prices in 2013
2. Refi neries
2. Refi neries
There are seven major crude oil refi neries operating in the UK, situated around the coast for ease of
crude tanker access. Onwards distribution is achieved via an extensive pipeline system plus road, rail and sea transport.
The UK’s crude feedstock is primarily low sulphur crude from the North Sea, although in recent years there has been an increasing diversifi cation trend. Imported crude accounted for 41% of total processing in 2013, with UK’s dependency on imports set to rise as domestic production declines - almost every year since 1999. Europe is still the largest region from which the UK imports crude oil, with Norway continuing to be the single largest source, whilst Africa now accounts for over 21% of imports – an increase from previous year of 10.5%.
The current economic and legislative climate continues to prove diffi cult for all European refi ners, including those in the UK. The country’s utilisation rate in 2012 improved slightly, increasing to levels above 80% despite previous years’ continued decline. Industry investments have continued in the UK in spite of a challenging economic backdrop, with Total’s Lindsey Refi nery having undertaken one of the largest investments of 2010/11 for a new diesel hydrotreater.
The current economic and fi nancial downturn has also had direct impact on global demand for oil products. Demand in the UK continues to be subdued as a result, combined with the drive to reduce emissions in the transport sector and improved vehicle effi ciency. Total demand for petroleum products was 65.5m tonnes in 2013, down one million tonnes from the previous year.
Petroineos Grangemouth
Phillips66 Humber
Total Lindsey Essar Stanlow
ExxonMobil Fawley
Murco Milford Haven
Valero Pembroke
02468
101214161820
1972 1978 1984 1990 1996 2002 2008 2014Num
ber
of m
ajor
refi
nerie
s
2.1 UK Refi neries 2.2 Number of Refi neries
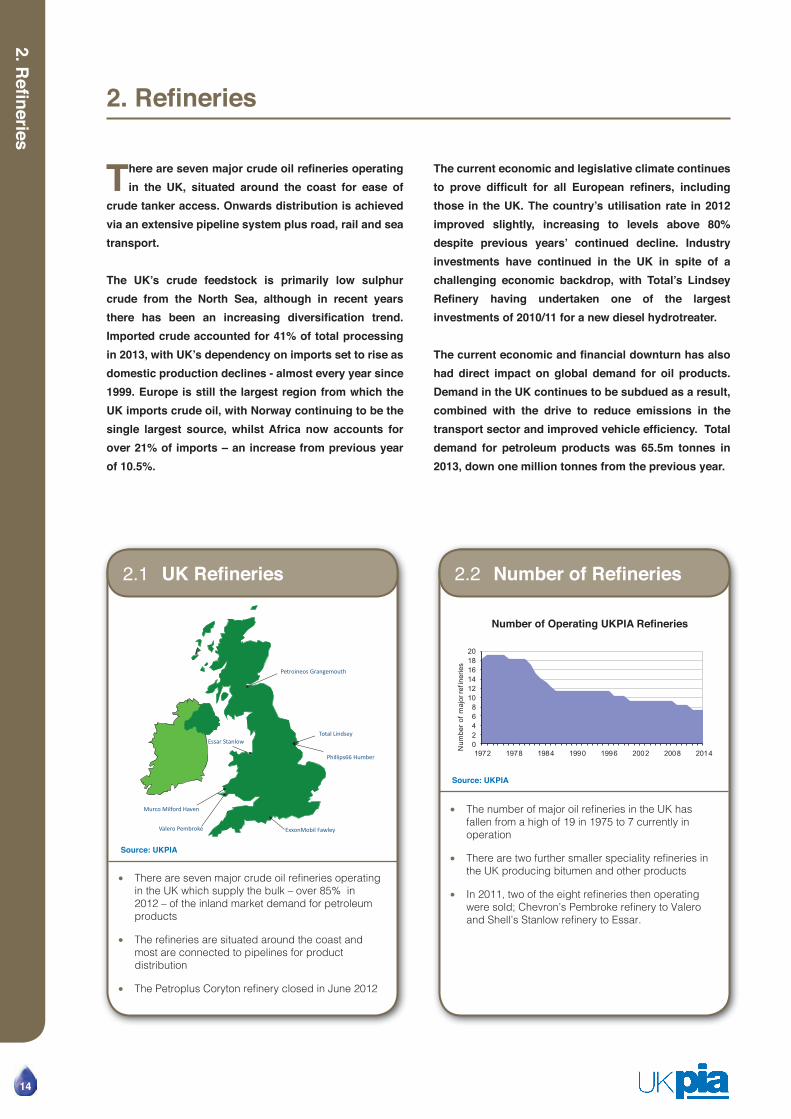
● There are seven major crude oil refi neries operating in the UK which supply the bulk – over 85% in 2012 – of the inland market demand for petroleum products
● The refi neries are situated around the coast and most are connected to pipelines for product distribution
● The Petroplus Coryton refi nery closed in June 2012
● The number of major oil refi neries in the UK has fallen from a high of 19 in 1975 to 7 currently in operation
● There are two further smaller speciality refi neries in the UK producing bitumen and other products
● In 2011, two of the eight refi neries then operating were sold; Chevron’s Pembroke refi nery to Valero and Shell’s Stanlow refi nery to Essar.
Source: UKPIA
Source: UKPIA
14
Number of Operating UKPIA Refi neries
2. Refi neries
0
500
1000
1500
2000
2500
3000
Belgium France Germany Italy Netherlands Spain United Kingdom
Thou
sand
bar
rels
per
day
European Capacity: Comparing years 1996, 2006 & 2012
1996 2006 2012
0
1
2
3
4
5
6
7
8
1982 1986 1990 1994 1998 2002 2006 2010Fue
l use
d as
% o
f th
roug
hput
0
20
40
60
80
100
120
1990 1993 1996 1999 2002 2005 2008 2011
Thro
ughp
ut (
Mte
)
70%
75%
80%
85%
90%
95%
-10,00020,00030,00040,00050,00060,00070,00080,00090,000
2003 2004 2005 2006 2007 2008 2009 2010 2011 2012
Crude processed utilisation rate
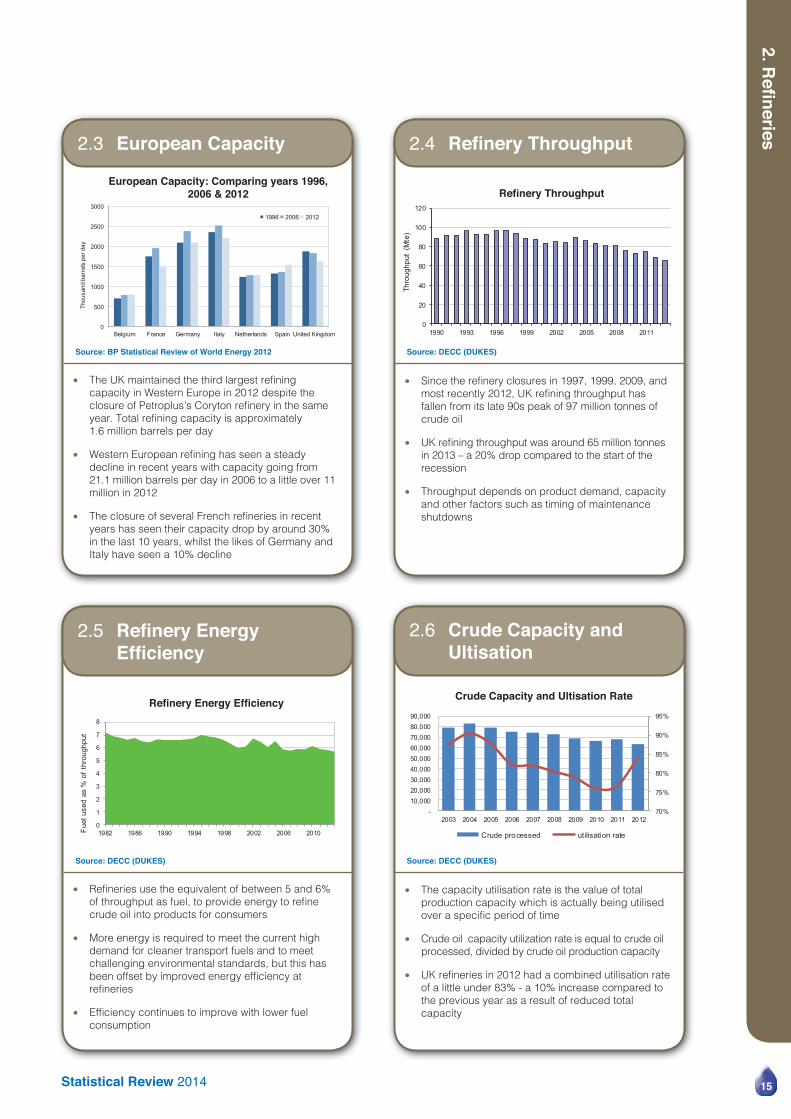
2.3 European Capacity
2.5 Refi nery Energy Effi ciency
2.4 Refi nery Throughput
2.6 Crude Capacity and Ultisation
● The UK maintained the third largest refi ning capacity in Western Europe in 2012 despite the closure of Petroplus’s Coryton refi nery in the same year. Total refi ning capacity is approximately 1.6 million barrels per day
● Western European refi ning has seen a steady decline in recent years with capacity going from 21.1 million barrels per day in 2006 to a little over 11 million in 2012
● The closure of several French refi neries in recent years has seen their capacity drop by around 30% in the last 10 years, whilst the likes of Germany and Italy have seen a 10% decline
● Refi neries use the equivalent of between 5 and 6% of throughput as fuel, to provide energy to refi ne crude oil into products for consumers
● More energy is required to meet the current high demand for cleaner transport fuels and to meet challenging environmental standards, but this has been offset by improved energy effi ciency at refi neries
● Effi ciency continues to improve with lower fuel consumption
● Since the refi nery closures in 1997, 1999, 2009, and most recently 2012, UK refi ning throughput has fallen from its late 90s peak of 97 million tonnes of crude oil
● UK refi ning throughput was around 65 million tonnes in 2013 – a 20% drop compared to the start of the recession
● Throughput depends on product demand, capacity and other factors such as timing of maintenance shutdowns
● The capacity utilisation rate is the value of total production capacity which is actually being utilised over a specifi c period of time
● Crude oil capacity utilization rate is equal to crude oil processed, divided by crude oil production capacity
● UK refi neries in 2012 had a combined utilisation rate of a little under 83% - a 10% increase compared to the previous year as a result of reduced total capacity
Source: BP Statistical Review of World Energy 2012
Source: DECC (DUKES)
Source: DECC (DUKES)
Source: DECC (DUKES)
Statistical Review 2014 15
European Capacity: Comparing years 1996, 2006 & 2012
Refi nery Energy Effi ciency
Refi nery Throughput
Crude Capacity and Ultisation Rate

2. Refi neries
UK
Af rica
Norway
Middle EastRussia
Others
Venezuala
Sources of Crude Oil 2012
Domestic deliv eries
Exports
2.7 Sources of Crude Oil 2.8 Destination of Oil Products
● Around 63% of UK refi nery crude throughput is from the North Sea; around 41% from Norway and 12% from the UKCS
● Currently, around 9.3% of crude oil processed at UK refi neries arrives from Russia, an increase of 50% from the previous years from around 6%. Imports from the Middle East have declined slightly from 1.6% to 1.1% compared to the previous year
● Imports from Africa doubled, increasing from 10.5% to 21% in 2012
● Over 60% of oil products processed at UK refi neries are consumed in the UK market
● The total number of oil products exported out of the UK is slightly higher than the total number of imported products, as the table indicates
● The EU is the main destination for UK oil product exports; the UK is part of a trade triangle with Belgium and the Netherlands. The US, however, is also an important export market - particularly for excess petrol
● There is, however, increasing uncertainty over the future of the UK’s export market as global oversupply narrows down outlet opportunities, particularly in the US; relevant in particular to petrol, where UK’s structural surplus is high
Source: DECC (DUKES)
Source: DECC (DUKES)
16
1,000 tons 2005 2007 2009 2010 2011 2012 Change y/y%Ind. Prod 84,721 76,575 68,199 62,962 51,972 44,561 -14%
Exports 54,099 50,999 45,202 42,196 33,745 33,961 1%Imports 58,885 57,357 60,041 54,587 57,586 60,559 5%
1,000 tons 2008 2009 2010 2011 2012 Change y/y%Exports 28.81 25.75 25.95 27.80 27.08 -2.6%Imports 23.74 22.17 23.67 22.66 25.98 14.7%
Inl. Deliv. 69.91 66.44 65.60 63.70 62.38 -2.1%
3.6
3.4
Petrol
6.1
Diesel
9.1
Fuel OilJet
Net Exports Net Imports
Units: Mte/y
4.4
Gas Oil
2.9 UK Net Product Flows
● These are Net product fl ows; they represent the overall import and export balance of the various grades shown
● UK refi neries, in common with those in the EU, were confi gured to produce petrol and therefore have a mismatch between domestic production and demand
● Fiscal policy in the EU has driven up demand for diesel and demand for air transport has dramatically increased aviation fuel use
● Consequently, the UK has a defi cit of aviation fuel and diesel, whilst exporting surplus petrol and fuel oil
● Imports are key for the jet fuel market as demand is over 1 mmt with UK refi ners supplying only 40% of the market demand
UK Net Product Flows: 2012
Source: PGI report (May 2013 The Role and Future of the UK Refi ning Sector)
Destination of Oil Products 2012

2. Refi neries
Statistical Review 2014 17
-120-100-80-60-40-20
020406080
100120
2002 2004 2006 2008 2010 2012
Qua
ntity
(m te
)
Imports Exports Balance
0
5
10
15
20
25
30
Petrol Gas Oil/Diesel
Jet Fuel Fuel Oil PetroleumGases
BurningOil
Others
Dem
and
(Mte
)
0
5
10
15
20
25
30
Petrol Gas Oil/Diesel
Jet Fuel Fuel Oil Petr.Gases
BurningOil
Others
Prod
uctio
n (M
te)
0
10
20
30
40
50
60
70
80
90
1977 1981 1985 1989 1993 1997 2001 2005 2009 2013p
UK
prod
uctio
n M
te
Fuel Oil Gas Oil/ Diesel Jet Petrol
2.10 Annual Oil Trade
2.12 Product Demand
2.11 Products Produced
2.13 Changes in Refi nery Production
● The chart illustrates UK’s annual trade; imports and exports of crude oil and petroleum products
● The negative imbalance in trade from 2006 has largely been a result of increased imports and a decrease in exports of crude oil; a consequence of depletion of the UK continental shelf
● The petroleum products balance has also shifted: both diesel and aviation fuel demand have driven an increase in imports, whilst fuel oil exports have declined and motor spirits increased
● The majority of oil product demand comes from the transport sector
● UK refi neries do not produce enough jet fuel or diesel, consequently these are increasingly supplemented by imports to meet demand
● UK refi neries are confi gured to meet historically higher demand for petrol and fuel oil
● As a result of reducing demand, refi neries now produce an excess of these products and are in defi cit in others, such as jet fuel and diesel
● Changing refi nery production to meet demand will require major investment
● See UKPIA’s paper “Fuelling the UK’s future – the role of our refi ning and downstream oil industry” for more information and the HIS Purvin & Gertz report ‘The Role and Future of the UK Refi ning Sector’ published in May 2013
● The major change in refi nery production over the last forty years has been a signifi cant reduction in the quantity of fuel oil produced
● The increase in gas oil/diesel and petrol seen in the 80s and 90s has since levelled off
● Over the same period, some of the surplus fuel oil has been converted into petrol and gas oil/diesel or exported
Source: DECC (DUKES)
Source: DECC (DUKES - provisional data)
Source: DECC (DUKES - provisional data)
Source: DECC (DUKES))
Annual Oil Trade 2000 to 2012Products Produced 2013
Product Demand 2013

2. Refi neries
18
0
10
20
30
40
50
60
70
80
90
1977 1980 1983 1986 1989 1992 1995 1998 2001 2004 2007 2010 2013p
UK
sale
s M
te
Fuel Oil Gas Oil/Diesel Jet Petrol
0
60
120
180
240
1976 1980 1984 1988 1992 1996 2000 2004 2008 2012
Emis
sion
s (K
te)
0
5
10
15
20
25
30
1992 1994 1996 1998 2000 2002 2004 2006 2008 2010 2012
Em
issi
ons
(Mte
)
0
10
20
30
40
50
1976 1980 1984 1988 1992 1996 2000 2004 2008 2012
Em
issi
ons
(Kte
)
2.14 Changes in Product Demand
2.16 Refi nery SO2 Emissions
2.15 Refi nery CO2 Emissions
2.17 Refi nery NOx Emissions
● The major change in product demand since 1979 has been the decline of the fuel oil market - natural gas replacing fuel oil for power generation and gas oil for space heating - and the growth of transport fuels
● Since 1990 the demand for petrol has almost halved, whilst jet fuel has seen demand rise by over 60%
● However, overall demand clearly shows a downward trend in the last fi ve years, linked in part to the economic crisis, which has affected nearly all categories of oil product consumption, except diesel which has remained almost fl at
● Refi neries release SO2 when sulphur, naturally present in crude oil, is burnt
● Refi nery SO2 emissions have fallen by 75% since 1970, to around 49 thousand tonnes in 2012
● This is due to investment to increase sulphur recovery at refi neries and the use of low sulphur North Sea crude oil
● Although there have been slight increases in recent years due to the use of higher sulphur crude oils, further reductions are planned
● Refi neries emit around 3% of the UK’s CO2 emissions and are included in the EU Emissions Trading Scheme
● Although it takes more energy to supply an increased demand for transport fuels, particularly low sulphur fuels, refi nery CO2 emissions have fallen since 1970 as a result of improved energy effi ciency and refi nery closures
● CO2 emissions decreased in 2012 by around 9% compared to the previous year
● NOx is formed as a result of the combustion of fossil fuels, and hence is produced at refi neries
● Refi nery NOx emissions have fallen by almost half since 1990 to around 19 thousand tonnes
● This is due to the installation of abatement technology at refi neries
Source: DECC (DUKES)
Source: DEFRA
Source: DECC (GHG Emissions)
Source: DEFRA

2. Refi neries
Statistical Review 2014 19
0
50
100
150
200
250
1982 1986 1990 1994 1998 2002 2006 2010
Em
issi
ons
(kto
nnes
)
Refining/Storage VOC Emissions Distribut ion of oil products VOC emissions
2.18 Downstream VOC Emissions
● Volatile organic compounds are produced from the evaporation of oil products
● Since 1990, refi nery and storage emissions have fallen by over 75%, to around 24 thousand tonnes due to leak detection and repair programmes
● Additional reductions in the downstream industry are due to the introduction of vapour recovery equipment at storage facilities, on petrol deliveries and at many of the higher throughput fi lling stations
● Emissions from distribution have reduced by 45% since 1970 or 5% y/y in 2012
Source: DEFRA

3. Road Transport Fuels
20
3. Road Transport Fuels
Total road transport demand last year was down for a fi fth consecutive year, bringing total decline by 12%
since 2007. This is linked in part to the downturn, which has hit nearly all categories of oil product consumption, as well as higher oil prices and improved vehicle effi ciency.
The road transport sector, prior to the recession, was growing at a steady rate, with increases in diesel use offsetting weaker petrol demand.
The increase in diesel sales is part of a Europe-wide trend, which has largely been fi scally driven for over two decades. The UK on the other hand has been comparatively late to the dieselisation process; in 2004,
petrol sales where 4 billion litres greater than those of diesel, whilst annual registration of new diesel vehicles was still only one third of the total vehicle fl eet. A key reason for this relatively slow uptake had been the lack of any tax advantage for diesel, which is taxed at the same rate as petrol. However, with the advances achieved in diesel engine performance leading to improved fuel effi ciency relative to petrol, combined with changes in company car personal tax policy and VED rates, consumers in recent years have increasingly favoured diesel cars. Today, 49% of new registered vehicles in the UK are diesel fuelled (up from 48.7% in 2013), and over 61% of the 43.4 billion litres of road fuels sold last year was diesel.
300
350
400
450
500
550
600
650
700
1995 2000 2005 2010 2015 2020 2025 2030 2035
Bill
ion
km d
rive
n
historic data low demand central high demand
Petrol
Diesel
0
10
20
30
40
50
60
1987 1991 1995 1999 2003 2007 2011
Tota
l sal
es b
illio
n lit
res
3.1 Demand for Road Travel 3.2 Road Fuel Sales
Source: DECC
Total Road Fuel SalesCentral, High and Low 2035 Traffi c Forcasts, England
● Road travel demand has been on an upward trend for decades and, despite a fl attening in growth during the recession, demand is forecast to increase in the future
● However, due to advances in engine effi ciency, this trend is not refl ected in product demand
● By 2035, central demand is predicted to have grown by over 66% from 1995 levels
Source: DfT (DfT Road Transport Forecast 2011)
● Whilst total road fuel sales have shown a long term increase since the early 1970s, they dropped by 12% between 2007 and 2013 due to a combination of higher prices - driven by cost of crude oil - and the economic recession
● In 2013 diesel sales alone increased by 2% whilst demand for petrol continued to decline by 5% year on year
● Share between petrol and diesel continues to shift in favour of diesel, which in 2013 accounted for over 60% of total fuel sales
● This is the result of an increased proportion of diesel vehicles
3. Road Transport Fuels
Statistical Review 2014 21
0
5
10
15
20
25
30
35
1977 1983 1989 1995 2001 2007 2013p
Tota
l sal
es (
billi
on li
tres)
3.3 Petrol Sales
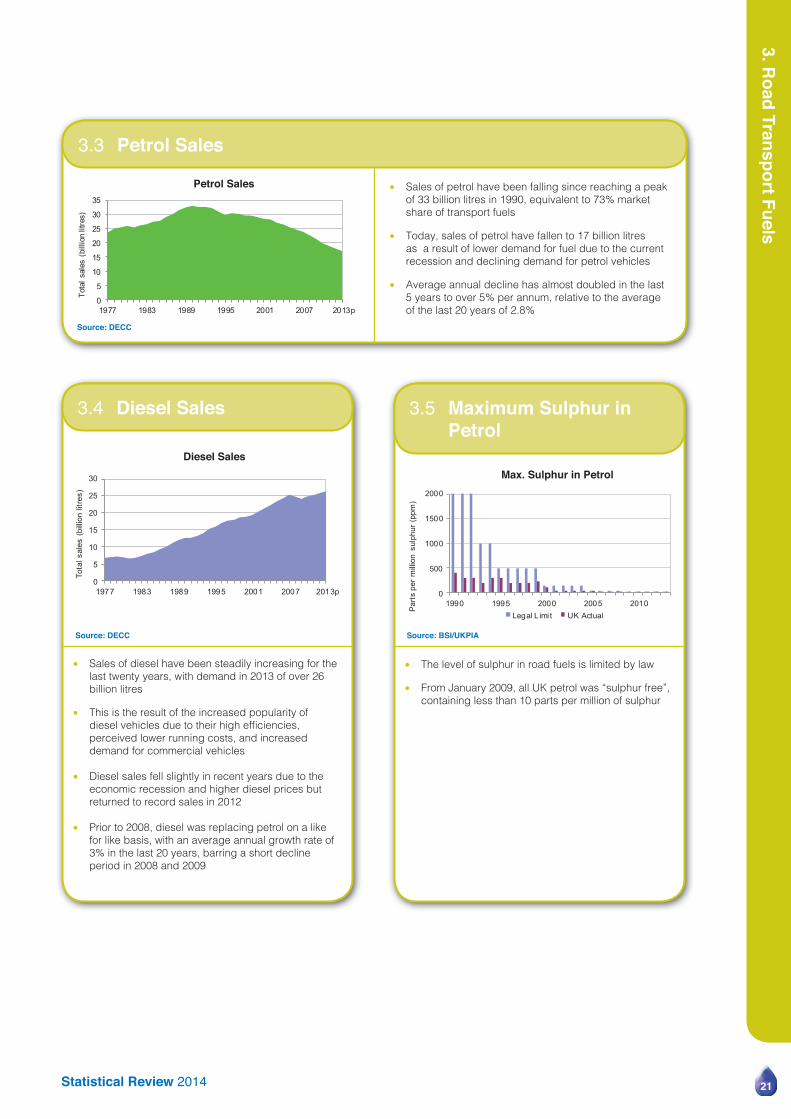
● Sales of petrol have been falling since reaching a peak of 33 billion litres in 1990, equivalent to 73% market share of transport fuels
● Today, sales of petrol have fallen to 17 billion litres as a result of lower demand for fuel due to the current recession and declining demand for petrol vehicles
● Average annual decline has almost doubled in the last 5 years to over 5% per annum, relative to the average of the last 20 years of 2.8%
Petrol Sales
Source: DECC
0
5
10
15
20
25
30
1977 1983 1989 1995 2001 2007 2013p
Tota
l sal
es (
billi
on li
tres
)
0
500
1000
1500
2000
1990 1995 2000 2005 2010
Par
ts p
er m
illio
n su
lphu
r (pp
m)
Legal L imi t UK Actual
3.4 Diesel Sales 3.5 Maximum Sulphur in Petrol
● Sales of diesel have been steadily increasing for the last twenty years, with demand in 2013 of over 26 billion litres
● This is the result of the increased popularity of diesel vehicles due to their high effi ciencies, perceived lower running costs, and increased demand for commercial vehicles
● Diesel sales fell slightly in recent years due to the economic recession and higher diesel prices but returned to record sales in 2012
● Prior to 2008, diesel was replacing petrol on a like for like basis, with an average annual growth rate of 3% in the last 20 years, barring a short decline period in 2008 and 2009
● The level of sulphur in road fuels is limited by law
● From January 2009, all UK petrol was “sulphur free”, containing less than 10 parts per million of sulphur
Source: DECC Source: BSI/UKPIA
Diesel SalesMax. Sulphur in Petrol

3. Road Transport Fuels
22
0
1000
2000
3000
1991 1996 2001 2006 2011
Par
ts p
er m
illio
n su
lphu
r (p
pm)
Legal L imi t UK Actual
0
50
100
150
200
250
300
2000 2002 2004 2006 2008 2010 2012
Tota
l sal
es (
mill
ion
litre
s)
3.6 Maximum Sulphur in Diesel
3.7 Sales of LPG for Transport
● The level of sulphur in diesel is also limited by law
● All diesel in the UK became “sulphur free” by January 2009 (below 10ppm)
● As well as petrol and diesel, liquefi ed petroleum gas (LPG) is used as a road fuel in the UK
● Sales of LPG rose rapidly between 2000 and 2006 based upon a favourable duty incentive, a conversion grant scheme and favourable treatment under the London Congestion Charge
● However, the removal of the grant scheme and gradual reduction in the duty differential between LPG and standard fuels since has impacted on the sales of LPG/petrol cars, which in turn has affected sales of LPG, lowering sales to 182 million litres down from a 2006 peak of almost 250 million litres
Source: BSI/UKPIA Source: HM Revenue and Customs
Max. Sulphur in Diesel Sales of LPG for Transport

4. Biofuels
232323
4. Biofuels
As a member of the European Union, the UK is committed to reducing its carbon emissions as
initially mandated by the 2003 EU Biofuels Directive that set an EU-wide target of 5.75% of the market share of transport fuels by 2010. This was followed by the recently transposed Renewable Energy Directive (RED) that sets out a target of 10% by energy for all forms of transport to be from renewable sources by 2020.
Given that over 25% of the UK’s carbon emissions come from the transport sector, with some 14% from the private car fl eet alone, the transition to a low carbon model has been particularly challenging. As a result, an enormous
amount of work has been undertaken by the downstream oil industry to ensure that the Government’s targets are met under the Renewable Transport Fuels Obligation (RTFO) and that fuel quality standards are maintained. Key considerations are the amount of carbon saved by different biofuels, the sustainability of the source material, food crop production and the carbon balance associated with land use change. In December 2011, the RTFO was amended to allow only biofuels to meet the RED carbon and sustainability criteria to count towards the obligation, and, from April 2013, the obligation was extended to include fuel consumed by Non-Road Mobile Machinery (NRMM).
0%
2%
4%
6%
07/08 08/09 09/10 10/11 11/12 12/13 13/14 14/15
% v
olum
e bi
ofue
l in ro
ad
fuel
s
0100200300400500600700800900
03/04 04/05 05/06 06/07 07/08 08/09 09/10 10/11 11/12 12/13 13/14
Mill
ion
litre
s
4.1 RTFO Targets 4.2 UK Bioethanol Consumption
Source: HMRC
UK Bioethanol Consumption
RTFO Targets
● The RTFO was introduced in April 2008, with an original target of 5% biofuel content (by volume) in road fuels by 2010/11
● Due to sustainability concerns, targets were revised to: 4.5% for 2012/13, and 4.75% for 2013/14 and 2014/15
● From April 2014, the RTFO was extended to include fuel for Non Road Mobile Machinery (NRMM)
● The means by which the RED obligation is met are yet to be decided. For this reason, future RTFO obligation is still unknown
Source: HMT
● Between January 2005 and March 2010, the Government introduced a 20 pence per litre duty reduction on bioethanol
● The duty differential of 20 pence was removed in 2010
● In 2013/14, UK bioethanol consumption stood at a little over 800 million litres, which represents around 4.6% of all petrol sales by volume
● The relatively low sales volumes refl ect the current logistical diffi culties of adding bioethanol to petrol
● There are various other renewable petrol fuels which obligated companies use to meet their targets, such as methanol
● The buyout price under the RTFO is set at 30ppl
Statistical Review 2014

4. Biofuels
222224
0
200
400
600
800
1000
1200
02/03 04/05 06/07 08/09 10/11 12/13
Milli
on l
itres
0%
1%
2%
3%
4%
Jan Jul Jan Jul Jan Jul Jan Jul Jan Jul Jan Jul Jan
% v
olum
e bi
ofue
ls in
road
fuel
s
Bioethanol Biodiesel
2008 2009 2010 2011 2012 2013 2014
4.3 UK Biodiesel Consumption
4.4 UK Progress towards RTFO Targets
● Between July 2002 and March 2010, the Government introduced a 20 ppl duty reduction on biodiesel
● The duty differential of 20 pence was removed in 2010
● In 2012/13, UK biodiesel consumption fell to around 520 million litres from the previous year’s 992 million litres as a result of waste fuels being used to fulfi l the RTFO obligation, which in fact account for twice the value of regular biofuels
● In 2013/14, however, consumption increased again to 832 million litres, representing around 3% of total diesel sales by volume
● The buyout price under the RTFO is set at 30ppl
● The UK added 2.6% of biofuels during the fi rst year of the RTFO (2008/09), exceeding the target of 2.5%
● In the 2nd year of the RTFO (2009/10), the UK again met its target of 3.25% of biofuels
● In the 2011/2012 period, biofuel use increased to 3.7% of total road transport but fell below 3% in year 4 as a result of waste fuels now counting towards RTFO target at double the value of bioethanol and biodiesel
● In the last 12 months, volumes recovered again reaching an average of 3.65%
Source: DECC Source: HMRC
UK Biofuel Consumption UK Progress towards RTFO Targets
0
10
20
30
40
02/03 04/05 06/07 08/09 10/11 12/13 14/15
Pen
ce p
er li
tre
Duty Differential Buy Out
4.5 Duty & Buy Out for Biofuels
● A duty differential of 20 pence per litre has been in place for biodiesel since 2002 and for bioethanol since 2005
● In addition, a ‘buy out’ price for the RTFO was introduced at 15 ppl in 2008/09, giving a combined incentive of 35 ppl
● The duty differential was removed in 2010*, with the buy out price at 30 ppl
● The buy out price is effectively a penalty on the fuel supplier if the bio component is not added to the fi nal blend (or the fuel does not meet the carbon and sustainability criteria)
* Except for cooking oil where the duty differential of 20 ppl remained until April 2012
Duty Differentials and Buy Out for Biofuels
Source: HMT/ RFA

4. Biofuels
Statistical Review 2014 232325
Palm oil mill effluent1%
Soy1%
Tallow - category 17%
Used cooking oil 36%
Corn, EC 12%
Corn, non-EC 14%
Sugar beet 10%
Sugar cane 5%
Wheat 9%
Crude glycerine 2%
Sugar beet 1%other
2% Argentina1.6%Belgium
3.3%Brazil2.5%
Bulgaria0.7%
France8.2%Germany
4.7%
Hungary0.6%
Italy0.5%
Malaysia1.6%
Netherlands5.2%
Peru2.1%
Poland0.6%
Republic of Korea2.2%
Saudi Arabia0.9%
Spain6.9%
Tunisia0.7%
United Arab Emirates
1.2%
United Kingdom19.5%
United States5.8%
Other31.1%
4.6 Sources of Biofuels used in the UK
● A little under 20% of biofuels used in the UK are domestically produced, almost a 100% increase on from the previous year
● The second single largest source of biofuels for the UK is from France
● Ethanol is mostly sourced from sugarcane and sugar beet
● Biodiesel is mostly sourced from used cooking oil, soy and rape
Source: DfT (covering period April 2011 – December 2011)
Sources of Biofuels by Crop Sources of Biofuels by Country

Bitumen Fuel Oil
Jet and Kerosene
Petrol
LPGNaphtha
Diesel and Gas Oil
0
10
20
30
1977 1983 1989 1995 2001 2007 2013
Del
iverie
s (m
illio
n to
nnes
)
5.1 Refi ning Production 5.2 Fuel Oil Deliveries
● Refi neries produce naphtha, LPG, road fuels, kerosene, jet fuel, heating oil, diesel, gas oil, fuel oil, bitumen and other products such as chemical feedstocks
● The current trend of production is away from heating fuels (fuel and gas oils) and towards transport fuels (petrol, diesel and jet fuel)
● Refi neries will require major investment to meet the increased demand for diesel and jet fuel – estimated at up to £700 million at each major refi nery (Deloitte report for DECC on Downstream oil April 2010)
● The market for fuel oil has reduced signifi cantly since 1970 – rising only briefl y in 1984 due to the miners’ strike
● The reduction in demand is mainly due to fuel switching to natural gas by electricity generators – the ‘dash for gas’
Source: DECC*excludes refi nery use and losses Source: DECC
Refi ning Production in 2013* Inland Fuel Oil Deliveries
5. Other Products
A wide range of products are produced from crude oil, ranging from transport and domestic/industrial
fuels to chemical feedstocks. Over time, refi nery confi gurations have developed to increase the quantities of high value transport fuels that can be produced. In
contrast, the domestic/industrial markets for other fuels have altered markedly over the last twenty years as sales of fuel oil and gas oil have reduced, being displaced in power generation and industrial applications by natural gas.
0
2
4
6
8
10
12
14
16
1977 1983 1989 1995 2001 2007 2013
Del
iver
ies
(mill
ion
tonn
es)
5.3 Gas Oil Deliveries
● The UK demand for gas oil has fallen since 1970 to a little under 4 million tonnes
● Gas oil is produced from a similar fraction of crude oil as diesel and so production is limited
● The reduction in demand is mainly due to fuel switching to natural gas
● Product specifi cation changed for other off road diesel gas oil fuels from January 2011, moving them to virtually ‘sulphur-free’ content, further adding pressure on middle distillate capacity
Inland Gas Oil Deliveries
Source: DECC
5. Other Products
26

Statistical Review 2014
5. Other Products
232327
0.0
0.5
1.0
1.5
2.0
2.5
3.0
3.5
4.0
4.5
1977 1983 1989 1995 2001 2007 2013
Del
iver
ies
(mill
ion
tonn
es)
0.0
0.5
1.0
1.5
2.0
2.5
3.0
1977 1983 1989 1995 2001 2007 2013Del
iver
ies
(milli
on to
nnes
)
0
3
6
9
12
15
1977 1981 1985 1989 1993 1997 2001 2005 2009 2013
Del
iver
ies
(mill
ion
tonn
es)
0.0
0.2
0.4
0.6
0.8
1.0
1.2
1977 1983 1989 1995 2001 2007 2013
Del
iver
ies
(mill
ion
tonn
es)
5.4 Kerosene Deliveries
5.6 Bitumen Deliveries
5.5 Aviation Fuel Deliveries
5.7 Lube Oil Deliveries
● Kerosene (also called burning oil) is used as fuel for domestic and industrial heating, and sales are typically higher during the winter
● Inland sales of kerosene have steadily increased since 1980, from a little over 1.5 million tonnes to over 4 million tonnes in recent years
● Deliveries dipped to 3.3 million tonnes in 2011 and 2012, but recovered slightly in 2013 to 3.5 m
● New legislation introduced in January 2008 restricted the sulphur levels in kerosene to 0.1%
● Demand for bitumen has declined to just 1.3 million tonnes/pa
● Bitumen is produced from some of the heaviest fractions of crude oil and is mainly used for road surfacing and roofi ng
● Aviation turbine kerosene is used in jet engines
● Sales of AVTUR have been rising steadily since 1970 and growth is projected to continue
● Aviation fuel demand has been falling for the last six consecutive years – barring 2011 – mostly as a result of the recession and more effi cient engines
● Sales of lubes and greases have fallen since 1970 to around 0.42 million tonnes/pa
● Improved engines require fewer oil changes and the use of synthetic lubricating oils has also contributed to this reduction
● The introduction of biodiesel could see oil drain intervals reducing and demand for lubes increasing
Source: DECC
Source: DECC
Source: DECC
Source: DECC
Inland Lube Oil DeliveriesInland Bitumen Deliveries
Inland Kerosene Deliveries Inland Aviation Fuel Deliveries
Pre-tax
Duty/VAT
0
20
40
60
80
100
120
140
1993 1997 2001 2005 2009 2013
Pen
ce p
er li
tre
Ex-Refinery Price35%
Retail /Ex-refinery
Price Spread5%
Duty / VAT60%
6.1 Petrol Pump Price 6.2 Average Contribution to Pump Price
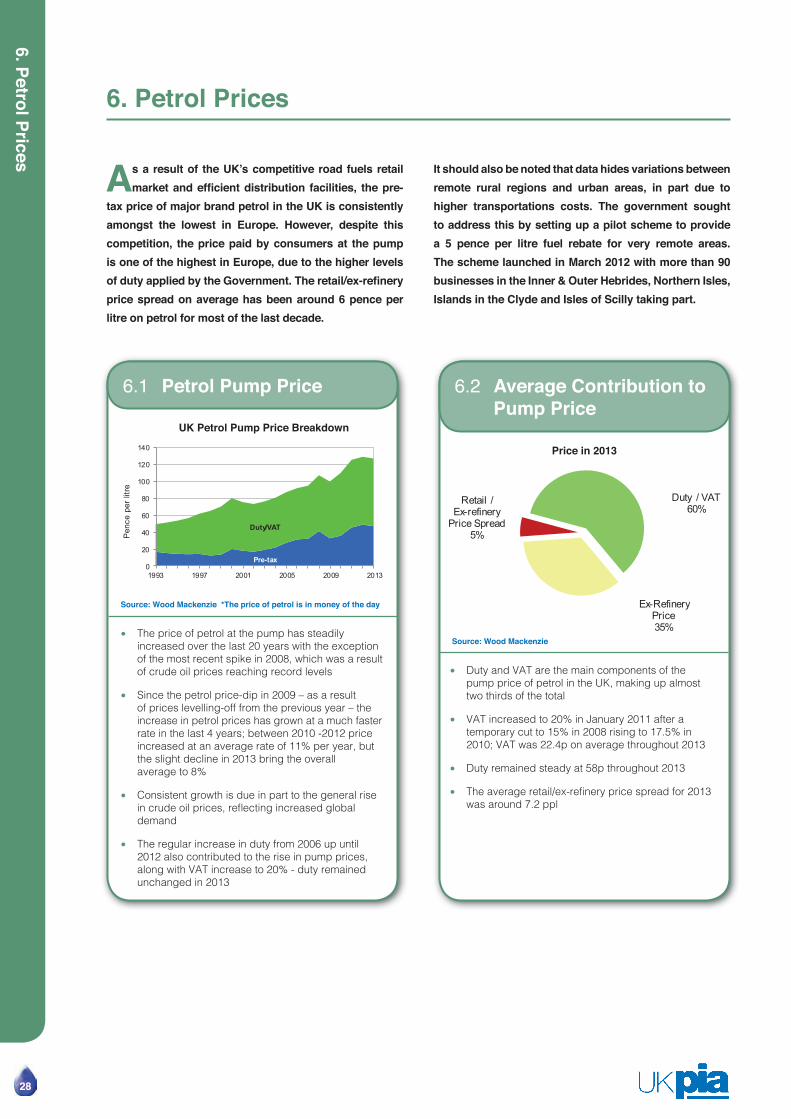
● The price of petrol at the pump has steadily increased over the last 20 years with the exception of the most recent spike in 2008, which was a result of crude oil prices reaching record levels
● Since the petrol price-dip in 2009 – as a result of prices levelling-off from the previous year – the increase in petrol prices has grown at a much faster rate in the last 4 years; between 2010 -2012 price increased at an average rate of 11% per year, but the slight decline in 2013 bring the overall average to 8%
● Consistent growth is due in part to the general rise in crude oil prices, refl ecting increased global demand
● The regular increase in duty from 2006 up until 2012 also contributed to the rise in pump prices, along with VAT increase to 20% - duty remained unchanged in 2013
● Duty and VAT are the main components of the pump price of petrol in the UK, making up almost two thirds of the total
● VAT increased to 20% in January 2011 after a temporary cut to 15% in 2008 rising to 17.5% in 2010; VAT was 22.4p on average throughout 2013
● Duty remained steady at 58p throughout 2013
● The average retail/ex-refi nery price spread for 2013 was around 7.2 ppl
Source: Wood Mackenzie *The price of petrol is in money of the day
Source: Wood Mackenzie
UK Petrol Pump Price Breakdown
Price in 2013
6. Petrol Prices
As a result of the UK’s competitive road fuels retail market and effi cient distribution facilities, the pre-
tax price of major brand petrol in the UK is consistently amongst the lowest in Europe. However, despite this competition, the price paid by consumers at the pump is one of the highest in Europe, due to the higher levels of duty applied by the Government. The retail/ex-refi nery price spread on average has been around 6 pence per litre on petrol for most of the last decade.
It should also be noted that data hides variations between remote rural regions and urban areas, in part due to higher transportations costs. The government sought to address this by setting up a pilot scheme to provide a 5 pence per litre fuel rebate for very remote areas. The scheme launched in March 2012 with more than 90 businesses in the Inner & Outer Hebrides, Northern Isles, Islands in the Clyde and Isles of Scilly taking part.
6. Petrol Prices
28

Statistical Review 2014
6. Petrol Prices
232329
0
20
40
60
80
100
120
140
UK Ger Spain France Neth Italy Bel Lux
Pen
ce p
er li
tre
Excl Duty & VAT Duty & VAT
0
50
100
150
200
1990 1993 1996 1999 2002 2005 2008 2011 2014
1990
= 1
00
Duty &VAT
Pre Tax Price
Crude Oil Price
Petrol Price
0
10
20
30
40
50
60
1991 1993 1995 1997 1999 2001 2003 2005 2007 2009 2011 2013
Pen
ce p
er li
tre
6.3 European Prices
6.5 Fuel Price and Tax Comparison
6.4 Pre-Tax Petrol and Crude Prices
● In 2013 the UK pre-tax price of major brands of unleaded petrol was again the lowest in Europe at 54.3 pence per litre, whilst the average of the 7 major EU countries was 59.2 pence by comparison
● The price paid at the pump by UK consumers was however considerably higher – third highest in Europe - due to the levels of fuel duty
● The pre-tax price of petrol only recently increased relative to 1990 levels, having remained below RPI adjusted 1990 prices until 2005
● Duty and VAT steadily increased relative to 1990 levels throughout the 90s, until they were effectively frozen following protests in September 2000
● They have continued to show a greater increase over the past 18 years than the pre-tax price. 2010 saw the largest growth since 1999.
● In 2013, duty was effectively frozen, with VAT only increasing the tax curve
● The pre-tax price of petrol is related to the cost of crude oil
● The effect of crude prices on the fi nal pump price is lessened by the high levels of fuel duty
● The £/$ exchange has a signifi cant infl uence on fuel prices
Source: Wood Mackenzie
Source: Wood Mackenzie/UK Statistics Authority
Source: DECC
Fuel Price and Tax Comparison
Pump Prices of Unleaded Petrol 2013
Pre-Tax Petrol and Crude Prices

7. Diesel Prices
30
Duty & VAT
0
20
40
60
80
100
120
140
160
1992 1996 2000 2004 2008 2012
Pen
ce p
er li
tre
Excl. Duty & VAT
Retail/ Ex-Refinery
Price Spread 4%
Ex-Refinery Price 37%
Duty/VAT 59%
7.1 Diesel Pump Price 7.2 Average Contribution to Pump Price
● Diesel pump prices have steadily increased over the last 20 years, most notably in 2008 and 2011 as a direct consequence of crude oil prices reaching record levels and duty/VAT increases
● Diesel prices in recent years have grown at quite a considerable rate, averaging over 11% between the end of 2009 and 2012
● This growing increase is due to rising crude oil prices, refl ecting increased global demand
● Increases in duty also contribute signifi cantly to the rise in pump prices. As a result of the current duty freeze, diesel prices in 2013 have effectively remained the same
● In 2013 duty and VAT made up almost two thirds of the pump price of diesel in the UK
● The retail/ex-refi nery price spread was around 7.9 ppl
● From this the oil company and retailer must cover all site, distribution and storage expenses
Source: Wood Mackenzie *The price of petrol in fi gure 7.1 is in money of the day
Source: Wood Mackenzie
UK Diesel Pump Price Breakdown
Average Contribution to Pump Prices 2013
7. Diesel Prices
The UK road fuels retail market is highly competitive and distribution facilities are effi cient; consequently,
the pre-tax price of major brand diesel in the UK is consistently amongst the lowest in Europe. Despite this competition, diesel prices remain among the highest in Europe, but while a much larger share of the price is taken up by tax compared to other European markets, the refi ning margin remains higher relative to petrol.
The UK, unlike other European markets, doesn’t tax diesel at a lower rate than petrol, this results in diesel prices in the UK being slightly higher compared to petrol. Nonetheless, as briefl y discussed in chapter 3, diesel demand has continued to gain market share since the late ‘90s, partly as a result of the fuel effi ciency advantage of diesel engines over petrol.
However, as petrol engine effi ciency improvements continue to catch up with that of diesel, forecasting the current ‘dieselisation’ trend long-term is diffi cult. Particularly as the growing drive for a reduction in carbon emissions from transport will increasingly result in tax levels becoming more aligned with vehicle carbon emission levels, and most likely lead to a marginal increase in the attraction of smaller capacity gasoline fuelled vehicles. For these reasons, analysts argue that the growth in diesel’s market share will slowly cease and reach a peak in 2017, followed by a gradual reversal in trend.

Statistical Review 2014
7. Diesel Prices
232331
5556575859606162636465
UK Ger Spain Ireland France Neth Lux Italy Bel
Penc
e pe
r litr
e
Diesel Price
Crude Price
0
10
20
30
40
50
60
70
1990 1993 1996 1999 2002 2005 2008 2011
Penc
e pe
r lit
re
0
20
40
60
80
100
120
140
160
UK Neth Italy Fra Ger Bel Lux Spain Ire
Pen
ce p
er li
tre
Excl duty/VAT Duty & VAT
Pre Tax Price
Duty & Vat
0255075
100125150175200225
1990 1992 1994 1996 1998 2000 2002 2004 2006 2008 2010 2012 2014
1990
= 1
00
7.3 European Pre-Tax Pump Prices
7.5 Pre-Tax Diesel and Crude Prices
7.4 European Pump Prices
7.6 Fuel Price and Tax Comparison
● In 2013, the UK once again had one of the lowest pre-tax diesel prices in the EU; around 2.65 pence lower compared to the remaining average of 61.95 pence
● The low UK pre-tax price is a result of strong competition amongst retailers and an effi cient fuel distribution network
● The pre-tax price of diesel is closely related to the price of crude oil
● The £/$ exchange is a key factor in determining fuel prices
● The fi nal pump price of major brand diesel in the UK was the highest compared to major European countries in 2013, refl ecting the high level of duty paid on fuel in the UK
● The UK is the only major European country to apply the same duty rate to diesel and petrol
● Duty is taxed at different levels except for the UK and Switzerland
● The pre-tax price of diesel only increased relative to 1990 levels in 2004 and has since picked up pace
● Despite the large price-drop in 2009, following a rally in 2008, diesel prices superseded the Duty and VAT 1990 base indicator in 2011, suggesting that the total price increase for that year was mainly driven by cost of crude oil along with a continued squeeze in the diesel market across Europe
● Duty and VAT steadily increased relative to 1990 levels throughout the ‘90s, until they were effectively frozen in September 2000 and again in 2012
● Following an almost 7 year hiatus, duty was increased from December 2006, whilst VAT was briefl y lowered to 15% in 2009 but increased to 20% in 2011; this explains the slightly higher gradient in duty and VAT from 2006, as shown in the chart
Source: Wood Mackenzie
Source: Wood Mackenzie
Source: Wood Mackenzie
Source: Wood Mackenzie/UK Statistics Authority
Fuel Price and Tax ComparisonPre-Tax Diesel and Crude Prices
Pre-Tax Pump Prices of Diesel 2013
Pump Prices of Diesel 2013

8. Filling Stations Stats and Crim
e Data
32
0
5,000
10,000
15,000
20,000
25,000
30,000
35,000
1977 1983 1989 1995 2001 2007 2013
Num
ber o
f site
s
0
2,000
4,000
6,000
8,000
10,000
12,000
14,000
16,000
18,000
20,000
1990 1994 1998 2002 2006 2010
Num
ber
of s
ites
Supermarket Oil Companies Dealer / Independent
8.1 Number of Sites 8.2 Ownership of Sites
● At the end of 2013 there were 8,613 fi lling stations in the UK
● The number of fi lling stations is now less than a quarter of the 1970 total
● Over the past ten years, the number of sites has been falling at a rate of approximately 260 per year
● Many fi lling stations owned and operated by both oil companies and independent retailers have closed due to competition and low profi ts
● The number of supermarket sites is increasing at a steady rate of 3% p/y
● Independent sites still account for the majority of petrol stations at around 60% of total number but only 32% of sales volume
● In the last few years several oil majors have exited the UK retail market
Source: Energy Institute until 2005; Catalist onwards Source: Energy Institute until 2005; Catalist onwards
Total Sites Ownership of Sites
8. Filling Stations Statistics
Over the last forty years the number of fi lling stations in the UK has reduced dramatically, from over 37,500
in 1970 to 8,613 at the end of 2013. In the last ten years, on average more than 260 fi lling stations closed each year due to strong competition between fuel retailers and the increasing costs of compliance with environmental regulation. This favours large service stations with lower overheads per litre sold. As a result many smaller fi lling stations have become economically unviable.
The only section of the retail market that is currently growing is large supermarket sites. In 2013, hypermarkets accounted for around 42% of market share by volume, despite only owning 15% of all petrol stations versus the oil companies’ 26% market share by volume with ownership of 22% of all petrol stations.

Statistical Review 2014
8. Filling Stations Stats and Crim
e Data
232333
-
200
400
600
800
1,000
1,200
1,400
1990 1994 1998 2002 2006 2010
Num
ber
of s
ites
0
2
4
6
8
10
12
14
1995 1997 1999 2001 2003 2005 2007 2009 2011 2013
Mill
ion
litre
s /
yea
r
Independents Supermarkets
Petrol %
Diesel %
0%
5%
10%
15%
20%
25%
30%
35%
40%
45%
50%
1999 2001 2003 2005 2007 2009 2011 2013
% o
f sal
es
0
50
100
150
200
250
300
350
England Wales Scotland Northern Ireland
Site
s/ m
illio
n pe
ople
8.3 Supermarket Sites
8.5 Throughput per Site
8.4 Supermarket Share of Retail Sales
8.6 Access to Filling Stations
● At the end of 2013 there were 1,347 supermarket fi lling stations in the UK
● A little over 15% of all fi lling stations are now owned by supermarkets
● Although numerically in the minority, volume sales are the signifi cant factor and account for 42% of market share
● The average throughput of all fi lling stations has risen markedly since 1994 to around 7 million litres per year. However, there is a huge disparity between company, independent and supermarket sites
● The average supermarket site throughput is currently around 11.2 million litres per year whilst independent sites average just over 2 million litres
● As the retail market continues its decline for the 3rd consecutive year, supermarket share of retail sales has continued
● Supermarkets now account for 45% of all petrol sold and 42% of diesel
● The number of fi lling stations per capita is highest in Northern Ireland with around 296 fi lling stations per million relative to England with 124 per million
● For the last four consecutive years, the number of fi lling stations has consistently reduced in all but one region, Northern Ireland
● See UKPIA briefi ng paper – ‘Fuel Supply to Rural Filling Stations’ for more information
Source: Energy Institute until 2005; Catalist onwards
Source: DECC / Energy Institute / Catalist
Source: DECC (ETS)
Source: ONS / Catalist
Access to Filling Stations 2012
Throughput per Site
Supermarket SitesSupermarket Share of Retail Sales

9. Air Q
uality
34
0102030405060708090
100110120130
Benzene SO2 1,3Butadiene
NOx VOC PM10 CO
% 1
990
leve
ls
1996 2003 2011 0
20
40
60
80
100
120
1992 1994 1996 1998 2000 2002 2004 2006 2008 2010 2012
Av
erag
e nu
mbe
r of
day
s
Rural Average Urban Average
9.1 Vehicular Emissions 9.2 Air Pollution
● Emissions of exhaust gas pollutants have been signifi cantly reduced from 1990 levels
● The largest reduction has been made for SO2 through the introduction of zero sulphur petrol and diesel
● Air pollution in urban areas has fl uctuated over time but there has been a general long term decline in high air pollution days at both urban and rural monitoring sites despite an increase in 2011
● Days of moderate or higher air pollution for rural areas have shown a clear downward trend
● The variability of weather from year to year plays an important role; for example, the hot summers of 2003 and 2006 resulted in high pollution levels mainly caused by ozone some associated with trans-boundary sources. The comparatively cooler summer in 2007, 2010 and 2012 ensured air pollution reverted to low levels
Source: DEFRA/AEA Energy & Environment Source: DEFRA/AEA Energy & Environment
Relative Vehicular Emissions of Pollutants - 1990 base
Number of Days when Air Pollution is Moderateor Higher
9. Air Quality
One of the key drivers for the oil industry is reducing the environmental pollution from the use of fuels. Since
1990 road fuels and vehicles have become signifi cantly
cleaner, resulting in much lower exhaust emissions despite an increase in traffi c levels of around 25%.
Road transport21%
Residential16%
Other63%
9.3 Primary Particulate Matter
● In 2011 the combustion of road fuels contributed 21% of the UK’s primary emissions of particulate matter, slightly lower compared to previous year
● The residential sector produced 16% of the emissions, with the rest produced by other sources including industry and power generation
● Ambient levels of PM10 include fi ne particles from primary (around a third), secondary and other sources
Primary Particulate Matter Sources 2011
Source: DEFRA/AEA Energy & Environment

Statistical Review 2014
9. Air Q
uality
232335
0
10
20
30
40
50
1975 1981 1987 1993 1999 2005 2011
PM10
em
issi
ons
(kto
nnes
)
0
200
400
600
800
1000
1200
1400
1975 1979 1983 1987 1991 1995 1999 2003 2007 2011
Veh
icle
em
issi
ons
(kto
nnes
)
Energy industries30%
Road transport33%
Other37%
Residential11%
Other36%
Manufacturing 7%
Road Transport 13%
Fugitive Emissions from Fuels 9%
9.4 Road Transport PM10 Emissions
9.6 Road Transport NOX Emissions
9.5 Sources of NOX
9.7 Sources of Benzene
● Emissions of particulate matter (PM10) from road transport peaked in 1996 at 40 thousand tonnes
● Since then, emissions have fallen by a little under 40% due to tighter standards for vehicular emissions and the move to ‘sulphur free’ road fuels
● However, the increased dieselisation of the car park will continue to impact this trend since PM10 emissions are higher from diesel than petrol
● Nitrogen oxides are acidifying and eutrophying gases and give rise to ground-level ozone
● Road transport NOx emissions have fallen by around 75% from their peak in 1990 to around 338k tonnes in 2011
● The overall gradual decline in NOx emissions is as a result of oxidation catalysts (diesel vehicles and catalytic converters (petrol vehicles) which have been enabled by ‘sulphur-free’ diesel and unleaded petrol
● Nitrogen oxides (NOx) are mainly formed as a by- product from the combustion of fossil fuels
● 30% of the UK’s total NOx emissions in 2011 were from energy industries
● The largest single source of emissions was road transport, producing 33% of the total
● Tighter EU exhaust emission standards will reduce vehicle NOx emissions
● In 2011, road transport was responsible for 13% of the UK’s benzene emissions
● Stage II Vapour Recovery was fi tted to large petrol stations
● Benzene is naturally present in crude oil and is also formed during refi ning
● Most benzene is removed to comply with specifi cations
Source: DEFRA/AEA Energy & Environment
Source: DEFRA/AEA Energy & Environment
Source: DEFRA/AEA Energy & Environment
Source: DEFRA/AEA Energy & Environment
Road Transport PM10 Emissions
Sources of NOX 2011
Sources of Benzene 2011

9. Air Q
uality
36
0
5
10
15
20
25
1990 1992 1994 1996 1998 2000 2002 2004 2006 2008 2010
Ben
zene
em
issi
ons
(kto
nnes
)
0
2
4
6
8
10
12
14
1990 1992 1994 1996 1998 2000 2002 2004 2006 2008 2010
Veh
icle
em
issi
ons
(kto
nnes
)
Road transport
34%
Residential15%
Other51%
Road transport6%
Residential3%
Fugitive emissions from fuels
19%
Solvent and other product use
47%
Others19%
Oil products6%
9.8 Road Transport Benzene Emissions
9.10 Road Transport 1,3- Butadiene Emissions
9.9 Sources of CO
9.11 Sources of VOCs
● Emissions of benzene from road transport have reduced signifi cantly since 1990 due to the introduction of exhaust after-treatment technology enabled by unleaded petrol
● In 2000 emissions of benzene were further reduced following the lowering of the benzene and aromatics limits in petrol
● Emissions of 1,3-butadiene have reduced by more than 94% since 1990
● Further reductions are expected as a greater proportion of vehicles meet new car exhaust emissions standards
● Carbon monoxide is formed from the incomplete combustion of fossil fuels
● In 2011 road transport was responsible for 34% of the UK’s carbon monoxide emissions – down 20% in real volume from the previous year
● The residential sector was responsible for 15% of emissions
● In 2011, road transport was responsible for 6% of the UK’s volatile organic compound emissions, a decrease of 37% in real volume compared to the previous year
● The main source of emissions is from the use of solvents and paints
Source: DEFRA/AEA Energy & Environment
Source: DEFRA/AEA Energy & Environment
Source: DEFRA/AEA Energy & Environment
Source: DEFRA/AEA Energy & Environment
Sources of CO 2011
Sources of VOCs 2011

9. Air Q
uality
Statistical Review 2014 37
0
250
500
750
1000
1250
1975 1979 1983 1987 1991 1995 1999 2003 2007 2011
VO
C e
mis
sion
s (k
tonn
es)
9.12 Road Transport Emissions of VOCs
● Road transport emissions of VOCs have dramatically reduced since their peak in 1991, falling by around 89%
● This reduction has resulted from the introduction of catalytic converters on cars and the switch to more diesel vehicles
Source: DEFRA/AEA Energy & Environment

10. Greenhouse G
ases
38
Kyoto target by 2008-2012
0
200
400
600
800
1000
1990 1994 1998 2002 2006 2010 2014 2018
Em
issi
ons
(mtC
O2e
/yea
r)
Basket of greenhouse gases Carbon dioxide
Carbon budgets
Road Transport26%
Energy Supply 40%
Business15%
Residential15%
Other4%
10.1 Greenhouse Gases and Commitments
10.2 Source of Carbon Dioxide
● The UK met the Kyoto protocol in 1999 – 13 years ahead of the target year - delivering a 12.5% reduction in greenhouse gases compared to 1990
● The 2009 UK Low Carbon Transition Plan set a target to reduce greenhouse gas emissions by 34% by 2020 relative to 1990
● Latest emissions data (2012) measures UK’s carbon footprint at 464 million tonnes /y, and basket of greenhouse gases at 570 million tonnes
● Emissions recorded in 2012 are 21% lower relative to carbon dioxide levels in 1990, and 27% lower relative to basket of greenhouse gases in 1990
● Road transport produces approximately 26% of the UK’s CO2 emissions – around 116 million tonnes
● The energy supply industry, along with the residential and business sectors, are also major sources of CO2
● Carbon dioxide accounted for an estimated 81% of the UK’s man-made greenhouse gas emissions in 2013
Source: DECC
Source: DEFRA/AEA Energy & Environment
Greenhouse Gases and Commitments
Sources of Carbon Dioxide 2013
10. Greenhouse Gases
A key driver for the downstream oil industry is the UK Government’s commitment to reduce emissions
of greenhouse gases by 80% by 2050 relative to 1990 levels. The main greenhouse gas is carbon dioxide, CO2. Emissions of CO2 from road transport have signifi cantly been reduced when compared to the overall increasing
mileage. In the last three years, the pace of reduction of average new car CO2 emissions was more than twice the rate averaged over the past decade and refl ects the improvements in vehicle effi ciency enabled in part by cleaner fuels.
0
20
40
60
80
100
120
140
1977 1983 1989 1995 2001 2007 2013
Em
issi
ons
(mtC
O2)
10.3 Road Transport CO2 Emissions
● CO2 road transport emissions decreased for a fi fth year running in 2013 in part due to the 2008 economic crisis and lower demand for road transport fuels
● Since 1990, emissions from road transport have risen at a much lower rate than vehicle mileage
● This can be attributed to the use of more effi cient vehicle technologies enabled by cleaner fuels, and an increased proportion of diesel vehicles
● The CO2 levels from fuel will continue to reduce with increasing use of biofuels as required by the RED
● The Renewable Energy Directive (RED) mandates that 10% of transport energy is to be from renewable sources, whilst the Fuel Quality Directive (FQD), mandates a reduction in emission by 6% by 2020
Road Transport CO2 Emissions
Source: DEFRA/AEA Energy & Environment

Statistical Review 2014
10. Greenhouse G
ases
232339
120
130
140
150
160
170
180
190
200
1997 2000 2003 2006 2009 2012
CO
2g/
km
EU average UK Business UK Private UK Average
0
5
10
15
20
25
30
35
1976 1982 1988 1994 2000 2006 2012
Em
issi
ons
(kto
nnes
)
Coal Mines3.9%
Landfill36.6%
Agriculture44%
Gas-expl, prod.+ trans.8%Road Transport
0.11%Other7.7%
Agriculture84.1%
Industrial processes
0.3%
Road transport
2.5%Other13.2%
10.4 CO2 from New Cars
10.6 Emissions of Methane
10.5 Sources of Methane
10.7 Sources of N2O
● UK average new car CO2 emissions have fallen every year on record, and in 2012 the UK average level of CO2 emissions was lower than the EU average
● Future emissions of CO2 from road transport will continue to be lowered by further improvements in vehicle effi ciency
● As the UK’s older vehicles are replaced and more diesel cars purchased, the fl eet effi ciency will improve
● The current trend to smaller vehicles will also contribute to lower emissions
● Despite the low level of emissions, reductions are still being achieved as a result of the introduction of exhaust after-treatment technologies
● Emissions in 2012 were over 90% lower than the peak around 1989
● Road transport is a minor contributor to methane emissions, producing around 0.11% of the UK total in 2012
● The main contributing sector is agriculture which accounted for over 44%
● In 2012 road transport was responsible for around 2.9 thousand tonnes of nitrous oxide (N2O), or 2% of total emissions
● Agriculture is the main source accounting for 84% of emissions, mainly from agricultural soils
● Weighted by global warming potential, nitrous oxide emissions accounted for around 6% of the UK’s man-made greenhouse gas emissions in 2012
Source: SMMT/European Commission
Source: DECC/AEA Energy & Environment
Source: DECC/AEA Energy & Environment
Source: DECC/AEA Energy & Environment
Sources of N2O 2012Road Transport Emissions of Methane
New Car Fleet Average CO2 Emissions Sources of Methane 2012

0.00
0.20
0.40
0.60
0.80
2010 2011 2012 2013 2014 2015
PSE Rate per million hours worked
05
10152025
2010 2011 2012 2013 2014 2015
Tier 1 Events
11.1 Tier 1 PSE Rate 11.2 Tier 1 events, refi neries
● The Tier 1 PSE Rate provides an indication of the number of Tier 1 Process Safety Events (PSE) that have occurred against the total number of hours worked, this is normalised per million hours
● Tier 1 events are larger losses of containment from the process plant – the event rate is a normalised view of the numbers of these events and represent a good indication of overall performance over time
● The number of Tier 1 events reported at refi neries in a 12 month period
● The numbers of Tier 1 events are very small, meaning that they are of very little value statistically, however UKPIA and its members review the root causes of such events to identify any potential learnings that can be shared
Source: UKPIA Source: UKPIA
Process Safety Event Rate Events - Refi neries
11. Process Safety
This section has been produced as one of the key objectives of UKPIA’s commitment to process safety,
and in response to the challenges set by the Buncefi eld Major Incident Investigation Board regarding sector level reporting for key process safety performance indicators.
To ensure consistency in reporting these indicators as an industry sector, UKPIA members have adopted the
American Petroleum Institute’s (API) Recommended Practice (RP) 754, ‘Process Safety Performance Indicators for the Refi ning and Petrochemical Industries’. It is on the indicators classifi ed as Tier 1, Tier 2 and Tier 3 that this section is based.
0
1
2
3
2010 2011 2012 2013 2014 2015
Tier 1 Events
11.3 Tier 1 events, terminals
● The number of Tier 1 events reported at terminals in a 12 month period
● The numbers of Tier 1 events are very small, meaning that they are of very little value statistically, however UKPIA and its members review the root causes of such events to identify any potential learnings that can be shared
Events - Terminals
Source: UKPIA
11. Process Safety
40

Statistical Review 2014
11. Process Safety
232341
0
2
4
6
8
10
12
14
2010 2011 2012 2013 2014 2015
Worker injury or fatality Third party injury or fatalityCommunity shelter or evacua�on Fire or explosion >$25k costPR device discharge to atmosphere Loss of primary containment
0.00
1.00
2.00
3.00
2010 2011 2012 2013 2014 2015
PSE Rate per million hours worked
0
1
2
3
2010 2011 2012 2013 2014 2015
Worker injury or fatality Third party injury or fatalityCommunity shelter or evacua�on Fire or explosion >$25k costPR device discharge to atmosphere Loss of primary containment
010203040506070
2010 2011 2012 2013 2014 2015
Tier 2 Events
11.4 Tier 1 events by consequence, refi neries
11.6 Tier 2 PSE Rate
11.5 Tier 1 events by consequence, terminals
11.7 Tier 2 events, refi neries
● The consequences of Tier 1 events at refi neries for a 12 month period. Note that there may be more than one consequence per Tier 1 event
● The Tier 2 PSE Rate provides an indication of the number of Tier 2 Process Safety Events (PSE that have occurred against the total number of hours worked, this is normalised per million hours
● Tier 2 events are lesser losses of containment from the process plant – statistically they are of more relevance that Tier 1 events because the numbers recorded are larger, meaning that they can provide the necessary data to target improvement programs where appropriate
● The consequences of Tier 1 events at terminals for the 12 month period. Note that as there may be more than one consequence per Tier 1 event
● The number of Tier 2 events reported at refi neries in a 12 month period
● Number of reported events has decreased by around 80% in the last four years
Source: UKPIA
Source: UKPIA
Source: UKPIA
Source: UKPIA
Events - Refi neriesProcess Safety Event Rate
Events by Consequence - Refi neries Events by Consequence - Terminals
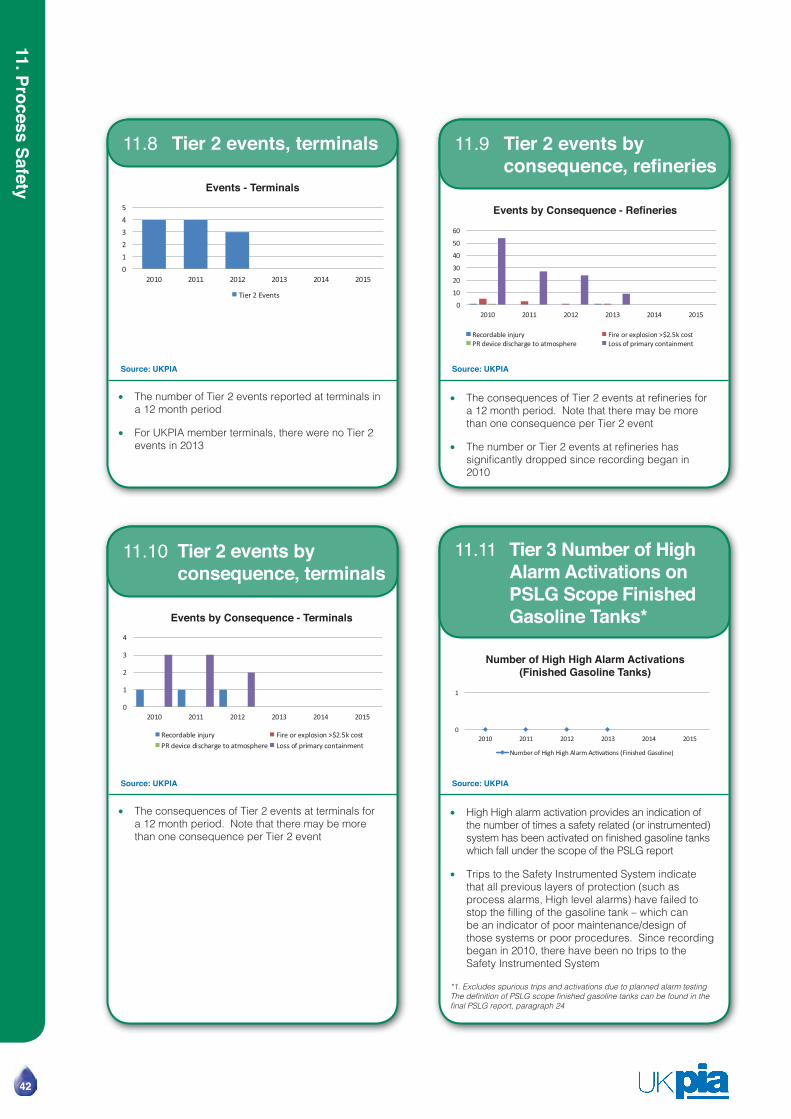
11. Process Safety
42
012345
2010 2011 2012 2013 2014 2015
Tier 2 Events
0
1
2
3
4
2010 2011 2012 2013 2014 2015
Recordable injury Fire or explosion >$2.5k costPR device discharge to atmosphere Loss of primary containment
0
10
20
30
40
50
60
2010 2011 2012 2013 2014 2015
Recordable injury Fire or explosion >$2.5k costPR device discharge to atmosphere Loss of primary containment
0
1
2010 2011 2012 2013 2014 2015
Number of High High Alarm Ac�va�ons (Finished Gasoline)
11.8 Tier 2 events, terminals
11.10 Tier 2 events by consequence, terminals
11.9 Tier 2 events by consequence, refi neries
11.11 Tier 3 Number of High Alarm Activations on PSLG Scope Finished Gasoline Tanks*
● The number of Tier 2 events reported at terminals in a 12 month period
● For UKPIA member terminals, there were no Tier 2 events in 2013
● The consequences of Tier 2 events at terminals for a 12 month period. Note that there may be more than one consequence per Tier 2 event
● The consequences of Tier 2 events at refi neries for a 12 month period. Note that there may be more than one consequence per Tier 2 event
● The number or Tier 2 events at refi neries has signifi cantly dropped since recording began in 2010
● High High alarm activation provides an indication of the number of times a safety related (or instrumented) system has been activated on fi nished gasoline tanks which fall under the scope of the PSLG report
● Trips to the Safety Instrumented System indicate that all previous layers of protection (such as process alarms, High level alarms) have failed to stop the fi lling of the gasoline tank – which can be an indicator of poor maintenance/design of those systems or poor procedures. Since recording began in 2010, there have been no trips to the Safety Instrumented System
*1. Excludes spurious trips and activations due to planned alarm testingThe defi nition of PSLG scope fi nished gasoline tanks can be found in the fi nal PSLG report, paragraph 24
Source: UKPIA
Source: UKPIA
Source: UKPIA
Source: UKPIA
Events - Terminals
Events by Consequence - Terminals
Events by Consequence - Refi neries
Number of High High Alarm Activations(Finished Gasoline Tanks)

Statistical Review 2014
12. Occupational H
ealth and Safety
232343
12. Occupational Health and Safety
The refi ning and marketing industry continued to maintain very high standards of occupational safety
during 2013. It remains one of the safest manufacturing industries in the UK, with proportionately fewer injuries occurring than in the manufacturing sector as a whole. The UK downstream industry also compares favourably in terms of refi ning employee safety performance with European competitors. Particularly strong improvements have been made in contractor safety since the 1990s and these have been helped by the introduction of Contractor Safety Passport Schemes.
Note: CONCAWE (Conservation of Clean Air and Water in Europe) is the European oil industry technical body focussed on environment, health and safety.
0
100
200
300
400
500
600
Mkt Employees Refy Employees Refy Contractors
>3da
y in
jurie
s/10
0,00
0 w
orke
rs
2000-01 2001-02 2002-03 2003-04 2004-05 2005-06 2006-072007-08 2008-09 2009-10 2010-11 2011-12 2012-13
12.1 RIDDOR >3 day Injuries by Category of Worker
● In 2012, the frequency of injuries (RIDDOR >3 day) fell further for marketing employees to their lowest levels recorded
● Marketing statistics include fi lling station staff directly employed by some companies
● The number of refi nery employee injuries fell again in 2013 despite a sharp increase in 2012 due to maintenance turnaround and recommissioning activities
Source: UKPIA
RIDDOR >3 Day Injuries
0
50
100
150
200
250
Medical TreatmentCases
Restricted Work Injuries Lost Work Injuries
Rep
orte
d in
cide
nts
2000 2001 2002 2003 2004 2005 20062007 2008 2009 2010 2011 2012 2013
12.2 Refi ning Injuries
● Injuries reported at refi neries continue to fall or remain in the low quartile
● In 2013, restricted work injuries fell to one of the lowest levels ever recorded, whilst the number of medically treated cases was only a tenth of those reported in 2000
● This refl ects a continued high level of attention to safe practices
Source: UKPIA
Refi ning Injuries

12. Occupational H
ealth and Safety
44
0
2
4
6
8
2001 03 05 07 09 11 13 2001 03 05 07 09 11
UKPIA CONCAWE
Lost
wor
k in
jurie
s/m
illio
n hr
s
Ref Staff Ref Contr
Employ ee
Contractor
0
1
2
3
4
5
1997
1999
2001
2003
2005
2007
2009
2011
2013
Lost
wor
k in
jurie
s/m
illio
n hr
s
Employ ee
Contractor
0
2
4
6
8
10
2000 2002 2004 2006 2008 2010 2012
Lost
wor
k in
jurie
s/m
illion
hrs
12.4 Refi ning Lost Work Injuries
12.3 Refi ning Lost Work Injury Frequency
12.5 Marketing Lost Work Injury Frequency
● Comparing UKPIA with European safety data (CONCAWE) indicates that UK refi nery employees are less likely to suffer a lost work injury than European counterparts
● In 2012, refi ning contractors in the UK were 75% less likely to miss work due to an injury than their European counterparts
● Contractor lost work injuries at refi neries has reduced in frequency over the years as a result of a new ‘Contractor Safety Passports’ scheme, but rose from its lowest ever recorded level in 2013
● In 2013, refi nery employee LWIF maintained levels in the low quartile but did rise by a little over 10%
● Lost work injuries amongst marketing contractors and employees have in recent years converged and continue to be in the very low levels, as seen over the past few years
● The ‘Contractor Safety Passport Scheme’ for forecourt contractors introduced by UKPIA in 1999 helped achieve this
Source: UKPIA / CONCAWESource: UKPIA
Source: UKPIA
Refi ning Lost Work InjuriesRefi ning Lost Work Injury Frequency
Marketing Lost Work Injury Frequency

Statistical Review 2014
NO
TES
232345

46
NO
TES

NO
TES
232347Statistical Review 2014

UNITED KINGDOMUnited Kingdom Petroleum Industry Association, Quality House, Quality Court, Chancery Lane, London WC2A 1HP
Tel: 020 7269 7600 E-mail: [email protected] Website: www.ukpia.com


