8.0 ENERGY MANAGEMENT SYSTEM...
21
U.S. D.O.E Solar Decathlon Page 1 8.0 ENERGY MANAGEMENT SYSTEM NARRATIVES AND DESIGN 8.1 Energy Management System Overview Home control systems have been implemented to modern houses with a goal to make occupant s’ life easier simpler, safer, more fun and comfortable. However, a home control system can offer more than the aforemen- tioned advantages. The occupant of a house can manage the amount of energy that is being consumed by prop- er monitoring of critical parameters (e.g., temperature, humidity) and control of a series of functions (e.g., HVAC, lighting, ventilation) necessary in everyday life use. Automating the house operations reduces the amount of manual labor, improve energy performance and produce consistent results. . Hence, the goal of the Energy Management Systems is to monitor the heating, ventilation, cooling, lighting, and electric loads in the house and through automated control over these systems to reduce energy consumption while maintaining the full functionality and comfort in the house. The monitoring system is used to acquire and save the data. The control actions are performed by the main control unit without the need of the continuous user input. Within the process all applicable local, state and national codes that regulate the installation and operation of the control system are followed, this minimizes the risk of potential safety problems. Safety is an important factor in the design as well as the implementation of the control process and care is applied. Applicable sections will be fol- lowed. This includes the National Fire Protection Association (NFPA) and the codes of the National Electrical Manufacturers Association (NEMA). The automated control system is also approved and register with testing laboratories like Underwriters Laboratories (UL). Through the Energy Management System the occupant will be able to control lights, HVAC, appliances, windows, blinds, and irrigation. 8.2 System Description 8.2.1 Monitoring System The development of a home management system has emerged and developed as a new method that can aid in the conservation of energy. The Solar Roof Pod has a unique monitoring platform that has the potential of data and through proper processing and algorithms can demonstrate high energy efficient buildings. Noveda Tech- nologies’ SunFlow Monitor and Energy-Flow Monitor are the main components that are used to collect and dis- play real-time energy production and generation. In addition, the Carbon Footprint Monitor is a powerful soft- ware application, which delivers detailed information of carbon emissions reduction initiatives. Multiple sen- sors and control units provide accurate analysis of energy generation and consumption.
Transcript of 8.0 ENERGY MANAGEMENT SYSTEM...

U.S. D.O.E Solar Decathlon Page 1
8.0 ENERGY MANAGEMENT SYSTEM NARRATIVES AND DESIGN
8.1 Energy Management System Overview
Home control systems have been implemented to modern houses with a goal to make occupant s’ life easier
simpler, safer, more fun and comfortable. However, a home control system can offer more than the aforemen-
tioned advantages. The occupant of a house can manage the amount of energy that is being consumed by prop-
er monitoring of critical parameters (e.g., temperature, humidity) and control of a series of functions (e.g.,
HVAC, lighting, ventilation) necessary in everyday life use. Automating the house operations reduces the
amount of manual labor, improve energy performance and produce consistent results. . Hence, the goal of the
Energy Management Systems is to monitor the heating, ventilation, cooling, lighting, and electric loads in the
house and through automated control over these systems to reduce energy consumption while maintaining the
full functionality and comfort in the house. The monitoring system is used to acquire and save the data. The
control actions are performed by the main control unit without the need of the continuous user input. Within the
process all applicable local, state and national codes that regulate the installation and operation of the control
system are followed, this minimizes the risk of potential safety problems. Safety is an important factor in the
design as well as the implementation of the control process and care is applied. Applicable sections will be fol-
lowed. This includes the National Fire Protection Association (NFPA) and the codes of the National Electrical
Manufacturers Association (NEMA). The automated control system is also approved and register with testing
laboratories like Underwriters Laboratories (UL). Through the Energy Management System the occupant will
be able to control lights, HVAC, appliances, windows, blinds, and irrigation.
8.2 System Description
8.2.1 Monitoring System
The development of a home management system has emerged and developed as a new method that can aid in
the conservation of energy. The Solar Roof Pod has a unique monitoring platform that has the potential of data
and through proper processing and algorithms can demonstrate high energy efficient buildings. Noveda Tech-
nologies’ SunFlow Monitor and Energy-Flow Monitor are the main components that are used to collect and dis-
play real-time energy production and generation. In addition, the Carbon Footprint Monitor is a powerful soft-
ware application, which delivers detailed information of carbon emissions reduction initiatives. Multiple sen-
sors and control units provide accurate analysis of energy generation and consumption.

U.S. D.O.E Solar Decathlon Page 2
Figure 1 - Monitoring System Diagram
The following sections describe the functionality of the Noveda monitoring system in more detail and in partic-
ular as it pertain to the monitoring of energy generation and consumption, the collection and logging of data for
better understanding of the house requirements, needs and plan of action, consumption of water, and tracking of
the carbon footprint of the house.
8.2.1.1 Energy Generation The Solar Roof Pod uses Noveda Technologies’ SunFlow Monitor to present energy generation and consump-
tion levels. The monitoring platform displays real-time diagnostics of system’s performance in a dynamic user-
friendly graphical interface. The SunFlow Monitor combines detailed analysis of the energy production in a
flexible data export to demonstrate efficiency of the system (Fig 2). It highlights the different parameter moni-
toring as well as the different display option for a better understanding of the Solar Roof Pod energy require-
ments and potential energy savings strategies.
U.S. D.O.E Solar Decathlon Page 3
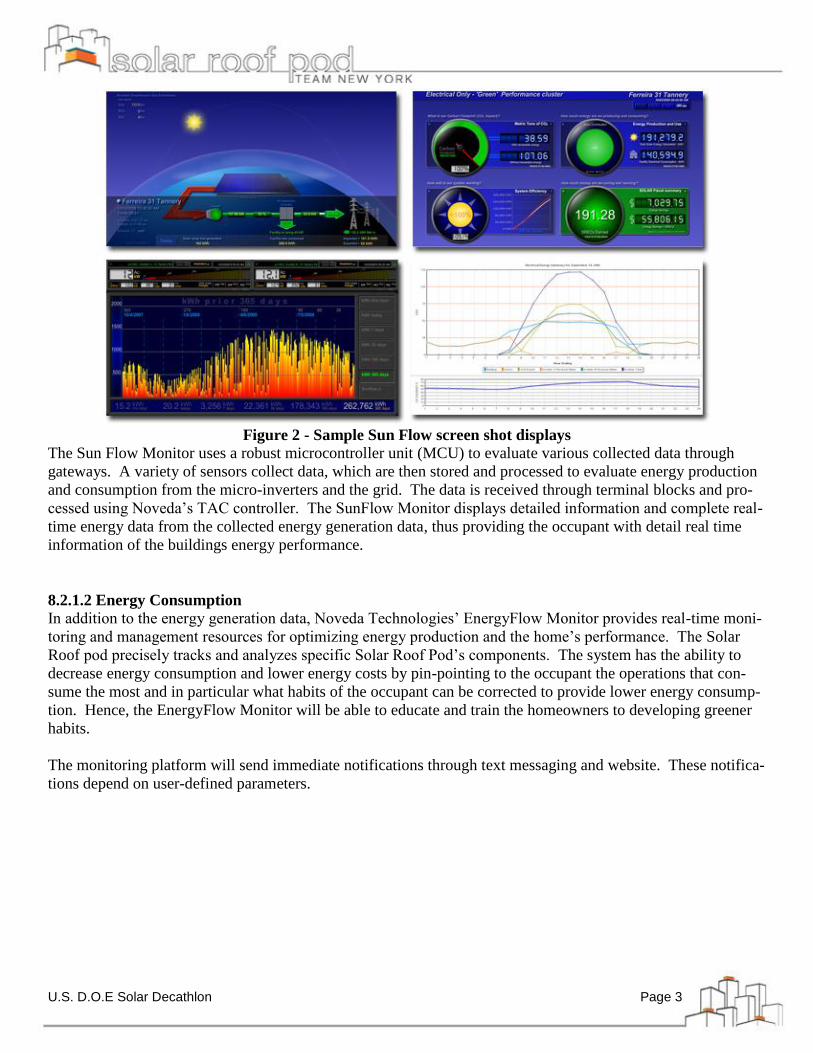
Figure 2 - Sample Sun Flow screen shot displays
The Sun Flow Monitor uses a robust microcontroller unit (MCU) to evaluate various collected data through
gateways. A variety of sensors collect data, which are then stored and processed to evaluate energy production
and consumption from the micro-inverters and the grid. The data is received through terminal blocks and pro-
cessed using Noveda’s TAC controller. The SunFlow Monitor displays detailed information and complete real-
time energy data from the collected energy generation data, thus providing the occupant with detail real time
information of the buildings energy performance.
8.2.1.2 Energy Consumption
In addition to the energy generation data, Noveda Technologies’ EnergyFlow Monitor provides real-time moni-
toring and management resources for optimizing energy production and the home’s performance. The Solar
Roof pod precisely tracks and analyzes specific Solar Roof Pod’s components. The system has the ability to
decrease energy consumption and lower energy costs by pin-pointing to the occupant the operations that con-
sume the most and in particular what habits of the occupant can be corrected to provide lower energy consump-
tion. Hence, the EnergyFlow Monitor will be able to educate and train the homeowners to developing greener
habits.
The monitoring platform will send immediate notifications through text messaging and website. These notifica-
tions depend on user-defined parameters.

U.S. D.O.E Solar Decathlon Page 4
Figure 3 - Sample Energy Flow screen shot displays
The EnergyFlow Monitor uses a microcontroller unit (MCU) to accurately analyze and optimize energy con-
sumption through the entire house. Current transformers collect energy consumption data stored in a data log-
ger, SATEC BFM 136. The EnergyFlow Monitor’s MCU collects and processes information from the sensor
units and displays detailed graphical diagrams that show the energy consumption trends in the house. The user
can select different displays that show the energy consumption at different dates and/or times, and can pinpoint
on specific dates and/or home operations.
The proper collection of the data and associated processing is accomplished through an automatic data logger,
the SATEC Branch Feeder Monitor (BFM136). The SATEC BFM collects energy data from several electrical
loads and processed data for the Noveda controller. Automated energy metering allows owners to understand
the home’s detailed energy consumption in every load of the Solar Roof Pod.
Figure 4 - Photograph of the SATEC BFM 136
The meter can monitor energy demand using several phase channels. BFM136 uses 12 three-phase or 36 sin-
gle-phase channels to collect energy reading and multi-tariff (TOU) data. The Solar Roof Pod processes events
and data logging information for accurate metering. The EnergyFlow Monitor uses SATEC BFM136 to process
data for web-based energy management display. The compact design allows occupants to access information
about several channels of energy consumption reading collected throughout the house. The purpose of in-
stalling a wide input data logger is to make the system capable to sub metering consumption from every load in
the house, as for example consumption from the lights in every room, and/or appliances.

U.S. D.O.E Solar Decathlon Page 5
8.2.1.3 Water Consumption Water consumption is a key feature that our monitoring system will use to provide energy-efficiency and a
greener environment. The Solar Roof Pod integrates several water consumption and leakage detectors into the
water supply system, such as the kitchen, bathroom, and mechanical room. The water leakage detectors detect
possible failures in the piping system and hence identify water wastage and aid in prevention of it. Occupants
are notified of various water causalities, such as high water pressure and corrosion in plumbing. The monitor-
ing platform alerts users from a web-based energy management site and sends text messages via cell phone.
Overall the Solar Roof Pod monitors water consumption and leakages, which aid homeowners, develop greener
habits. Fig. 5 shows the water consumption display of our monitoring system.
Figure 5 - Sample water consumption screen shot display
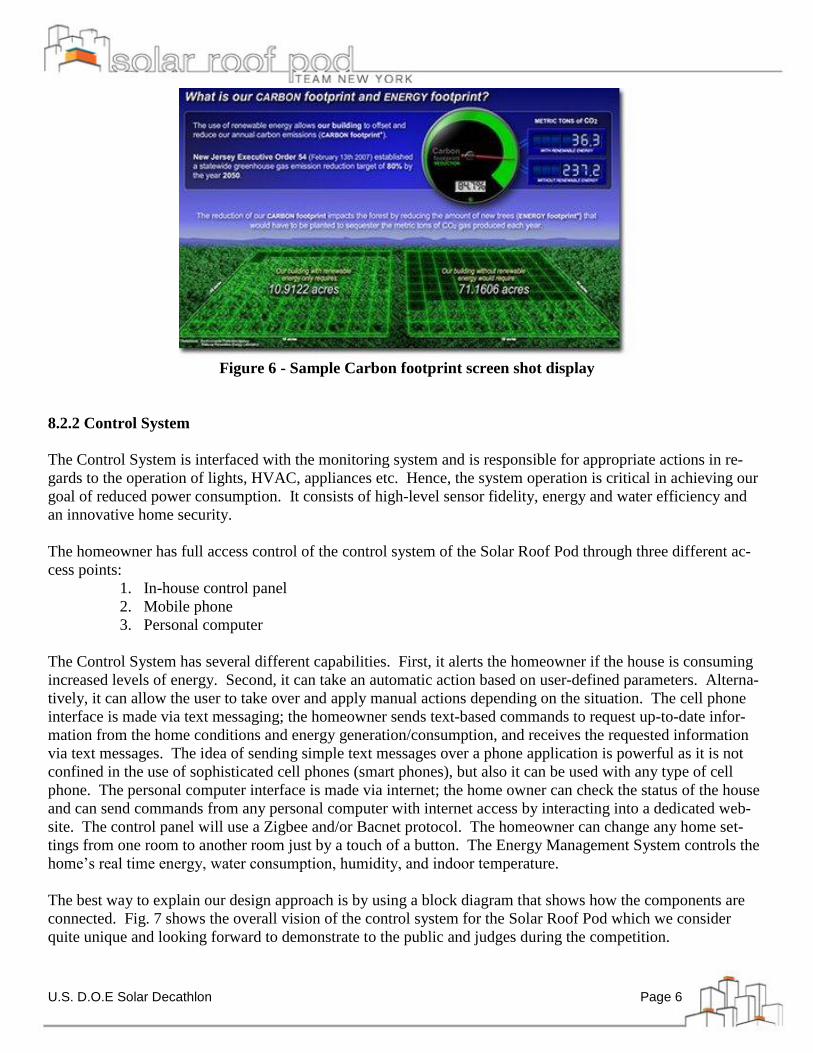
8.2.1.4 Carbon Footprint
Besides collecting energy generation and consumption data, the Solar Roof Pod displays real-time tracking and
reduction of environment conditions. Noveda Technologies’ Carbon Footprint Monitor can display accurate
energy efficiency data and carbon footprint reduction accomplishment. The customizable graphical display al-
lows homeowners to view the house’s greenhouse gases and carbon emissions that were avoided (Fig. 6). The
Solar Roof pod integrates sustainability initiatives by providing carbon footprint resources and environmental
impact in an easy to understand manner. The Carbon Footprint Monitor can aid homeowners to make greener
decisions about future carbon emissions and CO2 production.
U.S. D.O.E Solar Decathlon Page 6
Figure 6 - Sample Carbon footprint screen shot display
8.2.2 Control System
The Control System is interfaced with the monitoring system and is responsible for appropriate actions in re-
gards to the operation of lights, HVAC, appliances etc. Hence, the system operation is critical in achieving our
goal of reduced power consumption. It consists of high-level sensor fidelity, energy and water efficiency and
an innovative home security.
The homeowner has full access control of the control system of the Solar Roof Pod through three different ac-
cess points:
1. In-house control panel
2. Mobile phone
3. Personal computer
The Control System has several different capabilities. First, it alerts the homeowner if the house is consuming
increased levels of energy. Second, it can take an automatic action based on user-defined parameters. Alterna-
tively, it can allow the user to take over and apply manual actions depending on the situation. The cell phone
interface is made via text messaging; the homeowner sends text-based commands to request up-to-date infor-
mation from the home conditions and energy generation/consumption, and receives the requested information
via text messages. The idea of sending simple text messages over a phone application is powerful as it is not
confined in the use of sophisticated cell phones (smart phones), but also it can be used with any type of cell
phone. The personal computer interface is made via internet; the home owner can check the status of the house
and can send commands from any personal computer with internet access by interacting into a dedicated web-
site. The control panel will use a Zigbee and/or Bacnet protocol. The homeowner can change any home set-
tings from one room to another room just by a touch of a button. The Energy Management System controls the
home’s real time energy, water consumption, humidity, and indoor temperature.
The best way to explain our design approach is by using a block diagram that shows how the components are
connected. Fig. 7 shows the overall vision of the control system for the Solar Roof Pod which we consider
quite unique and looking forward to demonstrate to the public and judges during the competition.

U.S. D.O.E Solar Decathlon Page 7
Figure 7 - Control System Diagram
The device takes action to comply with user’s desire while saving energy. The wide range use of sensors is a
key element to the control system. We plan to have sensors for:
1. Occupancy/Vacancy
2. Light
3. Temperature
4. Humidity
5. Water
6. Air flow
7. Wattage consumption for the appliances.
Each type of sensor has a specific function in the house. For example, motion sensors control indoor and out-
door lighting and also provide intrusion alert, in other words the sensors can be used as a security system too.
The lights can also be controlled with dimmer switches, so the level of light can be adjusted according to the
occasion and according to recommended levels from the standards. Light sensors will control the automatic
blinds and/or the lights. By implementing these technologies we will get as much as natural light possible and
we will be able to have a good balance of artificial (when needed) and natural lighting. Temperature and hu-
midity sensors communicate data to the controller and take action over the HVAC, as well as the automated op-
erable windows. Another part of our innovation system is to have a smart irrigation system. The moisture of
the soil in the pots will be monitored via moisture sensors and depending on preset seasonal settings the control-
ler will allow the proper irrigation strategy. Finally, in compliance with code standards, the Solar Roof Pod will
have smoke detectors.
One of the most attractive features about the energy management system is the Graphical User Interface (GUI)
that has been created by our team from City College of New York. The system will interface the control and
monitoring functionalities under the same software platform. This is a unique design which is ease of use for
users to monitor and control the complex systems that has been implemented. Having this option, the home-
owner can be anywhere and be able to check the conditions and/or status of the house by just accessing from a

U.S. D.O.E Solar Decathlon Page 8
mobile phone and/or personal computer that supports the Solar Roof Pod application. Fig. 8 shows the main
window display, where each icon is associated with one monitoring and/or control command.
Figure 8 – Main Window GUI display.
Under user interface (UI) the homeowner would have the option to schedule the HVAC, lights, and either auto
or manual control for windows and blinds. Fig. 9 visually shows the procedure. The user decides the mode
which is described in Fig. 9a. For example if HVAC is in power mode, the controller will continue to use venti-
lation for heating and cooling without any attenuation from the set point temperature. Ventilation through win-
dows is not used. Instead, the Controller always uses the HVAC system for heating and cooling. This mode re-
quires the most energy. If HVAC is in Eco mode, it will be put on standby, where temperatures are allowed to
deviate from the set point. For example, HVAC will keep a 5 F deviation from the median [73 F]) which leads
to [68, 78]. Eco mode saves energy by sacrificing comfort level. By default the HVAC is in auto. Auto mode
simply follows the HVAC algorithm. This mode differs from eco because priority is still given for comfort level
of temperature to be with 71 – 76 range and humidity to be less than 60%.
Advance mode is password protected because it would allow technicians manual control of certain HVAC pipe
systems. When non-experienced user changes values, it can disturb the entire HVAC system. Custom mode is
where the homeowner can set certain days to have certain actions performed from the HVAC and also for
lights. For example, if the homeowner has guests coming over and they prefer warmer temperature, the owner
can set higher temp settings for the weekend and select back to previous mode under options. The HVAC will
return to the previous mode at the end of the weekend (midnight on Sunday). For lights, if the home owner
wants to keep the lights in certain areas “on” during night he has the option to do so. Furthermore, the home-
owner is able to schedule the lights to turn on at a specified time if he or she is away from the house. This fea-
ture could be used for security purposes. The windows and blinds can be set to be manually controlled instead
of having the algorithms open and close them. The display image for the in-house touch screen panel is shown
in Fig. 9b, which shows a top view of the entire house and provides access to each component, its settings and
the energy performance parameters. In this particular figure, it shows the performance of the house at outside
cold temperature, cloudy conditions, low solar radiation, and low humidity. It can be seen that according to the-

U.S. D.O.E Solar Decathlon Page 9
se readings the house starts to heating up, and since cloudy conditions does not allow natural light coming to the
house, the necessity of using artificial lights is crucial for visual comfort when the user is present in the house.
The display has soft (touch-screen) buttons, where the homeowner can choose to check the lights, windows,
HVAC, blinds and irrigation to have a better perspective of the status of each system separately.
(a)

U.S. D.O.E Solar Decathlon Page 10
(b)
Figure 9 - (a) Overview behavior of the Control System schedule; (b) Roof Pod Graphical User Interface
The distribution of the sensors around the house is shown in Fig. 10. The types of sensors and switches are di-
vided into groups, identified by five-colors. The blue represents occupancy/vacancy sensors, orange represents
day light sensors, purple represents the temperature/humidity temperature, brown represents the CO2 sensors,
red represent smoke detectors, and grey the fire voice alarms and green represents manual/dimmer switch for
the lights. The sensors were placed based on two conditions
(a) Dimensions of where lights are placed in the room and
(b) Incoming natural light.
Note that not all the lights in the room are controlled. Some parts of the windows consist of a day light sensor
occupying the ceiling. This also applies to the entrance and exit since they have glass within them where light
can pass through. It can be seen that from Fig. 10 shows the house schematic and the rooms and also the posi-
tion and type of sensor. There are eight day light sensors, six occupancy/vacancy sensors, and eight manual
switches/dimmers around the nine windows marked in red and including entrance/exit marked in white.

U.S. D.O.E Solar Decathlon Page 11
Figure 10 - Sensor Location Configuration

U.S. D.O.E Solar Decathlon Page 12
8.2.2.1 Lights Control
Lighting accounts as one of the major contributors of energy consumption in residential buildings. By integrat-
ing a smart lighting system into the house, the electrical consumption and consequently the electric bills can be
reduced from 60% to 40% according to ASHRAE. In general, the lighting control system consists of a device
that controls electric lighting alone, or as part of a daylight harvesting system for public, commercial, industrial
or residential buildings and facilities. They are often part of sustainable architecture and lighting design for in-
tegrated green building energy conservation programs. In our lighting design, we utilize a control system as an
interface to interact with the sensors provided by Lutron in order to produce automatic lighting system.
Incorporating sensors throughout the house reduces the operating hours of the lighting, hence reducing the elec-
tric consumption. Such sensors include Lutron’s occupancy/vacancy sensors as well as daylight sensors. These
sensors are wireless in order to promote wireless technology and show its reliability. The sensors communicate
to the smart switches via radio frequency (RF). The combination of sensors and dimmers can potentially reduce
energy consumption. In addition, the sensors and in particular daylight sensors allow for efficient use of the
natural daylight, which helps accomplish appropriate lighting levels in the indoors environment. Hence natural
and artificial lighting operate in complimentary fashion. The amount of energy that the dimmers conserve is
proportional to the light level, such that 50% dimmer uses only 60% of the energy, conserving 40%.
The living space is composed of the entrance/exit, hallways, kitchen, bathroom, living room and mechanical
room. Each living space consists of certain amount of lights and contains one occupancy/vacancy sensor. The
Solar Roof Pod has been design to have nine windows. There are either two or three windows from each axis
point north, east, south, and west. The day light sensors are placed between windows. If two or more windows
are closely apart at each side of the building only one-day light sensor is placed. If the distance exceeds more
than 3 feet, then each window has its own day light sensor within that axis. Each set of lights shares one manu-
al switch/dimmer. If the day light sensors force the artificial lighting to be dimmed excessively, the user can
take over the control and based on preference and comfort adjust the lighting either with the manual
switch/dimmer or by using the touch screen panel. A more detail status of the lights in every room is presented
through a graphical user interface (GUI) in the touch screen panel, as shown in Fig. 11. This GUI presents the
status (e.g., level of dimming) of each light in the Solar Roof Pod,
Figure 11 - The light automation status and control GUI.

U.S. D.O.E Solar Decathlon Page 13
The control of the light is done through the collection of associated data from the lighting and occupancy sen-
sors. An algorithm has been developed to allow for an efficient control of lights. The algorithm first deter-
mines if motion is detected within the volume of space it occupies. If such movement is detected, then the data
will go straight to the controller and, in response, it will send a signal in order to turn on the lights. If natural
light is detected via the day light sensors then it will prompt the lights to dim. And if nothing is detected then
no lights will be turned on.
Fig 12 - Lights Algorithms Flowcharts
8.2.2.2 HVAC
The HVAC system is a critical one because it consumes the largest amount of energy. It is controlled automati-
cally so that energy savings can be accomplished. Taking into consideration that cooling or heating does not
need to be fully “on” in every room or zone in the house energy can be conserved. For details on the in-
put/output behavior, information on the control strategy to achieve part load heating, and dynamic control of
fluid flow, please visit the HVAC control section. The main controller can take decisions on the HVAC without
the user’s input. The controller collects information from the CO2, humidity, and temperature sensors in the
rooms and temperature in domestic hot water and solar thermal tank to make decisions. The HVAC control re-
quires multiple inputs and outputs. The outputs are either the analog or digital signals the controller sends to
regulate a particular component in the HVAC system.
For the competition, the temperature requirement for the indoor temperature is in the [71-76 F] range. The tar-
get humidity level is less than 60%. To save energy, the controller will enable natural ventilation if conditions
permit. Otherwise it will send a signal to operate the active thermally driven HVAC. Manual control for setting
temperature and humidity values will be an option through the in house control panel. To illustrate certain
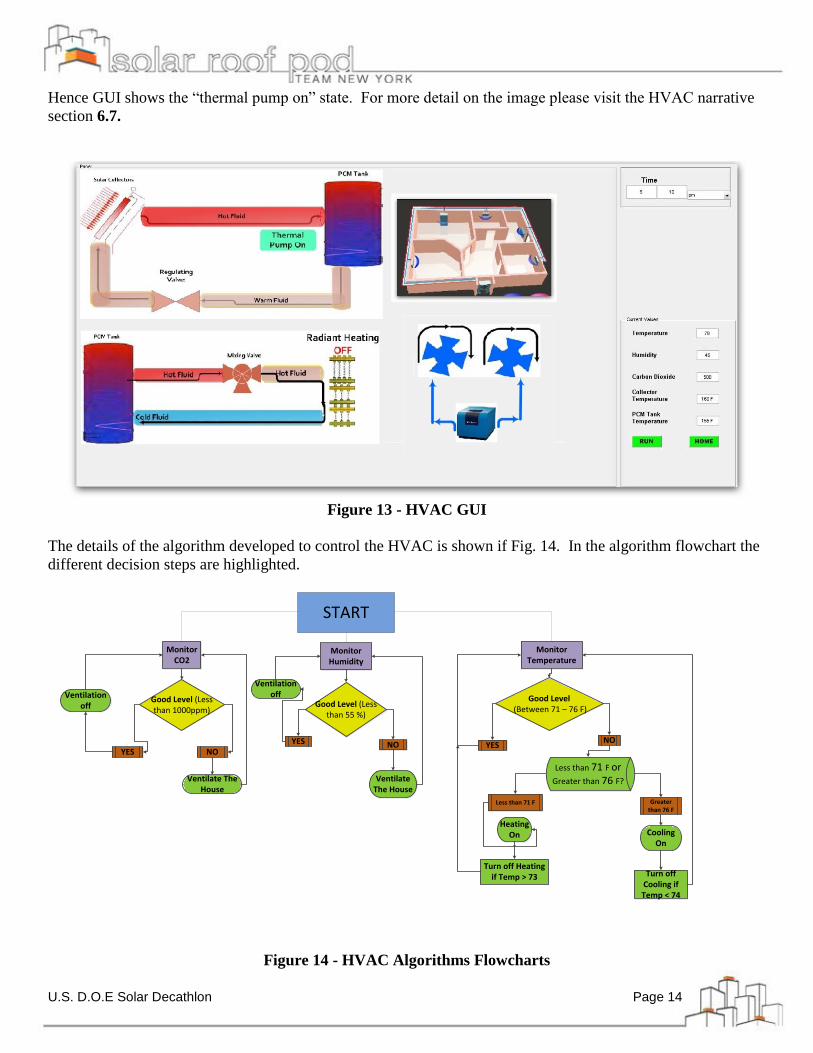
conditions for the HVAC, a graphical user interface is shown in the Fig. 13. The GUI represents a state when
the house is being cooled. The temperature is 78 F therefore cold air is pumped throughout the house to lower
the temperature. The ACS chiller is used to pump cold air to the fan coils through which air distributes through-
out the house. Also the GUI shows that the collector temperature is greater than the PCM tank temperature.
U.S. D.O.E Solar Decathlon Page 14
Hence GUI shows the “thermal pump on” state. For more detail on the image please visit the HVAC narrative
section 6.7.
Figure 13 - HVAC GUI
The details of the algorithm developed to control the HVAC is shown if Fig. 14. In the algorithm flowchart the
different decision steps are highlighted.
Monitor CO2
Good Level (Less than 1000ppm)
YES NO
Ventilate The House
Monitor Humidity
Good Level (Less than 55 %)
YES NO
Ventilate The House
Monitor Temperature
Good Level (Between 71 – 76 F)
YESNO
Less than 71 F or Greater than 76 F?
Less than 71 F Greater than 76 F
Heating On Cooling
On
Turn off Heating if Temp > 73 Turn off
Cooling if Temp < 74
Ventilation offVentilation
off
START
Figure 14 - HVAC Algorithms Flowcharts

U.S. D.O.E Solar Decathlon Page 15
8.2.2.3 Blinds
The idea of implementing automated blinds, as one of the features of the house will greatly improve the energy
savings of the Solar Roof Pod because it leverages the natural light as well as thermal energy to balance the arti-
ficial lighting as well as internal temperature. The automated blinds system consists of several components.
First there is a solar radiometer, which will be mounted, on the roof. This sensor detects the amount of natural
light in the vicinity, determines the profile angle of the sun and compares those readings with a prebuilt light
analysis database. Then the system compares the measurements and the stored data and performs different
functions based on preset decision points. The control system adjusts the blind positions on the window auto-
matically by monitoring the real-time sky conditions over the course over the year. Fig.15 shows the compari-
son between the two input data.
Figure 15 - Solar Radiation Curve. Theoretical and Measured Values
The unit allows both manual and automatic control for the blind system. The benefits of having automated
blinds is that maximizes or optimizes the amount of natural light and view thru the window by appropriate con-
trol of the blinds tilt angle as well as elevation of the blind system in the window opening. During sunny days
the blinds will be completely down and will only be opening and closing. During cloudy days the blinds will
move vertically to up and down position and keep the blinds will remain in the open position. For example dur-
ing the warm and sunny summer season, blinds can be adjusted to block direct radiation in the interior of the
room, especially when the occupants are not present. Hence, blinds functionality provides lower heating load
and hence the HVAC needs are reduced. On the other hand, during the winter and depending on the sky condi-
tions, the system can adjust the blinds to allow direct or indirect sunlight to penetrate in the building and hence
help keep the interior at a higher temperature and reduce the HVAC needs. Fig. 16 shows a detailed graphical
interface for the 3 windows with automated blinds that will be implemented as well as the position in the house.
Measured Values

U.S. D.O.E Solar Decathlon Page 16
Figure 16 - Automated Blinds GUI
Note that by having automated blinds we can save energy by balancing natural and artificial lighting (e.g.,
dimming the lights as needed) and adjusting the HVAC at a comfortable level automatically. An algorithm
flowchart has been created to illustrate certain conditions that need to meet in order to operate the blinds. The
blinds will work as a separate system and based on the output, the other sub systems controls will accommodate
their behavior. During the entire competition the operation of this system will be shown to the public. It has
been created an algorithm flowchart to illustrate certain conditions that need to meet in order to operate the
blinds
Time of Operations
Sunrise thru Sunset
Receive solar
radiation values Compare Input
with Theoretical
Values
Calculate
average of both
values.
Determine Sunny or Cloudy
INPUT
CLOUDYSUNNY
HCAV Interaction Lights Interaction
Compare
average with
ASHRAE Table
Check Current
Outside Temperature
Regardless of
Temperature move
shades UP
OUTPUT
MOVE
UP
HOT COLD
MOVE
UP
OUTPUT
MOVE
DOWN
OUTPUT
Fig 17 - Blinds Algorithm Flowchart
8.2.2.4 Motorized Windows
The automated motorized window is an innovative idea. The main purpose of having motorized windows is for
fresh air ventilation. This automated feature will also have an impact in the operation of the HVAC system.
The idea for this house is to use as much as natural resources as possible. By taking advantage of the natural air
U.S. D.O.E Solar Decathlon Page 17
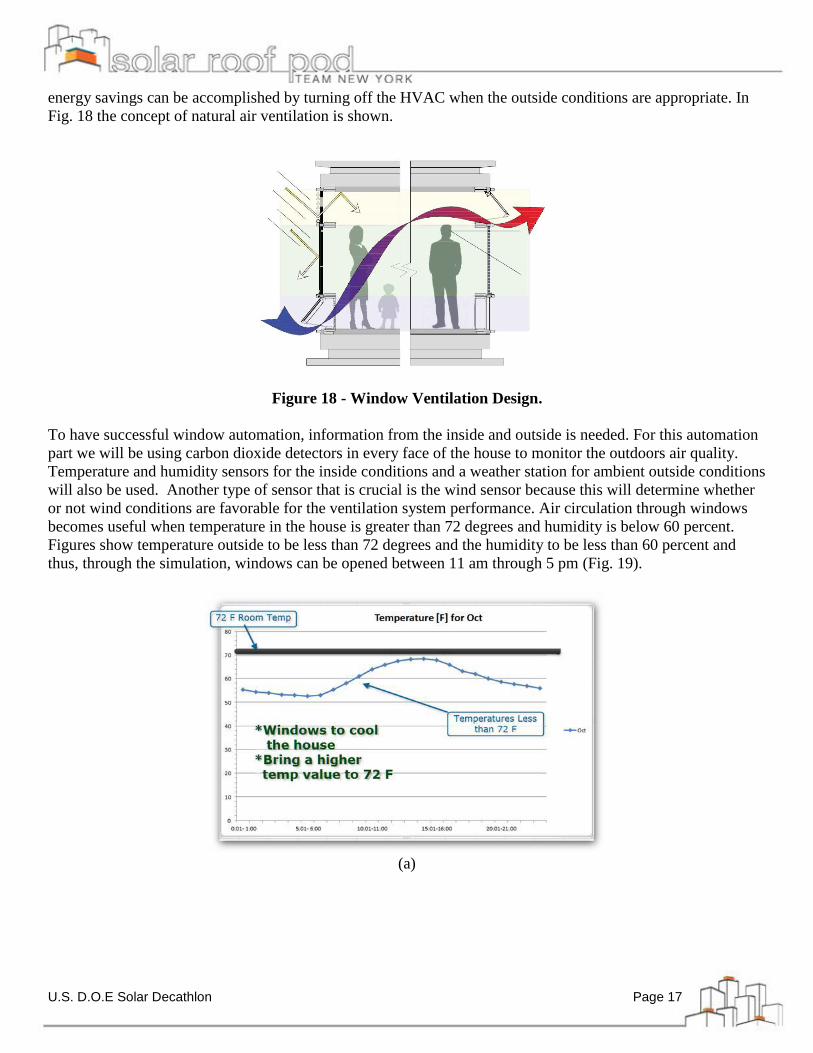
energy savings can be accomplished by turning off the HVAC when the outside conditions are appropriate. In
Fig. 18 the concept of natural air ventilation is shown.
Figure 18 - Window Ventilation Design.
To have successful window automation, information from the inside and outside is needed. For this automation
part we will be using carbon dioxide detectors in every face of the house to monitor the outdoors air quality.
Temperature and humidity sensors for the inside conditions and a weather station for ambient outside conditions
will also be used. Another type of sensor that is crucial is the wind sensor because this will determine whether
or not wind conditions are favorable for the ventilation system performance. Air circulation through windows
becomes useful when temperature in the house is greater than 72 degrees and humidity is below 60 percent.
Figures show temperature outside to be less than 72 degrees and the humidity to be less than 60 percent and
thus, through the simulation, windows can be opened between 11 am through 5 pm (Fig. 19).
(a)

U.S. D.O.E Solar Decathlon Page 18
(b)
Fig 19 - Weather simulation data The windows will not open fully for safety issues (child safety) but rather until a certain level. In Fig. 20 a
graphical user interface for the specific behavior of each automated window is depicted. It displays four (4) op-
erable windows and the current status of each one. Fig. 21 depicts the flowchart of the algorithm, which will
operate under certain conditions for the automated windows.
Figure 20 - Automated Windows GUI
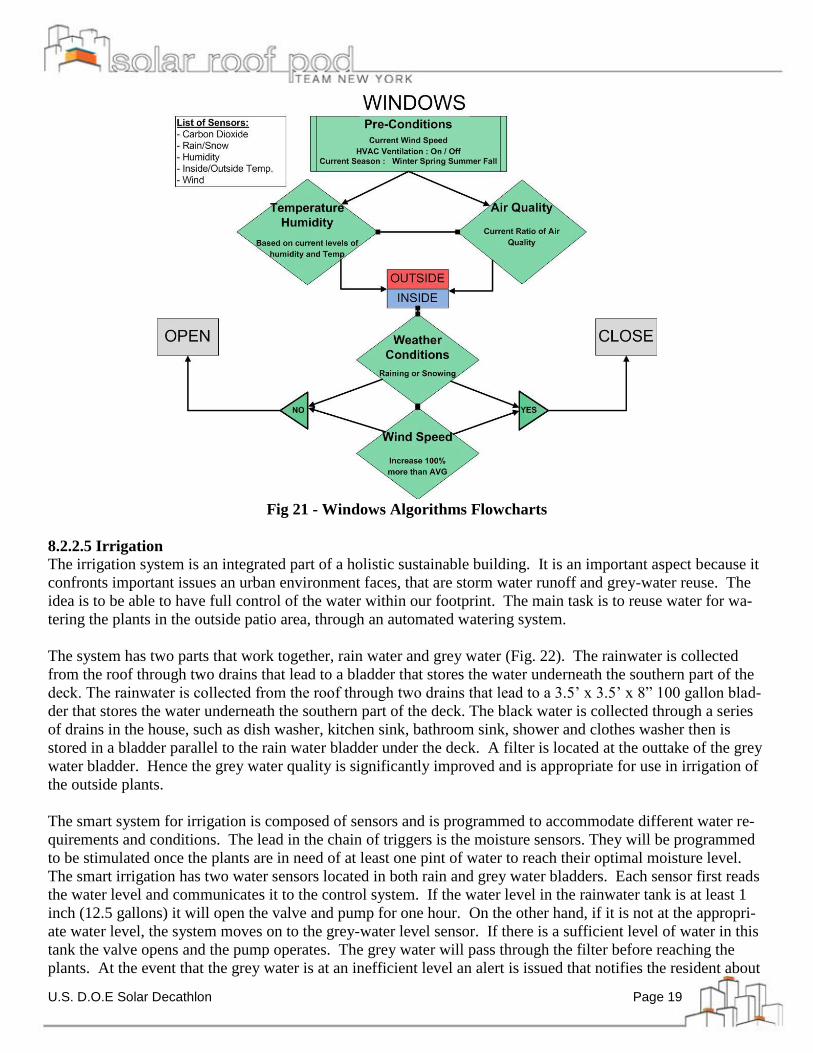
U.S. D.O.E Solar Decathlon Page 19
Fig 21 - Windows Algorithms Flowcharts
8.2.2.5 Irrigation
The irrigation system is an integrated part of a holistic sustainable building. It is an important aspect because it
confronts important issues an urban environment faces, that are storm water runoff and grey-water reuse. The
idea is to be able to have full control of the water within our footprint. The main task is to reuse water for wa-
tering the plants in the outside patio area, through an automated watering system.
The system has two parts that work together, rain water and grey water (Fig. 22). The rainwater is collected
from the roof through two drains that lead to a bladder that stores the water underneath the southern part of the
deck. The rainwater is collected from the roof through two drains that lead to a 3.5’ x 3.5’ x 8” 100 gallon blad-
der that stores the water underneath the southern part of the deck. The black water is collected through a series
of drains in the house, such as dish washer, kitchen sink, bathroom sink, shower and clothes washer then is
stored in a bladder parallel to the rain water bladder under the deck. A filter is located at the outtake of the grey
water bladder. Hence the grey water quality is significantly improved and is appropriate for use in irrigation of
the outside plants.
The smart system for irrigation is composed of sensors and is programmed to accommodate different water re-
quirements and conditions. The lead in the chain of triggers is the moisture sensors. They will be programmed
to be stimulated once the plants are in need of at least one pint of water to reach their optimal moisture level.
The smart irrigation has two water sensors located in both rain and grey water bladders. Each sensor first reads
the water level and communicates it to the control system. If the water level in the rainwater tank is at least 1
inch (12.5 gallons) it will open the valve and pump for one hour. On the other hand, if it is not at the appropri-
ate water level, the system moves on to the grey-water level sensor. If there is a sufficient level of water in this
tank the valve opens and the pump operates. The grey water will pass through the filter before reaching the
plants. At the event that the grey water is at an inefficient level an alert is issued that notifies the resident about

U.S. D.O.E Solar Decathlon Page 20
it. The control system then issues suggestions for the amount of grey water generation for different tasks in the
house that could alleviate this problem. These suggestions will be based on historical data from the home. For
example the system may suggest for operation of the washing machine at an earlier time than usual so that the
necessary amount of grey water is generated. Fig. 23 shows the flowchart of the algorithm developed for the
irrigation.
Figure 22 - Irrigation GUI

U.S. D.O.E Solar Decathlon Page 21
Fig 23 - Irrigation Algorithms Flowcharts