8 Sample design procedures for a national survey of...
50
8 Sample design procedures for a national survey of primary schools in Zimbabwe Kenneth N. Ross
Transcript of 8 Sample design procedures for a national survey of...

8
Sample design procedures for a national survey of primary
schools in Zimbabwe Kenneth N. Ross

Sample design procedures for a national survey of primary schools in Zimbabwe

Issues and methodologies in educational development: an H E P series for orientation and training
Sample design procedures for a national survey of primary schools
in Zimbabwe
Kenneth N . Ross
International Institute for Educational Planning
(Established by UNESCO)

The views and opinions expressed in this volume are those of the author and do not necessarily represent the views of U N E S C O or of the IIEP. The designations employed and the presentation of material throughout this document do not imply the expression of any opinion whatsoever on the part of U N E S C O or IIEP concerning the legal status of any country, territory, city or area or its authorities, or concerning its frontiers or boundaries.
This study has been undertaken with the financial support of the Government of Italy.
This volume has been typeset using D E P ' s computer facilities and has been printed in H E P ' s printshop.
International Institute for Educational Planning 7 - 9 rue Eugène-Delacroix, 75116 Parais
©UNESCO May 1992

Contents
1. Constraints 1
2. The specification of target populations 2
3. The stratification procedures 4
4. The use of sample design tables to decide on the required
number of schools and pupils 7
5. The construction of the sampling frame 15
6. The selection of the sample 22
7. The lottery method of P P S selection: a hypothetical example 23
8. The calculation of sampling weights 25
9. The sample of schools selected for this study 27
10. Operational procedures for the selection of pupils within
schools 27
11. The response rates achieved for the study 32
12. The calculation of sampling errors 36
13. Error estimation for complex probability samples 38
14. Conclusions 40
References 41
Sample design procedures for a national survey of primary schools in Zimbabwe
by Kenneth N . Ross
This report describes the sample design procedures thatг were developed for an educational research study undertaken during July-September 1991 as a collaborative project by the International Institute for Educational Planning (IIEP) and the Zimbabwe Ministry of Education and Culture ( M E C ) . 1 The inspiration to conduct the study was derived from the key theme associated with a U N E S C O Conference on 'Planning the quality of education'. This theme proposed the following ' n e w mission' for the world's educational planners (Ross and Mählck, 1990, p . 3):
"Planning the quality of education through informed decision making requires the availability of accurate and timely information that links together resource inputs to education, teaching-learning conditions and processes, and appropriate indicators of the knowledge, skills, and values acquired by students."
The main aim of the study was to establish a mechanism whereby information that was suitable for 'informed decision making' could be collected rapidly from a scientific sample of schools and pupils in Zimbabwe, and then analyzed and reported in a form that was suitable for immediate use. In the following sections of this report, the techniques and materials required to construct such a sample presented in association with an evaluation of the magnitude of the sampling errors obtained after all data had been collected, cleaned, and analyzed.
1. Constraints
Sample designs in the field of education are often prepared amid a network of competing constraints. These designs need to adhere to established survey sampling theory and, at the same time, give due recognition to the financial, administrative, and socio-polical settings in which they are to be applied. The 'best' sample design for a particular project is therefore to be seen as one that provides levels of sampling accuracy that are acceptable in terms of the main aims of the project, while simultaneously limiting cost, logistic, and procedural demands to manageable levels.
The major constraints that were established prior to the preparation of the sample design for the study have been listed below.
1. The study has been reported in detail in a three-volume report (Ross and Postlethwaite, 1991); a summary of the study has been published by the 1ГЕР (Ross and Postlethwaite, 1992).
1

Sample design procedures for a national survey of primary schools in Zimbabwe
(a) Target population
T h e target population was to be concerned with Grade 6 pupils enrolled in full-time mainstream primary education in Z i m b a b w e .
(b) Bias control
T h e members of the target population were to have a non-zero and k n o w n probability of selection into the sample so that any potential for bias in sample estimates due to variations from 'epsem sampling' (equal probability of selection method) could be addressed through the use of appropriate sampling weights (Kish, 1965).
(c) Sampling errors
The overall sample estimates for pupils were required to have sampling errors equal to, or smaller than, an effective sample size of 400 pupils (Ross, 1991). (That is, 95 per cent confidence limits of ± 5 per cent for percentages and ±0.1 pupil standard deviation units for means.) It was decided that there would be no separate study sub-populations, or domains, that required specific estimates to be generated in association with measures of sampling error.
(d) Administrative and financial costs
The major administrative and financial costs associated with the data collection were linked with the mobilization of a field force of District Education Officers from each of the nine administrative regions of Z i m b a b w e . It was established that, given the restricted time available for data collection, the smaller education regions would be able to manage a m a x i m u m of 15 schools, while the larger regions would be able to manage a m a x i m u m of 20 schools.
(e) Other constraints
T h e instrumentation for the study required pupils to complete, accurately and independently, a questionnaire and a reading test. In order to ensure maximal validity in the collection of this information it was necessary to administer these instruments as a 'group testing session' so as to prevent the possibility of pupils being able to discuss and compare their responses. This matter was investigated by Ministry of Education and Culture staff, and it was established that the instruments could be administered to a m a x i m u m of 20 pupils in a single testing session.
2. T h e specification of target populations
This report is concerned with two main aspects of the sample design. The first part has provided a detailed account of the steps taken to prepare the sample design in a manner that optimized the validity of the data collection and, at the same time, addressed the
2

Sample design procedures for a national survey of primary schools in Zimbabwe
constraints listed above. The second part has provided an evaluation of the quality of the execution of the sample design by presenting response rates by strata for pupils, teachers, and schools, and sampling error calculations for several variables employed in the study. However , before either of these aspects of sample design could be addressed, it was necessary to prepare a detailed description of the target population for the study.
A . The desired target population
The desired target population for this study was centred around a grade description, and not an age description, of pupils attending schools in Z i m b a b w e . The grade level selected was Grade 6. This grade level represented the penultimate year of primary schooling and therefore, because of the relatively high level of school retention rates to this stage of education, provided an appropriate target population for investigating the contribution of primary education towards the acquisition of basic reading skills by a broad cross-section of the population. It was considered to be inappropriate to focus on Grade 7, the final grade of primary schooling, because the proposed data collection timetable would have clashed with the preparation of pupils for the National Grade 7 Examination.
After extensive consultation with Ministry of Education and Culture Officers concerning the key purposes of the study, it was agreed that the desired target population should be described as follows:
"All pupils at the Grade 6 level in 1991 w h o are attending registered Government or Non-Government schools in the nine educational administration regions of Zimbabwe."
While the emphasis in the definition of the desired target population was placed on pupils, the study was also concerned with reporting estimates describing schools and teachers. However , an emphasis on pupils in the target population definition was retained because estimates for schools and teachers were weighted so as to provide estimates of teacher and school variables 'for the average pupil' ~ rather than estimates for teachers and schools as distinct target populations in themselves. The sample weighting procedures set up to establish these estimates have been described in a later section of this report.
B . The defined target population
In m a n y educational research studies it is not possible, and in some cases not meaningful, to ensure that all members of the desired target population have a specifiable and non-zero chance of being selected into the sample. That is, prior to the sample selection, it is sometimes necessary to reduce the coverage of the desired target population in order to form the defined target population. The segment of the desired target population that is removed prior to the commencement of the sampling procedures is usually referred to as the excluded population.
3

Sample design procedures for a national survey of primary schools in Zimbabwe
During the initial planning stages of this study, there was considerable discussion about whether the excluded population should include schools situated in some border districts of the country because of difficulty of access and because, in certain districts, there were security difficulties. However , after consultation with Regional Education Officers, it was decided that it would be both desirable and feasible to aim for a full national coverage of Z imbabwe's administrative regions and their constituent districts.
It was also decided that the study should be directed towards primary schooling within the mainstream national education system. Therefore the term 'pupils' in the description of the defined target population was restricted in its meaning so as to exclude pupils attending special schools for handicapped pupils and pupils attending special classes held within primary schools. These pupils were few in number w h e n compared with the total population of Grade 6 pupils.
In Table 1 descriptions of the desired, defined, and excluded populations have been presented. The numbers of pupils and schools listed as part of the excluded population referred to pupils attending special schools and/or special classes in primary schools. It is important to note that a number of primary schools that had no pupils at Grade 6 level were excluded from the final sampling frames. These schools were excluded from the table because they did not affect the specification of either the defined target population or the excluded population. The numbers of schools in each administrative region that had no Grade 6 pupils have been listed as a footnote to the table.
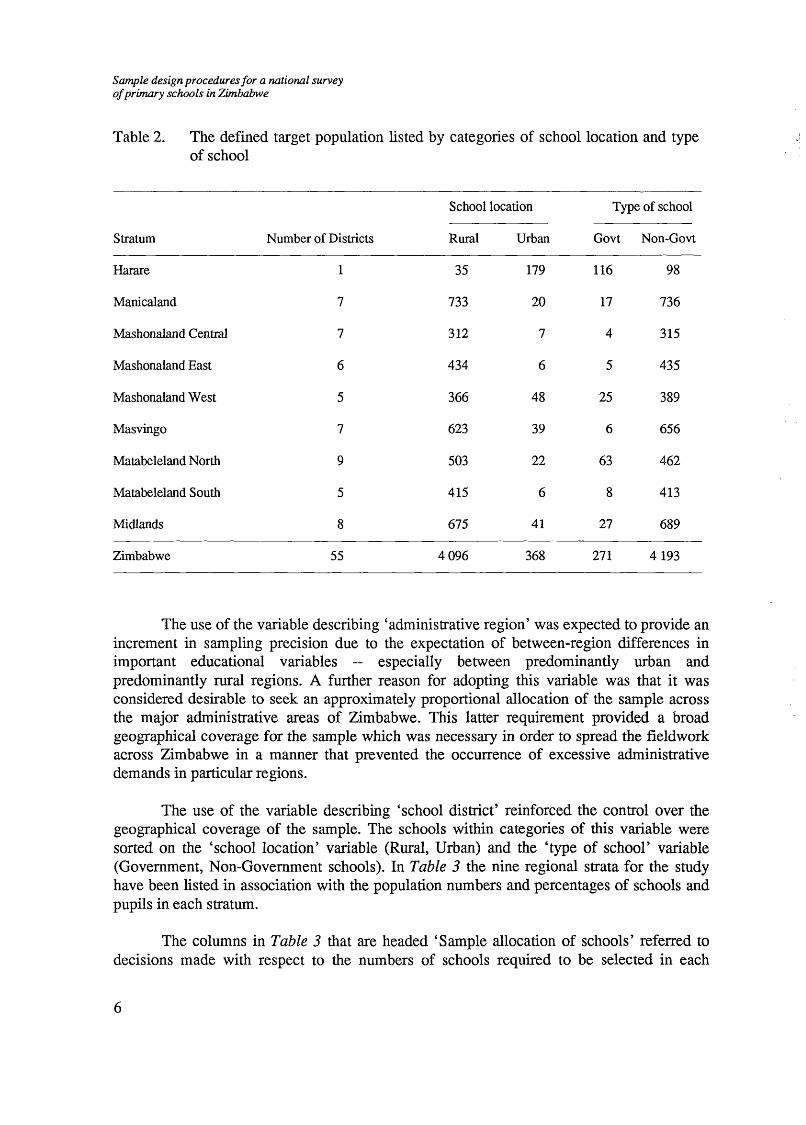
The schools associated with the defined target population in Table 1 have been described in more detail in Table 2 . The primary schools of Z i m b a b w e were distributed across nine educational administrative regions and 55 school districts. In this table the numbers of schools in each educational administrative region have been listed by categories of school location (Rural, Urban) and type of school (Government, Non-Government) . It can be seen from these figures that the primary schools of Z i m b a b w e were located mostly in rural areas (92 per cent), and were predominantly regulated by Non-Government authorities (94 per cent).
3. T h e stratification procedures
A . The selection of stratification variables
The stratification procedures adopted for the study employed explicit and implicit strata. The explicit stratification variable, 'administrative region', was applied by physically separating the sampling frame that described the desired target population into separate regional lists of schools prior to undertaking the sampling of schools. That is, the sampling of schools was undertaken independently for each region of Z i m b a b w e . The implicit stratification variable, 'school district', was applied within each explicit stratum by sorting schools according to the districts in which they were located.
4

Sample design procedures for a national survey of primary schools in Zimbabwe
Table 1. Z i m b a b w e grade 6 pupils: tabular descriptions of the desired, defined, and excluded populations
Education
Region
Harare
Manicaland
Mashonaland Central
Mashonaland East
Mashonaland West
Masvingo
Matabeleland North.
Matabeleland South
Midlands
Zimbabwe
Schools
222
755
319
442
415
665
530
421
718
4 487
Desired
Pupils
28 421
46 130
20 780
27 776
27 752
41664
29 411
17 533
44 314
283 781
Schools
214
753
319
440
414
662
525
421
716
4 464
Defined
Pupils
28 360
46124
20 780
27 774
27 708
41628
29 311
17 533
44 288
283 781
Excluded
Schools
8
2
0
2
1
3
5
0
2
23
Pupils
61
6
0
2
44
36
100
0
26
275
Note: The numbers of primary schools in each administrative region that did not have Grade 6 pupils were Harare: 7;
Manicaland: 21; Mashonaland Central: 5; Mashonaland East: 9; Mashonaland West: 9; Masvingo: 6; Matabeleland
North: 21; Matabeleland South: 9; and Midlands: 6.
T h e main reasons for applying this stratification strategy were to obtain the following sampling precision and administrative benefits.
(a) T o obtain an increase in the precision of sample estimates of pupil literacy rates by ensuring that the explicit stratification variable designated subpopulations (regions) that were k n o w n to vary with respect to stratum means .
(b) T o obtain s o m e control over the geographical coverage of the sample by ensuring that the geographically contiguous areas (districts) were grouped together within strata prior to the application of a systematic selection of schools.
5
Sample design procedures for a national survey of primary schools in Zimbabwe
Table 2. The defined target population listed by categories of school location and type of school
Stratum
Harare
Manicaland
Mashonaland Central
Mashonaland East
Mashonaland West
Masvingo
Matabeleland North
Matabeleland South
Midlands
Zimbabwe
Number of Districts
1
7
7
6
5
7
9
5
8
55
School location
Rural
35
733
312
434
366
623
503
415
675
4 096
Urban
179
20
7
6
48
39
22
6
41
368
Type of school
Govt
116
17
4
5
25
6
63
8
27
271
Non-Govt
98
736
315
435
389
656
462
413
689
4 193
The use of the variable describing 'administrative region' was expected to provide an increment in sampling precision due to the expectation of between-region differences in important educational variables — especially between predominantly urban and predominantly rural regions. A further reason for adopting this variable was that it was considered desirable to seek an approximately proportional allocation of the sample across the major administrative areas of Zimbabwe. This latter requirement provided a broad geographical coverage for the sample which was necessary in order to spread the fieldwork across Z imbabwe in a manner that prevented the occurrence of excessive administrative demands in particular regions.
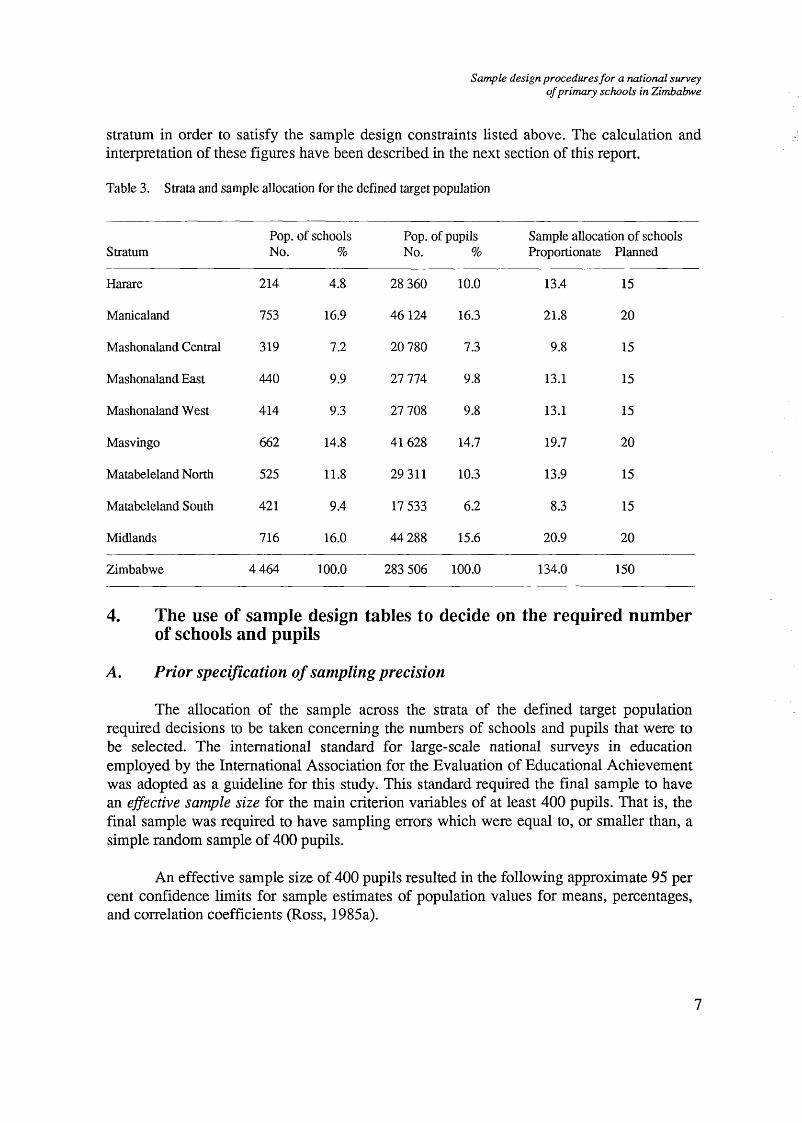
The use of the variable describing 'school district' reinforced the control over the geographical coverage of the sample. The schools within categories of this variable were sorted on the 'school location' variable (Rural, Urban) and the 'type of school' variable (Government, Non-Government schools). In Table 3 the nine regional strata for the study have been listed in association with the population numbers and percentages of schools and pupils in each stratum.
The columns in Table 3 that are headed 'Sample allocation of schools' referred to decisions m a d e with respect to the numbers of schools required to be selected in each
6
Sample design procedures for a national survey of primary schools in Zimbabwe
stratum in order to satisfy the sample design constraints listed above. The calculation and interpretation of these figures have been described in the next section of this report.
Table 3. Strata and sample allocation for the defined target population
Stratum
Harare
Manicaland
Mashonaland Central
Mashonaland East
Mashonaland West
Masvingo
Matabeleland North
Matabeleland South
Midlands
Zimbabwe
Pop. No.
214
753
319
440
414
662
525
421
716
4 464
of schools %
4.8
16.9
7.2
9.9
9.3
14.8
11.8
9.4
16.0
100.0
Pop. of pupils No.
28 360
46124
20 780
27 774
27 708
41628
29 311
17 533
44 288
283 506
%
10.0
16.3
7.3
9.8
9.8
14.7
10.3
6.2
15.6
100.0
Sample allocation of schools Proportionate
13.4
21.8
9.8
13.1
13.1
19.7
13.9
8.3
20.9
134.0
Planned
15
20
15
15
15
20
15
15
20
150
4. The use of sample design tables to decide on the required number of schools and pupils
A . Prior specification of sampling precision
T h e allocation of the sample across the strata of the defined target population required decisions to be taken concerning the numbers of schools and pupils that were to be selected. T h e international standard for large-scale national surveys in education employed by the International Association for the Evaluation of Educational Achievement was adopted as a guideline for this study. This standard required the final sample to have an effective sample size for the main criterion variables of at least 400 pupils. That is, the final sample was required to have sampling errors which were equal to, or smaller than, a simple random sample of 400 pupils.
A n effective sample size of 400 pupils resulted in the following approximate 95 per cent confidence limits for sample estimates of population values for means , percentages, and correlation coefficients (Ross, 1985a).
7

Sample design procedures for a national survey of primary schools in Zimbabwe
(a) M e a n s : m ± 0.1s (where m is a sample m e a n , and s is the sample standard deviation for pupils).
(b) Percentages: p ± 5.0 per cent (where p is a sample percentage).
T h e figure of 400 pupils for the effective sample size has, in m a n y large-scale educational research studies, provided acceptable levels of sampling precision. H o w e v e r , it is important to note that this figure should be reviewed for other surveys where more sampling precision is required (for example, where differences need to be detected between subgroups within a larger sample), or for surveys where less sampling precision is required (for example, where only approximate levels of pupil mastery are required in terms of being able to understand curriculum objectives).
T h e actual values of the effective sample size for statistics used in this study were calculated after all data had been collected, cleaned, and analyzed. These values have been presented in a later section of this report.
B. Sample design framework
T h e general sample design framework adopted for the study consisted of a stratified two-stage cluster sample design. A t the first stage schools were selected within strata with probability proportional to the number of pupils in the defined target population. A t the second stage a simple random sample of a fixed number of pupils w a s selected within each selected school. This sample design framework permitted the use of sample design tables (Ross, 1987) to provide estimates of the number of schools and pupils that were required to satisfy the specified sampling accuracy standards. In order to use these sample design tables, it w a s necessary to k n o w (a) the minimum cluster size (the m i n i m u m number of pupils within a school that will be completing any single item or test), and (b) the coefficient of intraclass correlation (the estimated average size of the coefficient of intraclass correlation for the items and tests).
C. Minimum cluster size
T h e value of the m i n i m u m cluster size referred to the smallest number of pupils within a school that would be completing any single item or test. T h e value selected for this study was guided by a consideration of the following factors.
(a) Pseudo-schools. If the m i n i m u m cluster size is set at a value that is too high then it m a y be necessary to combine small schools to form larger 'pseudo-schools' for the purposes of sample selection (Ross, 1991). If there are m a n y such pseudo-schools selected into the sample, data collection costs can increase substantially because of the increase in the number of sites that must be visited to collect data.
(b) Test administration. It is important that the m i n i m u m cluster size is set at a level that permits test administration within schools to be carried out in an environment that ensures that: (i) the test administrator is able to conduct the testing according to the
8

Sample design procedures for a national survey of primary schools in Zimbabwe
standardized procedures specified for the study; (ii) the sample members are comfortable and unlikely to be distracted; (iii) the sample members respond carefully and independently to the tests and questionnaires; and (iv) the testing does not place an excessive administrative burden on schools.
(c) Test rotation. In some educational research studies, the instruments used to collect data are divided into different forms and then 'rotated' a m o n g pupils within schools. W h e n preparing sample designs for these kinds of studies there is a need to avoid confusion between the total class size and the m i n i m u m cluster size.
In this study it was decided to limit the sample in each selected school to a simple random sample of 20 pupils. This value minimized the potential inconvenience of selecting too m a n y pseudo-schools, and represented a manageable cluster size for test administration requirements. It was also decided to use a c o m m o n test for all sample members in order to avoid test administration complexities arising from the use of test rotation. These decisions permitted a value of 20 to be used as the m i n i m u m cluster size in the sample design tables.
D . Coefficient of intraclass correlation
The co-efficient of intraclass correlation (rho) provides a measure of the tendency of pupil characteristics to be more homogeneous within schools than would be the case if pupils were assigned to schools at random. The estimated size of rho m a y be calculated from previous surveys which have employed similar target populations, similar sample designs, and similar criterion variables.
The values of rho for educational achievement measures are usually higher for education systems where pupils are allocated differentially to schools on the basis of performance — either openly through test results, or covertly through socio-economic differentiation between school catchment zones. In general terms, a relatively larger value of rho means that, for a fixed total number of sample members (pupils in this study), a larger number of primary sampling units (schools in this study) need to be selected in order to obtain the same sampling precision as would be obtained for a relatively lower value of rho. That is, a relatively higher value of rho normally requires more schools to be selected into the sample. (It is important to note that values of rho tend to be higher for pupils-within-classes than for pupils-within-schools and therefore great caution needs to be exercised w h e n employing 'intact classes' as the final stage of a sample design.)
The following formula m a y be used for estimating the value of rho in situations where two-stage cluster sampling is employed using (approximately) equal sized clusters (Ross, 1985a).
estimated rho = (b. s(a)2 - s2)/(b - l)s2
where s(a)2 is the variance of cluster means, s2 is the variance of the element values, and b is the cluster size.
9

Sample design procedures for a national survey of primary schools in Zimbabwe
During the preparation of the sample design for this study there appeared to be no prior estimates of rho that were available for pupils-within-schools. Therefore, on the basis of experience gathered from other studies in similar countries, it was decided to use an estimate of 0.3 for the design of the sample.
E. Sample design tables
In Table 4 of this report, a set of sample design tables has been presented for various values of the m i n i m u m cluster size, and various values of the coefficient of intraclass correlation. The construction of these tables has been described by Ross (1987). It is important to remember that the tables refer specifically to two-stage sample designs that employ simple random sampling of equal-sized clusters. Nevertheless, they provide a good starting point for estimating the number of schools and pupils that are required in order to meet the sample design standards specified for m a n y educational research studies.
The sample design tables do not allow for gains in sampling precision that are associated with effective choice of strata and therefore m a y tend to provide conservative estimates of the numbers of schools and pupils that are required. However, it should be noted that the tables m a y be used in a manner that does m a k e some adjustments for losses in sampling precision that are associated with a disproportionate allocation of the sample across strata by (a) applying the sample design tables separately to the strata, and then (b) using the formula for estimating the variance of a stratified sample in order to combine sampUng error estimates for each stratum (Ross, 1991).
The most important columns of figures in Table 4 for this study, were the fourth and fifth columns because they listed a variety of two-stage samples that would result in an effective sample size of 400. That is, these columns described sample designs which provided 95 per cent confidence limits of ±0.1 s for means and ±5 per cent for percentages. In each table, 'a ' has been used to describe the number of schools, ' b ' has been used to describe the m i n i m u m cluster size, and ' n ' has been used to describe the total sample size.
T o illustrate, consider the intersection of the fourth and fifth columns of figures with the third row of figures in Table 4. The pair of values a=l 12 and n=560 indicate that if rho is equal to 0.1 and the m i n i m u m cluster size, b, is equal to 5, then the two-stage cluster sample design required to meet the required sampling standard would be five pupils selected from each of 112 schools — which would result in a total sample size of 560 pupils.
The effect of a different value of rho, for the same m i n i m u m cluster size, m a y be examined by considering the corresponding rows of the table for rho=0.2, 0.3, etc. For example, in the case where rho=0.3, a total sample size of 880 pupils obtained by selecting five pupils from each of 176 schools would be needed to meet the required sampling standard.
10

Sample design procedures for a national survey of primary schools in Zimbabwe
The rows of Table 4 that correspond to a m i n i m u m cluster size of 1 refer to the effective sample size. That is, they describe the size of a simple random sample which has equivalent accuracy. Therefore, the pairs of figures in the fourth and fifth columns in the table all refer to sample designs which have equivalent accuracy to a simple random sample of size 400. The second and third columns refer to an equivalent sample size of 1,600, and the final two pairs of columns refer to equivalent sample sizes of 178 and 100, respectively.
F. The numbers of schools and pupils required for this study
In this study the value selected for the m i n i m u m cluster size was 20, and the estimated value of the coefficient of intraclass correlation was 0.3. F rom the sample design tables in Table 4, it m a y be seen that, in order to obtain a two-stage cluster sample that satisfied the required standard of sampling precision, it was necessary to select a sample of 134 schools — which resulted in a total sample size of 2,680 pupils.
G, The allocation of the sample across the explicit strata
The initial allocation of the sample across strata was undertaken in a proportionate fashion. That is, the number of schools selected for each region was first made proportional to the number of pupils in the defined target population. T o illustrate, consider the case of Harare in Table 3. The number of schools required for this stratum was 28,360/283,506 x 134 = 13.4 schools. In the fifth column of figures in Table 3, the proportionate allocation of schools has been listed for each region.
The actual 'planned' allocation of schools and pupils across strata has been listed in the final column of Table 3. For most regions, this planned allocation involved an increase in the figures obtained for the proportionate allocation. It was decided to adopt these larger figures so as (a) to ensure that the final sample design provided a conservative approach to meeting the specified Standards for sampling accuracy, and (b) to take advantage of the regional capacity to cope with fieldwork for at least 15 schools in smaller regions and 20 schools in larger regions. The sampling weights required to adjust sample estimates for the disproportionate nature of the planned sample allocation have been described in a later section of this report.
11

Sample design procedures for a national survey of primary schools in Zimbabwe
Table 4. Sample design tables for rho=0.1, 0.2, 0.3
Cluster
Size
95% Confidence Limits for Means/Percentages
+0.05s/+2.5% +0.1s/+5.0% +0.15s/+7.5% +0.2s/+10.0S
roh =
1
2
5
10
15
20
30
40
50
roh =
1
2
5
10
15
20
30
40
50
roh =
1
2
5
10
15
20
30
40
50
0. .1
(SRS)
•• 0 .2
(SRS)
•• 0 .3
(SRS)
1600
880
448
304
256
232
208
196
189
1600
960
576
448
406
384
363
352
346
1600
1040
704
592
555
536
518
508
503
1600
1760
2240
3040
3840
4640
6240
7840
9450
1600
1920
2880
4480
6090
7680
10890
14080
17300
1600
2080
3520
5920
8325
10720
15540
20320
25150
400
220
112
76
64
58
52
49
48
400
240
144
112
102
96
91
88
87
400
260
176
148
139
134
130
127
126
400
440
560
760
960
1160
1560
1960
2400
400
480
720
1120
1530
1920
2730
3520
4350
400
520
880
1480
2085
2680
3900
5080
6300
178
98
50
34
29
26
24
22
21
178
107
65
50
46
43
41
40
39
178
116
79
66
62
60
58
57
56
178
196
250
340
435
520
720
880
1050
178
214
325
500
690
860
1230
1600
1950
178
232
395
660
930
1200
1740
2280
2800
100
55
28
19
16
15
13
13
12
100
60
36
28
26
24
23
22
22
100
65
44
37
35
34
33
32
32
100
110
140
190
240
300
390
520
600
100
120
180
280
390
480
690
880
1100
100
130
220
370
525
680
990
1280
1600
12

Sample design procedures for a national survey of primary schools in Zimbabwe
Table 4. (continued). Sample design tables for rho=0,4 0,5, 0,6
Cluster
Size
95% Confidence Limits for Means/Percentages
+0.05s/+2.5% +0.1s/+5.0% +0.15s/+7.5% +0.2s/+10.05
roh =
1
2
5
10
15
20
30
40
50
roh =
1
2
5
10
15
20
30
40
50
roh =
1
2
5
10
15
20
30
40
50
0. .4
(SRS)
= 0, .5
(SRS)
: 0, .6
(SRS)
1600
1120
832
736
704
688
672
664
660
1600
1200
960
880
854
840
827
820
816
1600
1280
1088
1024
1003
992
982
976
973
1600
2240
4160
7360
10560
13760
20160
26560
33000
1600
2400
4800
8800
12810
16800
24810
32800
40800
1600
2560
5440
10240
15045
19840
29460
39040
48650
400
280
208
184
176
172
168
166
165
400
300
240
220
214
210
207
205
204
400
320
272
256
251
248
246
244
244
400
560
1040
1840
2640
3440
5040
6640
8250
400
600
1200
2200
3210
4200
6210
8200
10200
400
640
1360
2560
3765
4960
7380
9760
12200
178
125
93
82
79
77
75
74
74
178
134
107
98
95
94
92
92
91
178
143
122
114
112
111
110
109
109
178
250
465
820
1185
1540
2250
2960
3700
178
268
535
980
1425
1880
2760
3680
4550
178
286
610
1140
1680
2220
3300
4360
5450
100
70
52
46
44
43
42
42
42
100
75
60
55
54
53
52
52
51
100
80
68
64
63
62
62
61
61
100
140
260
460
660
860
1260
1680
2100
100
150
300
550
810
1060
1560
2080
2550
100
160
340
640
945
1240
1860
2440
3050
13

Sample design procedures for a national survey of primary schools in Zimbabwe
Table 4 . (continued). Sample design table for rho=0.7, 0.8, 0.9
Clust Size
b
roh = 1 2 5 10 15 20 30 40 50
roh = 1 2 5 10 15 20 30 40 50
roh = 1 2 5 10 15 20 30 40 50
:ег
0. .7 (SRS)
0. .8 (SRS)
0. .9 (SRS)
95
+0.05s/
а
1600 1360 1216 1168 1152 1144 1136 1132 ИЗО
1600 1440 1344 1312 1302 1296 1291 1288 1287
1600 1520 1472 1456 1451 1448 1446 1444 1444
% Confi
+ 2.5%
n
1600 2720 6080 11680 17280 22880 34080 45280 56500
1600 2880 6720 13120 19530 25920 38730 51520 64350
1600 3040 7360 14560 21765 28960 43380 57760 72200
dence
+0.1s
а
400 340 304 292 288 286 284 283 283
400 360 336 328 326 324 323 322 322
400 380 368 364 363 362 362 361 361
Limits for
¡/+5.0%
n
400
680
1520
2920
4320
5720
8520
11320
14150
400
720
1680
3280
4890
6480
9690
12880
16100
400
760
1840
3640
5445
7240
10860
14440
18050
Means
+0.15s
a
178
152
136
130
129
128
127
126
126
178
161
150
146
145
145
144
144
144
178
170
164
162
162
162
161
161
161
:/Percenta
¡/+7.5%
n
178
304
680
1300
1935
2560
3810
5040
6300
178
322
750
1460
2175
2900
4320
5760
7200
178
340
820
1620
2430
3240
4830
6440
8050
iges
+0.2s
a
100
85
76
73
72
72
71
71
71
100
90
84
82
82
81
81
81
81
100
95
92
91
91
91
91
91
91
¡/ + 10.0%
n
100
170
380
730
1080
1440
2130
2840
3550
100
180
420
820
1230
1620
2430
3240
4050
100
190
460
910
1365
1820
2730
3640
4550
14

Sample design procedures for a national survey of primary schools in Zimbabwe
5. T h e construction of the sampling frame
A. Introduction
T h e next step in the sample design required the preparation of a sampling frame for the members of the defined target population. The sampling frame provided a means of 'listing' the pupils in the defined target population without actually creating a physical list consisting of an entry for each and every pupil. For this study, the sampling frame needed to provide a complete coverage of the defined target population without being contaminated with incorrect entries, duplicate entries, or entries that referred to elements that were not part of the defined target population.
The information used to construct the sampling frame was based on the Z i m b a b w e Ministry of Education and Culture 1991 School Staffing and Enrolment Census and therefore provided (a) an accurate list of schools for the first stage of sample selection, and (b) accurate information concerning the defined target population enrolments (that is, Grade 6 enrolments) for all primary schools in Z imbabwe . This type of sampling frame was ideally suited to the application of two-stage cluster sampling with probability proportional to size selection at the first stage (Ross, 1991).
B. The Zimbabwe sampling frame
In Table 5 the section of the sampling frame associated with the Mashonaland Central stratum has been presented. This stratum contained 319 schools and 20,780 pupils. In the sampling frame each of the 319 schools has been listed in association with the number of pupils in the defined target population. Note that the schools have been sorted on the 'school district' variable. In addition the variables 'school location' and 'type of school' were used to sort the schools within districts.
The 'tickets' columns in Table 5 referred to the allocation of tickets under the lottery approach to probability proportional to size selection. The lottery approach has been discussed in a later section of this report. Each school in the sampling frame w a s assigned a number of tickets equal to the number of pupils in the defined target population. For example, the first school on the list had tickets 1 to 72 which represented 72 pupils in the defined target population.
15

Sample design procedures for a national survey of primary schools in Zimbabwe
Table 5. Sampling frame for Zimbabwe primary schools in the Mashonaland Central stratum
No Dist Lo Ту School Name Gd6 Tickets Winning Select First Last Ticket Sample
1 Bindur 2 Bindur 3 Bindur 4 Bindur 5 Bindur 6 Bindur 7 Bindur 8 Bindur 9 Bindur 10 Bindur 11 Bindur 12 Bindur 13 Bindur 14 Bindur 15 Bindur 16 Bindur 17 Bindur 18 Bindur 19 Bindur 20 Bindur 21 Bindur 22 Bindur 23 Bindur 24 Bindur 25 Bindur 26 Bindur 27 Bindur 28 Bindur 29 Bindur 30 Bindur 31 Bindur 32 Bindur 33 Bindur 34 Bindur 35 Bindur 36 Bindur 37 Bindur 38 Bindur 39 Bindur 40 Bindur 41 Bindur 42 Centén 43 Centén 44 Centén 45 Centén 46 Centén 47 Centén 48 Centén 49 Centén 50 Centén
R R R R R R R R R R R R R R R R R R R R R R R R R R R R R R R R R R R R U
и и и и R R R R R R R R R
Non Non Non Non Non Non Non Non Non Non Non Non Non Non Non Non Non Non Non Non Non Non Non Non Non Non Non Non Non Non Non Non Non Non Non Non Gov Non Non Non Non Non Non Non Non Non Non Non Non Non
Marian Mapunga Ashcott Nethergreen Chumbeke Nyava Chiriseri Jingo Chindotwe Chireka Chavakadzi Dengu Maravanyika Chiveso Gwaze Wayerera Mashambanhara Masembara Mumurwi Mupandira Muchapondwa Chakanyemba Musana Avoca Pimento Park R.A.N Mine Uronga Bindura S.A. Gorwa Chigiji Nyachuru Simoona Rosetta Rust Pendor Foothills Zvakwana Bindura Trojan Chipadze Chipindura Hermann Gmeiner Mawari Aranbira St Albert's Gee Jay Chiripiro Sable Heights Dambakurimwa Kuhungwe Museredza
72 13 35 16 15 119 47 50 83 86 43 35 31 85 18 90 81 84 83 90 68 36 49 37 35 59 20 133 65 69
177 28 43 44 63 17 76 173 126 125 41 26 36 98 38 25 39 36 32 49
1 73 86 121 137 152 271 318 368 451 537 580 615 646 731 749 839 920
1004 1087 1177 1245 1281 1330 1367 1402 1461 1481 1614 1679 1748 1925 1953 1996 2040 2103 2120 2196 2369 2495 2620 2661 2687 2723 2821 2859 2884 2923 2959 2991
72 85
120 136 151 270 317 367 450 536 579 614 645 730 748 838 919 1003 1086 1176 1244 1280 1329 1366 1401 1460 1480 1613 1678 1747 1924 1952 1995 2039 2102 2119 2195 2368 2494 2619 2660 2686 2722 2820 2858 2883 2922 2958 2990 3039
900 900 900 900 900 900 900 900 900 900 900 900 900 900 900 900 900 2285, 2285. 2285. 2285. 2285. 2285. 2285, 2285. 2285. 2285. 2285. 2285. 2285, 2285. 2285, 2285. 2285, 2285. 2285, 2285. 2285, 3670. 3670, 3670. 3670, 3670. 3670, 3670. 3670, 3670. 3670 3670. 3670
YES .33 — 33 .33 — 33 .33 33 — .33 — 33 — .33 — 33 — .33 — 33 .33 — 33 — .33 — 33 — .33 — .33 .33 33 — .33 YES 66 — .66 — 66 — .66 — 66 — .66 — 66 — .66 — 66 — .66 — .66 — .66 —
16

Sample design procedures for a national survey of primary schools in Zimbabwe
Table 5. (continued)
No Dist Lo Ту School Name Gd6 Tickets Winning Select First Last Ticket Sample
51 52 53 54 55 56 57 58 59 60 61 62 63 64 65 66 67 68 69 70 71 72 73 74 75 76 77 78 79 80 81 82 83 84 85 86 87 88 89 90 91 92 93 94 95 96 97 98 99
100
Centén Centén Centén Centén Centén Centén Centén Centén Centén Centén Centén Centén Centén Centén Centén Centén Centén Centén Centén Centén Centén Guruve Guruve Guruve Guruve Guruve Guruve Guruve Guruve Guruve Guruve Guruve Guruve Guruve Guruve Guruve Guruve Guruve Guruve Guruve Guruve Guruve Guruve Guruve Guruve Guruve Guruve Guruve Guruve Guruve
R R R R R R R R R R R R R R R R R R R R R R R R R R R R R R R R R R R R R R R R R R R R R R R R R R
Non Non Non Non Non Non Non Non Non Non Non Non Non Non Non Non Non Non Non Non Non Non Non Non Non Non Non Non Non Non Non Non Non Non Non Non Non Non Non Non Non Non Non Non Non Non Non Non Non Non
Kapembere Bwazi Chawarura Mzarabani Hwata Chiwashira Soné Chadereka Chiweshe Utete Kapatamukombe Mufudzi Nyamaridza Mhene Muringazuwa Hoya Bore Machaya Gatu Hilbre Chiparta Magwenya Red Lichen Chikafa Mushongahande Guruve Mushoshoma Muzika Magaya Chikwidibe Kadzimwenje Masomo Nyamhondoro Chikwirandaombe Mupinyuri Chimanikire Nyamanj i Ruwinga Chipangura Mamini Chakaodza Nyahunzi Cheraachinda NyandoroNyandor Neshangwe Makwatsine Mahuwe Kadzi Chimbumu Negomo Chisunga
74 27 104 46 28 50 49 73 52 82 22 50 17 45 77
119 48 80 85 34 26 77 32 56 88 46 66 71 46 39 48 75 117 75 88
112 26 62 99 119 129 119 71 84 161 240 190 124 85 35
3040 3114 3141 3245 3291 3319 3369 3418 3491 3543 3625 3647 3697 3714 3759 3836 3955 4003 4083 4168 4202 4228 4305 4337 4393 4481 4527 4593 4664 4710 4749 4797 4872 4989 5064 5152 5264 5290 5352 5451 5570 5699 5818 5889 5973 6134 6374 6564 6688 6773
3113 3140 3244 3290 3318 3368 3417 3490 3542 3624 3646 3696 3713 3758 3835 3954 4002 4082 4167 4201 4227 4304 4336 4392 4480 4526 4592 4663 4709 4748 4796 4871 4988 5063 5151 5263 5289 5351 5450 5569 5698 5817 5888 5972 6133 6373 6563 6687 6772 6807
3670. 3670. 3670. 3670. 3670. 3670. 3670. 3670. 3670. 3670. 3670. 3670. 5055. 5055. 5055. 5055. 5055. 5055. 5055. 5055. 5055, 5055. 5055 5055. 5055, 5055. 5055 5055. 5055 5055. 5055 5055. 5055 5055 6441 6441, 6441 6441 6441 6441 6441 6441 6441 6441 6441 6441 6441 7826 7826 7826
,66 66 66 66 — ,66 — 66 .66 ---66 ,66 66 .66 66 YES .99 99 ,99 — 99 .99 — 99 .99 ,99 .99 — 99 .99 — .99 .99 — .99 .99 — ,99 .99 — .99 .99 — .99 .99 — .99 YES .32 — .32 .32 — .32 .32 — .32 — .32 . .32 — .32 — .32 — .32 — .32 .32 YES .65 — .65 — .65 —
17

Sample design procedures for a national survey of primary schools in Zimbabwe
Table 5. (continued)
No Dist Lo Ту School Name Gd6 Tickets Winning Select First Last Ticket Sample
101 102 103 104 105 106 107 108 109 110 111 112 113 114 115 116 117 118 119 120 121 122 123 124 125 126 127 128 129 130 131 132 133 134 135 136 137 138 139 140 141 142 143 144 145 146 147 148 149 150
Guruve Guruve Guruve Guruve Guruve Guruve Guruve Guruve Guruve Guruve Guruve Guruve Guruve Guruve Guruve Guruve Guruve Guruve Guruve Mazowe Mazowe Mazowe Mazowe Mazowe Mazowe Mazowe Mazowe Mazowe Mazowe Mazowe Mazowe Mazowe Mazowe Mazowe Mazowe Mazowe Mazowe Mazowe Mazowe Mazowe Mazowe Mazowe Mazowe Mazowe Mazowe Mazowe Mazowe Mazowe Mazowe Mazowe
R R R R R R R R R R R R R R R R R R R R R R R R R R R R R R R R R R R R R R R R R R R R R R R R R R
Non Non Non Non Non Non Non Non Non Non Non Non Non Non Non Non Non Non Non Gov Non Non Non Non Non Non Non Non Non Non Non Non Non Non Non Non Non Non Non Non Non Non Non Non Non Non Non Non Non Non
Chimfombo Chapoto Mukwenya Musengezi Chitima Chingwaru Chifamba Gonono Chidodo Mucherengi kemutamba Gota Gwakwe Horse Shoe Siyalima Nyakapupu Mavare Mbizimwenje Kondo Amandas Holy Rosary Chemutamba Howick Ridge Barwick Belgownie Gwingwizha Jingamvura Mukodzongi Nyakydya Musarara Rwere Muchirikuenda Bare Goteka Shopo Jaji Kanhukamwe Gweshe Mukunyadzi Chiden Chigwida Madombwe Kanyemba Gunguhwe Chinehasha Shu tu Majombe Bell-rock Chaona Bhobho
167 27 41 76 44 69 109 30 42 73 74 22 28 42 14 107 51 38
144 40 87 25 43 25 41 43 49 133 117 94 72 124 96 83 86 44 69 134 39 31 40 47 127 95 71 76 80 83 80 41
6808 6975 7002 7043 7119 7163 7232 7341 7371 7413 7486 7560 7582 7610 7652 7666 7773 7824 7862 8006 8046 8133 8158 8201 8226 8267 8310 8359 8492 8609 8703 8775 8899 8995 9078 9164 9208 9277 9411 9450 9481 9521 9568 9695 9790 9861 9937 10017 10100 10180
6974 7001 7042 7118 7162 7231 7340 7370 7412 7485 7559 7581 7609 7651 7665 7772 7823 7861 8005 8045 8132 8157 8200 8225 8266 8309 8358 8491 8608 8702 8774 8898 8994 9077 9163 9207 9276 9410 9449 9480 9520 9567 9694 9789 9860 9936
10016 10099 10179 10220
7826. 7826. 7826. 7826, 7826. 7826, 7826. 7826, 7826. 7826, 7826. 7826, 7826. 7826, 7826. 7826 7826. 7826, 9211. 9211, 9211. 9211 9211. 9211 9211. 9211 9211. 9211 9211, 9211 9211 9211 9211, 9211 9211, 9211 9211, 10597 10597, 10597 10597, 10597 10597, 10597 10597, 10597 10597, 10597 10597 10597
65 — .65 ,65 — .65 65 .65 ,65 ,65 65 .65 — 65 .65 — ,65 .65 ,65 .65 — ,65 .65 YES ,98 — .98 — ,98 .98 — ,98 .98 — ,98 .98 — ,98 .98 — .98 — .98 .98 — .98 .98 .98 .98 — .98 — .98 YES .31 — .31 — .31 .31 .31 .31 — .31 — .31 — .31 — .31 .31 — .31 — .31
18

Sample design procedures for a national survey of primary schools in Zimbabwe
Table 5. (continued)
No Dist Lo Ту School Name Gd6 Tickets Winning Select First Last Ticket Sample
151 152 153 154 155 156 157 158 159 160 161 162 163 164 165 166 167 168 169 170 171 172 173 174 175 176 177 178 179 180 181 182 183 184 185 186 187 188 189 190 191 192 193 194 195 196 197 198 199 200
Mazowe Mazowe Mazowe Mazowe Mazowe Mazowe Mazowe Mazowe Mazowe Mazowe Mazowe Mazowe Mazowe Mazowe Mazowe Mazowe Mazowe Mazowe Mazowe Mazowe Mazowe Mazowe Mazowe Mazowe Mazowe Mazowe Mazowe Mt.Dar Mt.Dar Mt.Dar Mt.Dar Mt.Dar Mt.Dar Mt.Dar Mt.Dar Mt.Dar Mt.Dar Mt.Dar Mt.Dar Mt.Dar Mt.Dar Mt.Dar Mt.Dar Mt.Dar Mt.Dar Mt.Dar Mt.Dar Mt.Dar Mt.Dar Mt.Dar
R R R R R R R R R R R R R R R R R R R R R R R R R R U R R R R R R R R R R R R R R R R R R R R R R R
Non Non Non Non Non Non Non Non Non Non Non Non Non Non Non Non Non Non Non Non Non Non Non Non Non Non Gov Non Non Non Non Non Non Non Non Non Non Non Non Non Non Non Non Non Non Non Non Non Non Non
St Albans Thrums Foothills Road Forrester 'A' Forrester 'F' Forrester 'J' Forrester 'E' Iron Duke Chidikamwedzi Horta Farm Mapere Lucknow Ealing Kushinga Lauran Mazowe Mazowe Mine Concession mine Dandamera Tsungubvi Whaddon Cahse Mvurwi Kakora Nzvimbo Storis Golden S Mbebi Caesar mine Umvukwes Gvt Karuyana Kangaire Chiwenga Kujawara Manyuchi Katarira Nhoro Nembire Zambara Chitsato Nyakasikana Darwin Zambezi Gomo Nyamaswau Kadohwata Date Kajokoto Nyamazizi Kamutsenzere Dotito Chomagora Pachanza
139 25 39 32 30 34 49 51 42 19 32 67 75 75 112 127 32
171 233 42 116 127 135 44 32
111 38 45 34 22 44 28 132 27 82 11 47 31 125 31 32 46 90 42 88 65 89
102 79 74
10221 10360 10385 10424 10456 10486 10520 10569 10620 10662 10681 10713 10780 10855 10930 11042 11169 11201 11372 11605 11647 11763 11890 12025 12069 12101 12212 12250 12295 12329 12351 12395 12423 12555 12582 12664 12675 12722 12753 12878 12909 12941 12987 13077 13119 13207 13272 13361 13463 13542
10359 10384 10423 10455 10485 10519 10568 10619 10661 10680 10712 10779 10854 10929 11041 11168 11200 11371 11604 11646 11762 11889 12024 12068 12100 12211 12249 12294 12328 12350 12394 12422 12554 12581 12663 12674 12721 12752 12877 12908 12940 12986 13076 13118 13206 13271 13360 13462 13541 13615
10597 10597, 10597 10597, 10597 10597, 10597 10597, 11982 11982. 11982 11982, 11982 11982. 11982 11982, 11982 11982. 11982 11982. 11982 11982. 11982 13367. 13367 13367. 13367 13367. 13367 13367. 13367 13367. 13367 13367. 13367 13367. 13367 13367. 13367 13367, 13367 13367, 13367 13367, 13367 13367. 13367 13367. 14753 14753.
.31 —
.31 —
.31 —
.31 —
.31 —
.31
.31
.31 YES
.64 - —
.64
.64 — ,64 .64 — ,64 .64 — .64 .64 — .64 .64 .64 .64 ,64 .64 YES .97 .97 .97 .97 — .97 — .97 — ,97 .97 — .97 — .97 — .97 .97 — .97 — .97 — .97 .97 .97 — .97 — .97 .97 — .97 .97 — .97 — .97 — .97 YES .30 — .30
19

Sample design procedures for a national survey of primary schools in Zimbabwe
Table 5. (continued)
No Dist Lo Ту School Name Gd6 Tickets Winning Select First Last Ticket Sample
201 202 203 204 205 206 207 208 209 210 211 212 213 214 215 216 217 218 219 220 221 222 223 224 225 226 227 228 229 230 231 232 233 234 235 236 237 238 239 240 241 242 243 244 245 246 247 248 249 250
Mt. Mt, Mt. Mt. Mt. Mt. Mt. Mt, Mt. Mt. Mt. Mt. Mt. Mt, Mt. Mt. Mt. Mt, Mt. Mt, Mt. Mt, Mt. Mt, Mt. Mt Mt. Mt Mt. Mt Mt, Mt Mt, Mt Mt, Mt Mt, Mt Mt Mt Mt Mt Mt Mt Mt Mt Mt Mt Mt Mt
.Dar
.Dar Dar .Dar Dar .Dar Dar .Dar Dar .Dar Dar .Dar Dar .Dar Dar .Dar Dar .Dar Dar .Dar Dar .Dar .Dar .Dar .Dar .Dar .Dar .Dar .Dar .Dar .Dar .Dar .Dar .Dar .Dar .Dar .Dar .Dar .Dar .Dar .Dar .Dar .Dar .Dar .Dar .Dar .Dar .Dar .Dar .Dar
R R R R R R R R R R R R R R R R R R R R R R R R R R R R R R R R R R R R R R R R R R R R R R R R R R
Non Non Non Non Non Non Non Non Non Non Non Non Non Non Non Non Non Non Non Non Non Non Non Non Non Non Non Non Non Non Non Non Non Non Non Non Non Non Non Non Non Non Non Non Non Non Non Non Non Non
Kapfudza Gumbeze Chizeza Ruia Kazai Kaitano Chiutsa Sohwe Chiunye Kambamura Mudzengerere St John's Mukumbura Kandeya Mutondwe Tangenhamo Tsamvi Kapatamoyo Chibara Nyajenye Chisecha Kapiripiri Chiromo Nyamhara Chimbuwe Chihoko Chigango Chawanda Pfunyanguwo Chakoma Kuhondo Bemberi Sosera Mutungagore Mangare Chiswiti Mutwa Chimumvuri Matope Chatumbana Nyamuti Mutaku Mukoma Chironga Chitumbuko Chakanetsa Nyamahobogo Tsengurwe Ru wan i Tabex Burley Un
30 40 5 47 50 105 74 89
110 38 58 57
104 42 75 86 40 44 42 39 35 84 46 32 28 41 71 110 41 149 72 56 45 77 51 125 39 74 63 42 38 20 29 91 47 68 40 77 80 76
13616 13646 13686 13691 13738 13788 13893 13967 14056 14166 14204 14262 14319 14423 14465 14540 14626 14666 14710 14752 14791 14826 14910 14956 14988 15016 15057 15128 15238 15279 15428 15500 15556 15601 15678 15729 15854 15893 15967 16030 16072 16110 16130 16159 16250 16297 16365 16405 16482 16562
13645 13685 13690 13737 13787 13892 13966 14055 14165 14203 14261 14318 14422 14464 14539 14625 14665 14709 14751 14790 14825 14909 14955 14987 15015 15056 15127 15237 15278 15427 15499 15555 15600 15677 15728 15853 15892 15966 16029 16071 16109 16129 16158 16249 16296 16364 16404 16481 16561 16637
14753. 14753. 14753. 14753. 14753. 14753. 14753. 14753, 14753. 14753. 14753. 14753, 14753. 14753 14753. 14753, 14753. 14753, 14753. 14753 16138. 16138 16138. 16138 16138, 16138 16138. 16138 16138, 16138 16138 16138 16138 16138 16138, 16138 16138, 16138 16138, 16138 16138 16138 16138 17523 17523 17523 17523 17523 17523 17523
30 — .30 30 — .30 30 .30 30 .30 — 30 .30 30 .30 — ,30 — .30 — 30 .30 30 — .30 — 30 .30 YES ,63 — .63 — .63 .63 .63 .63 — .63 .63 .63 — .63 — .63 .63 — .63 .63 .63 .63 .63 .63 .63 .63 — .63 — .63 — .63 YES .96 — .96 — .96 — .96 .96 — .96 .96 —
20

Table 5. (continued)
No Dist Lo Ту School Name Gd6
251 252 253 254 255 256 257 258 259 260 261 262 263 264 265 266 267 268 269 270 271 272 273 274 275 276 277 278 279 280 281 282 283 284 285 286 287 288 289 290 291 292 293 294 295 296 297 298 299 300
Mt.Dar Rushin Rushin Rushin Rushin Rushin Rushin Rushin Rushin Rushin Rushin Rushin Rushin Rushin Rushin Rushin Rushin Rushin Rushin Rushin Rushin Rushin Rushin Rushin Rushin Rushin Rushin Rushin Rushin Rushin Rushin Rushin Rushin Rushin Rushin Rushin Rushin Rushin Rushin Shamva Shamva Shamva Shamva Shamva Shamva Shamva Shamva Shamva Shamva Shamva
U R R R R R R R R R R R R R R R R R R R R R R R R R R R R R R R R R R R R R R R R R R R R R R R R R
Non Non Non Non Non Non Non Non Non Non Non Non Non Non Non Non Non Non Non Non Non Non Non Non Non Non Non Non Non Non Non Non Non Non Non Non Non Non Non Gov Non Non Non Non Non Non Non Non Non Non
Dolphin Park Rutuka Mukonde Makuni Bungwe Chomutukutu Rushinga Rusambo Runwa Chitange Nyanhewe Nyamazizi Nyamatikiti Chiromba Nyamanyanya Mutsvaire Mukosa Chimanda Mubvundudzi Mazowe Bridge Manetsera Chimandau Magaranhewe Ворота Katakura Chapinduka Kasanga Nyamarodza Gwashure Chaparadza Chongoma Maname Kasenzi Makachi Gwangwava Kamanika Katoni Nyatsato Nyamuzeya Chindunduma Muringamombe Gono Madziwa Mudzinge Mutumba Mupfure Nyamaropa Chiimbira Chishapa Chidembo
12 21 43 36 67 34 80 41 70 24 25 31 82 30 62 23 36 78 35 40 42 14 82 80 60 27 48 74 16 75 37 14 41 28 112 27 4 6 31 79 42 79 135 38 124 74 125 43 33
140
Sample design procedures for a national survey of primary schools in Zimbabwe
Tickets Winning Select First Last Ticket Sample
16638 16650 16671 16714 16750 16817 16851 16931 16972 17042 17066 17091 17122 17204 17234 17296 17319 17355 17433 17468 17508 17550 17564 17646 17726 17786 17813 17861 17935 17951 18026 18063 18077 18118 18146 18258 18285 18289 18295 18326 18405 18447 18526 18661 18699 18823 18897 19022 19065 19098
16649 16670 16713 16749 16816 16850 16930 16971 17041 17065 17090 17121 17203 17233 17295 17318 17354 17432 17467 17507 17549 17563 17645 17725 17785 17812 17860 17934 17950 18025 18062 18076 18117 18145 18257 18284 18288 18294 18325 18404 18446 18525 18660 18698 18822 18896 19021 19064 19097 19237
17523. 17523. 17523. 17523. 17523. 17523. 17523. 17523. 17523. 17523. 17523. 17523. 17523. 17523. 17523. 17523. 17523. 17523. 17523, 17523. 17523, 18909. 18909, 18909. 18909, 18909. 18909, 18909. 18909, 18909. 18909, 18909. 18909 18909. 18909 18909. 18909 18909, 18909 18909. 18909 18909, 18909 18909, 18909 18909 18909 20294, 20294 20294
,96 96 ,96 — 96 ,96 96 ,96 — 96 ,96 — 96 ,96 — 96 ,96 96 ,96 — 96 ,96 96 ,96 96 — ,96 YES 29 — .29 29 .29 29 .29 — ,29 — .29 — ,29 — .29 — ,29 — .29 — ,29 .29 .29 .29 — .29 — .29 — .29 — .29 — .29 .29 — .29 — .29 — .29 — .29 YES .62 — .62 — .62
21

Sample design procedures for a national survey of primary schools in Zimbabwe
Table 5. (continued)
No
301 302 303 304 305 306 307 308 309 310 311 312 313 314 315 316 317 318 319
Dist
Shamva Shamva Shamva Shamva Shamva Shamva Shamva Shamva Shamva Shamva Shamva Shamva Shamva Shamva Shamva Shamva Shamva Shamva Shamva
Lo Ту
R R R R R R R R R R R R R R R R R R R
Non Non Non Non Non Non Non Non Non Non Non Non Non Non Non Non Non Non Non
School Name
Kaziro Magadzi Chihuri Mushambanyama Nyarukunda Rusununguko Nyamaruro Mupfurudzi Mukwari Jiti Mushowani Rustington Bushu Shamva Enterprise Wadzanai Madziwa mine Soma S.O.S Maizeland
Gd6
66 41 110 68
139 49 97 132 18 163 91 11 46 130 41 155 93 39 54
Ti< First
19238 19304 19345 19455 19523 19662 19711 19808 19940 19958 20121 20212 20223 20269 20399 20440 20595 20688 20727
ckets Last
19303 19344 19454 19522 19661 19710 19807 19939 19957 20120 20211 20222 20268 20398 20439 20594 20687 20726 20780
Winning S Ticket £
20294.62 20294.62 20294.62 20294.62 20294.62 20294.62 20294.62 20294.62 20294.62 20294.62 20294.62 20294.62 20294.62 20294.62 21679.95 21679.95 21679.95 21679.95 21679.95
»elect >ample
YES
6. T h e selection of the sample
A . Introduction
In educational survey research the primary sampling units that are most often employed, schools, are rarely equal in size. This variation in size causes difficulties with respect to the control of the total sample size w h e n schools are selected with equal probability at the first stage of a multi-stage sample design.
For example, consider a two-stage sample design in which a simple random sample of 'a' schools is selected from a list of A schools, and then a fixed fraction of pupils, say 1/k, is selected from each of the 'a' schools. This design would provide an epsem, or "equal probability of selection method" (Kish, 1965, p. 21), sample of pupils because the probability of selecting a pupil is a /Ak, which is constant for all pupils in the population. However , the actual size of the sample would depend directly upon the size of the schools that were selected.
22

Sample design procedures for a national survey of primary schools in Zimbabwe
O n e method of obtaining greater control over the sample size is to stratify the schools according to size and then select samples of schools within each stratum. A more widely applied alternative is to employ probability proportional to size (PPS) sampling of schools within strata followed by the selection of a simple random sample of a fixed number of pupils within selected schools. This approach provides complete control over the sample size and results in epsem sampling of pupils within strata.
7. The lottery method of P P S selection: a hypothetical example
A n often-used approach for the application of probability proportional to size (PPS) sampling is to employ the 'lottery method'. For example, consider a situation where two schools are to be selected with probability proportional to size from each stratum of the hypothetical population of 600 pupils described in Table 6.
The application of the lottery method commences with the allocation, to each school, of a number of lottery tickets equal to the number of pupils in the defined target population. For example, the first school listed in Table 6 has 45 pupils and therefore is allocated tickets numbered 1 to 45, and the second school has 60 pupils and therefore is allocated tickets numbered 46 to 105. Since a P P S sample of two schools is to be selected from the first stratum, there are two 'winning tickets' required.
The ratio of the number of tickets to the number of winning tickets, k n o w n as the 'sampling interval', is 200/2 = 100. That is, each ticket in the first stratum should have a 1 in 100 chance of being drawn as a winning ticket. Note that in the case of the second stratum, the sampling interval would be 400/2 = 200.
The winning tickets for the first stratum are drawn by using a random start-constant interval procedure whereby a random number in the interval 1 to 100 is selected as the first winning ticket and the second ticket is selected by adding an increment of 100 to this number. With a random start of 65, the winning ticket numbers would be 65 and 165. This would result in the selection of School 2 (which holds tickets 46-105) and School 3 (which holds tickets 106-200). The chance of selecting any school is proportional to the number of tickets held and therefore each of these schools is selected with probability proportional to the number of pupils in the defined target population.
The lottery method described above m a y also be used at several stages of a multi-stage sample design. T o illustrate, consider the example above as representing the first stage of sampling. At the second stage a lottery procedure is applied within selected schools in order to select a single class with P P S . Within School 2, for example, Class 3 would hold tickets 1-15, Class 4 would hold tickets 16-35, and Class 5 would hold tickets 36-60. The sample class selected within School 2 would then be associated with a single winning ticket drawn randomly from a set of numbers in the interval 1 to 60.
23

Sample design procedures for a national survey of primary schools in Zimbabwe
Table 6. Hypothetical population for the illustration of probability proportional to size selection
Stratum
1
Subtotal
2
Subtotal
Total
School
1
2
3
3
4
5
6
7
4
7
Class
1
2
3
4
5
6
7
8
9
9
10
11
12
13
14
15
16
17
18
19
20
21
12
21
No. Students
School
45
60
95
200
45
110
120
125
400
600
Class
20
25
15
20
25
25
30
25
15
10
15
20
20
25
30
35
35
40
45
50
75
Cumulative
School
45
105
200
45
155
275
400
Class
20
45
60
80
105
130
160
185
200
10
25
45
65
90
120
155
190
230
275
325
400
Ti c
School
1-45
46-105
106-200
1-45
46-155
156-275
276-400
kets"
Class
1-20
21-45
1-15
16-35
36-60
1-25
26-55
56-80
81-95
1-10
11-25
26-45
1-20
21-45
46-75
76-110
1-35
36-75
76-120
1-50
51-125
24

Sample design procedures for a national survey of primary schools in Zimbabwe
8. The calculation of sampling weights
Consider a population of pupils which m a y be described according to the notation presented in Table 7. The following discussion is based on the use of two-stage sampling procedures in which the first stage of sampling consists of the P P S selection of schools followed by the selection of a simple random sample of pupils in selected schools.
From Stratum h of the population select ah schools with P P S , and then within each sample school select a simple random sample of пы pupils within each selected school.
For this sample design, the probability of selecting pupil к in Class j from School i within Stratum h would be the product of the probability of selecting the pupil's school at the first stage and the probability of selecting the pupil к within School i at the second stage.
p = (a h xN h i /N h )x(n h i /N h i )
= (ahxnhi)/Nh
This application of P P S sampling removes the influence of school size, Nu, from the calculation of the probability of selecting pupil k. Note that, if the value of n^ is constant within strata, then the numerator of the above equation is equal to nh. In this special case, p = n h / N h is a constant for all pupils within a particular stratum.
The application of complex multi-stage sampling results in unequal probabilities of selection and therefore sampling weights need to be added to the pupil data files prior to the estimation of population characteristics. The calculation of sampling weights follows the classical (Horvitz-Thompson) procedure of assigning each pupil a weight that is proportional to the reciprocal of the probability of including a pupil in the sample.
The reciprocals of these probabilities are sometimes referred to as 'raising factors' because they refer to the number of elements in the population that are 'represented' by the various sample elements.
raising factor = Nh/(\ x пы)
These raising factors are often multiplied by a constant so that the 'weighted sample size' is equal to the actual sample size. In this case the constant would be n / N and the sampling weights would be as follows.
weight = (Nh x n ) / ^ x n M x N )
25

Sample design procedures for a national survey of primary schools in Zimbabwe
Table 7 . Notation used in discussion of sample designs
Coverage of units
Schools Units
Classes Students
Total Sample Total Sample Total S a m p l e
Population
Stratum h
School i (Stratum h)
Class j (School i in Stratum h)
A
A. \
В
В,
m
N
NL
hi hi
N, hij
nL
nu. hi
hij
Note: 1. T h e notation conventions for sample designs described in this manua l have been listed in Table 9. T h e table entries describe the n u m b e r of 'units' (schools, classes, or pupils) associated with each of four levels of 'coverage' (Population, Stratum h, School i, or Class j).
Note: 2 . For example, the symbol A has been used to refer to the total n u m b e r of schools ('units') in the Population ('coverage'), whereas the symbol A h has been used to describe the total n u m b e r of schools ('units') in Stratum h ('coverage'). Similarly, the symbol n has been used to refer to the n u m b e r of students in the sample, whereas the symbol n^ has been used to refer to the n u m b e r of pupils in the sample associated with Class j (situated in School i within Stratum h) .
Note: 3. In the special situation where intact classes (whole classes) are employed in a sample design, the total n u m b e r of pupils in Class j, N ^ , would be equal to the n u m b e r of pupils in the sample associated with Class j, п ы г Similarly, for sample designs that employ intact schools the value of 1ЧЫ wou ld be equal to п ы .
T o illustrate the calculation of weights for this study, consider the first school selected (i=l) with probability proportional to size in the first stratum (h=l) listed in Table 1. T h e total n u m b e r of pupils in the defined target population for this first stratum, N 1 5 w a s 28,360, and the total population size, N , w a s 283,506. A s s u m e that 15 schools, a p were selected from this stratum, and that 18 pupils, n u , were selected as a simple r a n d o m sample within the school. Also assume that the total sample consisted of 2,609 pupils ~ obtained by selecting pupils from 145 schools. (These figures actually apply to the first school selected
26

Sample design procedures for a national survey of primary schools in Zimbabwe
in the Harare stratum for this study.) For this school, the pupil weight would be calculated as follows.
weight = (28,360 x 2,609)/(15 x 18 x 283,506) = 0.967
The sampling weights described above are required for undertaking analyses at the between-pupil level. For analyses conducted at other levels of data aggregation it is also necessary to calculate appropriate weights. For this study, it was decided that the weight for a school would be proportional to the sum of its pupils' weights, and the weight for a teacher would be proportional to the sum of his/her pupils' weights. O n e of the consequences of this approach to weighting was that the weighted m e a n score for a school variable referred to a school characteristic experienced by 'the average pupil' — but not necessarily to a characteristic of 'the average school'. Similarly, a weighted m e a n score for a teacher variable referred to a teacher characteristic experienced by 'the average pupil' — but not necessarily a characteristic of 'the average teacher'.
9. The sample of schools selected for this study
In the final columns of Table 5 the numbers of 'tickets' allocated to each school have been listed in association with the winning ticket numbers. In the final column of the table an indication has been given to show whether a school was selected into the final sample. If a school was selected, the final column contained a ' Y E S ' . For the Mashonaland Central stratum listed in Table 5 the random start was 900 and the sampling interval was 20,780/15=1,385.33. Therefore the first school selected was Mashambanhara because this school held ticket number 900, the second school selected was Trojan because this school held ticket number 2,285, and so on. The final list of sample schools for the whole of Z i m b a b w e has been presented in Table 8.
10. Operational procedures for the selection of pupils within schools
A . Introduction
A critical component of the sample design for this study was concerned with the selection of pupils within selected classes. It was decided that these selections should be placed under the control of the District Education Officers — after they were provided with materials that would ensure that a simple random sample of pupils was selected in each selected school. The District Education Officers were informed that it was not acceptable to permit school principals or classroom teachers to have any influence over the sampling procedures within schools. These groups of people m a y have had a vested interest in selecting particular kinds of pupils, and this m a y have resulted in major distortions of sample estimates (Brickell, 1974).
27

Sample design procedures for a national survey of primary schools in Zimbabwe
Table 8. Schools selected for participation in the national survey of primary schools in Zimbabwe
Number
Harare Region 1 2 3 4 5 6 7 8 9 10 11 12 13 14 15
District
i
Harare Harare Harare Harare Harare Harare Harare Harare Harare Harare Harare Harare Harare Harare Harare
Manicaland Region 16 17 18 19 20 21 22 23 24 25 26 27 28 29 30 31 32 33 34 35
Buhera Buhera Buhera Chiman Chiman Chipin Chipin Chipin Makoni Makoni Makoni Makoni Mutare Mutare Mutare Mutare Mutasa Mutasa Nyanga Nyanga
School Name
Gwebi Mutiunokura Widdicombe Fungisai Tangenhamo Mhofu Chinembiri Batanai Sekell Ruzivo Simudzai Zengeza Main Kuwadzana 2 Kuwadzana 3 Hernman Gmeiner
Ndawana Matsveru StJohnChif Thornton Chakohwa Maunganidze Hakwata Chichichi Madzingidzi Chigudu TandiStCol M t Carmel Gutaurare Zhawari Dambakurimwa Karirwi Chavhanga Rutsate Chidazuru Tombo
Mashonaland Central Region 36 37 38 39 40 41 42 43 44
Bindur Bindur Centén Guruve Guruve Guruve Mazowe Mazowe Mazowe
Mashambanhara Trojan Mufudzi Chikwirandaombe M a h u w e Kadzi Mbizimwenje K a n h u k a m w e Iron Duke Nzvimbo
Location
R U U
и и и и и и и и и и и и R R R R R R R R R R R R R R R R R R R R
R U R R R R R R R
Type
Non Gov Gov Gov Gov Gov Gov Gov Gov Gov Gov Non Non Non Non
Non Non Non Non Non Non Non Non Non Non Non Non Non Non Non Non Non Non Non Non
Non Non Non Non Non Non Non Non Non
Grade 6 Enrolment
90 134 123 320 292 132 210 223 314 182 219 192 264 216 61
113 86
132 43 50 87 61 86
123 42 82 78 88 92
126 60 88 28 48 71
81 173 50 75
190 38 69 51
135
28

Table 8. (continued).
Sample design procedures for a national survey of primary schools in Zimbabwe
Number
45 46 47 48 49 50
District
Mt.Dar Mt.Dar Mt.Dar Rushin Shamva Shamva
Mashonaland East Region 51 52 53 54 55 56 57 58 59 60 61 62 63 64 65
Goromo Goromo Goromo Marond Marond Marond Mudzi Murewa M u r e w a M u r e w a Murewa Mutoko Mutoko Wedza W e d z a
Mashonaland West Region 66 67 68 69 70 71 72 73 74 75 76 77 78 79 80
Masvingo 81 82 83 84 85 86 87 88 89 90
Chegut Chegut Chegut Chegut Hurung Hurung Hurung Kadoma Kadoma Kadoma Kariba Makond Makond Makond Makond
Region Bikita Bikita Bikita Chired Chired Chivi Chivi Chivi Gutu Gutu
School N a m e
Dotito Nyajenye M u k o m a Manetsera Nyamaropa Shamva
Goromonzi C o m m i Nehanda Mukombami Nhowe Furamera Nyameni Chikwizo Kambarami MurewaCentral Magunje Munamba Musanhi Chikara M t St Mary's St Magarete's
Bryden St Matthias Ruk Waze Chakari Kanyati Chikuti Chipango Jondale Mamvuramachena Sanyati Kudzanayi Kanyemba Tafira Pamwechete Banket
Chadya Magurwe Muvuti Gwaivhi Dunuza Chasiyatende Madzivire Rungai Chiguhune Guzha
Location
R R R R R R
R R R R R U R R R R R R R R R
R R R U R R R R R R R R R R U
R R R R U R R R R R
Type
Non Non Non Non Non Non
Non Non Non Non Non Non Non Non Non Non Non Non Non Non Non
Non Non Non Gov Non Non Non Non Non Non Non Non Non Non Gov
Non Non Non Non Non Non Non Non Non Non
Grade 6 Enrolment
102 39 29 42
125 130
114 66 78 92
117 87 68
129 193 113 85
107 33
183 88
240 80 77
258 92
136 55 93 70 61 48 30
115 71
265
100 83 90 20
142 129 112 78
117 83

Sample design procedures for a national survey of primary schools in Zimbabwe
Table 8. (continued)
Number
91 92 93 94 95 96 97 98 99
100
District
Gum Gutu Masvin Masvin Masvin Masvin Mwenez Ndanga Ndanga Ndanga
Matabeleland North Region 101 102 103 104 105 106 107 108 109 110 111 112 113 114 115
Binga Bubi Bulawa Bulawa Bulawa Bulawa Bulawa Bulawa Hwange Hwange Lupane Lupane Nkayi Nyaman Nyaman
Matabeleland South Region 116 117 118 119 120 121 122 123 124 125 126 127 128 129 130
Midlands Reg\ 131 132 133 134 135
Beitbr Bulali Bulali Bulali Bulali Gwanda Gwanda Gwanda Insiza Insiza Insiza Matobo Matobo Umzing Umzing
'on Charter Charter Charter Chilim G o k w e
School N a m e
Mugodhi Ranga Chikuza Masarasara Nyajena Masvingo Barrac Negari Chitende Masvingamashava N h e m a
Pashu Madlelenyoni Ingwegwe Govt Mzilikazi Govt G a m p u Govt Ntabeni Govt Kensington Dominican Conve Milonga Mbizha Gandangula Mzola 55 Magazi Sigonde Igusi
Toporo Hingwe Kahlu Sangulube Mbonqane Mtandawenema Mandiwongola Bhalula Ekusileni Nkwalini Shangani Mine Lisieux Sontala Mlomoliwoto Tshalimbe
Chafa Masunda Zinatsa StJoseph's Dekete
Location
R R R R R U R R R R
R R R R R R R R R U R R R R R
R R R R R R R R R R R R R R R
R R R R R
Type
Non Non Non Non Non Non Non Non Non Non
Non Non Gov Gov Gov Gov Non Non Non Non Non Non Non Non Non
Non Non Non Non Non Non Non Non Non Non Non Non Non Non Non
Non Non Non Non Non
Grade 6 Enrolment
42 48 88 46 79 39 36 89 35 85
36 40
203 203 174 229 44 73 37 98 42 44 39 51 30
36 98 42 38 39 41 38 21 43 51 98 39 74 71 47
34 36 75 81
125
30

Table 8. (continued)
Sample design procedures for a national survey of primary schools in Zimbabwe
Number District School Name Location Type Grade 6 Enrolment
136 137 138 139 140 141 142 143 144 145 146 147 148 149 150
Gokwe Gokwe Gokwe Gokwe Gweru Gweru Kwekwe Kwekwe Kwekwe Kwekwe Mberen Mberen Mberen Shurug Zvisha
Karuware Mavanga Nyamazengwe St.Dominic's Lower Gweru Mkoba4 Emthonjeni Mbombela St.Marün's Chana Gomututu Muponjane Vumukwana Poshayi Marovanidze
R R R R R U R R R U R R R R R
Non Non Non Non Non Gov Gov Non Non Non Non Non Non Non Non
40 125 82 87 78
264 217
42 90
171 73 95 35 64 39
B. Procedures for the selection of pupils in selected schools
The District Education Officer initially explained to the Head Master in a selected school that it was necessary to select a simple random sample of pupils from among all Grade 6 pupils in the school. The District Education Officer then applied the following set of instructions in order ensure that a simple random sample of pupils was selected.
Step 1: Obtain grade 6 register(s) of attendance. These registers are to be obtained for all Grade 6 pupils that attend normal (not 'special')
classes. In multiple session schools, both morning and afternoon registers are to be obtained. Step 2: Assign sequential numbers to all grade 6 pupils. Place a sequential number beside the name of each Grade 6 pupil.
Example: Consider a school with one session and a total of 48 pupils in Grade 6. C o m m e n c e by placing the number ' 1 ' beside the first pupil on the Register; then place the number ' 2 ' beside the second pupil on the Register;...etc....; finally, place the number ' 48 ' beside the last pupil on the Register.
Another example: Consider a school with 42 pupils in the morning session and 48 pupils in the afternoon session of Grade 6. C o m m e n c e by placing the number ' Г beside the first pupil on the morning register;... etc ...; then place a ' 4 2 ' beside the last pupil on the morning register; then place a ' 4 3 ' beside the first pupil on the afternoon register; ... etc. ...; finally place a ' 90 ' beside the last pupil on the afternoon register.
31

Sample design procedures for a national survey of primary schools in Zimbabwe
Step 3: Locate the appropriate set of selection numbers. In Table 9 sets of 'selection numbers' have been listed for a variety of school sizes. (Note
that only the sets relevant for school sizes in the range 21 to 100 have been presented as Table 9. The remaining sets, which cover up to a school size of 350, were included in the Data Collection Manual.) For example, if a school has 48 pupils in Grade 6, then the appropriate set of selection numbers is listed under the ' R 4 8 ' heading. Similarly, if a school has 90 Grade 6 pupils then the appropriate set of selection numbers is listed under the ' R 9 0 ' heading.
Step 4: Use the appropriate set of selection numbers. After locating the appropriate set of selection numbers, use the numbers to select the
sample of 20 pupils. Use the first selection number to locate the Grade 6 pupil with the same sequential number on the Register(s). Use the second selection number to locate the Grade 6 pupil with the same sequential number on the Register(s). Continue with this process until the full set of 20 selection numbers has been used.
Example: In a school with a total of 50 pupils in Grade 6 the first pupil selected has sequential number '3'; the second pupil selected has sequential number '4';...etc....;the twentieth pupil selected has sequential number '45'.
11. The response rates achieved for the study
Following the execution of the sample design, it was possible to review the performance of the fieldwork phase of the study by considering the response rates achieved for the pupils, teachers, and school principals that were selected as part of the planned sample.
For each school in the planned sample there was one teacher and one school principal involved in the data collection. Therefore, the numbers of teachers and school principals in each stratum of the planned sample m a y be read from the final column of Table 3. The number of pupils in the planned sample for each stratum can be calculated by multiplying these figures by 20 for each stratum. All of these planned figures have been listed as the first three columns of Table 10. In the remaining columns of Table 10, the response rates have been presented for each group of respondents.
32

Sample design procedures for a national survey of primary schools in Zimbabwe
Table 9. R a n d o m number tables for the selection of a simple random sample of 20 pupils within selected schools (size of defined target population)
R21 R22 R23 R24 R25 R26 R27 R28 R29 R30 R31 R32 R33 R34 R35 R36 R37 R38 R39 R40
1 2 3 4 5 6 7 8 9
10 11 12 13 14 16 17 18 19 20 21
1 2 3 5 6 7 8 9
10 11 12 13 14 15 16 17 18 20 21 22
1 2 3 5 6 7 9
11 12 13 14 15 16 17 18 19 20 21 22 23
2 3 4 5 7 8 9
10 11 12 13 15 16 17 18 19 21 22 23 24
1 2 3 4 5 6 7 9
11 12 13 14 15 16 18 20 21 23 24 25
1 2 3 5 6 7 8 9
10 12 13 14 15 16 18 19 21 22 25 26
1 3 4 5 6 7 8 9
12 13 14 15 16 17 18 19 20 22 24 25
1 2 3 4 6 7 8
11 12 13 15 17 18 19 20 21 22 25 27 28
1 2 3 4 5 6 9
10 11 12 14 16 21 22 23 24 25 27 28 29
4 6 7 8
10 12 15 16 17 18 19 20 22 23 24 25 26 27 29 30
1 4 5 8
10 11 14 15 16 17 19 20 22 23 24 25 27 29 30 31
4 6 7 9
10 11 12 13 14 15 16 17 21 23 24 25 26 28 30 31
1 2 4 5 7
10 12 13 14 16 18 19 21 23 25 26 28 31 32 33
2 3 4 5 6 7 8 9
10 11 12 13 14 18 23 26 27 29 30 33
1 2 7 8 9
11 14 15 16 17 21 22 23 24 25 26 32 33 34 35
4 5 7 8
10 13 16 17 19 21 22 24 25 26 27 28 29 31 33 36
1 3 6 7 8 9
10 11 12 13 17 18 19 24 25 28 29 30 34 36
1 4 7 9
11 12 14 16 17 18 19 22 23 24 25 26 28 31 32 37
1 2 3 5 6 7 8
12 14 15 17 20 24 26 27 28 29 31 36 38
2 3 5 6 8
12 13 16 17 18 23 24 25 31 33 34 37 38 39 40
R41 R42 R43 R44 R45 R46 R47 R48 R49 R50 R51 R52 R53 R54 R55 R56 R57 R58 R59 R60
1 4 5 7 8
10 12 13 15 17 20 21 25 27 28 29 32 34 35 39
2 3 4 5 6 8
10 13 16 20 21 23 24 27 29 31 34 35 36 41
1 2 6
11 13 14 15 17 20 25 26 28 31 32 33 37 38 39 40 42
1 3 4 6 7 8 9
11 13 15 18 19 24 25 32 35 38 40 43 44
3 5 7 8
10 11 12 16 19 23 24 25 32 34 35 37 38 40 43 44
1 11 12 15 17 21 22 23 24 25 26 28 29 32 34 36 40 41 44 45
3 5 10 17 24 25 27 28 30 31 32 33 34 36 37 38 39 42 44 45
1 3 6
15 19 20 24 26 27 29 30 31 32 34 36 37 38 40 44 48
1 2 4 6 8
13 15 17 20 23 24 27 31 32 34 37 41 43 44 47
3 4 5 6 7 8
11 13 14 16 20 22 24 29 32 33 36 37 40 45
3 4 8 9
10 12 13 15 17 26 27 29 31 32 36 39 40 44 47 48
4 5 6
10 13 17 18 19 20 22 25 27 28 32 35 40 42 49 51 52
3 6 8 9
11 12 14 15 18 19 23 26 28 33 38 42 43 48 51 53
1 2 4 8
10 11 16 20 24 25 27 28 29 32 37 39 41 46 47 49
1 6 7 9
10 12 14 16 29 31 36 38 40 42 44 47 48 52 53 54
2 5 7
10 12 15 18 24 25 27 32 34 38 43 45 47 49 50 52 55
2 6 7
10 17 19 23 29 34 35 37 38 43 44 46 48 52 53 55 57
3 5 6 8 16 17 21 23 27 32 37 38 42 44 46 48 49 50 52 56
3 4 5 8
10 11 15 16 17 20 24 26 29 31 36 38 42 48 50 53
1 5 6 7 9
11 14 16 19 21 24 28 29 39 40 49 50 51 52 54
33

Sample design procedures for a national survey of primary schools in Zimbabwe
Table 9. (continued)
R61 R62 R63 R64 R65 R66 R67 R68 R69 R70
2 5 7 8
11 18 19 21 22 27 30 34 35 39 46 48 49 50 53 54
9 12 14 22 23 25 27 28 29 33 41 42 43 46 50 51 53 57 59 62
8 12 14 15 16 18 24 32 33 34 38 39 40 42 45 46 48 54 61 63
5 8
10 17 19 21 25 26 27 29 33 35 37 39 45 48 49 54 58 61
3 4 7
10 14 18 19 20 28 37 40 42 46 47 49 51 58 59 61 65
1 2 8 9
11 19 22 23 25 26 27 30 38-46 50 52 53 54 61 66
4 5 6
10 14 17 18 20 21 25 29 30 34 37 39 41 47 57 58 63
2 4 5
10 16 17 21 22 23 28 31 32 33 37 42 49 55 58 61 67
6 9
11 14 23 24 29 31 36 40 44 48 49 50 52 55 59 60 67 68
5 6 7 9
11 13 17 18 21 22 36 39 41 47 49 50 53 55 61 67
R81 R82 R83 R84 R85 R86 R87 R88 R89 R90
9 13 16 33 40 41 42 44 45 46 54 59 64 71 72 73 74 75 76 79
9 15 16 23 27 28 29 33 42 43 48 50 56 57 60 61 66 67 69 71
2 4
14 17 30 35 41 42 49 52 53 58 63 67 69 71 74 76 77 80
4 6 7
13 14 19 25 31 34 39 40 44 59 62 70 73 74 77 83 84
3 6 7
25 27 30 32 36 45 48 50 54 58 63 64 66 68 72 83 85
1 8
13 24 34 35 39 45 47 50 52 61 64 65 66 67 68 75 80 83
1 3 7
14 16 17 19 20 26 28 30 40 53 54 60 66 77 80 83 86
6 8
16 23 26 29 32 35 42 43 48 50 55 59 63 64 70 74 81 86
2 12 14 15 39 48 52 56 57 60 62 64 66 67 68 70 75 76 88 89
1 2 5
10 22 24 25 27 31 35 40 46 51 53 54 73 81 83 85 90
R71 R72 R73 R74 R75 R76 R77 R78 R79 R80
9 15 17 20 22 25 27 28 34 35 37 39 46 48 50 53 60 61 62 64
3 6
10 12 18 20 22 26 29 32 38 41 43 44 47 48 50 52 61 66
1 5 9
11 12 13 14 21 28 29 34 37 42 48 54 57 62 63 68 72
4 15 19 23 24 27 28 35 38 42 47 49 50 51 52 56 62 64 65 72
2 7 9
15 16 23 29 36 37 41 43 45 46 50 53 60 66 67 69 72
6 20 21 22 24 25 30 31 35 37 39 50 51 58 61 63 65 67 68 73
3 5 6 7
10 16 24 31 32 36 38 45 48 62 64 70 71 72 73 75
12 13 23 24 28 32 46 47 48 49 52 53 57 59 63 64 67 70 75 76
8 10 14 15 21 23 31 32 34 41 46 48 54 58 61 62 68 71 75 77
6 10 17 19 21 23 26 31 32 36 41 42 44 45 46 50 61 71 73 76
R91 R92 R93 R94 R95 R96 R97 R98 R99 R100
7 15 20 29 36 38 42 43 49 50 54 58 59 67 73 80 84 85 87 91
8 15 17 21 25 26 31 34 40 41 49 54 61 69 71 78 79 81 83 84
1 7 9
19 20 21 22 30 31 32 35 36 40 46 51 62 72 73 76 89
1 8 9
10 14 15 20 23 36 46 48 57 58 60 61 72 79 81 87 91
7 9
12 14 18 24 32 35 46 49 54 60 63 64 69 78 87 88 92 95
2 4 6 9
16 18 21 28 32 47 50 51 63 64 70 73 78 80 89 92
3 10 26 33 37 39 40 41 48 50 51 53 61 62 64 65 68 70 82 97
8 11 17 23 25 31 36 38 42 48 54 58 63 70 71 78 89 91 92 93
3 11 20 29 30 34 38 42 50 51 53 54 60 62 63 68 79 92 94 99
7 21 22 25 27 35 40 49 50 52 56 57 75 79 81 86 87 92 93 94
34

Sample design procedures for a national survey of primary schools in Zimbabwe
Table 10. Designed and achieved samples of schools, teachers, pupils
Explicit Planned Sample Strata School Teacher Pupil
Achieved Sample Senоо1s Teachers Pupils
Number % Number % Number %
Harare 15 15 300 15 100 15 100 294 98
Manicaland 20 20 400 19 95 19 95 338 85
Mashonaland 15 15 300 Central
12 80 11 73 226 75
Mashonaland 15 East
15 300 15 100 15 100 276 92
Mashonaland 15 West
15 300 15 100 15 100 249 83
Masvingo 20 20 400 20 100 20 100 345 86
Matabeleland 15 15 300 North
15 100 15 100 261 87
Matabeleland 15 15 300 South
14 93 14 93 253 84
Midlands 20 20 400 20 100 19 95 367 92
Zimbabwe 150 150 3000 145 97 143 95 2609 87
35

Sample design procedures for a national survey of primary schools in Zimbabwe
The overall response rates were 87 per cent for pupils, 95 per cent for teachers, and 97 per cent for school principals. These figures were, by any standards, commendable response rates — given the speed with which this large survey was undertaken.
The loss of data for school principals arose because: (a) three schools were in extremely isolated settings that could not be reached by District Education Officers before the cut-off date for the data preparation phase of the study; (b) one school selected into the sample was subsequently discovered to have transferred its Grade 6 pupils to another school just prior to the survey; and (c) one school principal was absent on the day when data were collected. The loss of data for teachers was also associated with reasons (a), (b), and, in addition, three teachers were absent on the day when data were collected.
The loss of data for pupils included the data for those pupils associated with the schools described in reasons (a) and (b) above. In addition, the pupil data for one school was lost in transit. The remaining loss of pupil data occurred through pupil absenteeism across a wide range of schools on the day when data were collected.
The relatively small amount of lost data for this study was compensated for during the calculation of sampling weights. These calculations assumed that the loss of data was 'random' in nature — which seemed an acceptable assumption given the reasons for data loss described above. In future studies of this kind it is expected that more time will be permitted for the data collection phase of the study and therefore it is to be expected that response rates will be even better than experienced for this study.
12. The calculation of sampling errors
The sample designs employed in this study were complex multi-stage designs that departed markedly from the usual 'textbook model' of simple random sampling. This departure demanded that special steps be taken in order to calculate measures of the stability of parameter estimates derived from the data. It was decided that the most appropriate approach would be to use the Taylor's Series Approximation procedure (Ross, 1985b) to m a k e the necessary calculations. This procedure was applied after all data had been collected, cleaned, and analyzed.
In the following paragraphs, a brief overview has been presented of the notions of 'sampling error' and 'design effects'. This has been followed by a description of some of the results of applying the Taylor's Series Approximation procedure to item percentages and the total score on the Reading Test used in the study.
A. The notion of sampling error
Consider a probability sample of n elements which is used to calculate the sample mean, x, as an estimate of the population mean, X . If an infinite set of samples of size n were drawn independently from this population and the sample mean calculated for each of these samples, then the average of the resulting sampling distribution of sample means, the expected value of x, could be denoted by E(x).
36

Sample design procedures for a national survey of primary schools in Zimbabwe
The accuracy of the sample statistic, x, as an estimator of the population parameter, X , m a y be summarized in terms of the the mean square error ( M S E ) . The M S E is defined as the average of the squares of the deviations of all possible sample estimates from the value being estimated (Hansen et al, 1953).
M S E (x) = E(x - X ) 2
= E(x - E(x))2 + (E(x) - X ) 2
= variance of x + (bias of x)2
A sample design is unbiased if E(x) = X . It is important to remember that 'bias' is not a property of a single sample, but of the entire sampling distribution, and that it belongs neither to the selection nor the estimation procedure alone, but to both jointly.
For most well designed samples in survey research, bias is usually very small -tending towards zero with increasing sample size. The accuracy of sample estimates is therefore generally assessed in terms of the variance of x, denoted var(x), which quantifies the sampling stability of the values of x around their expected value E(x).
B. The accuracy of individual sample estimates
In educational settings the researcher is usually dealing with a single sample of data and not with all possible samples from a population. The variance of sample estimates as a measure of sampling accuracy cannot therefore be calculated exactly. Fortunately, for many probability sample designs, statistical theory m a y be used to derive formulae which provide estimates of the variance based on the internal evidence of a single sample of data.
For a simple random sample of n elements drawn without replacement from a population of N elements, the variance of the sample mean m a y be estimated from a single sample of data by using the following formula:
var(x) = (N - n)/N . s2/n
where s2 is the usual sample estimate of the variance of the element values in the population (Kish, 1965 p. 41).
For sufficiently large values of N , the value of the finite population correction, (N - n)/N, tends toward unity. The variance of the sample m e a n in this situation m a y therefore be estimated by s2/n.
The sampling distribution of the sample mean is approximately normally distributed for m a n y survey research situations. The approximation improves with increased sample size -- even though the distribution of elements in the parent population m a y be far from normal. This characteristic of sampling distributions is known as the Central Limit Theorem and it occurs not only for the sample mean but also for most estimators commonly used to describe survey research results (Kish, 1965).
37

Sample design procedures for a national survey of primary schools in Zimbabwe
From a knowledge of the properties of the normal distribution w e k n o w that w e can be '68 per cent confident' that the range x + se(x) includes the population mean, where x is the sample mean obtained from a single sample and se(x), often called the standard error, is the square root of var(x). Similarly the range x + 1.96 se(x) will include the population mean with 95 per cent confidence.
While the above discussion has concentrated mostly on sample means derived from simple random samples, the same approach m a y be used to establish confidence limits for m a n y other statistics derived from various types of sample designs. For example, confidence limits m a y be calculated for complex statistics such as correlation coefficients, regression coefficients, and multiple correlation coefficients (Ross, 1978).
С Comparison of the accuracy of probability samples
The accuracy of probability samples is usually considered by examining the variance associated with a particular sample estimate for a given sample size. This approach to the evaluation of sampling accuracy has generally been based on the recommendation put forward by Kish (1965) that the simple random sample design should be used as a standard for quantifying the accuracy of sample designs that incorporate such complexities as stratification and clustering. Kish introduced the term 'deff (design effect) to describe the ratio of the variance of the sample m e a n for a complex sample design (denoted c) to the variance of the sample mean for a simple random sample (denoted srs) of the same size.
That is, deff= var(xc)/var(xsrs)
For the kinds of complex sample designs that are commonly used in educational research, the values of deff for m a n y statistics are often m u c h greater than unity. Consequently, the accuracy of sample estimates m a y be grossly overestimated if formulae based on simple random sampling assumptions are used to calculate sampling errors. The potential for arriving at false conclusions by using incorrect sampling error calculations has been illustrated in a study carried out by Ross (1976).
13. Error estimation for complex probability samples
The computational formulae required to estimate the variance of descriptive statistics, such as sample means, are available for some probability sample designs which incorporate complexities such as stratification and cluster sampling. However, for m a n y commonly-employed statistics, the required formulae are not readily available for sample designs which depart markedly from the model of simple random sampling. These formulae are either enormously complicated or, ultimately, they prove resistant to mathematical analysis (Frankel, 1971).
38

Sample design procedures for a national survey of primary schools in Zimbabwe
In the absence of suitable formulae, a variety of empirical techniques have emerged in recent years which provide "approximate variances that appear satisfactory for practical purposes" (Kish, 1978 p. 20). The most frequently applied empirical techniques m a y be divided into two broad categories: Subsample Replication and Taylor's Series Approximation.
In Subsample Replication a total sample of data is used to construct two or more subsamples and then a distribution of parameter estimates is generated by using each subsample. The subsample results are analyzed to obtain an estimate of the parameter, as well as a confidence assessment for that estimate (Finifter, 1972, p. 114). The main approaches in using this technique have been Independent Replication (Deming, 1960), Jackknifing (Tukey, 1958), and Balanced Repeated Replication (McCarthy, 1966).
Alternatively, Taylor's Series Approximation m a y be used to provide a more 'direct' method of variance estimation than these three approaches. In the absence of an exact formula for the variance, the Taylor's Series is used to approximate a numerical value for the first few terms of a series expansion of the variance formula. A number of computer programs have been prepared in order to carry out the extensive numerical calculations required for this approach (Wolter, 1985, Appendix E ) .
Table 11. The design effects, sampling errors, and effective sample sizes for reading test items and the total reading test score
Statistics M e a n s Deff Sampling Error Effective Sample
Selection of test items Item a 63.8 2.90 1.60 899 Itemb 55.4 1.95 1.36 1338 Item с 33.1 2.97 1.59 878 Itemd 20.9 3.13 1.41 834 Iteme 70.1 1.79 1.20 1458
Average Item
Total reading score Score 59
48.7
26.8
2.54
6.33
1.43
0.48
1081
412
In this study it was decided to apply the Taylor's Series Approximation procedure by using the ' P C C A R P ' software developed by the Statistical Laboratory of Iowa State University (Fuller et al., 1986). This software permitted the sampling errors for a selection of test item percentages and the total score on the Reading Test to be calculated in association with a measure of the design effect for each statistic.

Sample design procedures for a national survey of primary schools in Zimbabwe
In Table 11 the values of the design effect (deff), sampling error, and the effective sample size have been presented for five test items and the total score on the Reading Test (based on 59 items). These figures permitted an evaluation to be m a d e of the sample design in terms of the sampling error limits that were specified during the design of the sample.
The five item means were expressed in terms of percentages which ranged from a low of 20.9 per cent to a high of 70.1 per cent. While the design effects for these items ranged from a low of 1.79 to a high of 2.90, the sampling errors for items were quite similar ~ reflecting the 'adjustment' arising from a functional relationship between the value of a percentage and its sampling error estimated from formulae based on simple random sampling assumptions.
The average sampling error for items was 1.43 per cent. That is, for the 'average item', 95 per cent confidence limits for the population value were within ± 2.86 per cent of the sample estimate. This value was well within the prior specification of ± 5 per cent that had been set d o w n for the design of the sample.
The key sample m e a n for the study was 'Score 59' — the m e a n score on the 59 item reading test. The design effect for this statistic was 6.33 and the sampling error was 0.48 test score points. That is, 95 per cent confidence limits for the population m e a n represented a range of ± 0.96 test score points. The pupil standard deviation score for the test was 9.76 test score points. Therefore, the 95 per cent confidence limits for the population m e a n were around ± 9.8 per cent of the pupil standard deviation. This value was just within the prior specification of ± 10 per cent (or ± 0.Is) that had been set d o w n for the design of the sample.
In the final column of Table 11, the values of the effective sample size for each statistic have been listed. These figures also showed that the final sample had satisfied the prior error specifications because they all exceeded 400 - which was the value specified as the m i n i m u m during the design of the sample.
14. Conclusion
This report has described the sample design procedures employed during 1991 for a national survey of primary schools in Zimbabwe. The techniques described in the report should provide useful models for similar large-scale educational research surveys conducted in other countries. A complete account of the survey has been prepared by Ross and Postlethwaite (1991). The main stages required to prepare the sample design (Design Constraints, Specification of Target Populations, Stratification, Use of Sample Design Tables, Construction of Sampling Frames, School and Pupil Selection, Calculation of Sampling Weights and Sampling Errors) were presented in association with specific examples drawn from the survey. The sample design addressed all administrative constraints set d o w n prior to the survey, and the calculation of sampling errors for percentages and means demonstrated that the sample design had also satisfied the prior sampling error specifications.
40

References
Brickell, J. L . (1974). Nominated samples from public schools and statistical bias. American Educational Research Journal, 11(4), 333-341.
Deming, W . E . (1960). Sample design in business research. N e w York: Wiley.
Finifter, В . М . (1972). The generation of confidence: Evaluating research findings by random subsample replication. In H . L . Costner (Ed.), Sociological Methodology. San Francisco: Jossey-Bass.
Frankel, M . R . (1971). Inference from survey samples. A n n Arbor, Michigan: Institute for Social Research.
Fuller, W . , Kennedy, W . , Schnell, D . , Sullivan, G . , & Park, H . J. (1986). PC CARP Software Manual. Ames , Iowa: Statistical Laboratory, Iowa State University.
Hansen, M . H . ; Hurwitz, W . N . ; M a d o w , W . G . (1953). Sample survey methods and theory. N e w York: John Wiley and Sons.
Kish, L . (1965). Survey sampling. N e w York: Wiley.
Kish, L . (1978) O n the future of survey sampling. In N . K . Namboord; (Ed), Survey sampling and measurement. N e w York: Academic Press.
McCarthy, P . J. (1966). Replication: An approach to the analysis of data from complex surveys. Washington: United States National Center for Health Statistics.
Ross, K . N . (1976). Searching for uncertainty: sampling errors in educational survey research. Hawthorn, Victoria: Australian Council for Educational Research.
Ross, K . N . (1978). Sample Design for Educational Survey Research. Evaluation in education, 2,105-195.
Ross, K . N . (1985a). Sampling. In T . Husen & T . N . Postlethwaite (Eds.), The International Encyclopedia of Education (pp. 4370-4381). N e w York: Pergamon.
Ross, K . N . (1985b). Sampling Errors. In T . Husen & T . N . Postlethwaite (Eds.), The International Encyclopedia of Education (pp. 4370-4381). N e w York: Pergamon.
Ross, K . N . (1987). Sample design. International Journal of Educational Research, 11(1), 57-75.
41

Sample design procedures for a natinal survey of primary schools in Zimbabwe
Ross, K . N . ; Mählck, L . (1990). Planning the quality of education. Paris: International Institute for Educational Planning ( U N E S C O ) .
Ross, K . N . (1991). Sampling manual for the IEA international study of reading literacy. Hamburg: International Association for the Evaluation of Educational Achievement.
Ross, K . N . ; Postlethwaite. T . N . (1991). Indicators of the quality of education: a national study of primary schools in Zimbabwe, Volumes 1 to 3. Harare: Ministry of Education and Culture.
Ross, K . N . ; Postlethwaite, T . N . (1992). Indicators of the quality of education: a summary of a national study of primary schools in Zimbabwe. Paris: International Institute for Educational Planning ( U N E S C O ) .
Tukey, J. W . (1958). Bias and confidence in not-quite large samples (Abstract). Annals of mathematical statistics, 29, 614.
Wolter, K . M . (1985). Introduction to variance estimation. N e w York: Springer-Verlag.
42

П Е Р publications and documents
More than 650 titles on all aspects of educational planning have been published by the International Institute for Educational Planning. A comprehensive catalogue, giving details of their availability, includes research reports, case studies, seminar documents, training materials, occasional papers and reference books in the following subject categories:
Economics of education, costs and financing.
Manpower and employment.
Demographic studies.
The location of schools (school map) and sub-national planning.
Administration and management.
Curriculum development and evaluation.
Educational technology.
Primary, secondary and higher education.
Vocational and technical education.
Non-formal, out-of-school, adult and rural education.
Copies of the catalogue m a y be obtained from the П Е Р Publications Unit on request.

T h e International Institute for Educational Planning
The International Institute for Educational Planning (HEP) is an international centre for advanced training and research in the field of educational planning. It was established by U N E S C O in 1963 and is financed by U N E S C O and by voluntary contributions from M e m b e r States. In recent years the following M e m b e r States have provided voluntary contributions to the Institute: Belgium, Canada, Denmark, Finland, Iceland, India, Ireland, Norway, Sweden, Switzerland and Venezuela.
The Institute's aim is to contribute to the development of education throughout the world, by expanding both knowledge and the supply of competent professionals in the field of educational planning. In this endeavour the Institute co-operates with interested training and research organizations in M e m b e r States. The Governing Board of the H E P , which approves the Institute's programme and budget, consists of eight elected members and four members designated by the United Nations Organization and certain of its specialized agencies and institutes.
Chairman: Victor L. Urquidi, (Mexico) Research Professor Emeritus, El Colegio de México, Mexico.
Designated Members: Alfredo H. Costa Filho, Director-General, Latin American and Caribbean Institute for
Economic and Social Planning, Santiago. Goran Ohlin, Assistant Secretary-General, Office for Development, Research and Policy
Analysis, Department of International Economic and Social Affairs, United Nations. Visvanathan Rajagopalan, Vice President, Sector Policy and Research, Policy, Planning and
Research, The World Bank. Allan F. Salt, Director, Training Department, International Labour Office.
Elected Members: Isao Amagi, (Japan), Special Advisor to the Minister of Education, Science and Culture,
Ministry of Education, Science and Culture, Tokyo. Henri Bar'toll, (France), Professor, University of Paris I, Panthéon-Sorbonne. Paris. Mohamed Dowidar, (Egypt), Professor and President of the Department of Economics, L a w
Faculty, University of Alexandria. Kabiru Kinyanjui, (Kenya), Senior Programme Officer, Social Sciences Division,
International Development Research Centre, Nairobi. Yolanda M. Rojas (Costa Rica), Academic Vice-Rector, Faculty of Education, University of
Costa Rica, San José, Costa Rica. Lennart Wohlgemuth, (Sweden), Assistant Director-General, Swedish International
Development Authority, Stockholm.
Inquiries about the Institute should be addressed to: The Office of the Director, International Institute for Educational Planning, 7-9 rue Eugène-Delacroix, 75116 Paris

Issues and methodologies in educational development, N o . 8
This report describes the sample design procedures that were developed in 1991 for a national survey of primary schools in Zimbabwe. The survey was a collaborative project by the International Institute for Educational Planning and the Zimbabwe Ministry of Education and Culture.
The main aim of the study was to establish a mechanism whereby information that was suitable for 'informed decision making' could be collected rapidly from a scientific sample of schools and pupils in Zimbabwe and then analyzed and reported in a form that was suitable for immediate use. In this report the main stages required to prepare the sample design are presented in association with specific examples drawn from the survey.
The techniques described in the report should provide useful models for similar large-scale educational research surveys conducted in other countries.
T h e authors
Kenneth N . Ross (Australia) is a Reader in the Faculty of Science at Deakin University. H e is the author of numerous publications in the areas of survey research techniques and the use of social indicators to guide decisions concerning resource allocation within educational systems.