Deerfield Elementary School Deerfield Elementary Overview of Deerfield Renovation October 8, 2015.

Walgreens Pharmacy #13987 Providence, Rhode Island
• True NNN lease with ~20 years guaranteed rent
• Proven, performing location with established sales record of ~5 years
• Retail neighbors include TD Bank, Super Stop & Shop, Dunkin’ Donuts, Wendy’s, and Advance Auto Parts
• Just 6 miles north of downtown Providence
• True NNN lease with zero landlord responsibilities
• Walgreens corporate credit guarantees the rent
$7,764,000
5.40%CAP Rate
DeerfieldPartnersJohn GiordaniArtGriffith(415) [email protected]
7% Return on Cash available! with new non-recourse loans

Walgreens Pharmacy #13987 Pawtucket, Rhode Island
DeerfieldPartnersJohn GiordaniArt Griffith(415) [email protected]
This is a rare opportunity for an investor to acquire a longer term Walgreens drugstore with a proven track recordofestablishedsales.Fiveyearsago,thiswasarelocationofanexistingstore.Atthatsametime,anewTDBankwasdevelopedontheadjacentparcel.NeighboringretailersincludeSuperStop&Shop,AdvanceAutoParts,Dunkin’DonutsandWendy’s.Pawtucketisastable,bluecollartownwithtremendouspopulationdensity, located justminutesoutsideofProvidenceoffRoute1.Thisstore issurroundedbyrooftopsandboastsadensepopulationwithover28,000people livingwithinonemile.Amultitudeoftheatre, museums, concerts, festival events, fine restaurants and more make Pawtucket an excitingProvidencesuburb.
Investment Summary
1 Mile 3 Mile 5 Mile
Population 28,493 129,606 256,606Avg. HH Income $51,679 $61,613 $70,354
Price $7,764,000CAP Rate 5.40%
Annual Income $419,250Years Guaranteed ~20 years
Well Located Store Surrounded by Rooftops and Customers

Walgreens Pharmacy #13987 Pawtucket, Rhode Island
DeerfieldPartnersJohn GiordaniArt Griffith(415) [email protected]
Property Details and Lease SummaryAddress 385CottageSt.,Pawtucket,RhodeIsland02861
Year Built 2011Building Size 14,550SquareFeet
Lot Size 1.60acresTenant Walgreens (NASDAQ:WBA)
Rent Start Date September 1, 2011Lease End Date August 31, 2086
Options to Terminate Tenant may terminate as of 8/31/2036 with 12 months notice
Strong Retail Neighbors

Walgreens Pharmacy #13987 Pawtucket, Rhode Island
DeerfieldPartnersJohn GiordaniArt Griffith(415) [email protected]
AttractiveStorefrontwithFullParkingLot
Walgreens Pharmacy #13987 Pawtucket, Rhode Island
DeerfieldPartnersJohn GiordaniArt Griffith(415) [email protected]
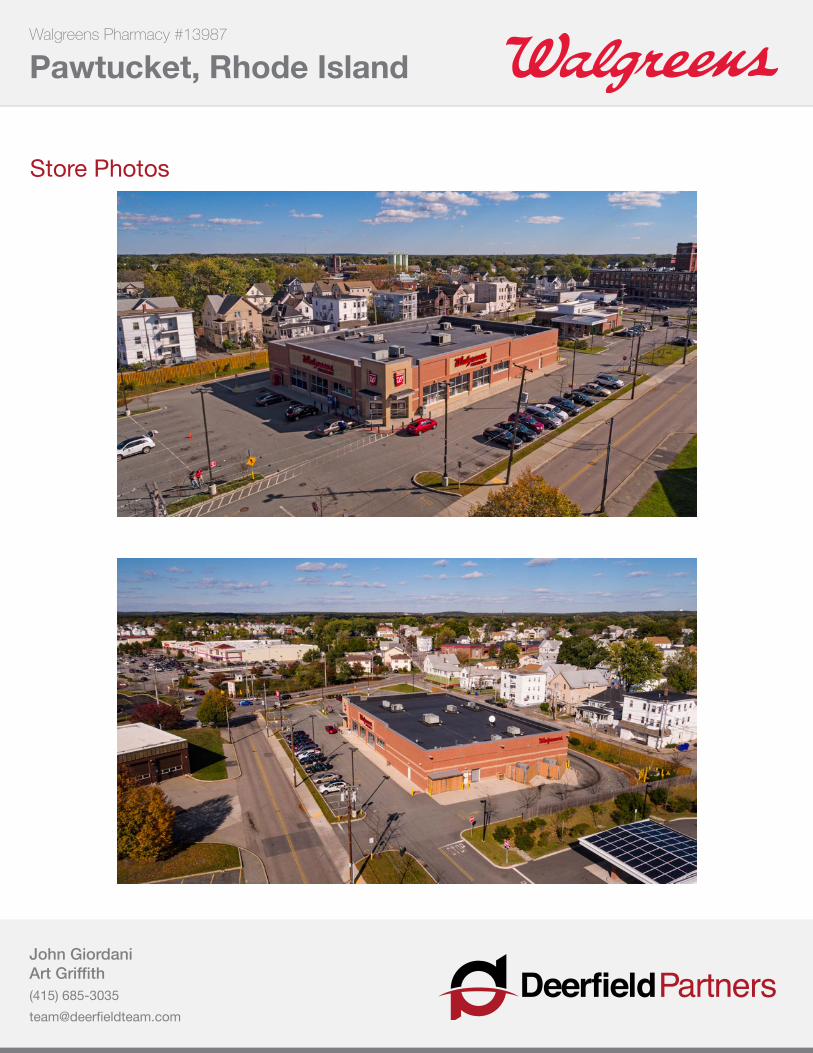
Store Photos

Walgreens Pharmacy #13987 Pawtucket, Rhode Island
DeerfieldPartnersJohn GiordaniArt Griffith(415) [email protected]
Store Photos

Walgreens Pharmacy #13987 Pawtucket, Rhode Island
DeerfieldPartnersJohn GiordaniArt Griffith(415) [email protected]
Vertical Aerial Showing Site
Walgreens Pharmacy #13987 Pawtucket, Rhode Island
DeerfieldPartnersJohn GiordaniArt Griffith(415) [email protected]
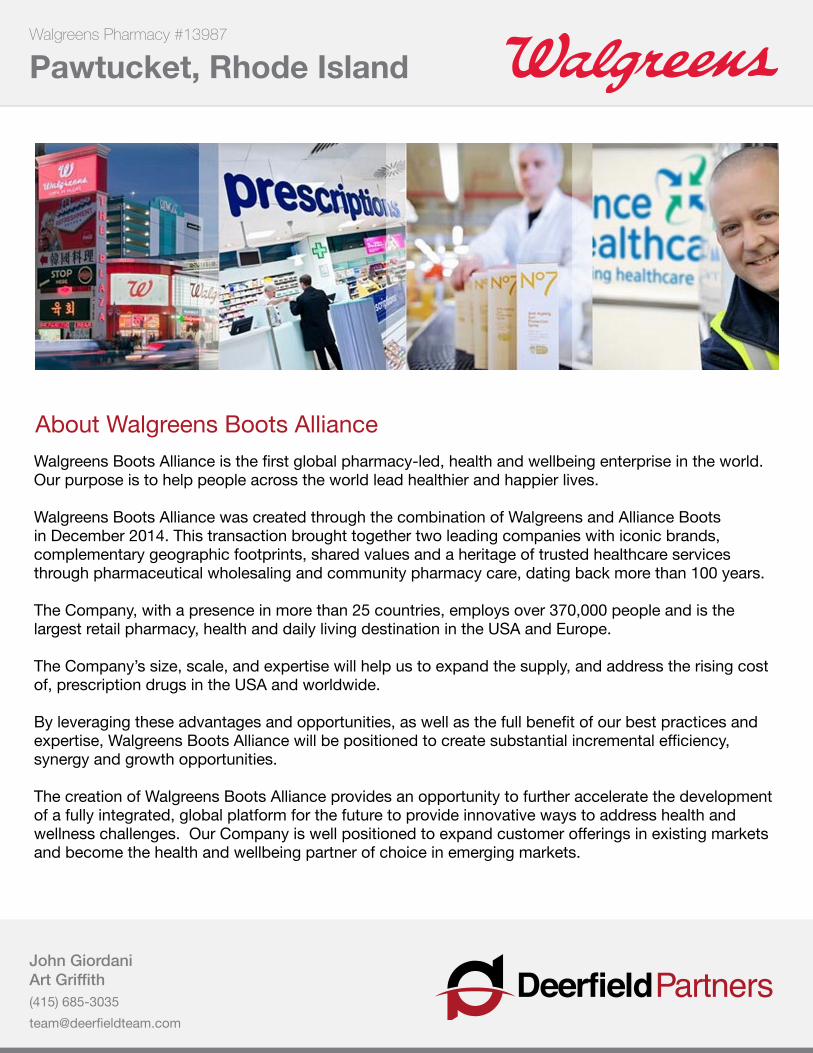
About Walgreens Boots AllianceWalgreensBootsAllianceisthefirstglobalpharmacy-led,healthandwellbeingenterpriseintheworld.Ourpurposeistohelppeopleacrosstheworldleadhealthierandhappierlives. Walgreens Boots Alliance was created through the combination of Walgreens and Alliance Boots inDecember2014.Thistransactionbroughttogethertwoleadingcompanieswithiconicbrands,complementary geographic footprints, shared values and a heritage of trusted healthcare services throughpharmaceuticalwholesalingandcommunitypharmacycare,datingbackmorethan100years.
The Company, with a presence in more than 25 countries, employs over 370,000 people and is the largestretailpharmacy,healthanddailylivingdestinationintheUSAandEurope.
TheCompany’ssize,scale,andexpertisewillhelpustoexpandthesupply,andaddresstherisingcostof,prescriptiondrugsintheUSAandworldwide.
Byleveragingtheseadvantagesandopportunities,aswellasthefullbenefitofourbestpracticesandexpertise,WalgreensBootsAlliancewillbepositionedtocreatesubstantialincrementalefficiency,synergyandgrowthopportunities.
The creation of Walgreens Boots Alliance provides an opportunity to further accelerate the development of a fully integrated, global platform for the future to provide innovative ways to address health and wellnesschallenges.OurCompanyiswellpositionedtoexpandcustomerofferingsinexistingmarketsandbecomethehealthandwellbeingpartnerofchoiceinemergingmarkets.

Walgreens Pharmacy #13987 Pawtucket, Rhode Island
DeerfieldPartnersJohn GiordaniArt Griffith(415) [email protected]
Walgreens Boots Alliance -- Segment Structure
8
Walgreens Boots Alliance – Segment Structure
The largest retail pharmacy chain in Europe
A leading global pharmaceutical wholesaler
and distributor
A leading drugstore chain in the USA
The first global pharmacy-led, health and wellbeing enterprise in the world

Walgreens Pharmacy #13987 Pawtucket, Rhode Island
DeerfieldPartnersJohn GiordaniArt Griffith(415) [email protected]
Walgreens Boots Alliance -- Retail Pharmacy USA DivisionTheRetailPharmacyUSADivision’sprincipalretailpharmacybrandsareWalgreensandDuaneReade.Together,theyformthelargestdrugstorechainintheUSA.
This Division operates 8,240 drugstores in 50 states, the District of Columbia, Puerto Rico and the US VirginIslands.AsofAugust2014,approximately76%ofthepopulationoftheUSAliveswithinfivemilesofaWalgreens.
The company sells prescription and non-prescription drugs, as well as general merchandise, including householditems,convenienceandfreshfoods,personalcare,beautycare,photofinishingandcandy.They provide customers with convenient, omni-channel access to consumer goods and services, pharmacy,andhealthandwellnessservicesincommunitiesacrossAmerica.
Thecompany’swebsites,whichincludeWalgreens.comanddrugstore.com,receiveanaverageofapproximately60millionvisitspermonth.Integratedwithane-commerceplatform,theWalgreensmobileapplicationallowscustomerstorefillprescriptionsthroughscantechnology,receivetextmessagesalertingwhenarefillisdueandotherfront-endfunctionality,suchasphotoandshoppingfeatures.
Prescriptiondrugsaccountfor64percentofsales,whileretailproductsare36percent.Overall,WBAfilledapproximately699millionprescriptionsin2014.
3Q15FinancialPerformance–RetailPharmacyUSA
9
GAAP $ million
3Q15 Financial Performance – Retail Pharmacy USA
Non-GAAP* $ million
* Non-GAAP financial measures – See attached Appendix.
Total Sales $20,425 Gross Profit $5,527 SG&A $4,494 Operating Income $1,033
Operating Margin 5.1%
Adjusted Gross Profit $5,596
Adjusted SG&A $4,268
Adjusted Operating Income $1,328
Adjusted Operating Margin 6.5%

Walgreens Pharmacy #13987 Pawtucket, Rhode Island
DeerfieldPartnersJohn GiordaniArt Griffith(415) [email protected]
Item 1B. Unresolved Staff Comments
There are no unresolved written comments that were received from the SEC Staff 180 days or more before theend of our fiscal year relating to our periodic or current reports under the Securities Exchange Act of 1934.
Item 2. Properties
The Company’s locations, including drugstores, infusion and respiratory service facilities, specialty pharmaciesand mail service facilities at August 31, 2014 and 2013 are listed below.
2014 2013 2014 2013 2014 2013
Alabama 115 113 Louisiana 154 152 Oklahoma 117 121Alaska 8 7 Maine 15 15 Oregon 77 80Arizona 250 258 Maryland 89 80 Pennsylvania 131 138Arkansas 83 78 Massachusetts 168 185 Rhode Island 26 29California 646 663 Michigan 232 232 South Carolina 110 119Colorado 160 172 Minnesota 154 164 South Dakota 14 14Connecticut 95 125 Mississippi 78 79 Tennessee 254 271Delaware 65 66 Missouri 219 221 Texas 712 729District of Columbia 6 5 Montana 14 14 Utah 48 45Florida 861 881 Nebraska 60 62 Vermont 3 4Georgia 204 208 Nevada 84 92 Virginia 141 149Hawaii 19 17 New Hampshire 32 36 Washington 139 140Idaho 40 42 New Jersey 191 215 West Virginia 17 23Illinois 610 620 New Mexico 69 68 Wisconsin 228 234Indiana 201 218 New York 486 527 Wyoming 11 11Iowa 70 72 North Carolina 263 221 Guam 0 1Kansas 70 72 North Dakota 1 1 Puerto Rico 120 118Kentucky 98 103 Ohio 250 272 U.S. Virgin Islands 1 0
TOTAL 8,309 8,582
The Company owned approximately 20% of its retail drugstore locations and leased the remaining locations atAugust 31, 2014. The leases are for various terms and periods. See Note 3 to the Company’s ConsolidatedFinancial Statements in Part II, Item 8 of this Form 10-K. Net retail selling space remained consistent at89 million square feet at August 31, 2014 and 2013. Approximately 20% of Company stores have been opened orremodeled during the past five years, including our “Well Experience” store format in over 700 locations,including a market-wide transformation in the Indianapolis area and new flagship stores in select marketsincluding Boston, Chicago, Los Angeles, New York City, San Francisco, Washington, D.C., Las Vegas andPuerto Rico.
As of August 31, 2014:
• The Company’s retail store operations were supported by 19 major distribution centers with a total ofapproximately 11 million square feet of space, of which 13 locations are owned. The remaining spaceis leased. All distribution centers are served by modern systems for order processing control and rapidmerchandise delivery to stores. In addition, the Company uses public warehouses and third partywholesalers to handle certain distribution needs. As of August 31, 2014, AmerisourceBergendistributed substantially all of the Company’s branded and generic pharmaceutical products.
• The Company operated 34 principal office facilities containing approximately three million square feet,of which 13 locations were owned. The Company operated two mail service facilities containingapproximately 237 thousand square feet, one of which was owned.
• The Company owned 16 strip shopping malls containing approximately 500 thousand square feet.
31
Walgreens Properties Nationwide

Walgreens Pharmacy #13987 Pawtucket, Rhode Island
DeerfieldPartnersJohn GiordaniArt Griffith(415) [email protected]
Income Statements Trailing 5 Years

Walgreens Pharmacy #13987 Pawtucket, Rhode Island
DeerfieldPartnersJohn GiordaniArt Griffith(415) [email protected]
Demographics - 1 Mile Radius
Demographic and Income Profile385 Cottage St, Pawtucket, Rhode Island, 02861 Prepared by EsriRing: 1 mile radius Latitude: 41.88664
Longitude: -71.36699
AreaStateUSA
Trends 2016-2021Trends 2016-2021
Ann
ual R
ate
(in
perc
ent)
21.81.61.41.2
10.80.60.40.2
0Population Households Families Owner HHs Median HH Income
20162021
Population by AgePopulation by Age
Perc
ent
14
12
10
8
6
4
2
00-4 5-9 10-14 15-19 20-24 25-34 35-44 45-54 55-64 65-74 75-84 85+
2016 Household Income 2016 Household Income
<$15K17.8%
$15K - $24K12.0%
$25K - $34K13.0%
$35K - $49K16.0%
$50K - $74K19.6%
$75K - $99K10.6%
$100K - $149K8.3%
$150K - $199K1.8%
$200K+0.9%
2016 Population by Race2016 Population by Race
Perc
ent
65605550454035302520151050
White Black Am. Ind. Asian Pacific Other Two+
2016 Percent Hispanic Origin: 27.0%
Source: U.S. Census Bureau, Census 2010 Summary File 1. Esri forecasts for 2016 and 2021.
October 25, 2016
©2016 Esri Page 2 of 6

Walgreens Pharmacy #13987 Pawtucket, Rhode Island
DeerfieldPartnersJohn GiordaniArt Griffith(415) [email protected]
Demographics - 1 Mile Radius
Demographic and Income Profile385 Cottage St, Pawtucket, Rhode Island, 02861 Prepared by EsriRing: 1 mile radius Latitude: 41.88664
Longitude: -71.36699
Summary Census 2010 2016 2021Population 27,857 28,493 29,169Households 11,405 11,617 11,873Families 6,841 6,972 7,129Average Household Size 2.42 2.44 2.44Owner Occupied Housing Units 4,743 4,561 4,650Renter Occupied Housing Units 6,662 7,056 7,224Median Age 36.3 36.8 37.3
Trends: 2016 - 2021 Annual Rate Area State NationalPopulation 0.47% 0.23% 0.84%Households 0.44% 0.28% 0.79%Families 0.45% 0.30% 0.72%Owner HHs 0.39% 0.30% 0.73%Median Household Income 0.05% 2.14% 1.89%
2016 2021 Households by Income Number Percent Number Percent
<$15,000 2,068 17.8% 2,204 18.6%$15,000 - $24,999 1,392 12.0% 1,345 11.3%$25,000 - $34,999 1,508 13.0% 1,853 15.6%$35,000 - $49,999 1,860 16.0% 1,204 10.1%$50,000 - $74,999 2,277 19.6% 2,204 18.6%$75,000 - $99,999 1,231 10.6% 1,506 12.7%$100,000 - $149,999 970 8.3% 1,186 10.0%$150,000 - $199,999 213 1.8% 263 2.2%$200,000+ 99 0.9% 108 0.9%
Median Household Income $40,542 $40,638Average Household Income $51,679 $55,214Per Capita Income $21,259 $22,658
Census 2010 2016 2021 Population by Age Number Percent Number Percent Number Percent
0 - 4 1,984 7.1% 1,905 6.7% 1,915 6.6%5 - 9 1,683 6.0% 1,802 6.3% 1,782 6.1%10 - 14 1,663 6.0% 1,687 5.9% 1,790 6.1%15 - 19 1,898 6.8% 1,691 5.9% 1,674 5.7%20 - 24 2,092 7.5% 2,099 7.4% 1,876 6.4%25 - 34 4,124 14.8% 4,391 15.4% 4,643 15.9%35 - 44 3,998 14.4% 3,760 13.2% 3,884 13.3%45 - 54 4,174 15.0% 3,978 14.0% 3,703 12.7%55 - 64 2,944 10.6% 3,510 12.3% 3,710 12.7%65 - 74 1,617 5.8% 2,017 7.1% 2,470 8.5%75 - 84 1,190 4.3% 1,128 4.0% 1,235 4.2%
85+ 489 1.8% 523 1.8% 488 1.7%Census 2010 2016 2021
Race and Ethnicity Number Percent Number Percent Number PercentWhite Alone 20,033 71.9% 19,086 67.0% 18,404 63.1%Black Alone 2,984 10.7% 3,460 12.1% 3,875 13.3%American Indian Alone 147 0.5% 164 0.6% 180 0.6%Asian Alone 362 1.3% 462 1.6% 545 1.9%Pacific Islander Alone 32 0.1% 36 0.1% 39 0.1%Some Other Race Alone 2,805 10.1% 3,537 12.4% 4,187 14.4%Two or More Races 1,495 5.4% 1,748 6.1% 1,940 6.7%
Hispanic Origin (Any Race) 5,847 21.0% 7,704 27.0% 9,446 32.4%Data Note: Income is expressed in current dollars.
Source: U.S. Census Bureau, Census 2010 Summary File 1. Esri forecasts for 2016 and 2021.
October 25, 2016
©2016 Esri Page 1 of 6

Walgreens Pharmacy #13987 Pawtucket, Rhode Island
DeerfieldPartnersJohn GiordaniArt Griffith(415) [email protected]
Demographics - 3 Mile Radius
Demographic and Income Profile385 Cottage St, Pawtucket, Rhode Island, 02861 Prepared by EsriRing: 3 mile radius Latitude: 41.88664
Longitude: -71.36699
AreaStateUSA
Trends 2016-2021Trends 2016-2021
Ann
ual R
ate
(in
perc
ent)
21.81.61.41.2
10.80.60.40.2
0Population Households Families Owner HHs Median HH Income
20162021
Population by AgePopulation by Age
Perc
ent
14
12
10
8
6
4
2
00-4 5-9 10-14 15-19 20-24 25-34 35-44 45-54 55-64 65-74 75-84 85+
2016 Household Income 2016 Household Income
<$15K16.6%
$15K - $24K11.5%$25K - $34K
11.5%
$35K - $49K14.4%
$50K - $74K17.6%
$75K - $99K11.8%
$100K - $149K10.7%
$150K - $199K3.3%
$200K+2.7%
2016 Population by Race2016 Population by Race
Perc
ent
65605550454035302520151050
White Black Am. Ind. Asian Pacific Other Two+
2016 Percent Hispanic Origin: 26.1%
Source: U.S. Census Bureau, Census 2010 Summary File 1. Esri forecasts for 2016 and 2021.
October 25, 2016
©2016 Esri Page 4 of 6

Walgreens Pharmacy #13987 Pawtucket, Rhode Island
DeerfieldPartnersJohn GiordaniArt Griffith(415) [email protected]
Demographics - 3 Mile Radius
Demographic and Income Profile385 Cottage St, Pawtucket, Rhode Island, 02861 Prepared by EsriRing: 3 mile radius Latitude: 41.88664
Longitude: -71.36699
Summary Census 2010 2016 2021Population 128,489 129,606 131,682Households 50,762 51,119 51,896Families 32,293 32,539 33,045Average Household Size 2.51 2.51 2.51Owner Occupied Housing Units 25,285 24,530 24,902Renter Occupied Housing Units 25,477 26,589 26,994Median Age 37.0 37.8 38.4
Trends: 2016 - 2021 Annual Rate Area State NationalPopulation 0.32% 0.23% 0.84%Households 0.30% 0.28% 0.79%Families 0.31% 0.30% 0.72%Owner HHs 0.30% 0.30% 0.73%Median Household Income 1.25% 2.14% 1.89%
2016 2021 Households by Income Number Percent Number Percent
<$15,000 8,462 16.6% 8,748 16.9%$15,000 - $24,999 5,886 11.5% 5,657 10.9%$25,000 - $34,999 5,883 11.5% 7,308 14.1%$35,000 - $49,999 7,342 14.4% 4,806 9.3%$50,000 - $74,999 9,008 17.6% 8,309 16.0%$75,000 - $99,999 6,016 11.8% 6,835 13.2%$100,000 - $149,999 5,475 10.7% 6,605 12.7%$150,000 - $199,999 1,675 3.3% 2,060 4.0%$200,000+ 1,372 2.7% 1,569 3.0%
Median Household Income $44,889 $47,765Average Household Income $61,613 $66,627Per Capita Income $24,438 $26,393
Census 2010 2016 2021 Population by Age Number Percent Number Percent Number Percent
0 - 4 8,803 6.9% 8,316 6.4% 8,339 6.3%5 - 9 8,239 6.4% 8,122 6.3% 7,819 5.9%10 - 14 8,057 6.3% 8,003 6.2% 8,000 6.1%15 - 19 8,632 6.7% 7,896 6.1% 7,631 5.8%20 - 24 8,810 6.9% 8,956 6.9% 8,095 6.1%25 - 34 18,219 14.2% 18,831 14.5% 19,848 15.1%35 - 44 18,259 14.2% 16,989 13.1% 17,539 13.3%45 - 54 19,079 14.8% 18,032 13.9% 16,713 12.7%55 - 64 13,950 10.9% 16,103 12.4% 16,994 12.9%65 - 74 8,024 6.2% 9,959 7.7% 11,852 9.0%75 - 84 5,752 4.5% 5,525 4.3% 6,084 4.6%
85+ 2,666 2.1% 2,874 2.2% 2,770 2.1%Census 2010 2016 2021
Race and Ethnicity Number Percent Number Percent Number PercentWhite Alone 91,883 71.5% 87,901 67.8% 85,437 64.9%Black Alone 12,406 9.7% 13,823 10.7% 15,161 11.5%American Indian Alone 754 0.6% 854 0.7% 961 0.7%Asian Alone 2,091 1.6% 2,646 2.0% 3,138 2.4%Pacific Islander Alone 82 0.1% 90 0.1% 95 0.1%Some Other Race Alone 14,808 11.5% 17,017 13.1% 18,974 14.4%Two or More Races 6,466 5.0% 7,275 5.6% 7,915 6.0%
Hispanic Origin (Any Race) 27,707 21.6% 33,878 26.1% 39,687 30.1%Data Note: Income is expressed in current dollars.
Source: U.S. Census Bureau, Census 2010 Summary File 1. Esri forecasts for 2016 and 2021.
October 25, 2016
©2016 Esri Page 3 of 6

Walgreens Pharmacy #13987 Pawtucket, Rhode Island
DeerfieldPartnersJohn GiordaniArt Griffith(415) [email protected]
Demographics - 5 Mile Radius
Demographic and Income Profile385 Cottage St, Pawtucket, Rhode Island, 02861 Prepared by EsriRing: 5 mile radius Latitude: 41.88664
Longitude: -71.36699
AreaStateUSA
Trends 2016-2021Trends 2016-2021
Ann
ual R
ate
(in
perc
ent)
21.81.61.41.2
10.80.60.40.2
0Population Households Families Owner HHs Median HH Income
20162021
Population by AgePopulation by Age
Perc
ent
14
12
10
8
6
4
2
00-4 5-9 10-14 15-19 20-24 25-34 35-44 45-54 55-64 65-74 75-84 85+
2016 Household Income 2016 Household Income
<$15K16.1%
$15K - $24K10.6%$25K - $34K
10.6%
$35K - $49K13.1%
$50K - $74K16.7%
$75K - $99K11.8%
$100K - $149K11.8%
$150K - $199K4.7%
$200K+4.5%
2016 Population by Race2016 Population by Race
Perc
ent
65605550454035302520151050
White Black Am. Ind. Asian Pacific Other Two+
2016 Percent Hispanic Origin: 20.4%
Source: U.S. Census Bureau, Census 2010 Summary File 1. Esri forecasts for 2016 and 2021.
October 25, 2016
©2016 Esri Page 6 of 6

Walgreens Pharmacy #13987 Pawtucket, Rhode Island
DeerfieldPartnersJohn GiordaniArt Griffith(415) [email protected]
Demographics - 5 Mile Radius
Demographic and Income Profile385 Cottage St, Pawtucket, Rhode Island, 02861 Prepared by EsriRing: 5 mile radius Latitude: 41.88664
Longitude: -71.36699
Summary Census 2010 2016 2021Population 252,767 256,606 261,892Households 99,176 100,621 102,712Families 59,444 60,463 61,769Average Household Size 2.43 2.44 2.44Owner Occupied Housing Units 51,091 50,097 51,204Renter Occupied Housing Units 48,085 50,524 51,508Median Age 35.6 36.5 37.3
Trends: 2016 - 2021 Annual Rate Area State NationalPopulation 0.41% 0.23% 0.84%Households 0.41% 0.28% 0.79%Families 0.43% 0.30% 0.72%Owner HHs 0.44% 0.30% 0.73%Median Household Income 1.39% 2.14% 1.89%
2016 2021 Households by Income Number Percent Number Percent
<$15,000 16,181 16.1% 16,633 16.2%$15,000 - $24,999 10,652 10.6% 10,171 9.9%$25,000 - $34,999 10,706 10.6% 13,558 13.2%$35,000 - $49,999 13,163 13.1% 8,511 8.3%$50,000 - $74,999 16,836 16.7% 15,394 15.0%$75,000 - $99,999 11,908 11.8% 13,378 13.0%$100,000 - $149,999 11,901 11.8% 14,249 13.9%$150,000 - $199,999 4,766 4.7% 5,799 5.6%$200,000+ 4,507 4.5% 5,020 4.9%
Median Household Income $49,407 $52,925Average Household Income $70,354 $76,124Per Capita Income $28,192 $30,458
Census 2010 2016 2021 Population by Age Number Percent Number Percent Number Percent
0 - 4 15,388 6.1% 14,667 5.7% 14,788 5.6%5 - 9 14,557 5.8% 14,534 5.7% 14,124 5.4%10 - 14 14,605 5.8% 14,492 5.6% 14,559 5.6%15 - 19 19,866 7.9% 18,721 7.3% 18,251 7.0%20 - 24 24,273 9.6% 24,103 9.4% 22,509 8.6%25 - 34 35,644 14.1% 36,962 14.4% 38,949 14.9%35 - 44 33,469 13.2% 31,761 12.4% 33,072 12.6%45 - 54 35,251 13.9% 33,557 13.1% 31,201 11.9%55 - 64 27,019 10.7% 30,811 12.0% 32,178 12.3%65 - 74 15,769 6.2% 19,875 7.7% 23,720 9.1%75 - 84 11,312 4.5% 11,041 4.3% 12,456 4.8%
85+ 5,614 2.2% 6,083 2.4% 6,087 2.3%Census 2010 2016 2021
Race and Ethnicity Number Percent Number Percent Number PercentWhite Alone 186,157 73.6% 179,220 69.8% 174,670 66.7%Black Alone 22,782 9.0% 25,634 10.0% 28,429 10.9%American Indian Alone 1,501 0.6% 1,687 0.7% 1,883 0.7%Asian Alone 8,223 3.3% 10,282 4.0% 12,146 4.6%Pacific Islander Alone 149 0.1% 166 0.1% 176 0.1%Some Other Race Alone 22,340 8.8% 26,283 10.2% 29,826 11.4%Two or More Races 11,614 4.6% 13,334 5.2% 14,763 5.6%
Hispanic Origin (Any Race) 42,193 16.7% 52,283 20.4% 62,017 23.7%Data Note: Income is expressed in current dollars.
Source: U.S. Census Bureau, Census 2010 Summary File 1. Esri forecasts for 2016 and 2021.
October 25, 2016
©2016 Esri Page 5 of 6